 |
| |
| |
| |
| |
| |
| |
|

| TissGeneSummary for RNF152 |
 Gene summary Gene summary |
| Basic gene information | Gene symbol | RNF152 |
| Gene name | ring finger protein 152 | |
| Synonyms | - | |
| Cytomap | UCSC genome browser: 18q21.33 | |
| Type of gene | protein-coding | |
| RefGenes | NM_173557.2, | |
| Description | E3 ubiquitin-protein ligase RNF152 | |
| Modification date | 20141207 | |
| dbXrefs | HGNC : HGNC | |
| HPRD : 11514 | ||
| Protein | UniProt: go to UniProt's Cross Reference DB Table | |
| Expression | CleanEX: HS_RNF152 | |
| BioGPS: 220441 | ||
| Pathway | NCI Pathway Interaction Database: RNF152 | |
| KEGG: RNF152 | ||
| REACTOME: RNF152 | ||
| Pathway Commons: RNF152 | ||
| Context | iHOP: RNF152 | |
| ligand binding site mutation search in PubMed: RNF152 | ||
| UCL Cancer Institute: RNF152 | ||
| Assigned class in TissGDB* | C | |
| Included tissue-specific gene expression resources | HPA,TiGER | |
| Specific-tissues in normal samples (assigned by TissGDB using HPA, TiGER, and GTEx) | Kidney | |
| Cancer types related to the specific-tissues in cancer samples (assigned by TissGDB using TCGA) | KIRC,KIRP,KICH | |
| Reference showing the relevant tissue of RNF152 | ||
| Description by TissGene annotations | Protective TissGene in OS Have significant anti-correlated miRNA | |
| * Class A consists of genes with literature evidence and is part of the cTissGenes. Class B consists of only cTissGenes without additional evidence. The remaining genes belong to Class C. |
| Gene ontology having evidence of Inferred from Direct Assay (IDA) from Entrez |
| GO ID | GO term | PubMed ID | GO:0070936 | protein K48-linked ubiquitination | 21203937 | GO:0070936 | protein K48-linked ubiquitination | 21203937 |
| Top |
| TissGeneExp for RNF152 |
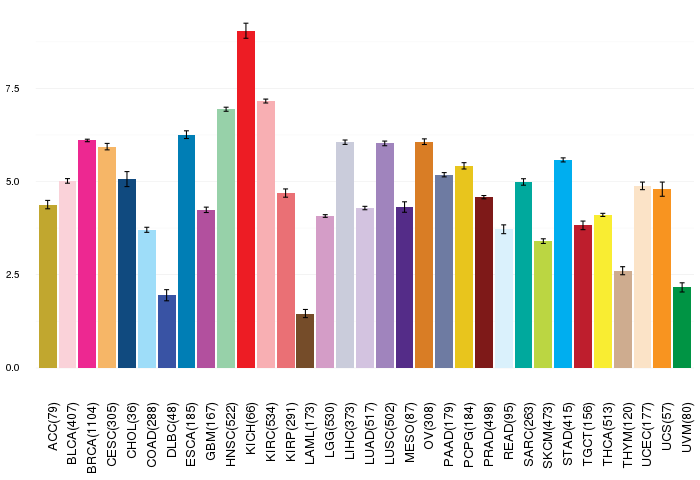
| Gene expressions across 28 cancer types (X-axis: cancer type and Y-axis: log2(norm_counts+1)) (TCGA IlluminaHiSeq_RNASeqV2, pan-cancer normalized log2(norm_counts+1) data, version 2016-08-16) |
 |
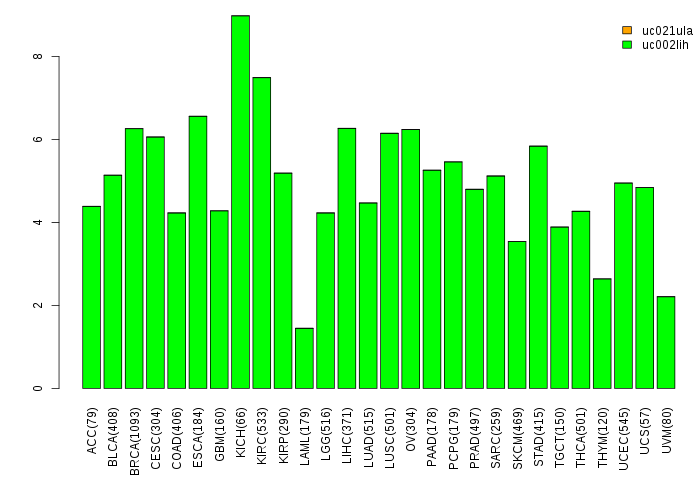
| Gene isoform expressions across 28 cancer types (X-axis: cancer type and Y-axis: log2(norm_counts+1)) (TCGA pan-cancer tcga_rsem_isoform_tpm, version 2016-09-01) |
 |
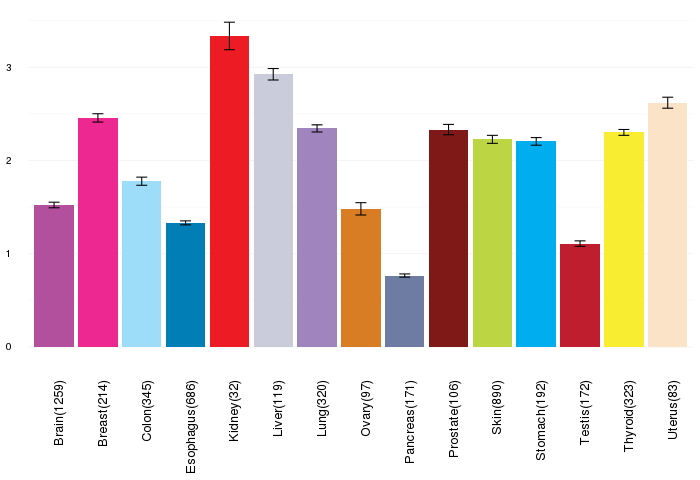
| Gene expressions across normal tissues of GTEx data (GTEx GTEx_Analysis_v6_RNA-seq_RNA-SeQCv1.1.8_gene_rpkm.gct) - Here, we shows the matched tissue types only among our 28 cancer types. |
 |
| Different expressions across 14 cancer types with more than 10 samples between matched tumors and normals (X-axis: cancer type and Y-axis: log2(norm_counts+1)) (TCGA IlluminaHiSeq_RNASeqV2, pan-cancer normalized log2(norm_counts+1) data, version 2016-08-16) |
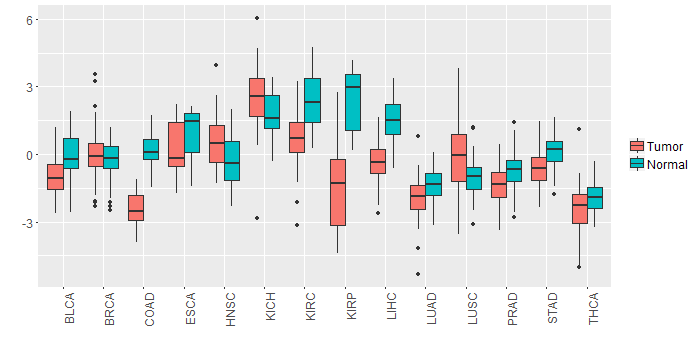 |
| - Significantly differentially expressed cancer types and information. (|Fold change|>1 and FDR<0.05) |
| Cancer type | Mean(exp) in tumor | Mean(exp) in matched normal | Log2FC | P-val. | FDR |
| LIHC | -0.327807115 | 1.575772885 | -1.90358 | 1.29E-16 | 5.62E-15 |
| KIRP | -1.38728074 | 2.475559885 | -3.862840625 | 1.07E-12 | 1.71E-11 |
| COAD | -2.448211269 | 0.140715654 | -2.588926923 | 1.63E-16 | 1.49E-14 |
| KIRC | 0.743418218 | 2.362025163 | -1.618606944 | 2.62E-14 | 1.26E-13 |
| Top |
| TissGene-miRNA for RNF152 |
| Significantly anti-correlated miRNAs of TissGene across 28 cancer types (Gene-miRNA relations from TargetScanHuman Relsease 7.1, Conserved_Site_Context_Scores.txt.zip, 06.01.2016) (TCGA IlluminaHiSeq_miRNASeq, log2(RPM+1) data, version 2016-11-21) (TCGA IlluminaHiSeq_RNASeqV2, log2(normalized_count+1) data, version 2016-08-16) (Spearman’s Rank Correlation (p-value<0.05 and coefficient<-0.25)) |
| Cancer type | miRNA id | miRNA accession | P-val. | Coeff. | # samples |
| UCS | hsa-miR-181a-5p | MIMAT0000256 | 0.049 | -0.27 | 56 |
| UCS | hsa-miR-181b-5p | MIMAT0000257 | 0.045 | -0.27 | 56 |
| UVM | hsa-miR-96-5p | MIMAT0000095 | 0.0082 | -0.31 | 80 |
| UCS | hsa-miR-137 | MIMAT0000429 | 0.031 | -0.33 | 56 |
| UCS | hsa-miR-218-5p | MIMAT0000275 | 0.014 | -0.33 | 56 |
| Top |
| TissGeneMut for RNF152 |
| TissGeneSNV for RNF152 |
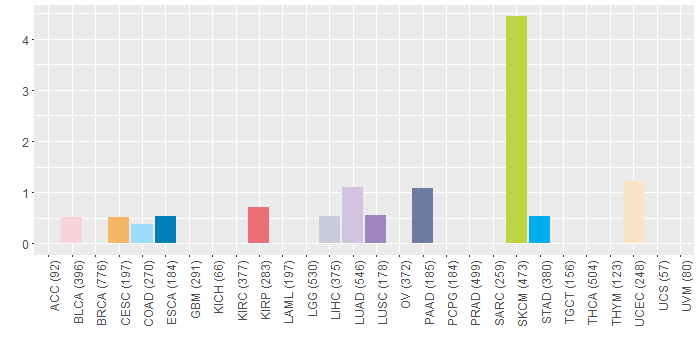
| nsSNV counts per each loci. Different colors of circles represent different cancer types. Circle size denotes number of samples. (TCGA somatic mutation (SNPs and small INDELs) data, version 2016-04-25) * Click on the image to enlarge it in a new window. |
 |
 |
| Somatic nucleotide variants of TissGene across 28 cancer types (X-axis: cancer type and Y-axis: % of mutated samples) The numbers in parentheses are numbers of samples with mutation (nsSNVs). (TCGA somatic mutation (SNPs and small INDELs) data, version 2016-04-25) |
 |
| - nsSNVs sorted by frequency. |
| AAchange | Cancer type | # samples |
| p.P95S | SKCM | 6 |
| p.E153K | SKCM | 2 |
| p.S194C | BLCA | 1 |
| p.S194Y | UCEC | 1 |
| p.G168E | SKCM | 1 |
| p.E149K | SKCM | 1 |
| p.K108M | LUAD | 1 |
| p.P70L | UCEC | 1 |
| p.Q6X | SKCM | 1 |
| p.S67L | UCEC | 1 |
| p.A80T | PAAD | 1 |
| p.Q155H | LUAD | 1 |
| p.R120H | ESCA | 1 |
| p.P21L | SKCM | 1 |
| p.P136S | SKCM | 1 |
| p.S125T | BLCA | 1 |
| p.R110G | KIRP | 1 |
| p.E2K | SKCM | 1 |
| p.E154K | SKCM | 1 |
| p.R158Q | LUAD | 1 |
| p.D116N | SKCM | 1 |
| p.I185V | CESC | 1 |
| p.G98W | LUAD | 1 |
| p.D48N | SKCM | 1 |
| p.G184S | SKCM | 1 |
| p.M117I | SKCM | 1 |
| p.S20N | SKCM | 1 |
| p.Q6* | SKCM | 1 |
| p.G144V | STAD | 1 |
| p.D72N | SKCM | 1 |
| p.A111V | COAD | 1 |
| p.E2D | LUAD | 1 |
| p.E109K | SKCM | 1 |
| p.S85F | SKCM | 1 |
| p.V133A | LIHC | 1 |
| p.G144S | LUAD | 1 |
| p.A80T | LIHC | 1 |
| p.R50W | STAD | 1 |
| p.P21S | SKCM | 1 |
| p.V178I | PAAD | 1 |
| p.Q40H | KIRP | 1 |
| p.S36L | LUSC | 1 |
| p.R50P | SKCM | 1 |
| Top |
| TissGeneCNV for RNF152 |
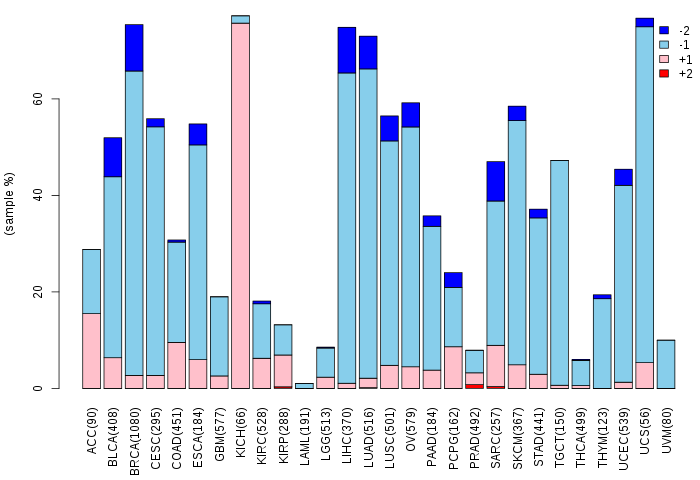
| Copy number variations of TissGene across 28 cancer types (X-axis: cancer type and Y-axis: % of CNV samples) (TCGA Gistic2_CopyNumber_Gistic2_all_data_by_genes, Gistic2 copy number data, version 2016-08-16) |
 |
| Top |
| TissGeneFusions for RNF152 |
| Fusion genes including TissGene (ChimerDB 3.0, 2016-12-01 and TCGA fusion Portal 2015-12-01) |
| Database | Src | Cancer type | Sample | Fusion gene | ORF | 5'-gene BP | 3'-gene BP |
| TCGAfusionPortal | PRADA | HNSC | TCGA-CV-6954-01A | RNF152-PIGN | 5UTR-CDS | Chr18:59560028 | Chr18:59774318 |
| Top |
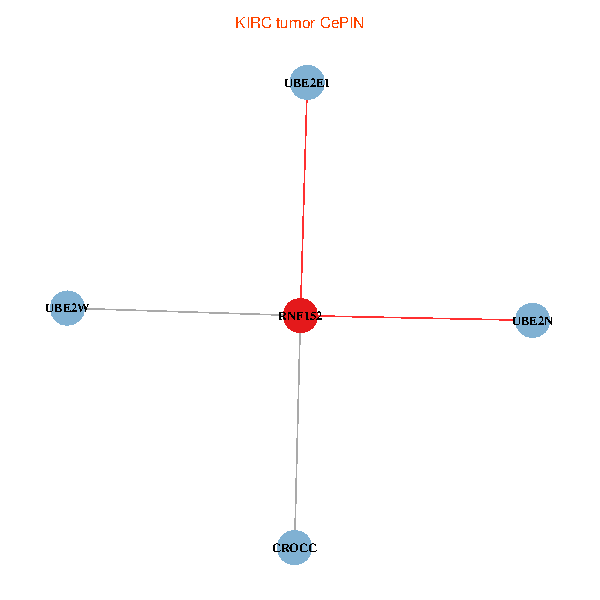
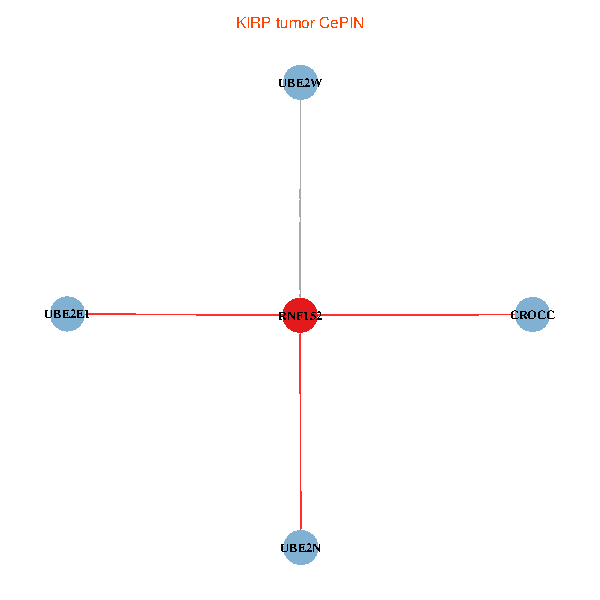
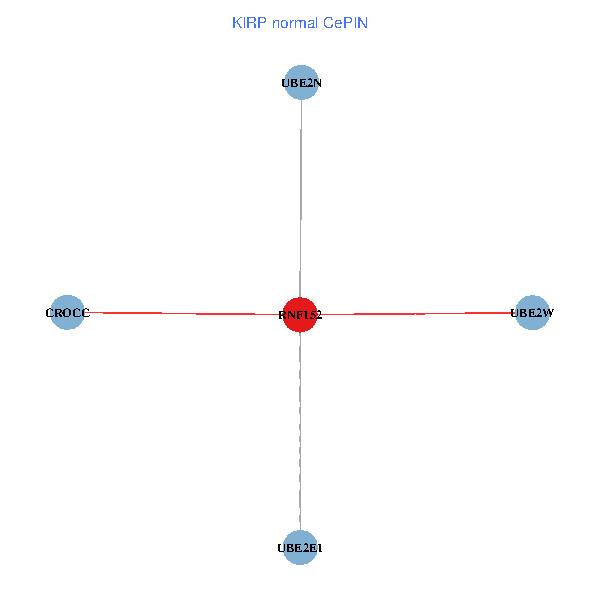
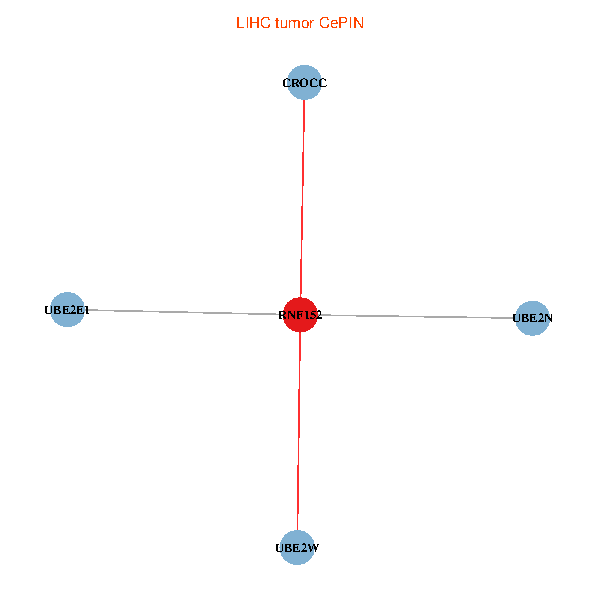
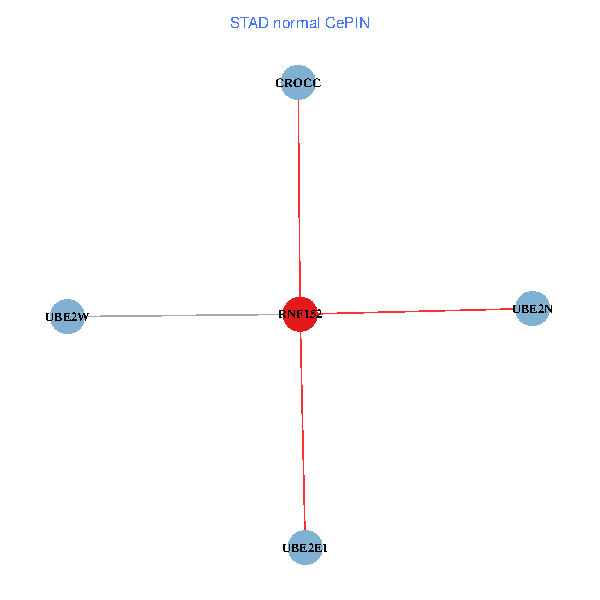
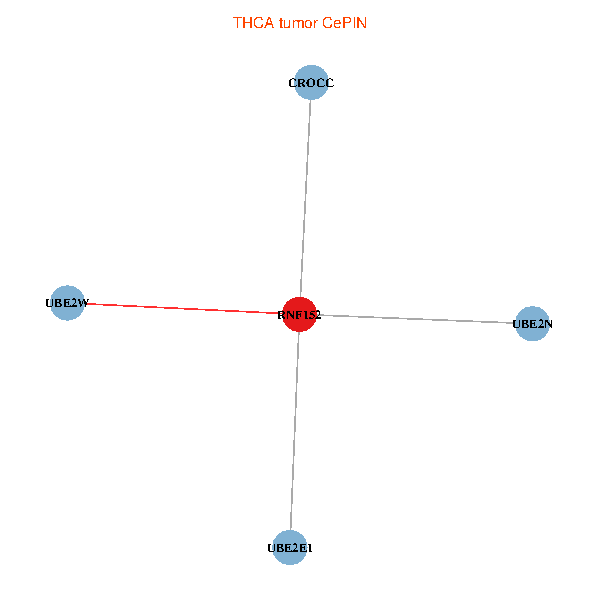
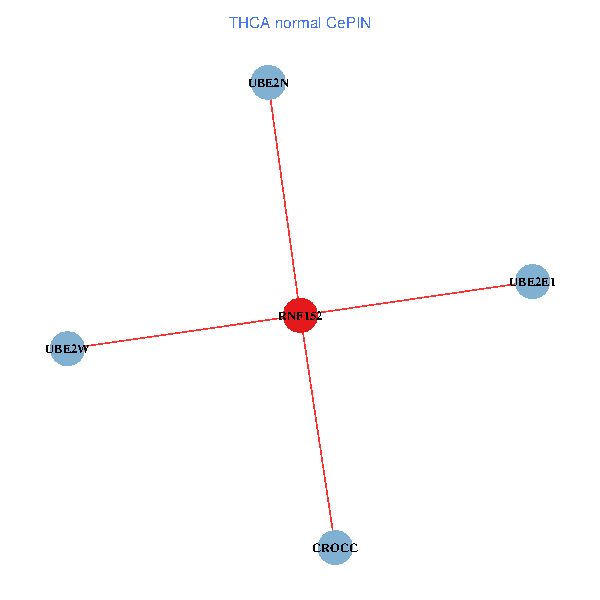
| TissGeneNet for RNF152 |
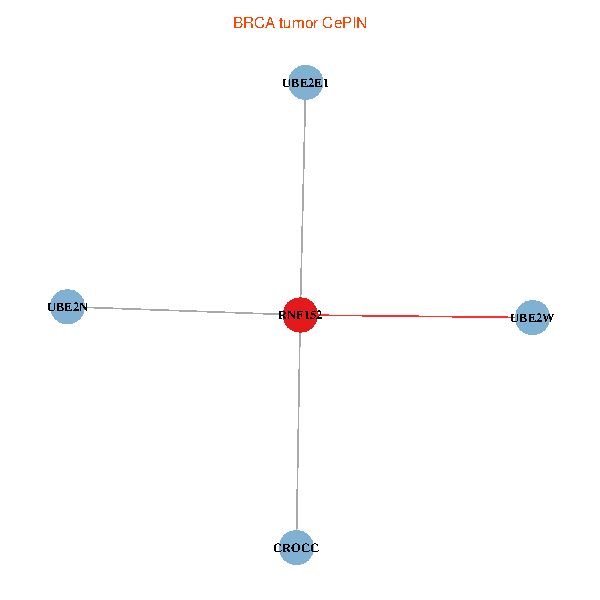
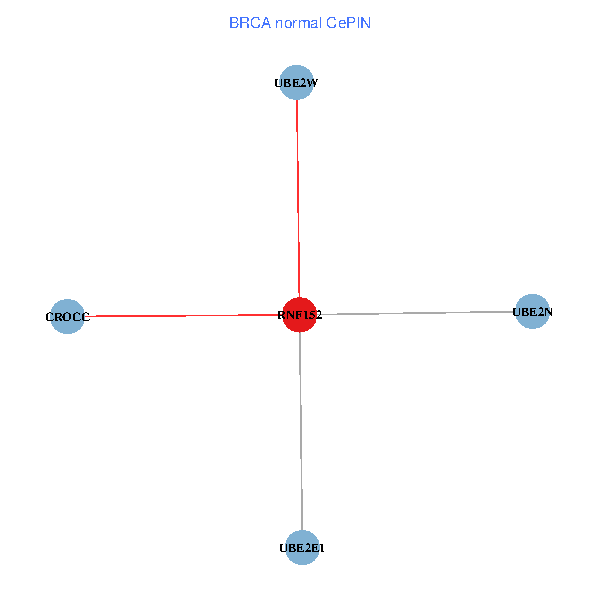
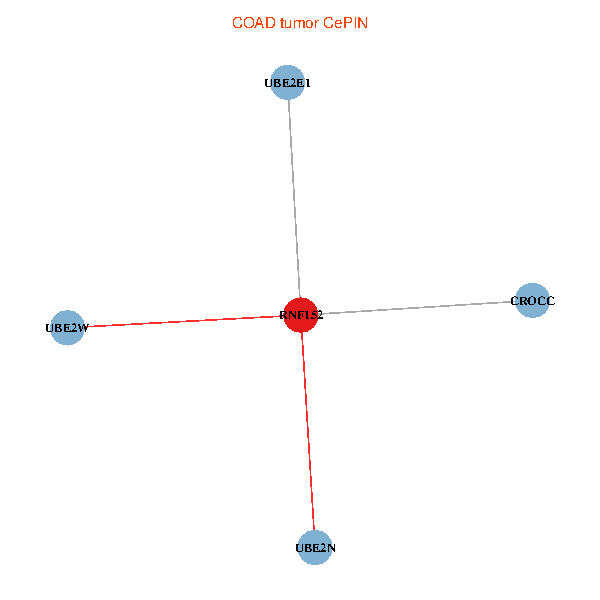
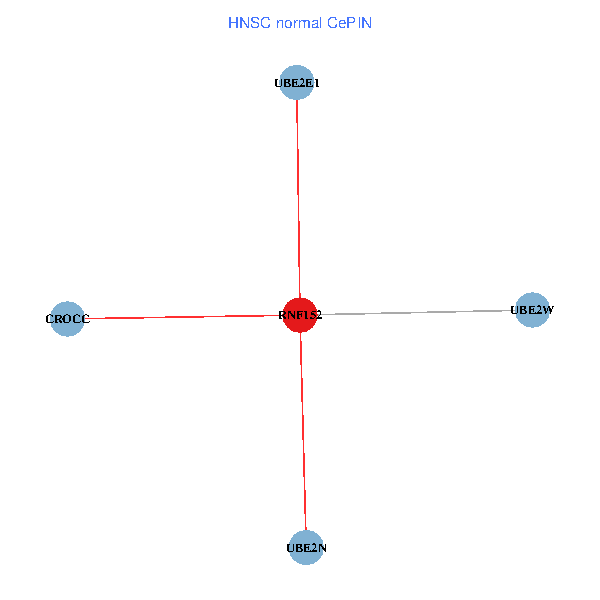
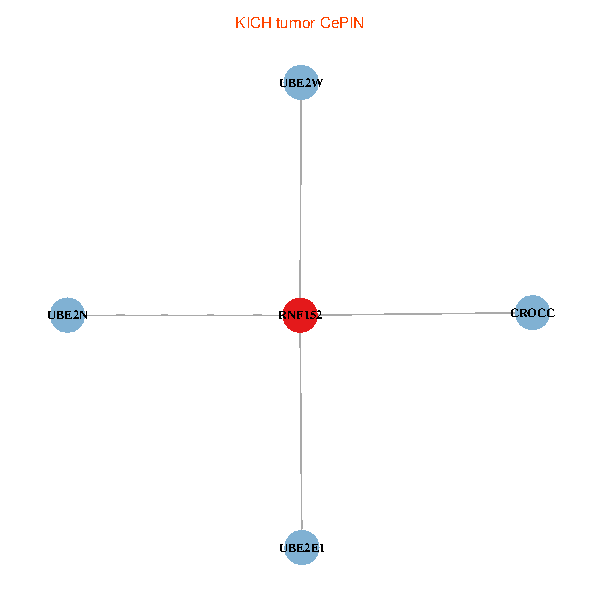
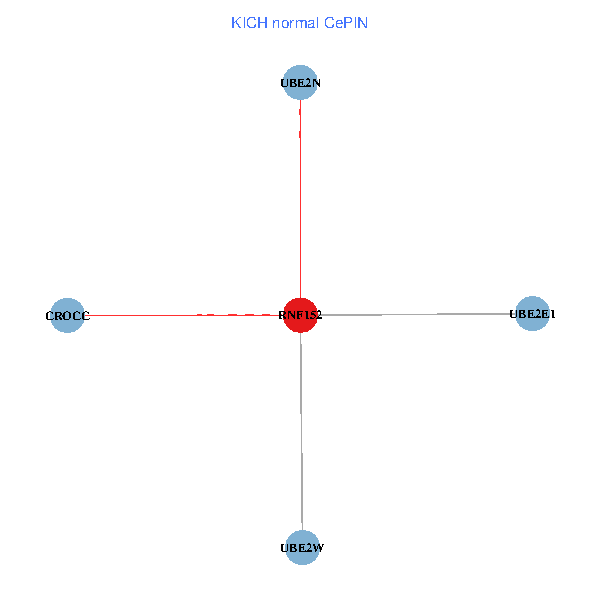
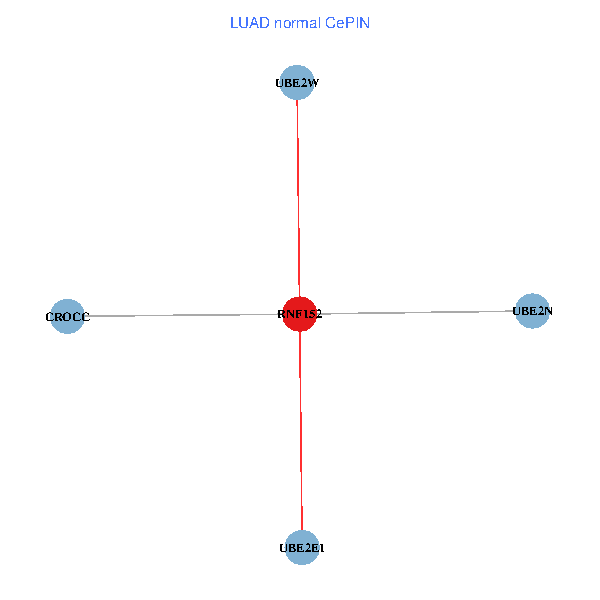
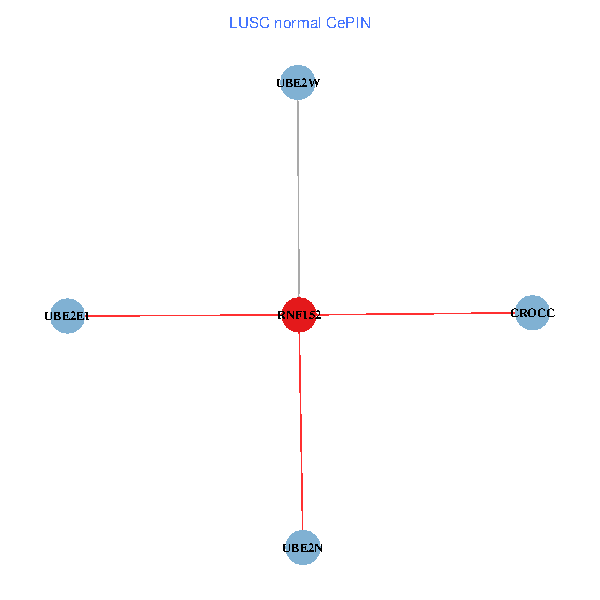
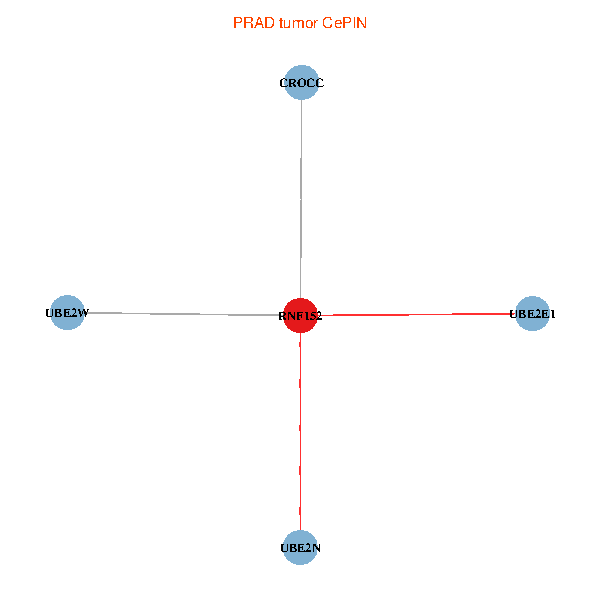
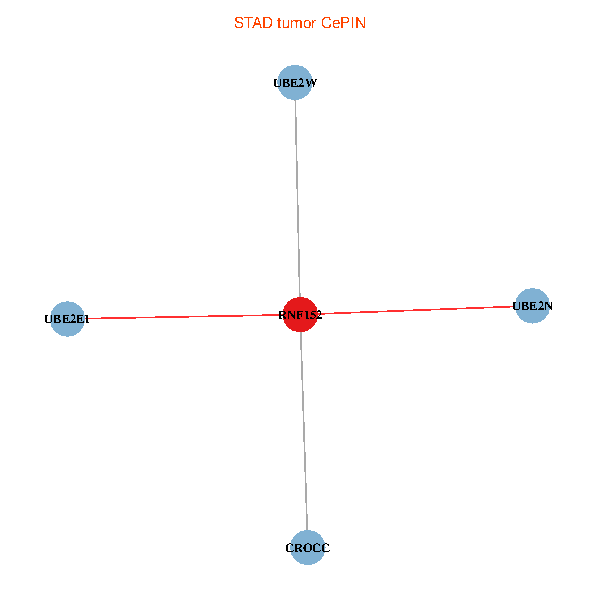
| Co-expressed gene networks based on protein-protein interaction data (CePIN) (TCGA IlluminaHiSeq_RNASeqV2, pan-cancer normalized log2(norm_counts+1) data, version 2016-08-16) (PINA2 ppi data) |
| BRCA (tumor) | BRCA (normal) |
| RNF152, UBE2W, UBE2N, UBE2E1, CROCC (tumor) | RNF152, UBE2W, UBE2N, UBE2E1, CROCC (normal) |
 |  |
| COAD (tumor) | COAD (normal) |
| RNF152, UBE2W, UBE2N, UBE2E1, CROCC (tumor) | RNF152, UBE2W, UBE2N, UBE2E1, CROCC (normal) |
 |  |
| HNSC (tumor) | HNSC (normal) |
| RNF152, UBE2W, UBE2N, UBE2E1, CROCC (tumor) | RNF152, UBE2W, UBE2N, UBE2E1, CROCC (normal) |
 |  |
| KICH (tumor) | KICH (normal) |
| RNF152, UBE2W, UBE2N, UBE2E1, CROCC (tumor) | RNF152, UBE2W, UBE2N, UBE2E1, CROCC (normal) |
 |  |
| KIRC (tumor) | KIRC (normal) |
| RNF152, UBE2W, UBE2N, UBE2E1, CROCC (tumor) | RNF152, UBE2W, UBE2N, UBE2E1, CROCC (normal) |
 |  |
| KIRP (tumor) | KIRP (normal) |
| RNF152, UBE2W, UBE2N, UBE2E1, CROCC (tumor) | RNF152, UBE2W, UBE2N, UBE2E1, CROCC (normal) |
 |  |
| LIHC (tumor) | LIHC (normal) |
| RNF152, UBE2W, UBE2N, UBE2E1, CROCC (tumor) | RNF152, UBE2W, UBE2N, UBE2E1, CROCC (normal) |
 |  |
| LUAD (tumor) | LUAD (normal) |
| RNF152, UBE2W, UBE2N, UBE2E1, CROCC (tumor) | RNF152, UBE2W, UBE2N, UBE2E1, CROCC (normal) |
 |  |
| LUSC (tumor) | LUSC (normal) |
| RNF152, UBE2W, UBE2N, UBE2E1, CROCC (tumor) | RNF152, UBE2W, UBE2N, UBE2E1, CROCC (normal) |
 |  |
| PRAD (tumor) | PRAD (normal) |
| RNF152, UBE2W, UBE2N, UBE2E1, CROCC (tumor) | RNF152, UBE2W, UBE2N, UBE2E1, CROCC (normal) |
 |  |
| STAD (tumor) | STAD (normal) |
| RNF152, UBE2W, UBE2N, UBE2E1, CROCC (tumor) | RNF152, UBE2W, UBE2N, UBE2E1, CROCC (normal) |
 |  |
| THCA (tumor) | THCA (normal) |
| RNF152, UBE2W, UBE2N, UBE2E1, CROCC (tumor) | RNF152, UBE2W, UBE2N, UBE2E1, CROCC (normal) |
 |  |
| Top |
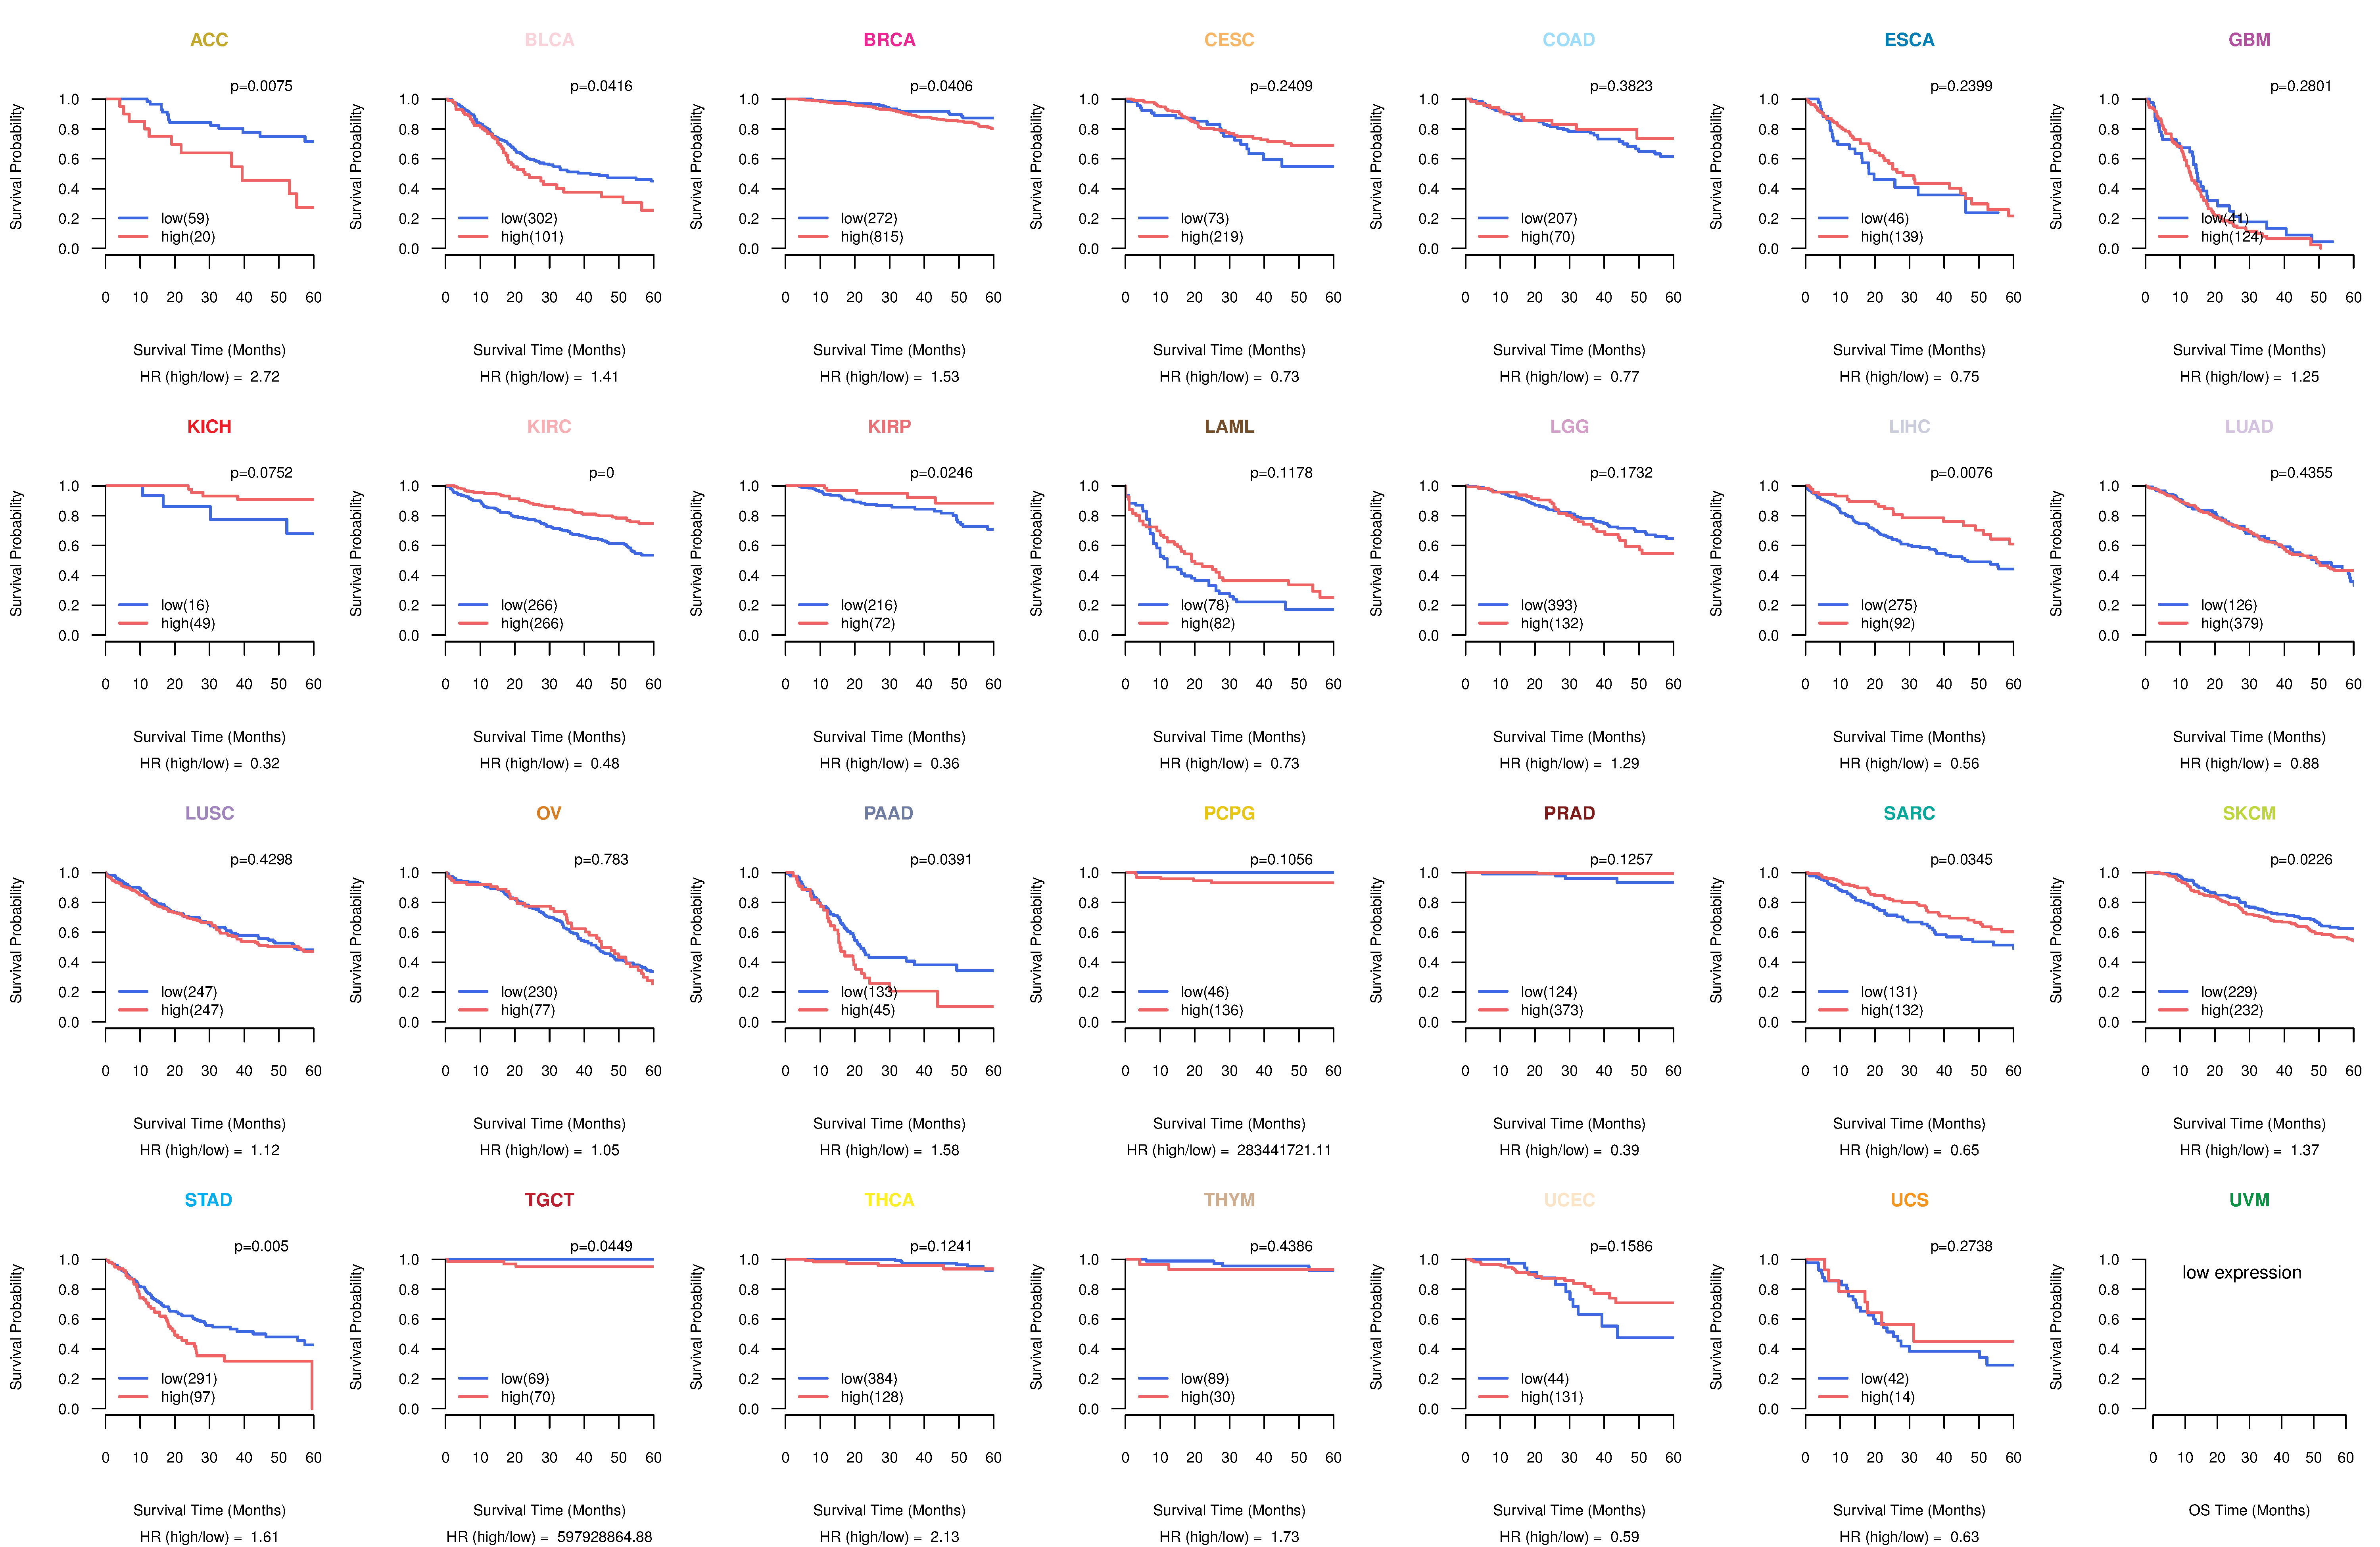
| TissGeneProg for RNF152 |
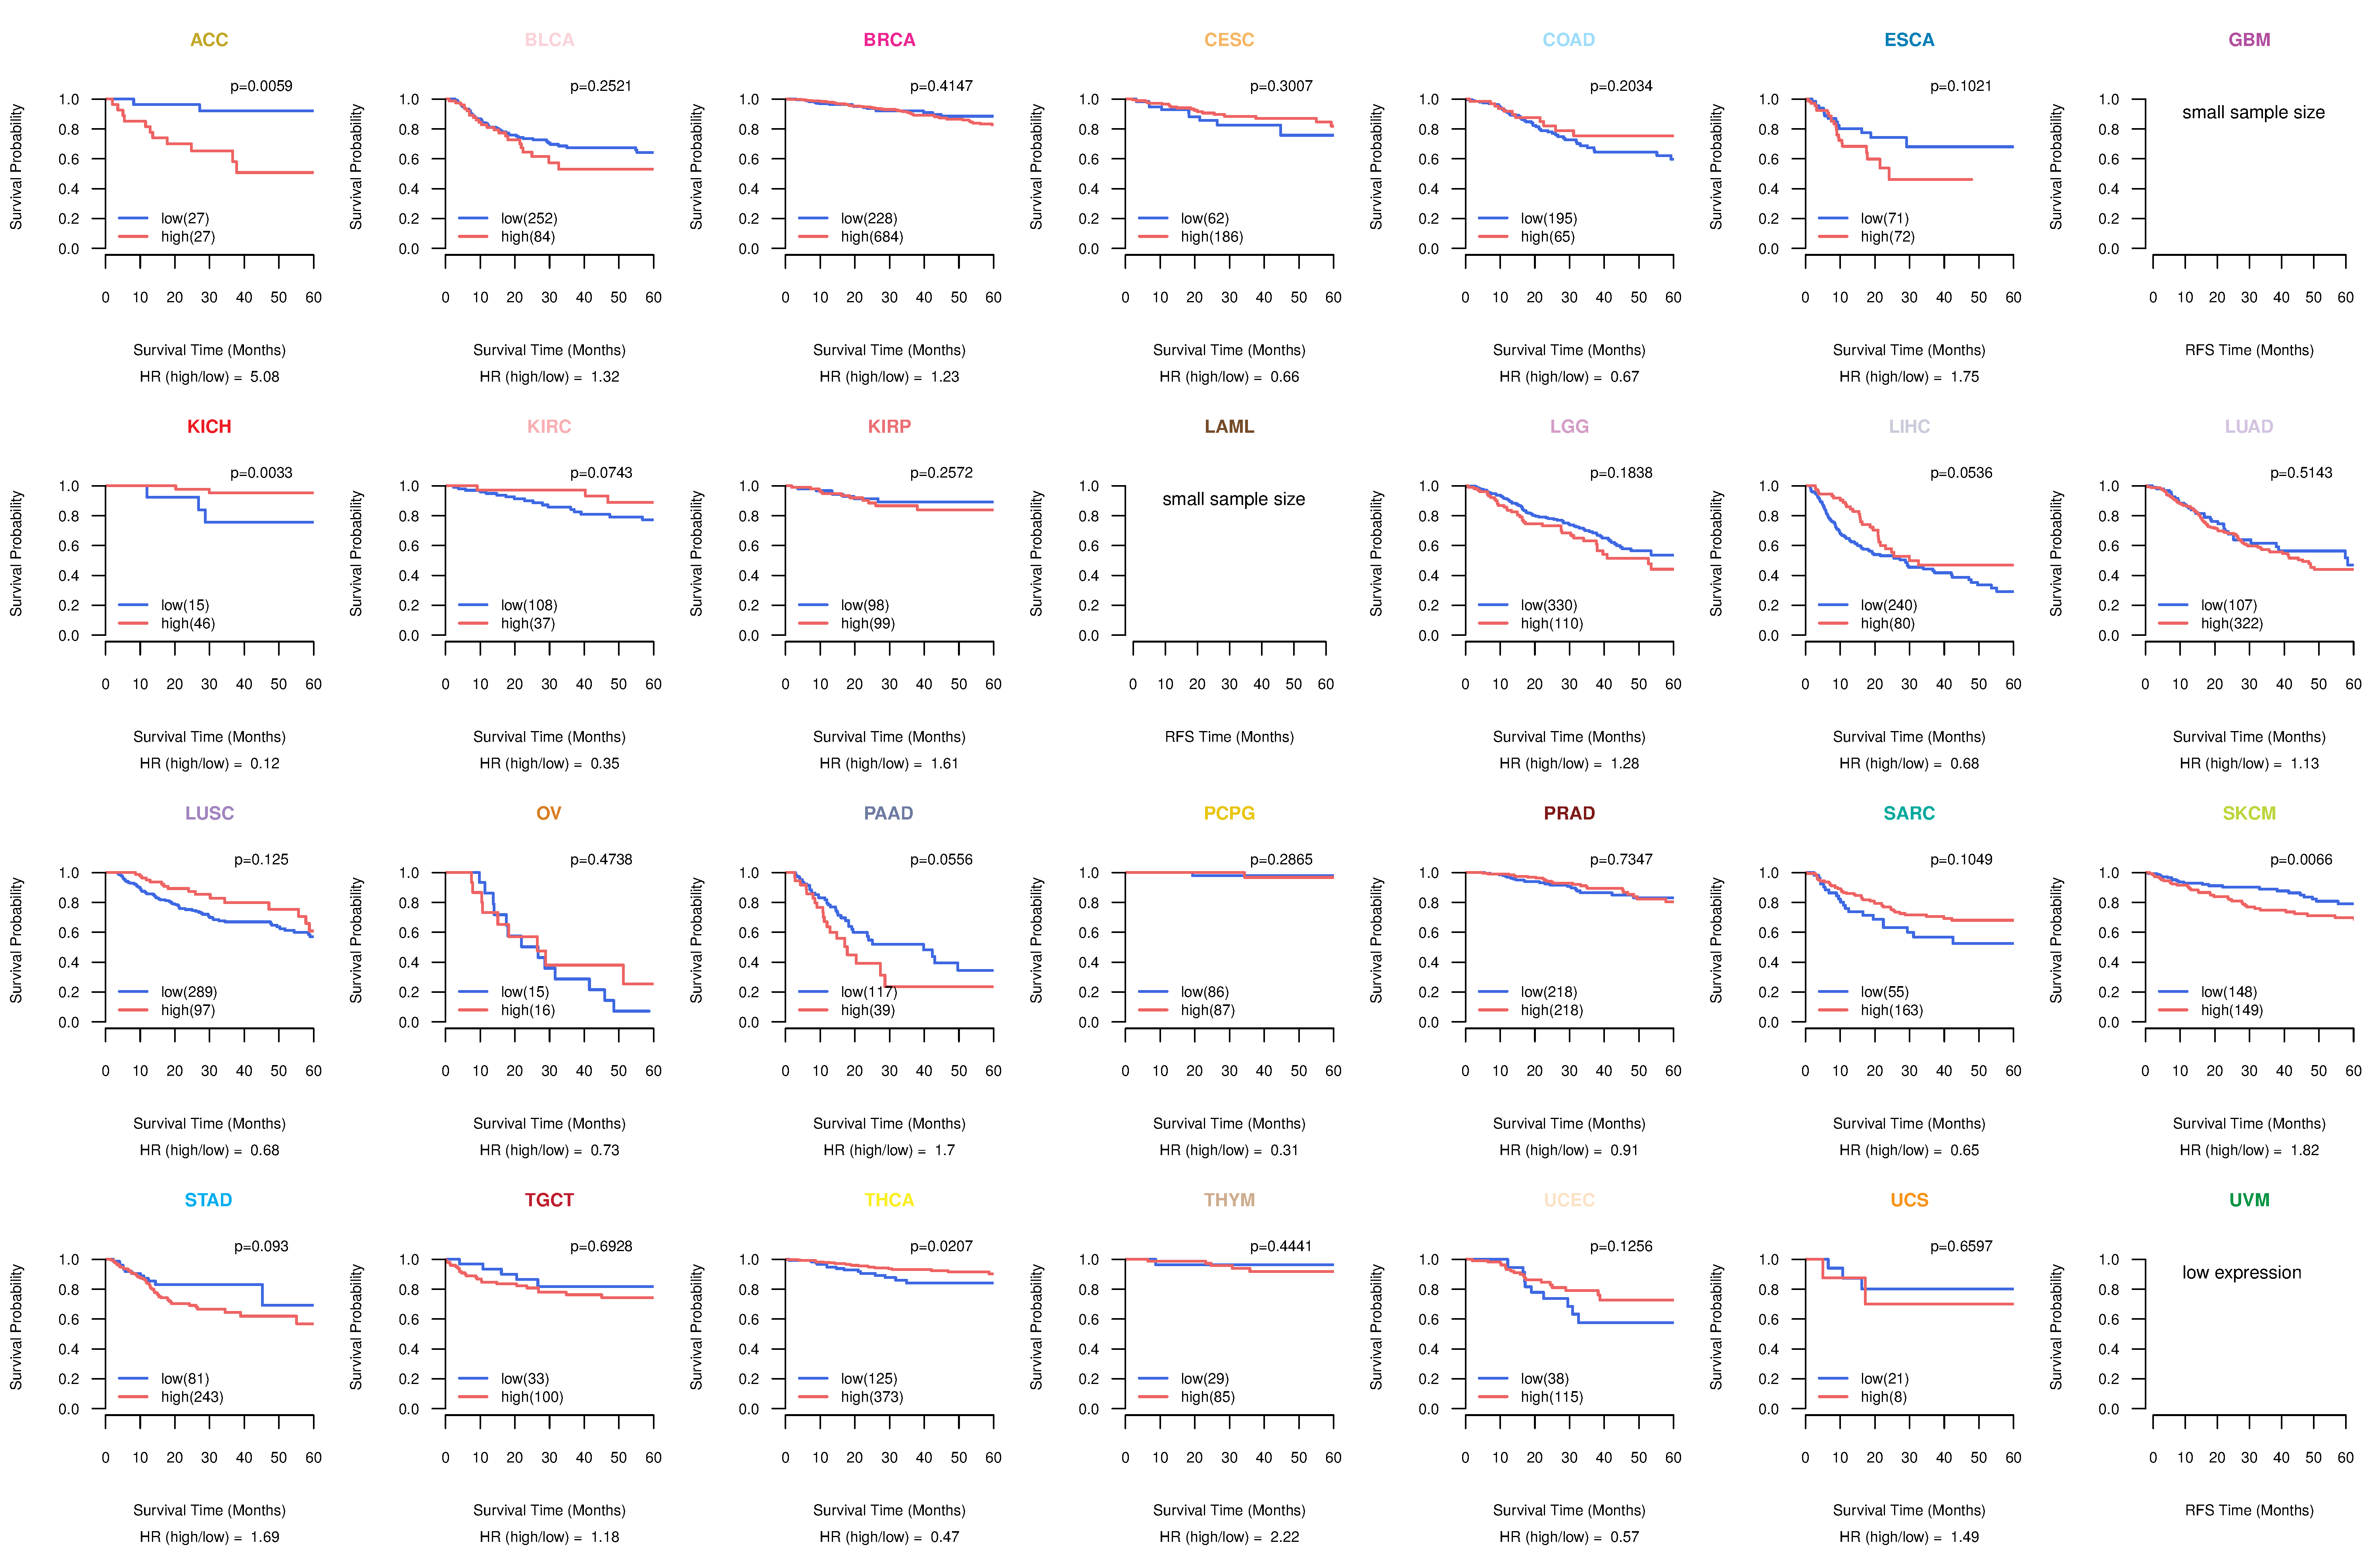
| Kaplan-Meier plots with logrank tests of overall survival (OS) using 28 cancer types (TCGA IlluminaHiSeq_RNASeqV2, pan-cancer normalized log2(norm_counts+1) data, version 2016-08-16) (TCGA clinicalMatrix, phenotype data, version 2016-04-27) * Click on the image to enlarge it in a new window. |
 |
| Kaplan-Meier plots with logrank test of relapse free survival (RFS) using 28 cancer types (TCGA IlluminaHiSeq_RNASeqV2, pan-cancer normalized log2(norm_counts+1) data, version 2016-08-16) (TCGA clinicalMatrix, phenotype data, version 2016-04-27) * Click on the image enlarge it in a new window. |
 |
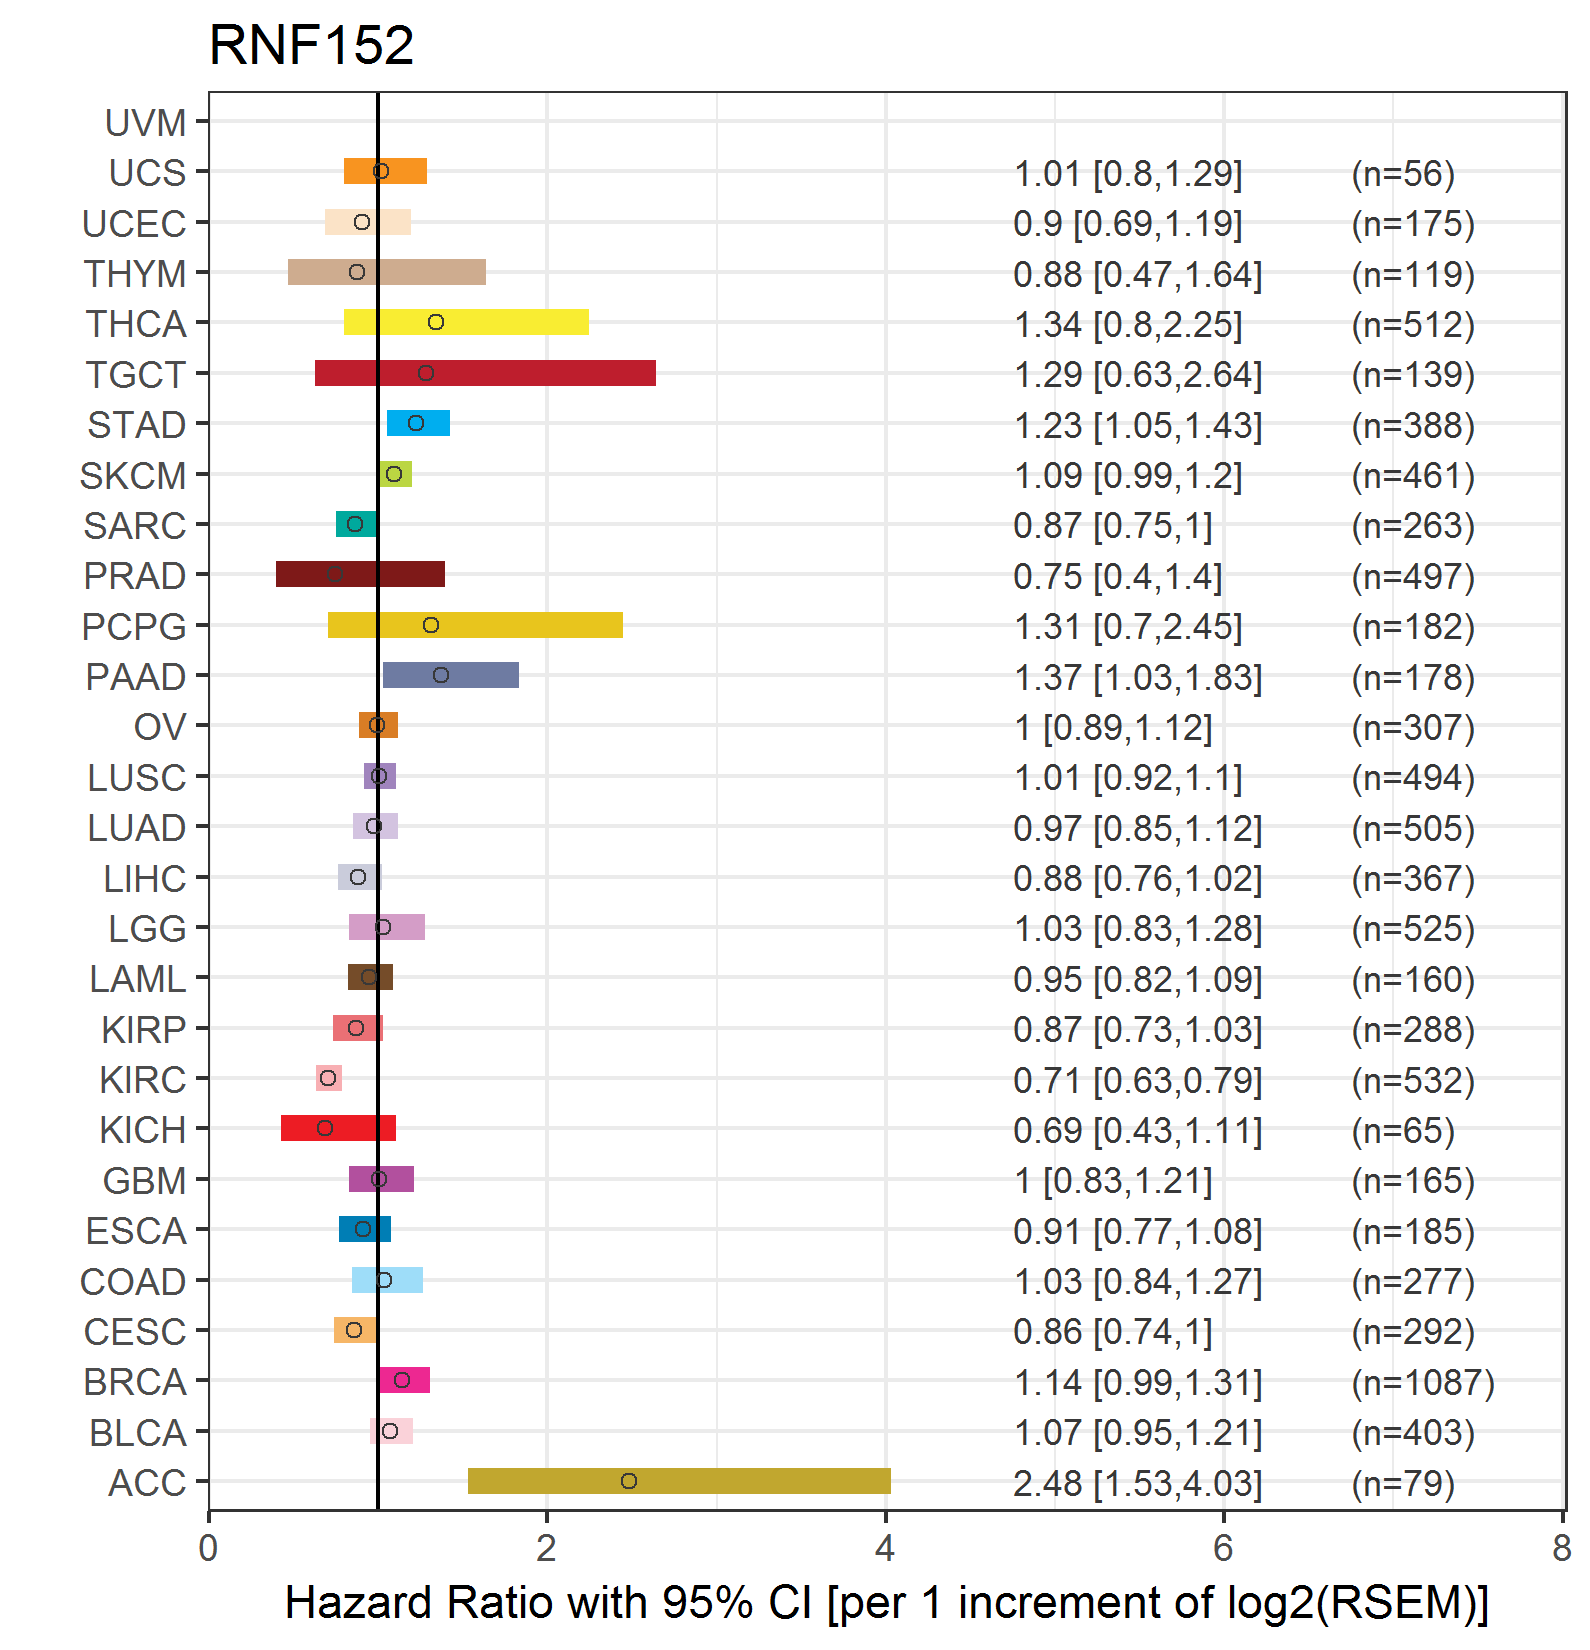
| Forest plot of Cox proportional hazard ratio (HR) and 95% CI of overall survival (OS) using 28 cancer types (TCGA IlluminaHiSeq_RNASeqV2, pan-cancer normalized log2(norm_counts+1) data, version 2016-08-16) (TCGA clinicalMatrix, phenotype data, version 2016-04-27) * Click on the image enlarge it in a new window. |
 |
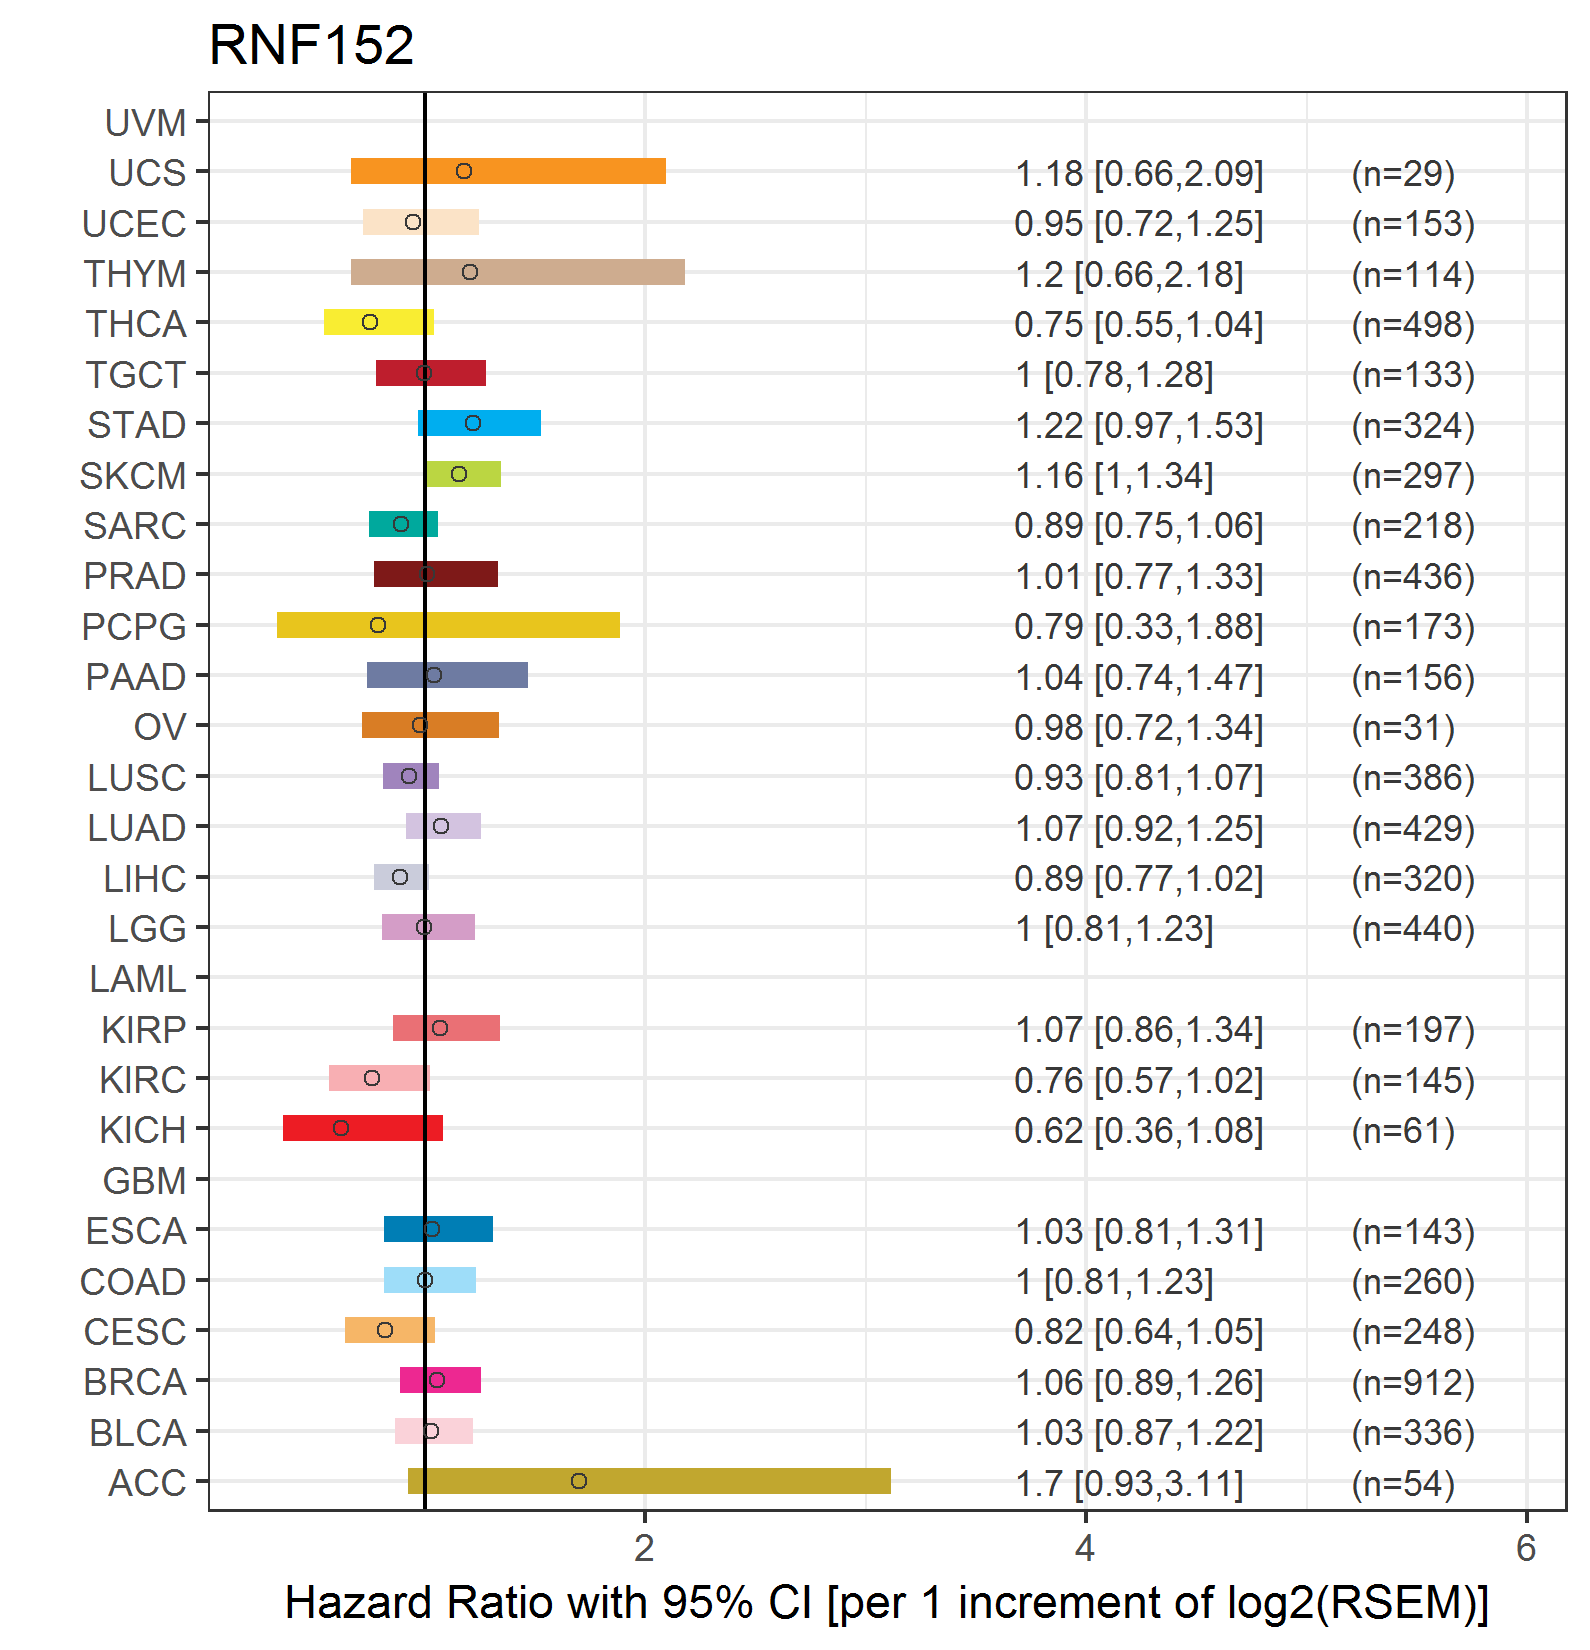
| Forest plot of Cox proportional hazard ratio (HR) and 95% CI of relapse free survival (RFS) using 28 cancer types (TCGA IlluminaHiSeq_RNASeqV2, pan-cancer normalized log2(norm_counts+1) data, version 2016-08-16) (TCGA clinicalMatrix, phenotype data, version 2016-04-27) * Click on the image enlarge it in a new window. |
 |
| Top |
| TissGeneClin for RNF152 |
| TissGeneDrug for RNF152 |
| Drug information targeting TissGene (DrugBank Version 5.0.6, 2017-04-01) |
| DrugBank ID | Drug name | Drug activity | Drug type | Drug status |
| Top |
| TissGeneDisease for RNF152 |
| Disease information associated with TissGene (DisGeNet, 2016-06-01) |
| Disease ID | Disease name | # pubmeds | Source |
| umls:C0153638 | Malignant neoplasm of occipital lobe | 1 | GAD |
|
Copyright 2016-Present - The University of Texas Health Science Center at Houston (UTHealth) Web File Viewing | How to Report, Fraud, Waste and Abuse | State of Texas | Statewide Search | Texas Homeland Security | Site Policies |