 |
| |
| |
| |
| |
| |
| |
|

| TissGeneSummary for FCER1A |
 Gene summary Gene summary |
| Basic gene information | Gene symbol | FCER1A |
| Gene name | Fc fragment of IgE, high affinity I, receptor for; alpha polypeptide | |
| Synonyms | FCE1A|FcERI | |
| Cytomap | UCSC genome browser: 1q23 | |
| Type of gene | protein-coding | |
| RefGenes | NM_002001.3, | |
| Description | Fc IgE receptor, alpha polypeptideFc epsilon RI alpha-chainFc-epsilon RI-alphahigh affinity immunoglobulin epsilon receptor alpha-subunithigh affinity immunoglobulin epsilon receptor subunit alphaigE Fc receptor subunit alphaimmunoglobulin E recepto | |
| Modification date | 20141207 | |
| dbXrefs | MIM : 147140 | |
| HGNC : HGNC | ||
| Ensembl : ENSG00000179639 | ||
| HPRD : 00917 | ||
| Vega : OTTHUMG00000037176 | ||
| Protein | UniProt: go to UniProt's Cross Reference DB Table | |
| Expression | CleanEX: HS_FCER1A | |
| BioGPS: 2205 | ||
| Pathway | NCI Pathway Interaction Database: FCER1A | |
| KEGG: FCER1A | ||
| REACTOME: FCER1A | ||
| Pathway Commons: FCER1A | ||
| Context | iHOP: FCER1A | |
| ligand binding site mutation search in PubMed: FCER1A | ||
| UCL Cancer Institute: FCER1A | ||
| Assigned class in TissGDB* | C | |
| Included tissue-specific gene expression resources | TiGER,GTEx | |
| Specific-tissues in normal samples (assigned by TissGDB using HPA, TiGER, and GTEx) | ProstateSkin | |
| Cancer types related to the specific-tissues in cancer samples (assigned by TissGDB using TCGA) | PRADSKCM | |
| Reference showing the relevant tissue of FCER1A | ||
| Description by TissGene annotations | Cancer gene | |
| * Class A consists of genes with literature evidence and is part of the cTissGenes. Class B consists of only cTissGenes without additional evidence. The remaining genes belong to Class C. |
| Gene ontology having evidence of Inferred from Direct Assay (IDA) from Entrez |
| GO ID | GO term | PubMed ID |
| Top |
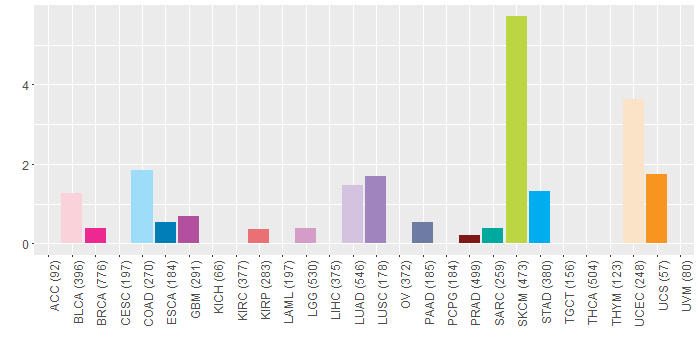
| TissGeneExp for FCER1A |
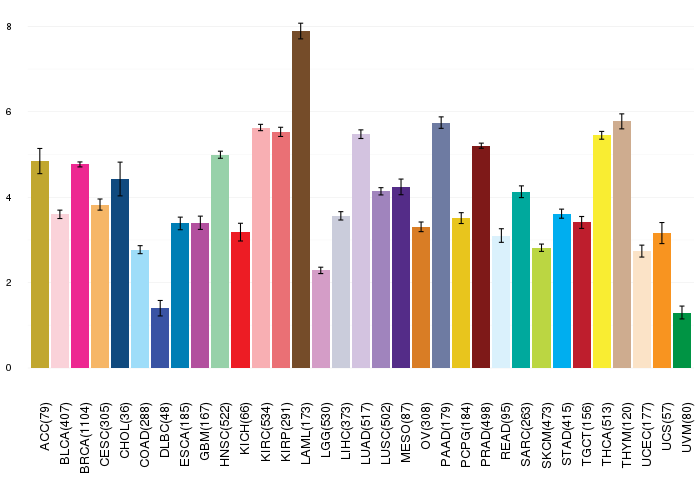
| Gene expressions across 28 cancer types (X-axis: cancer type and Y-axis: log2(norm_counts+1)) (TCGA IlluminaHiSeq_RNASeqV2, pan-cancer normalized log2(norm_counts+1) data, version 2016-08-16) |
 |
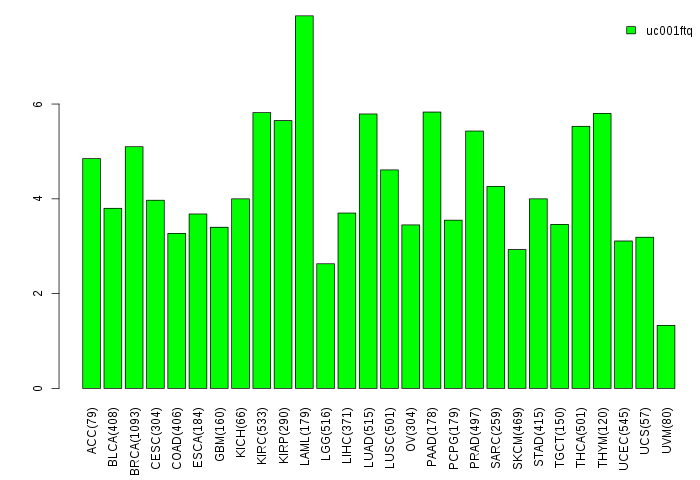
| Gene isoform expressions across 28 cancer types (X-axis: cancer type and Y-axis: log2(norm_counts+1)) (TCGA pan-cancer tcga_rsem_isoform_tpm, version 2016-09-01) |
 |
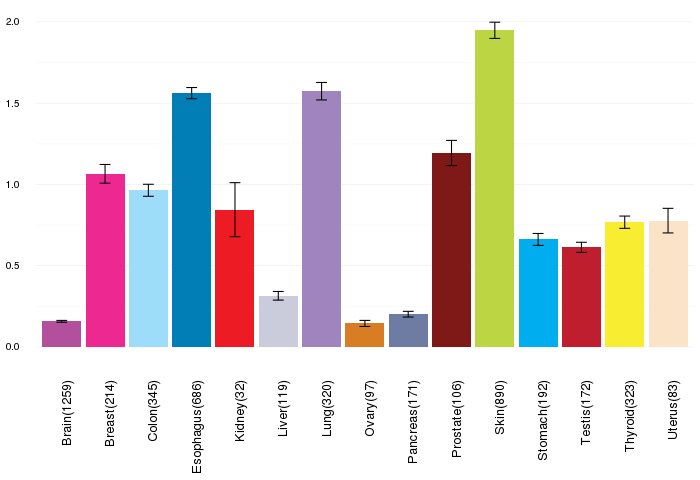
| Gene expressions across normal tissues of GTEx data (GTEx GTEx_Analysis_v6_RNA-seq_RNA-SeQCv1.1.8_gene_rpkm.gct) - Here, we shows the matched tissue types only among our 28 cancer types. |
 |
| Different expressions across 14 cancer types with more than 10 samples between matched tumors and normals (X-axis: cancer type and Y-axis: log2(norm_counts+1)) (TCGA IlluminaHiSeq_RNASeqV2, pan-cancer normalized log2(norm_counts+1) data, version 2016-08-16) |
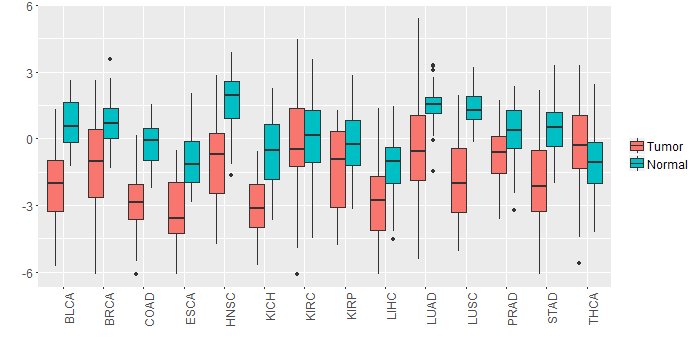 |
| - Significantly differentially expressed cancer types and information. (|Fold change|>1 and FDR<0.05) |
| Cancer type | Mean(exp) in tumor | Mean(exp) in matched normal | Log2FC | P-val. | FDR |
| KICH | -3.145090531 | -0.521978531 | -2.623112 | 2.25E-07 | 9.59E-07 |
| STAD | -1.897535281 | 0.496417844 | -2.393953125 | 4.53E-07 | 8.82E-06 |
| LIHC | -2.747326531 | -1.309740531 | -1.437586 | 2.03E-05 | 8.02E-05 |
| PRAD | -0.727726147 | 0.30577193 | -1.033498077 | 1.22E-05 | 6.56E-05 |
| LUAD | -0.335476876 | 1.53288002 | -1.868356897 | 7.03E-08 | 2.80E-07 |
| BRCA | -1.144174426 | 0.72200803 | -1.866182456 | 4.36E-17 | 2.57E-16 |
| LUSC | -1.887686139 | 1.365115822 | -3.252801961 | 2.45E-18 | 2.32E-17 |
| COAD | -2.881339608 | -0.198762685 | -2.682576923 | 1.39E-09 | 1.51E-08 |
| HNSC | -1.138229322 | 1.660182306 | -2.798411628 | 5.35E-11 | 1.15E-09 |
| KIRP | -1.271960281 | -0.159910281 | -1.11205 | 0.013 | 0.02762654 |
| ESCA | -3.303311986 | -0.926539259 | -2.376772727 | 0.00222 | 0.023959034 |
| BLCA | -2.153008637 | 0.687938732 | -2.840947368 | 1.49E-05 | 0.000260926 |
| Top |
| TissGene-miRNA for FCER1A |
| Significantly anti-correlated miRNAs of TissGene across 28 cancer types (Gene-miRNA relations from TargetScanHuman Relsease 7.1, Conserved_Site_Context_Scores.txt.zip, 06.01.2016) (TCGA IlluminaHiSeq_miRNASeq, log2(RPM+1) data, version 2016-11-21) (TCGA IlluminaHiSeq_RNASeqV2, log2(normalized_count+1) data, version 2016-08-16) (Spearman’s Rank Correlation (p-value<0.05 and coefficient<-0.25)) |
| Cancer type | miRNA id | miRNA accession | P-val. | Coeff. | # samples |
| Top |
| TissGeneMut for FCER1A |
| TissGeneSNV for FCER1A |
| nsSNV counts per each loci. Different colors of circles represent different cancer types. Circle size denotes number of samples. (TCGA somatic mutation (SNPs and small INDELs) data, version 2016-04-25) * Click on the image to enlarge it in a new window. |
 |
 |
| Somatic nucleotide variants of TissGene across 28 cancer types (X-axis: cancer type and Y-axis: % of mutated samples) The numbers in parentheses are numbers of samples with mutation (nsSNVs). (TCGA somatic mutation (SNPs and small INDELs) data, version 2016-04-25) |
 |
| - nsSNVs sorted by frequency. |
| AAchange | Cancer type | # samples |
| p.G221E | SKCM | 3 |
| p.P103L | SKCM | 2 |
| p.P250S | SKCM | 2 |
| p.E186G | STAD | 2 |
| p.Y156H | HNSC | 1 |
| p.R136S | LUAD | 1 |
| p.P250L | BRCA | 1 |
| p.N35S | SKCM | 1 |
| p.E72Q | LUAD | 1 |
| p.R199H | LGG | 1 |
| p.R199L | HNSC | 1 |
| p.X258L | UCS | 1 |
| p.V23M | GBM | 1 |
| p.M5K | LUAD | 1 |
| p.G134C | SKCM | 1 |
| p.A217V | COAD | 1 |
| p.Y154C | READ | 1 |
| p.I236V | SARC | 1 |
| p.D21N | SKCM | 1 |
| p.E45D | UCEC | 1 |
| p.W38* | SKCM | 1 |
| p.E100D | LUAD | 1 |
| p.F17L | SKCM | 1 |
| p.L234F | BLCA | 1 |
| p.N79I | SKCM | 1 |
| p.Q116X | SKCM | 1 |
| p.L49I | UCEC | 1 |
| p.E120D | LGG | 1 |
| p.P8H | LUAD | 1 |
| p.E157K | BLCA | 1 |
| p.S7F | STAD | 1 |
| p.S33F | SKCM | 1 |
| p.T193I | UCEC | 1 |
| p.W155L | LUSC | 1 |
| p.E107K | SKCM | 1 |
| p.G68D | PAAD | 1 |
| p.Q227* | LUSC | 1 |
| p.G53E | SKCM | 1 |
| p.E169Q | BLCA | 1 |
| p.F18S | HNSC | 1 |
| p.S77R | SKCM | 1 |
| p.V23M | ESCA | 1 |
| p.E72K | SKCM | 1 |
| p.G22V | LUAD | 1 |
| p.L210S | COAD | 1 |
| p.G149V | UCEC | 1 |
| p.T173A | COAD | 1 |
| p.F207V | UCEC | 1 |
| p.M5I | SKCM | 1 |
| p.A4S | UCEC | 1 |
| p.V212A | LUAD | 1 |
| p.K235N | COAD | 1 |
| p.L233F | SKCM | 1 |
| p.E200Q | STAD | 1 |
| p.G134S | GBM | 1 |
| p.K147E | SKCM | 1 |
| p.N165H | COAD | 1 |
| p.S225* | LUAD | 1 |
| p.T193I | SKCM | 1 |
| p.D148N | SKCM | 1 |
| p.W38X | SKCM | 1 |
| p.E86K | BRCA | 1 |
| p.G221* | UCEC | 1 |
| p.R199H | KIRP | 1 |
| p.Q116* | SKCM | 1 |
| p.F56L | UCEC | 1 |
| p.L10P | BLCA | 1 |
| p.P127S | STAD | 1 |
| p.E107D | BLCA | 1 |
| p.W181C | LUSC | 1 |
| p.G125V | SKCM | 1 |
| p.Y105F | BRCA | 1 |
| p.R240K | SKCM | 1 |
| p.L152F | HNSC | 1 |
| p.P248L | SKCM | 1 |
| p.A25T | UCEC | 1 |
| p.F65I | SKCM | 1 |
| p.W181L | LUSC | 1 |
| p.H159N | PRAD | 1 |
| Top |
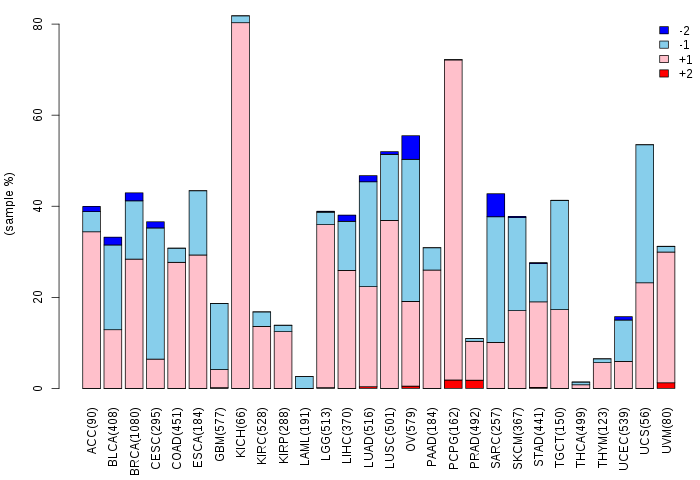
| TissGeneCNV for FCER1A |
| Copy number variations of TissGene across 28 cancer types (X-axis: cancer type and Y-axis: % of CNV samples) (TCGA Gistic2_CopyNumber_Gistic2_all_data_by_genes, Gistic2 copy number data, version 2016-08-16) |
 |
| Top |
| TissGeneFusions for FCER1A |
| Fusion genes including TissGene (ChimerDB 3.0, 2016-12-01 and TCGA fusion Portal 2015-12-01) |
| Database | Src | Cancer type | Sample | Fusion gene | ORF | 5'-gene BP | 3'-gene BP |
| Top |
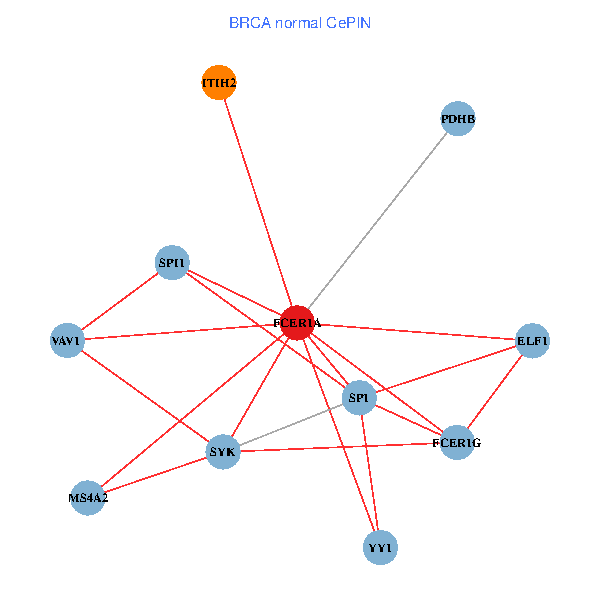
| TissGeneNet for FCER1A |
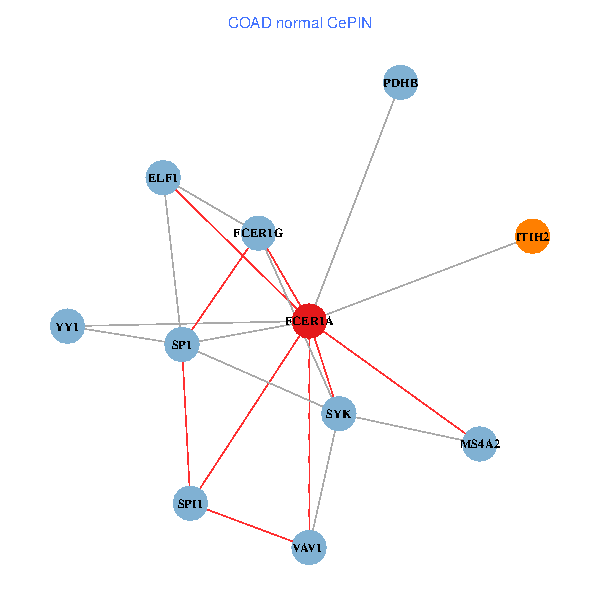
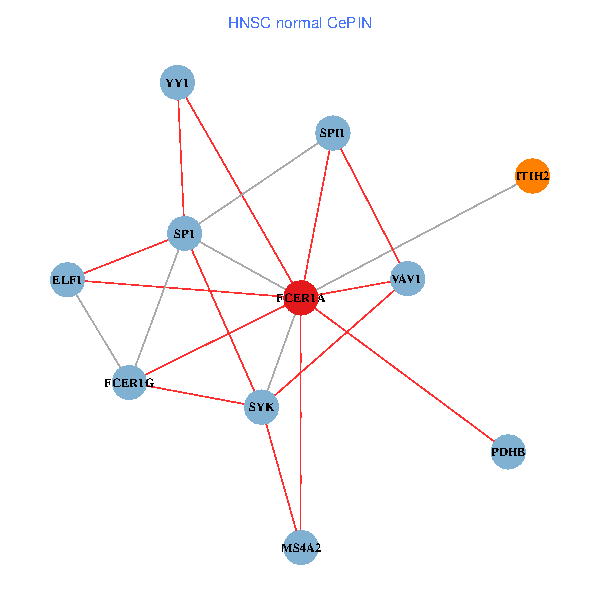
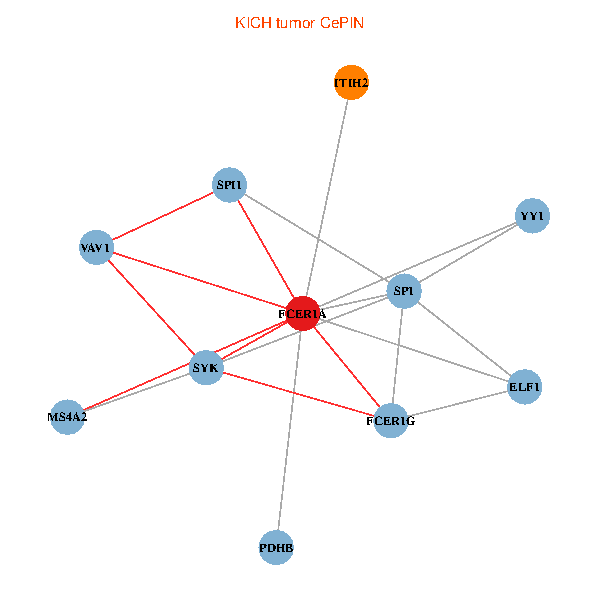
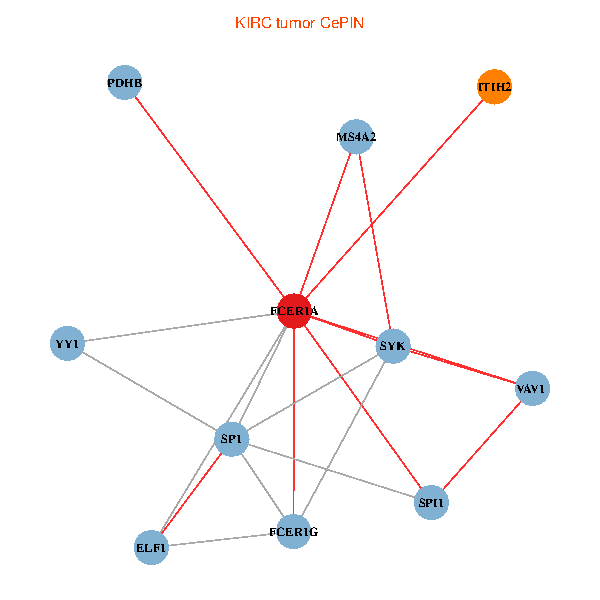
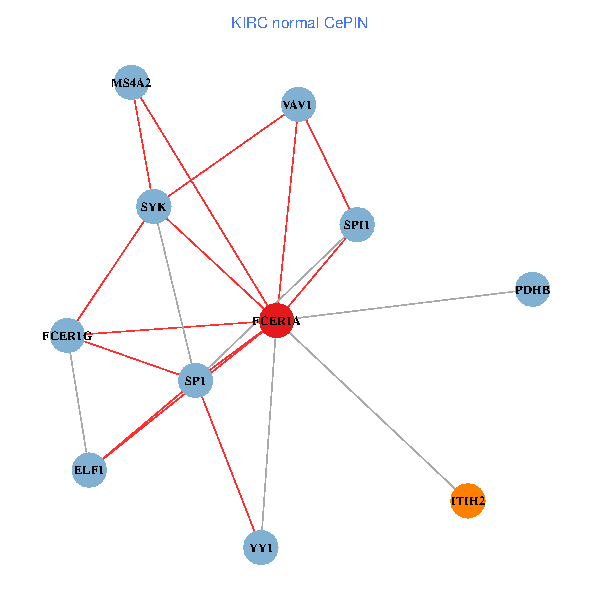
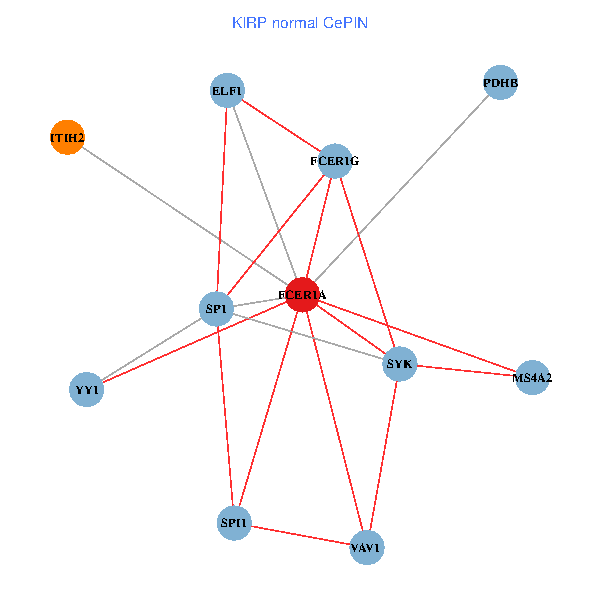
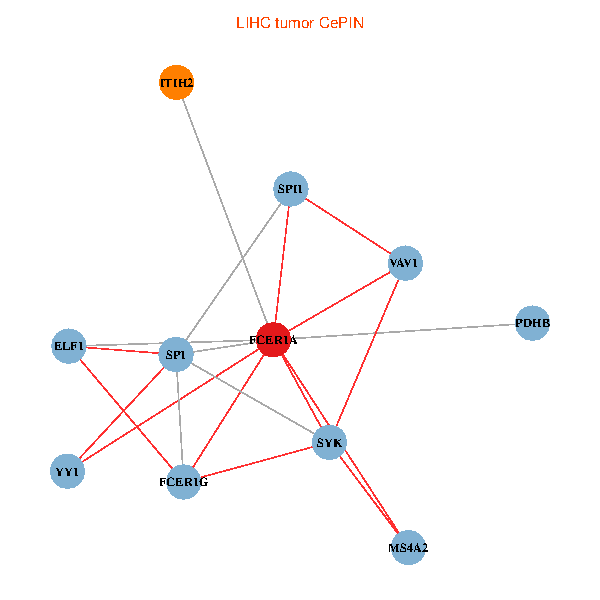
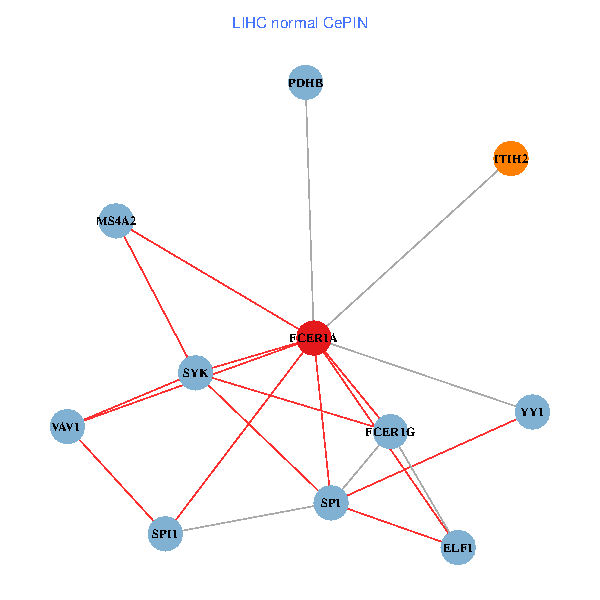
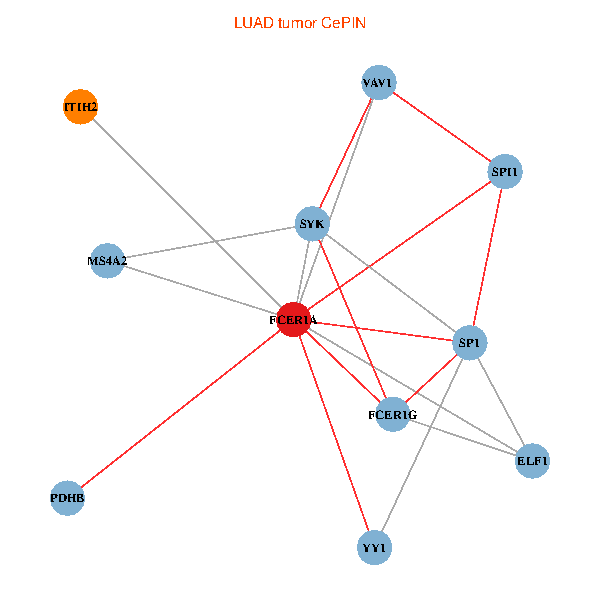
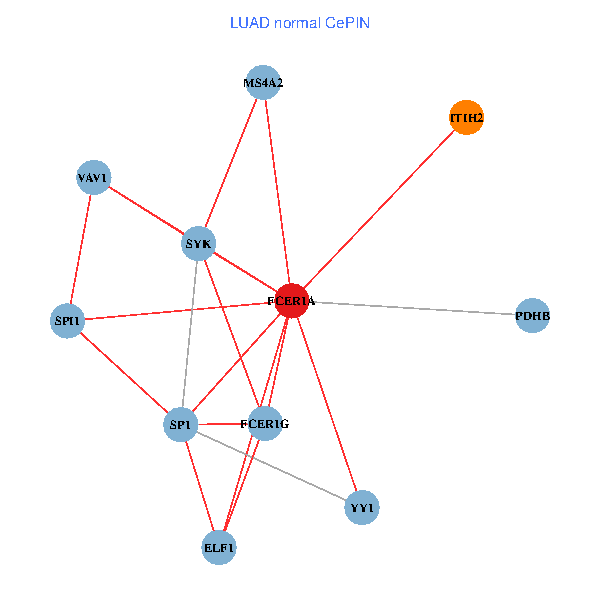
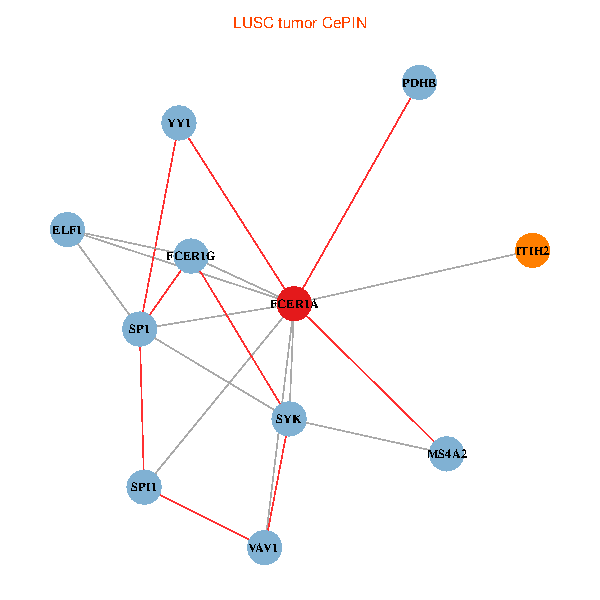
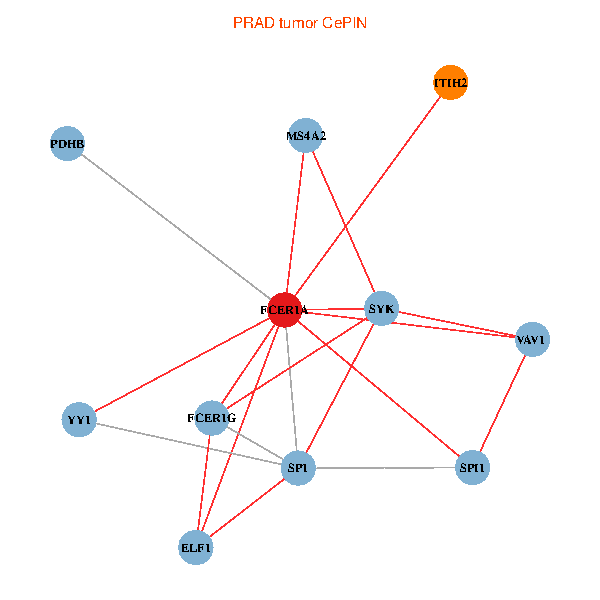
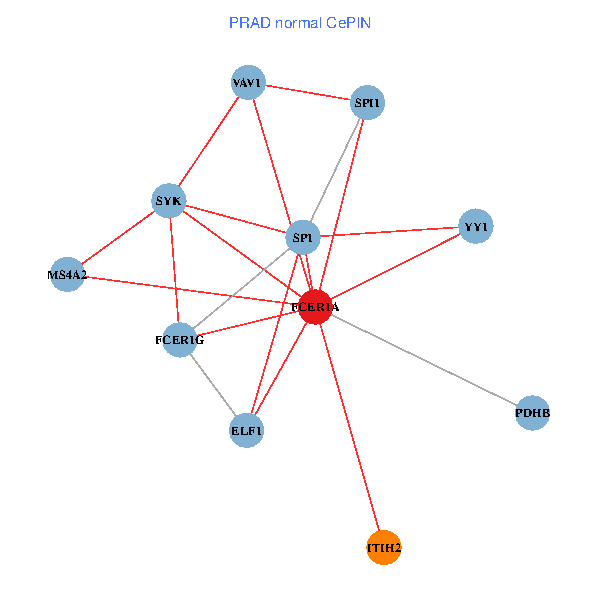
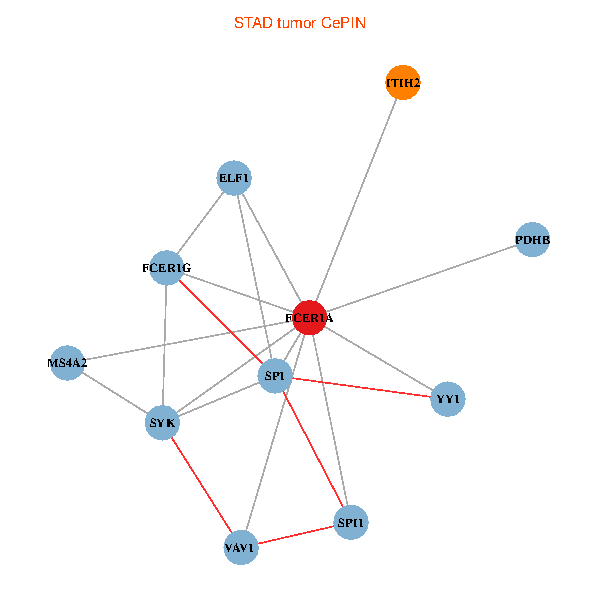
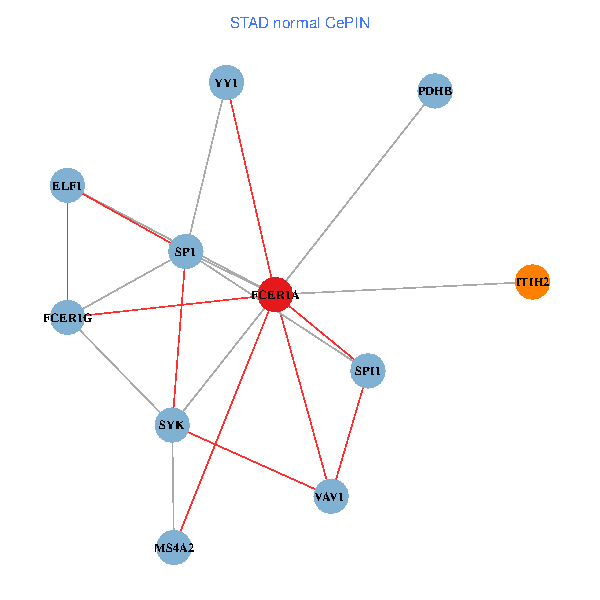
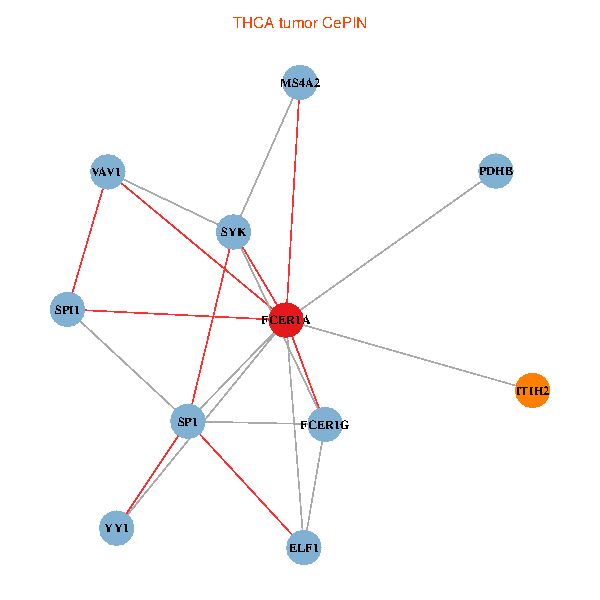
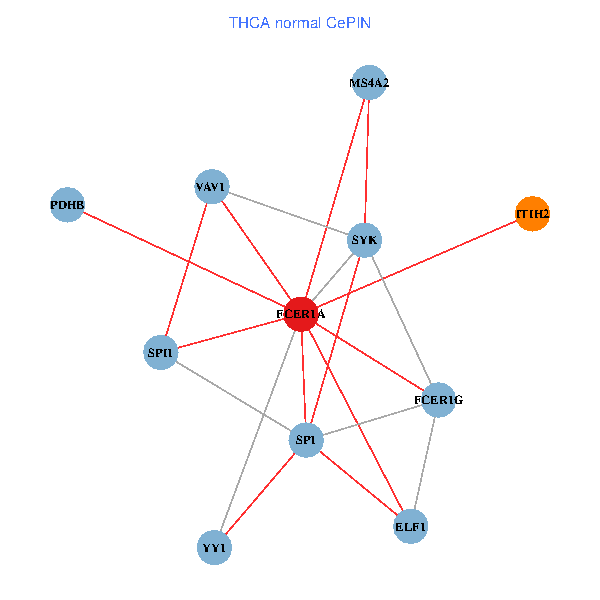
| Co-expressed gene networks based on protein-protein interaction data (CePIN) (TCGA IlluminaHiSeq_RNASeqV2, pan-cancer normalized log2(norm_counts+1) data, version 2016-08-16) (PINA2 ppi data) |
| BRCA (tumor) | BRCA (normal) |
| FCER1A, SP1, VAV1, SYK, YY1, SPI1, PDHB, ELF1, MS4A2, FCER1G, ITIH2 (tumor) | FCER1A, SP1, VAV1, SYK, YY1, SPI1, PDHB, ELF1, MS4A2, FCER1G, ITIH2 (normal) |
 |  |
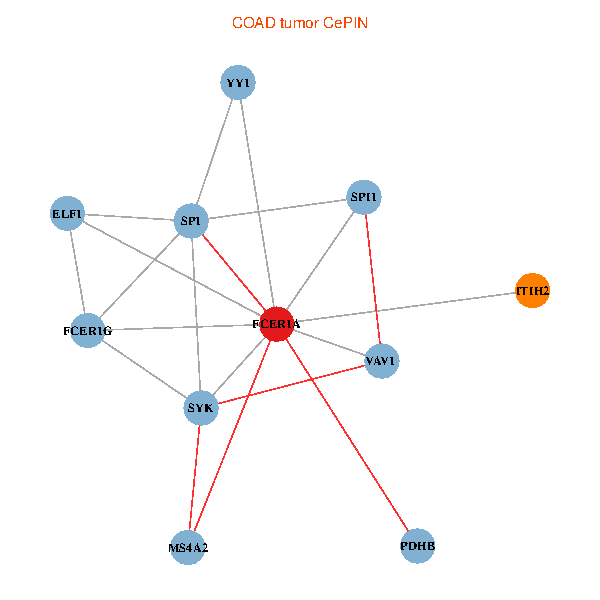
| COAD (tumor) | COAD (normal) |
| FCER1A, SP1, VAV1, SYK, YY1, SPI1, PDHB, ELF1, MS4A2, FCER1G, ITIH2 (tumor) | FCER1A, SP1, VAV1, SYK, YY1, SPI1, PDHB, ELF1, MS4A2, FCER1G, ITIH2 (normal) |
 |  |
| HNSC (tumor) | HNSC (normal) |
| FCER1A, SP1, VAV1, SYK, YY1, SPI1, PDHB, ELF1, MS4A2, FCER1G, ITIH2 (tumor) | FCER1A, SP1, VAV1, SYK, YY1, SPI1, PDHB, ELF1, MS4A2, FCER1G, ITIH2 (normal) |
 |  |
| KICH (tumor) | KICH (normal) |
| FCER1A, SP1, VAV1, SYK, YY1, SPI1, PDHB, ELF1, MS4A2, FCER1G, ITIH2 (tumor) | FCER1A, SP1, VAV1, SYK, YY1, SPI1, PDHB, ELF1, MS4A2, FCER1G, ITIH2 (normal) |
 |  |
| KIRC (tumor) | KIRC (normal) |
| FCER1A, SP1, VAV1, SYK, YY1, SPI1, PDHB, ELF1, MS4A2, FCER1G, ITIH2 (tumor) | FCER1A, SP1, VAV1, SYK, YY1, SPI1, PDHB, ELF1, MS4A2, FCER1G, ITIH2 (normal) |
 |  |
| KIRP (tumor) | KIRP (normal) |
| FCER1A, SP1, VAV1, SYK, YY1, SPI1, PDHB, ELF1, MS4A2, FCER1G, ITIH2 (tumor) | FCER1A, SP1, VAV1, SYK, YY1, SPI1, PDHB, ELF1, MS4A2, FCER1G, ITIH2 (normal) |
 |  |
| LIHC (tumor) | LIHC (normal) |
| FCER1A, SP1, VAV1, SYK, YY1, SPI1, PDHB, ELF1, MS4A2, FCER1G, ITIH2 (tumor) | FCER1A, SP1, VAV1, SYK, YY1, SPI1, PDHB, ELF1, MS4A2, FCER1G, ITIH2 (normal) |
 |  |
| LUAD (tumor) | LUAD (normal) |
| FCER1A, SP1, VAV1, SYK, YY1, SPI1, PDHB, ELF1, MS4A2, FCER1G, ITIH2 (tumor) | FCER1A, SP1, VAV1, SYK, YY1, SPI1, PDHB, ELF1, MS4A2, FCER1G, ITIH2 (normal) |
 |  |
| LUSC (tumor) | LUSC (normal) |
| FCER1A, SP1, VAV1, SYK, YY1, SPI1, PDHB, ELF1, MS4A2, FCER1G, ITIH2 (tumor) | FCER1A, SP1, VAV1, SYK, YY1, SPI1, PDHB, ELF1, MS4A2, FCER1G, ITIH2 (normal) |
 |  |
| PRAD (tumor) | PRAD (normal) |
| FCER1A, SP1, VAV1, SYK, YY1, SPI1, PDHB, ELF1, MS4A2, FCER1G, ITIH2 (tumor) | FCER1A, SP1, VAV1, SYK, YY1, SPI1, PDHB, ELF1, MS4A2, FCER1G, ITIH2 (normal) |
 |  |
| STAD (tumor) | STAD (normal) |
| FCER1A, SP1, VAV1, SYK, YY1, SPI1, PDHB, ELF1, MS4A2, FCER1G, ITIH2 (tumor) | FCER1A, SP1, VAV1, SYK, YY1, SPI1, PDHB, ELF1, MS4A2, FCER1G, ITIH2 (normal) |
 |  |
| THCA (tumor) | THCA (normal) |
| FCER1A, SP1, VAV1, SYK, YY1, SPI1, PDHB, ELF1, MS4A2, FCER1G, ITIH2 (tumor) | FCER1A, SP1, VAV1, SYK, YY1, SPI1, PDHB, ELF1, MS4A2, FCER1G, ITIH2 (normal) |
 |  |
| Top |
| TissGeneProg for FCER1A |
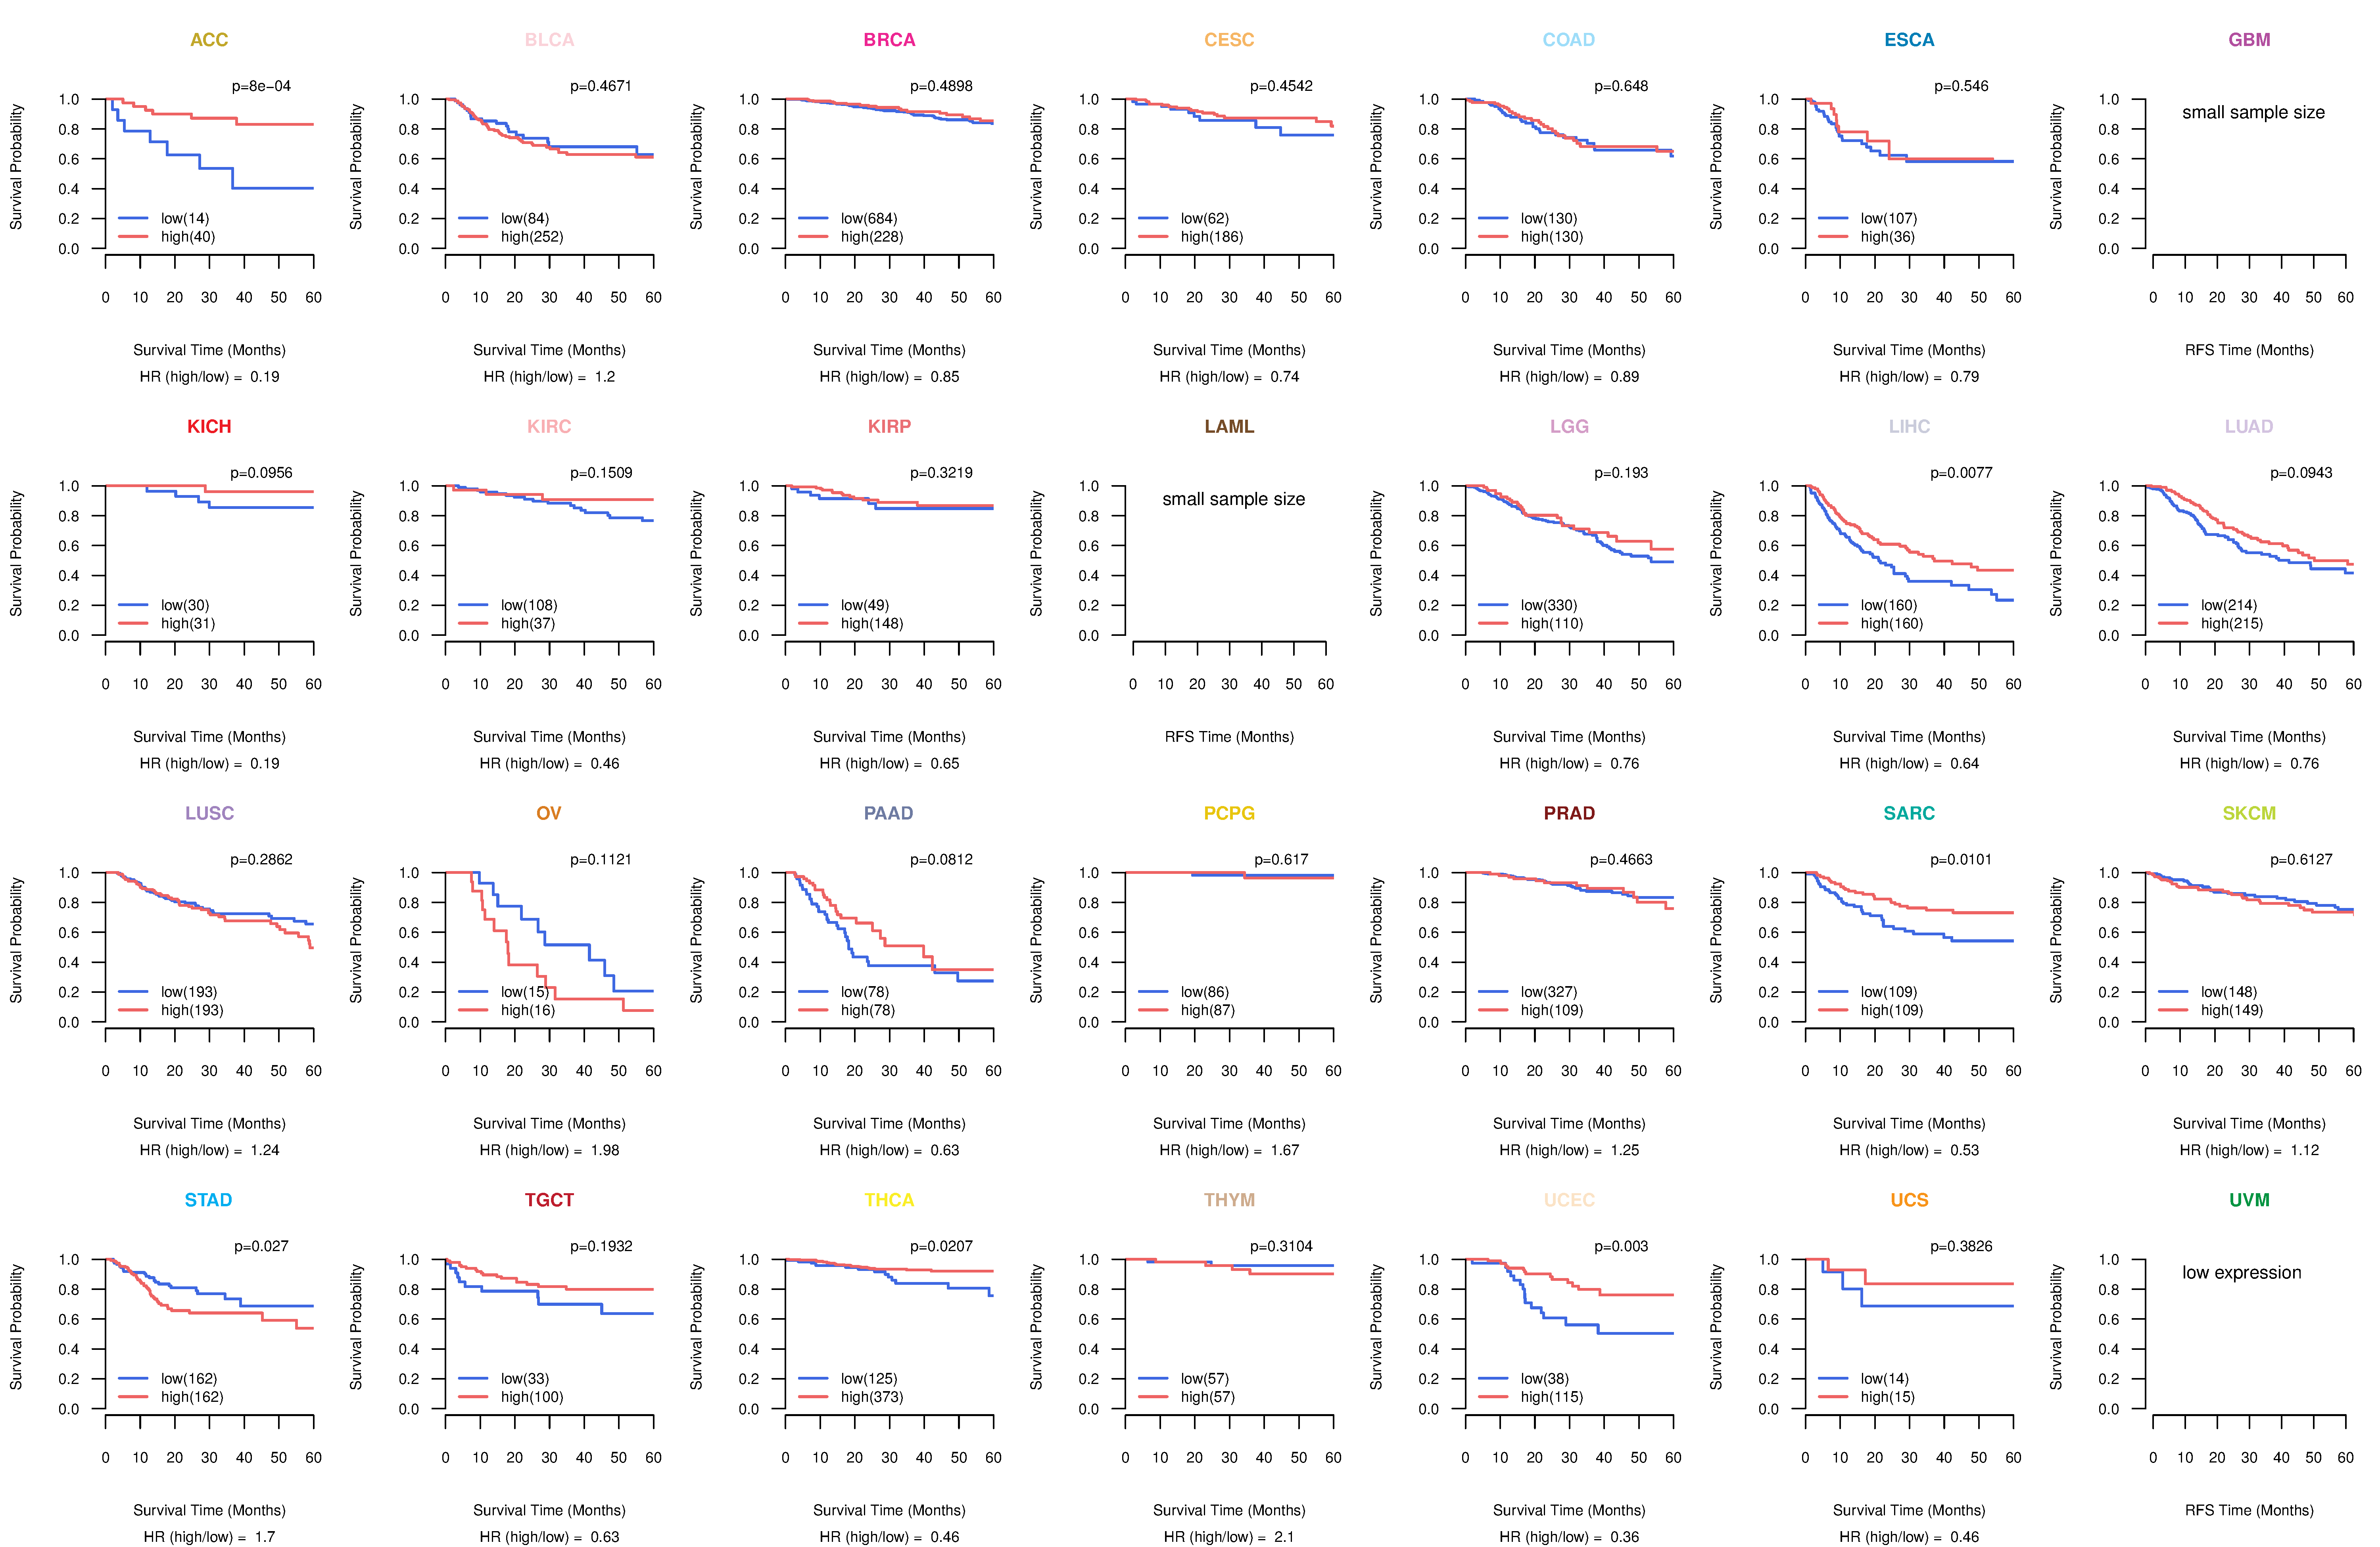
| Kaplan-Meier plots with logrank tests of overall survival (OS) using 28 cancer types (TCGA IlluminaHiSeq_RNASeqV2, pan-cancer normalized log2(norm_counts+1) data, version 2016-08-16) (TCGA clinicalMatrix, phenotype data, version 2016-04-27) * Click on the image to enlarge it in a new window. |
 |
| Kaplan-Meier plots with logrank test of relapse free survival (RFS) using 28 cancer types (TCGA IlluminaHiSeq_RNASeqV2, pan-cancer normalized log2(norm_counts+1) data, version 2016-08-16) (TCGA clinicalMatrix, phenotype data, version 2016-04-27) * Click on the image enlarge it in a new window. |
 |
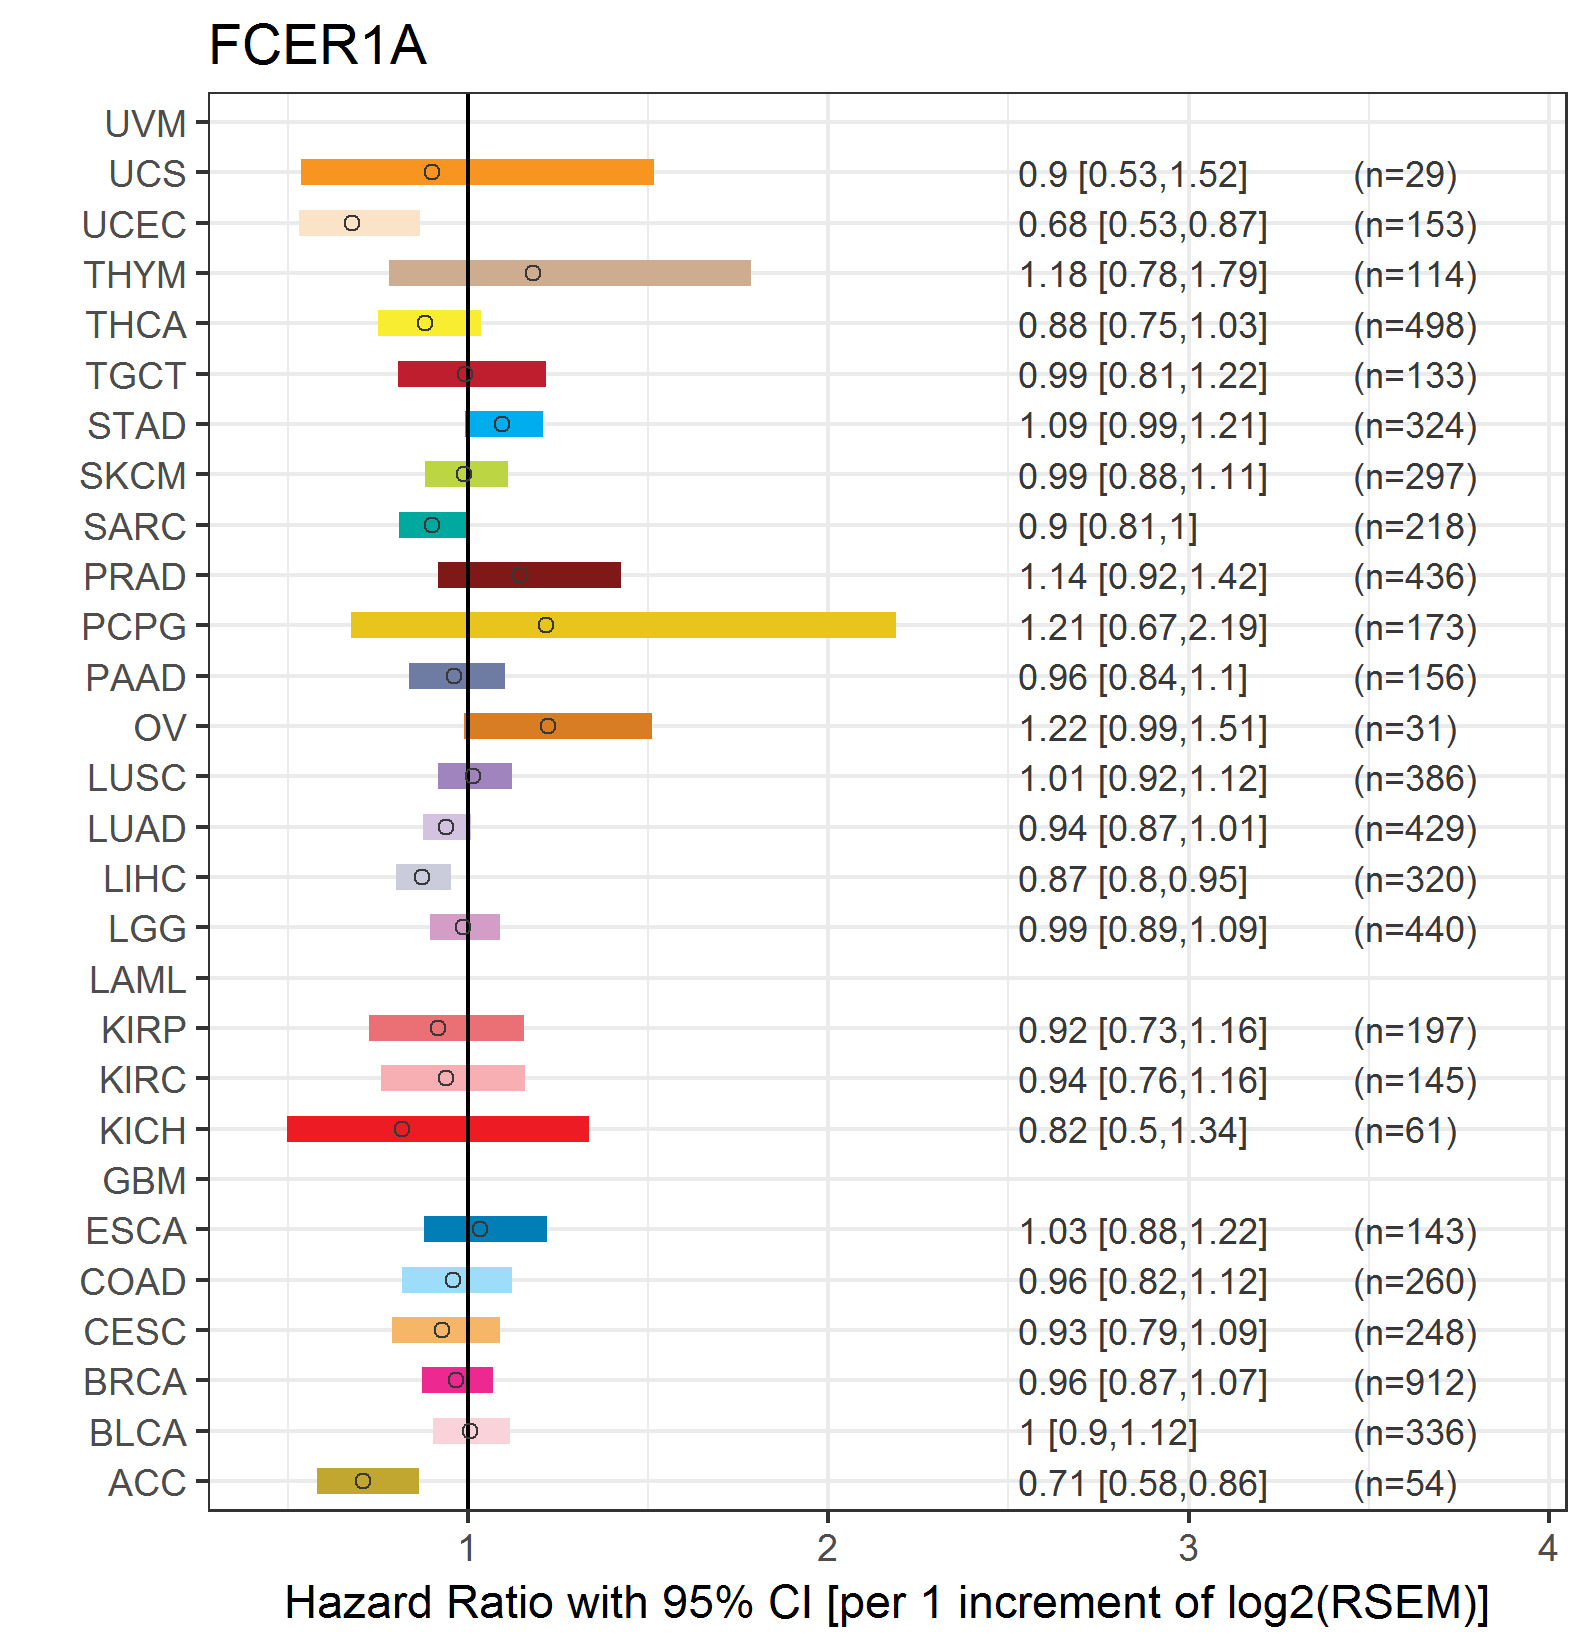
| Forest plot of Cox proportional hazard ratio (HR) and 95% CI of overall survival (OS) using 28 cancer types (TCGA IlluminaHiSeq_RNASeqV2, pan-cancer normalized log2(norm_counts+1) data, version 2016-08-16) (TCGA clinicalMatrix, phenotype data, version 2016-04-27) * Click on the image enlarge it in a new window. |
 |
| Forest plot of Cox proportional hazard ratio (HR) and 95% CI of relapse free survival (RFS) using 28 cancer types (TCGA IlluminaHiSeq_RNASeqV2, pan-cancer normalized log2(norm_counts+1) data, version 2016-08-16) (TCGA clinicalMatrix, phenotype data, version 2016-04-27) * Click on the image enlarge it in a new window. |
 |
| Top |
| TissGeneClin for FCER1A |
| TissGeneDrug for FCER1A |
| Drug information targeting TissGene (DrugBank Version 5.0.6, 2017-04-01) |
| DrugBank ID | Drug name | Drug activity | Drug type | Drug status |
| DB00895 | Benzylpenicilloyl Polylysine | Agonist | Small molecule | Approved |
| DB00043 | Omalizumab | Biotech | Approved|Investigational |
| Top |
| TissGeneDisease for FCER1A |
| Disease information associated with TissGene (DisGeNet, 2016-06-01) |
| Disease ID | Disease name | # pubmeds | Source |
| umls:C0004096 | Asthma | 8 | BeFree,GAD,LHGDN |
| umls:C0042109 | Urticaria | 4 | BeFree,CTD_human,LHGDN |
| umls:C0011615 | Dermatitis, Atopic | 3 | BeFree,GAD,LHGDN |
| umls:C0013595 | Eczema | 3 | BeFree,GAD |
| umls:C3662483 | Allergic sensitization | 3 | BeFree |
| umls:C0013182 | Drug Allergy | 2 | CTD_human |
| umls:C0031099 | Periodontitis | 2 | GAD |
| umls:C3539909 | Allergic disposition | 2 | BeFree |
| umls:C0006142 | Malignant neoplasm of breast | 1 | BeFree,GAD |
| umls:C0006274 | Bronchiolitis, Viral | 1 | GAD |
| umls:C0007222 | Cardiovascular Diseases | 1 | GAD |
| umls:C0011609 | Drug Eruptions | 1 | CTD_human |
| umls:C0017638 | Glioma | 1 | BeFree |
| umls:C0021390 | Inflammatory Bowel Diseases | 1 | GAD |
| umls:C0023418 | leukemia | 1 | LHGDN |
| umls:C0035235 | Respiratory Syncytial Virus Infections | 1 | GAD |
| umls:C0035455 | Rhinitis | 1 | BeFree |
| umls:C0162871 | Aortic Aneurysm, Abdominal | 1 | BeFree |
| umls:C0678222 | Breast Carcinoma | 1 | BeFree |
| umls:C0850803 | Anaphylaxis (non medication) | 1 | BeFree |
| umls:C1956346 | Coronary Artery Disease | 1 | GAD |
| umls:C2607914 | Allergic rhinitis (disorder) | 1 | BeFree |
| umls:C3495801 | Granulomatosis with polyangiitis | 1 | GAD |
|
Copyright 2016-Present - The University of Texas Health Science Center at Houston (UTHealth) Web File Viewing | How to Report, Fraud, Waste and Abuse | State of Texas | Statewide Search | Texas Homeland Security | Site Policies |