 |
| |
| |
| |
| |
| |
| |
|

| TissGeneSummary for ALDH3B1 |
 Gene summary Gene summary |
| Basic gene information | Gene symbol | ALDH3B1 |
| Gene name | aldehyde dehydrogenase 3 family, member B1 | |
| Synonyms | ALDH4|ALDH7 | |
| Cytomap | UCSC genome browser: 11q13 | |
| Type of gene | protein-coding | |
| RefGenes | NM_000694.3, NM_001030010.2,NM_001161473.2,NM_001290058.1,NM_001290059.1, | |
| Description | aldehyde dehydrogenase 3B1aldehyde dehydrogenase 7aldehyde dehydrogenase family 3 member B1 | |
| Modification date | 20141207 | |
| dbXrefs | MIM : 600466 | |
| HGNC : HGNC | ||
| Ensembl : ENSG00000006534 | ||
| HPRD : 02716 | ||
| Vega : OTTHUMG00000154910 | ||
| Protein | UniProt: go to UniProt's Cross Reference DB Table | |
| Expression | CleanEX: HS_ALDH3B1 | |
| BioGPS: 221 | ||
| Pathway | NCI Pathway Interaction Database: ALDH3B1 | |
| KEGG: ALDH3B1 | ||
| REACTOME: ALDH3B1 | ||
| Pathway Commons: ALDH3B1 | ||
| Context | iHOP: ALDH3B1 | |
| ligand binding site mutation search in PubMed: ALDH3B1 | ||
| UCL Cancer Institute: ALDH3B1 | ||
| Assigned class in TissGDB* | C | |
| Included tissue-specific gene expression resources | TiGER,GTEx | |
| Specific-tissues in normal samples (assigned by TissGDB using HPA, TiGER, and GTEx) | CervixLung | |
| Cancer types related to the specific-tissues in cancer samples (assigned by TissGDB using TCGA) | CESCLUAD,LUSC | |
| Reference showing the relevant tissue of ALDH3B1 | ||
| Description by TissGene annotations | TissgsLTS | |
| * Class A consists of genes with literature evidence and is part of the cTissGenes. Class B consists of only cTissGenes without additional evidence. The remaining genes belong to Class C. |
| Gene ontology having evidence of Inferred from Direct Assay (IDA) from Entrez |
| GO ID | GO term | PubMed ID | GO:0034599 | cellular response to oxidative stress | 20699116 | GO:0046185 | aldehyde catabolic process | 20699116 | GO:0055114 | oxidation-reduction process | 20699116 | GO:0034599 | cellular response to oxidative stress | 20699116 | GO:0046185 | aldehyde catabolic process | 20699116 | GO:0055114 | oxidation-reduction process | 20699116 |
| Top |
| TissGeneExp for ALDH3B1 |
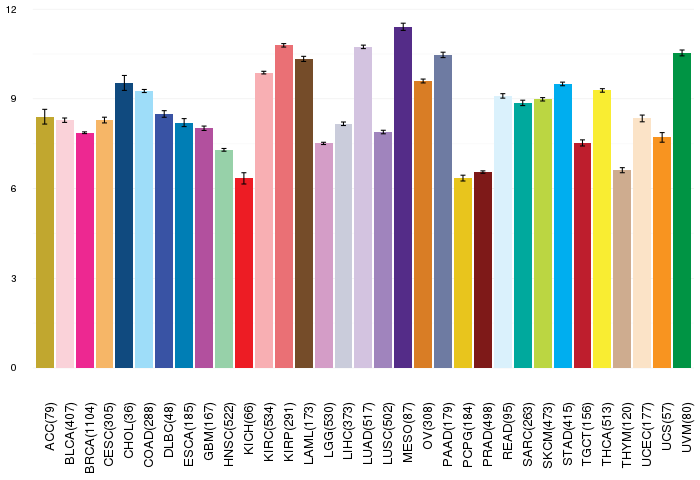
| Gene expressions across 28 cancer types (X-axis: cancer type and Y-axis: log2(norm_counts+1)) (TCGA IlluminaHiSeq_RNASeqV2, pan-cancer normalized log2(norm_counts+1) data, version 2016-08-16) |
 |
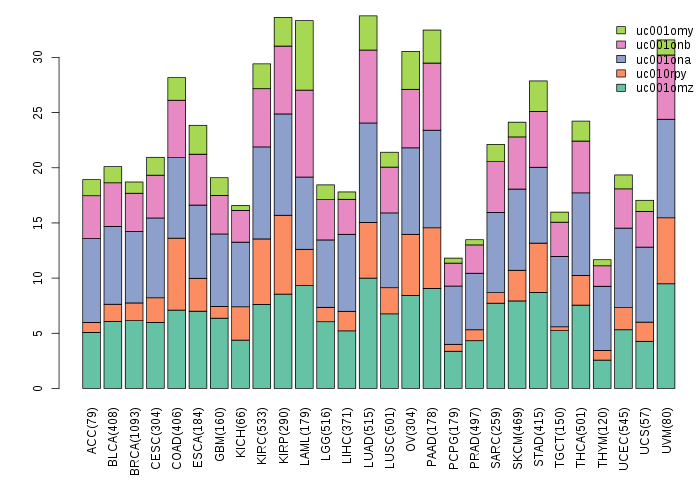
| Gene isoform expressions across 28 cancer types (X-axis: cancer type and Y-axis: log2(norm_counts+1)) (TCGA pan-cancer tcga_rsem_isoform_tpm, version 2016-09-01) |
 |
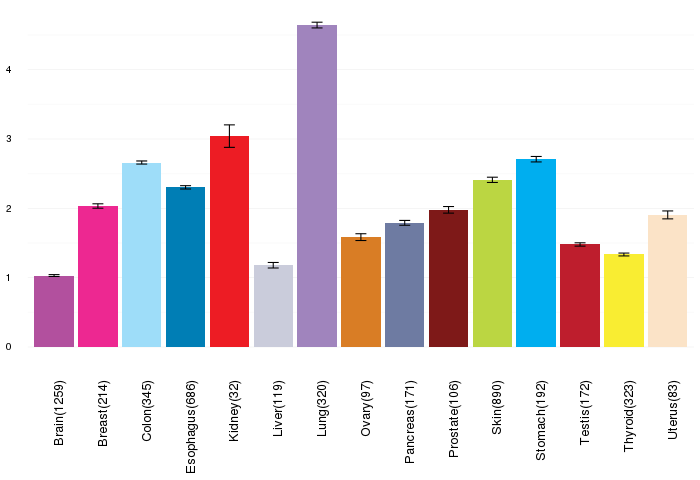
| Gene expressions across normal tissues of GTEx data (GTEx GTEx_Analysis_v6_RNA-seq_RNA-SeQCv1.1.8_gene_rpkm.gct) - Here, we shows the matched tissue types only among our 28 cancer types. |
 |
| Different expressions across 14 cancer types with more than 10 samples between matched tumors and normals (X-axis: cancer type and Y-axis: log2(norm_counts+1)) (TCGA IlluminaHiSeq_RNASeqV2, pan-cancer normalized log2(norm_counts+1) data, version 2016-08-16) |
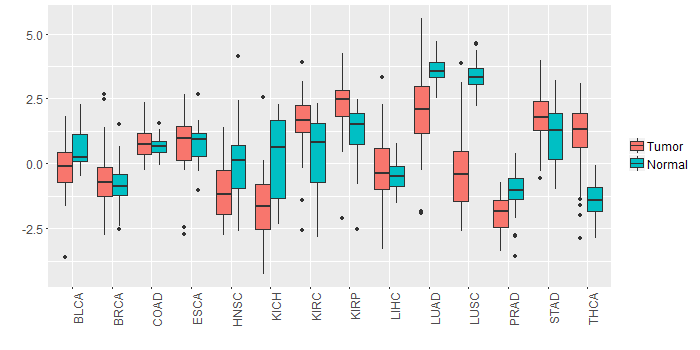 |
| - Significantly differentially expressed cancer types and information. (|Fold change|>1 and FDR<0.05) |
| Cancer type | Mean(exp) in tumor | Mean(exp) in matched normal | Log2FC | P-val. | FDR |
| LUAD | 2.043239217 | 3.598561631 | -1.555322414 | 8.65E-11 | 5.20E-10 |
| THCA | 0.987320398 | -1.405211806 | 2.392532203 | 4.75E-21 | 2.45E-19 |
| LUSC | -0.366657402 | 3.352807304 | -3.719464706 | 3.68E-28 | 1.24E-26 |
| KIRC | 1.610170539 | 0.437728872 | 1.172441667 | 3.64E-08 | 1.04E-07 |
| KIRP | 2.191866372 | 1.133781997 | 1.058084375 | 0.000863 | 0.002421584 |
| HNSC | -1.033238569 | -0.018417639 | -1.01482093 | 0.000135 | 0.000584135 |
| KICH | -1.684531128 | 0.114788872 | -1.79932 | 0.000164 | 0.000411213 |
| Top |
| TissGene-miRNA for ALDH3B1 |
| Significantly anti-correlated miRNAs of TissGene across 28 cancer types (Gene-miRNA relations from TargetScanHuman Relsease 7.1, Conserved_Site_Context_Scores.txt.zip, 06.01.2016) (TCGA IlluminaHiSeq_miRNASeq, log2(RPM+1) data, version 2016-11-21) (TCGA IlluminaHiSeq_RNASeqV2, log2(normalized_count+1) data, version 2016-08-16) (Spearman’s Rank Correlation (p-value<0.05 and coefficient<-0.25)) |
| Cancer type | miRNA id | miRNA accession | P-val. | Coeff. | # samples |
| Top |
| TissGeneMut for ALDH3B1 |
| TissGeneSNV for ALDH3B1 |
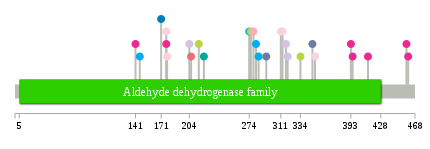
| nsSNV counts per each loci. Different colors of circles represent different cancer types. Circle size denotes number of samples. (TCGA somatic mutation (SNPs and small INDELs) data, version 2016-04-25) * Click on the image to enlarge it in a new window. |
 |
 |
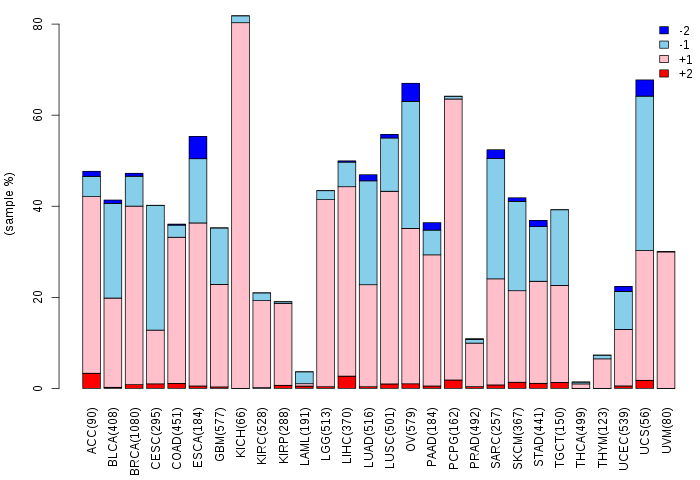
| Somatic nucleotide variants of TissGene across 28 cancer types (X-axis: cancer type and Y-axis: % of mutated samples) The numbers in parentheses are numbers of samples with mutation (nsSNVs). (TCGA somatic mutation (SNPs and small INDELs) data, version 2016-04-25) |
 |
| - nsSNVs sorted by frequency. |
| AAchange | Cancer type | # samples |
| p.I285T | STAD | 1 |
| p.Q308* | HNSC | 1 |
| p.E351K | BLCA | 1 |
| p.E348A | PAAD | 1 |
| p.L282R | STAD | 1 |
| p.V206F | KIRP | 1 |
| p.E177Q | BLCA | 1 |
| p.E177Q | BRCA | 1 |
| p.A221S | SARC | 1 |
| p.F334L | SKCM | 1 |
| p.P215H | SKCM | 1 |
| p.R294W | PAAD | 1 |
| p.G168R | HNSC | 1 |
| p.D313N | BLCA | 1 |
| p.S204* | LUAD | 1 |
| p.D311N | BLCA | 1 |
| p.T319K | LUAD | 1 |
| p.P413Q | BRCA | 1 |
| p.E178Q | BLCA | 1 |
| p.Q458P | BRCA | 1 |
| p.M393I | BRCA | 1 |
| p.D274N | STAD | 1 |
| p.P279R | KIRC | 1 |
| p.Q276* | SKCM | 1 |
| p.Q306* | HNSC | 1 |
| p.V146I | STAD | 1 |
| p.T317K | LUAD | 1 |
| p.D395H | BRCA | 1 |
| p.Q460P | BRCA | 1 |
| p.E171D | ESCA | 1 |
| p.E141Q | BRCA | 1 |
| Top |
| TissGeneCNV for ALDH3B1 |
| Copy number variations of TissGene across 28 cancer types (X-axis: cancer type and Y-axis: % of CNV samples) (TCGA Gistic2_CopyNumber_Gistic2_all_data_by_genes, Gistic2 copy number data, version 2016-08-16) |
 |
| Top |
| TissGeneFusions for ALDH3B1 |
| Fusion genes including TissGene (ChimerDB 3.0, 2016-12-01 and TCGA fusion Portal 2015-12-01) |
| Database | Src | Cancer type | Sample | Fusion gene | ORF | 5'-gene BP | 3'-gene BP |
| Chimerdb3.0 | ChiTaRs | NA | AK129943 | PI4K2A-ALDH3B1 | chr10:99374414 | chr11:67787229 | |
| Chimerdb3.0 | FusionScan | LUSC | TCGA-43-6771-01A | PPFIA1-ALDH3B1 | In-Frame | chr11:70189998 | chr11:67795216 |
| Top |
| TissGeneNet for ALDH3B1 |
| Co-expressed gene networks based on protein-protein interaction data (CePIN) (TCGA IlluminaHiSeq_RNASeqV2, pan-cancer normalized log2(norm_counts+1) data, version 2016-08-16) (PINA2 ppi data) |
| Top |
| TissGeneProg for ALDH3B1 |
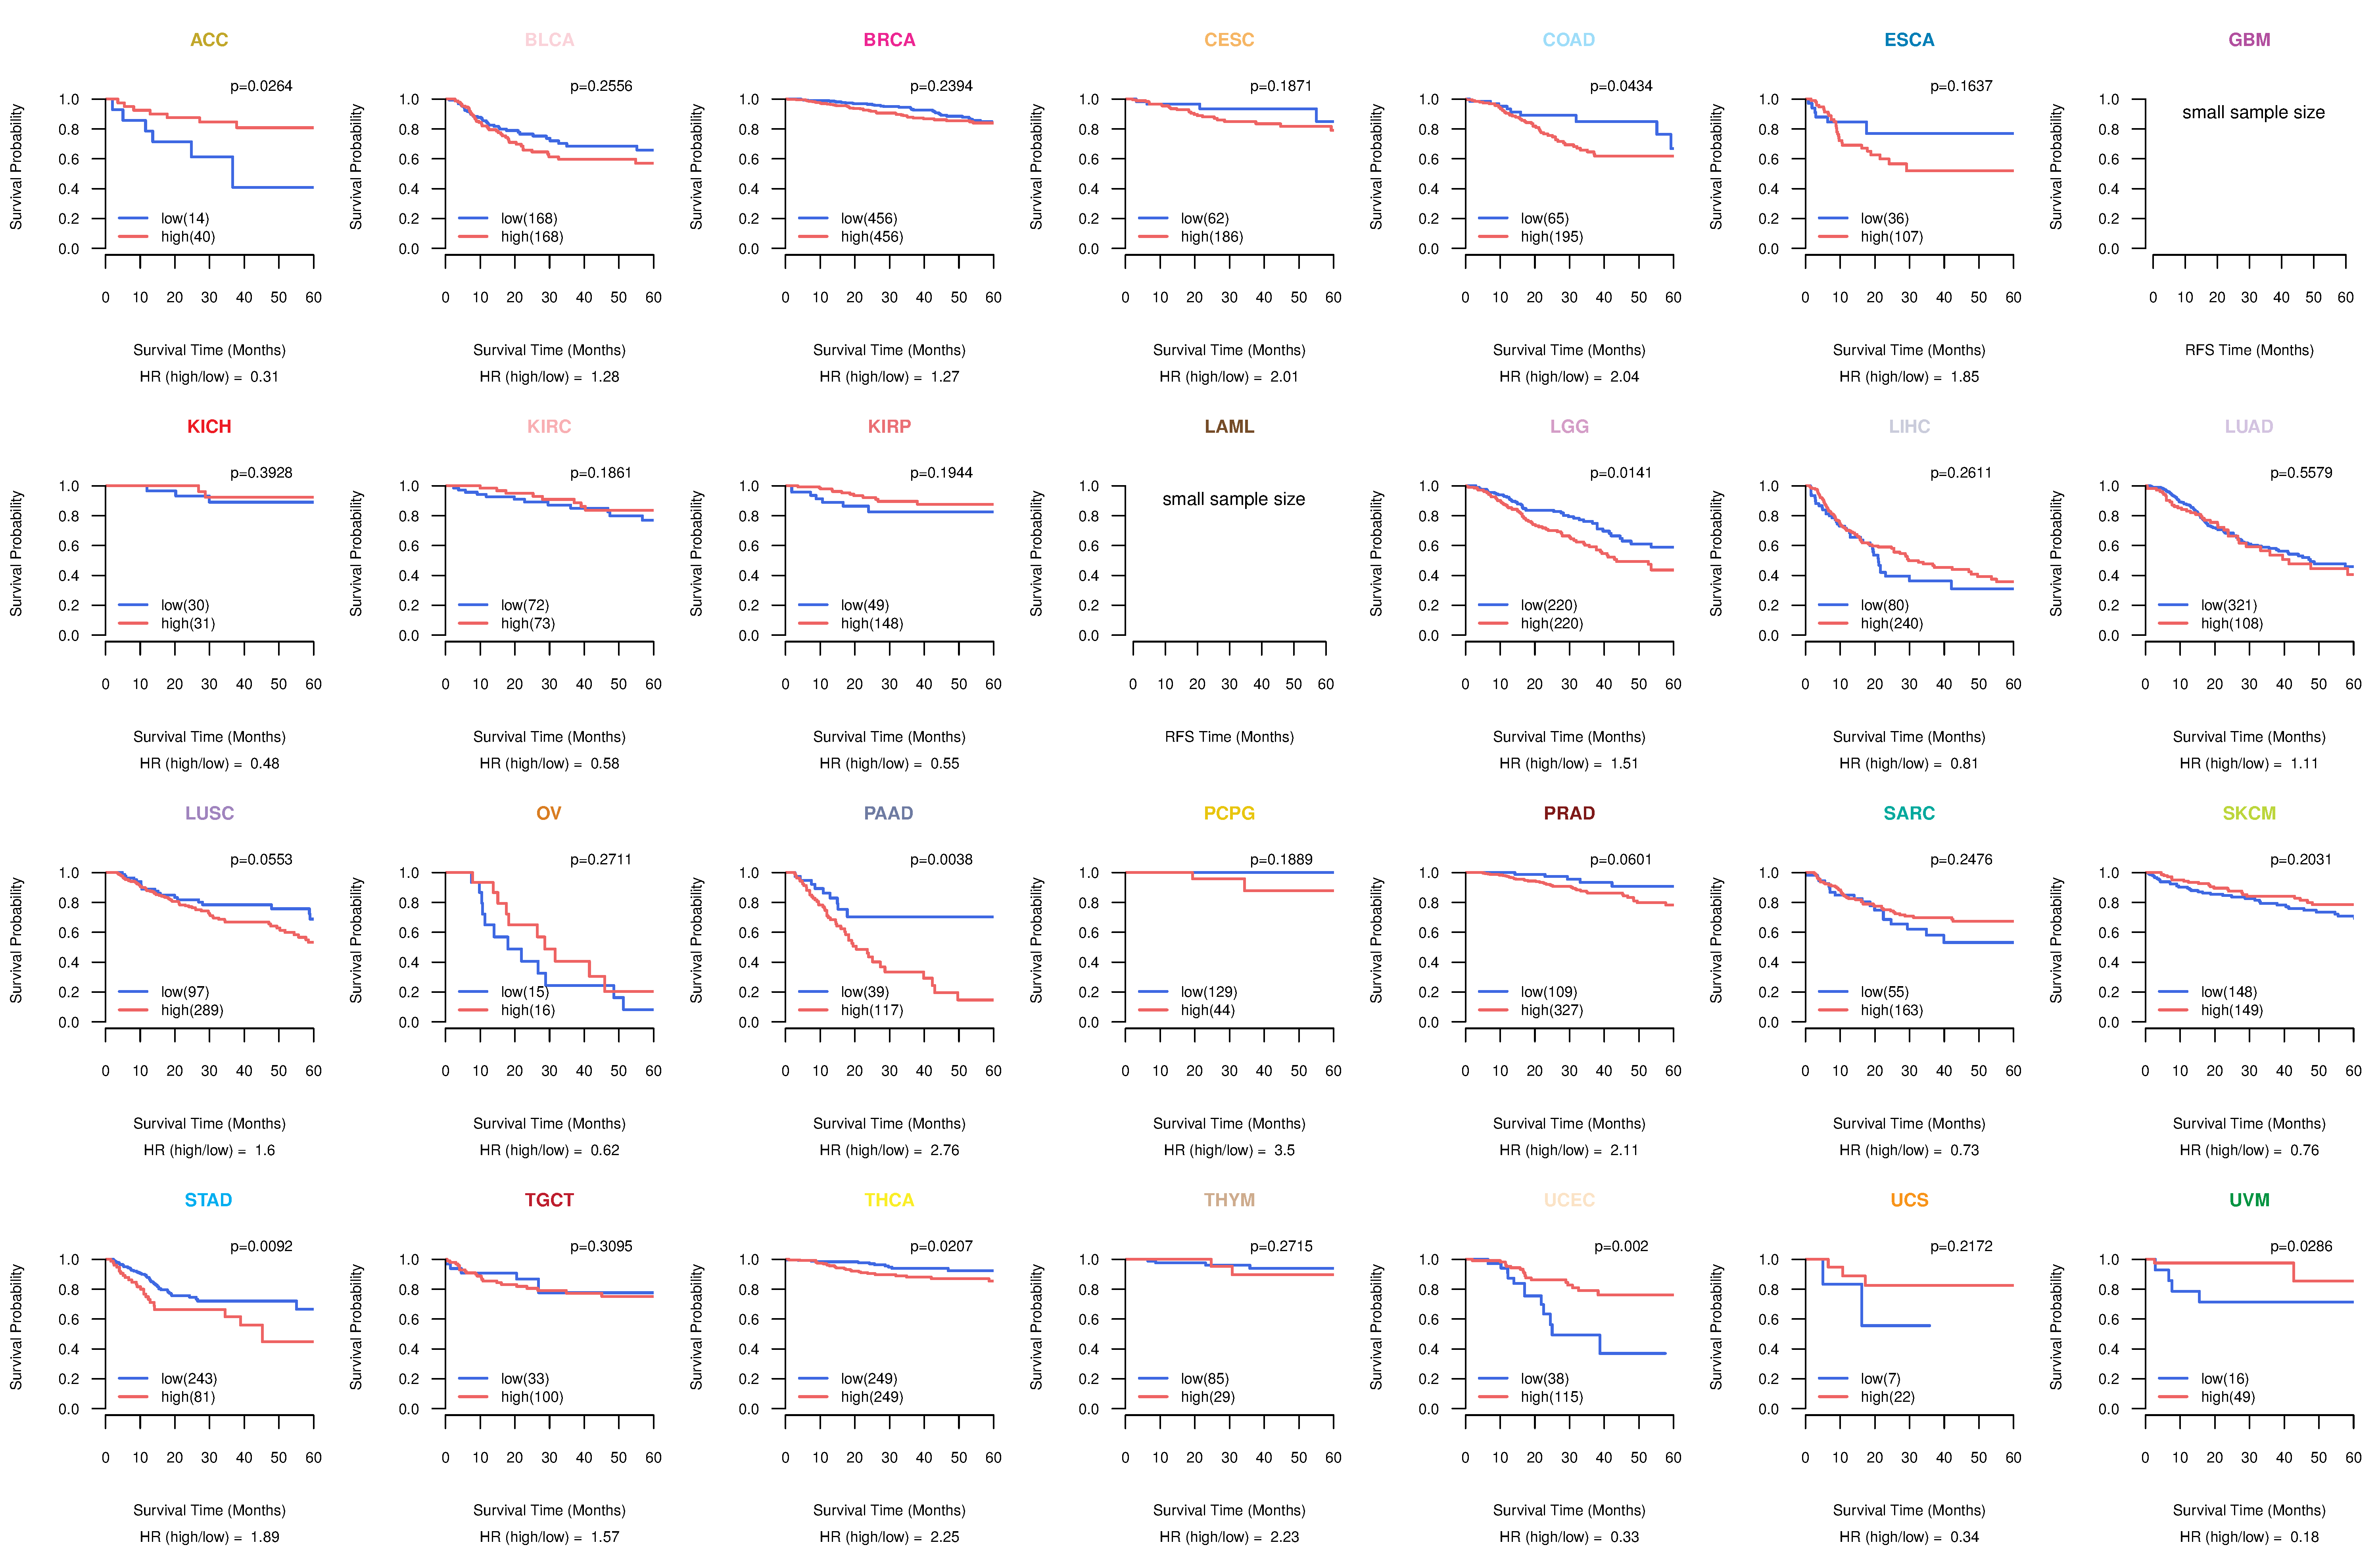
| Kaplan-Meier plots with logrank tests of overall survival (OS) using 28 cancer types (TCGA IlluminaHiSeq_RNASeqV2, pan-cancer normalized log2(norm_counts+1) data, version 2016-08-16) (TCGA clinicalMatrix, phenotype data, version 2016-04-27) * Click on the image to enlarge it in a new window. |
 |
| Kaplan-Meier plots with logrank test of relapse free survival (RFS) using 28 cancer types (TCGA IlluminaHiSeq_RNASeqV2, pan-cancer normalized log2(norm_counts+1) data, version 2016-08-16) (TCGA clinicalMatrix, phenotype data, version 2016-04-27) * Click on the image enlarge it in a new window. |
 |
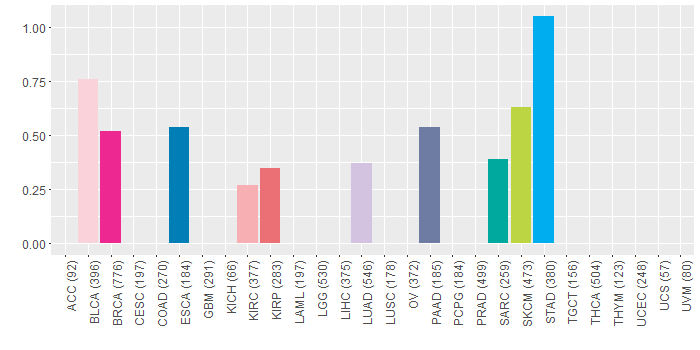
| Forest plot of Cox proportional hazard ratio (HR) and 95% CI of overall survival (OS) using 28 cancer types (TCGA IlluminaHiSeq_RNASeqV2, pan-cancer normalized log2(norm_counts+1) data, version 2016-08-16) (TCGA clinicalMatrix, phenotype data, version 2016-04-27) * Click on the image enlarge it in a new window. |
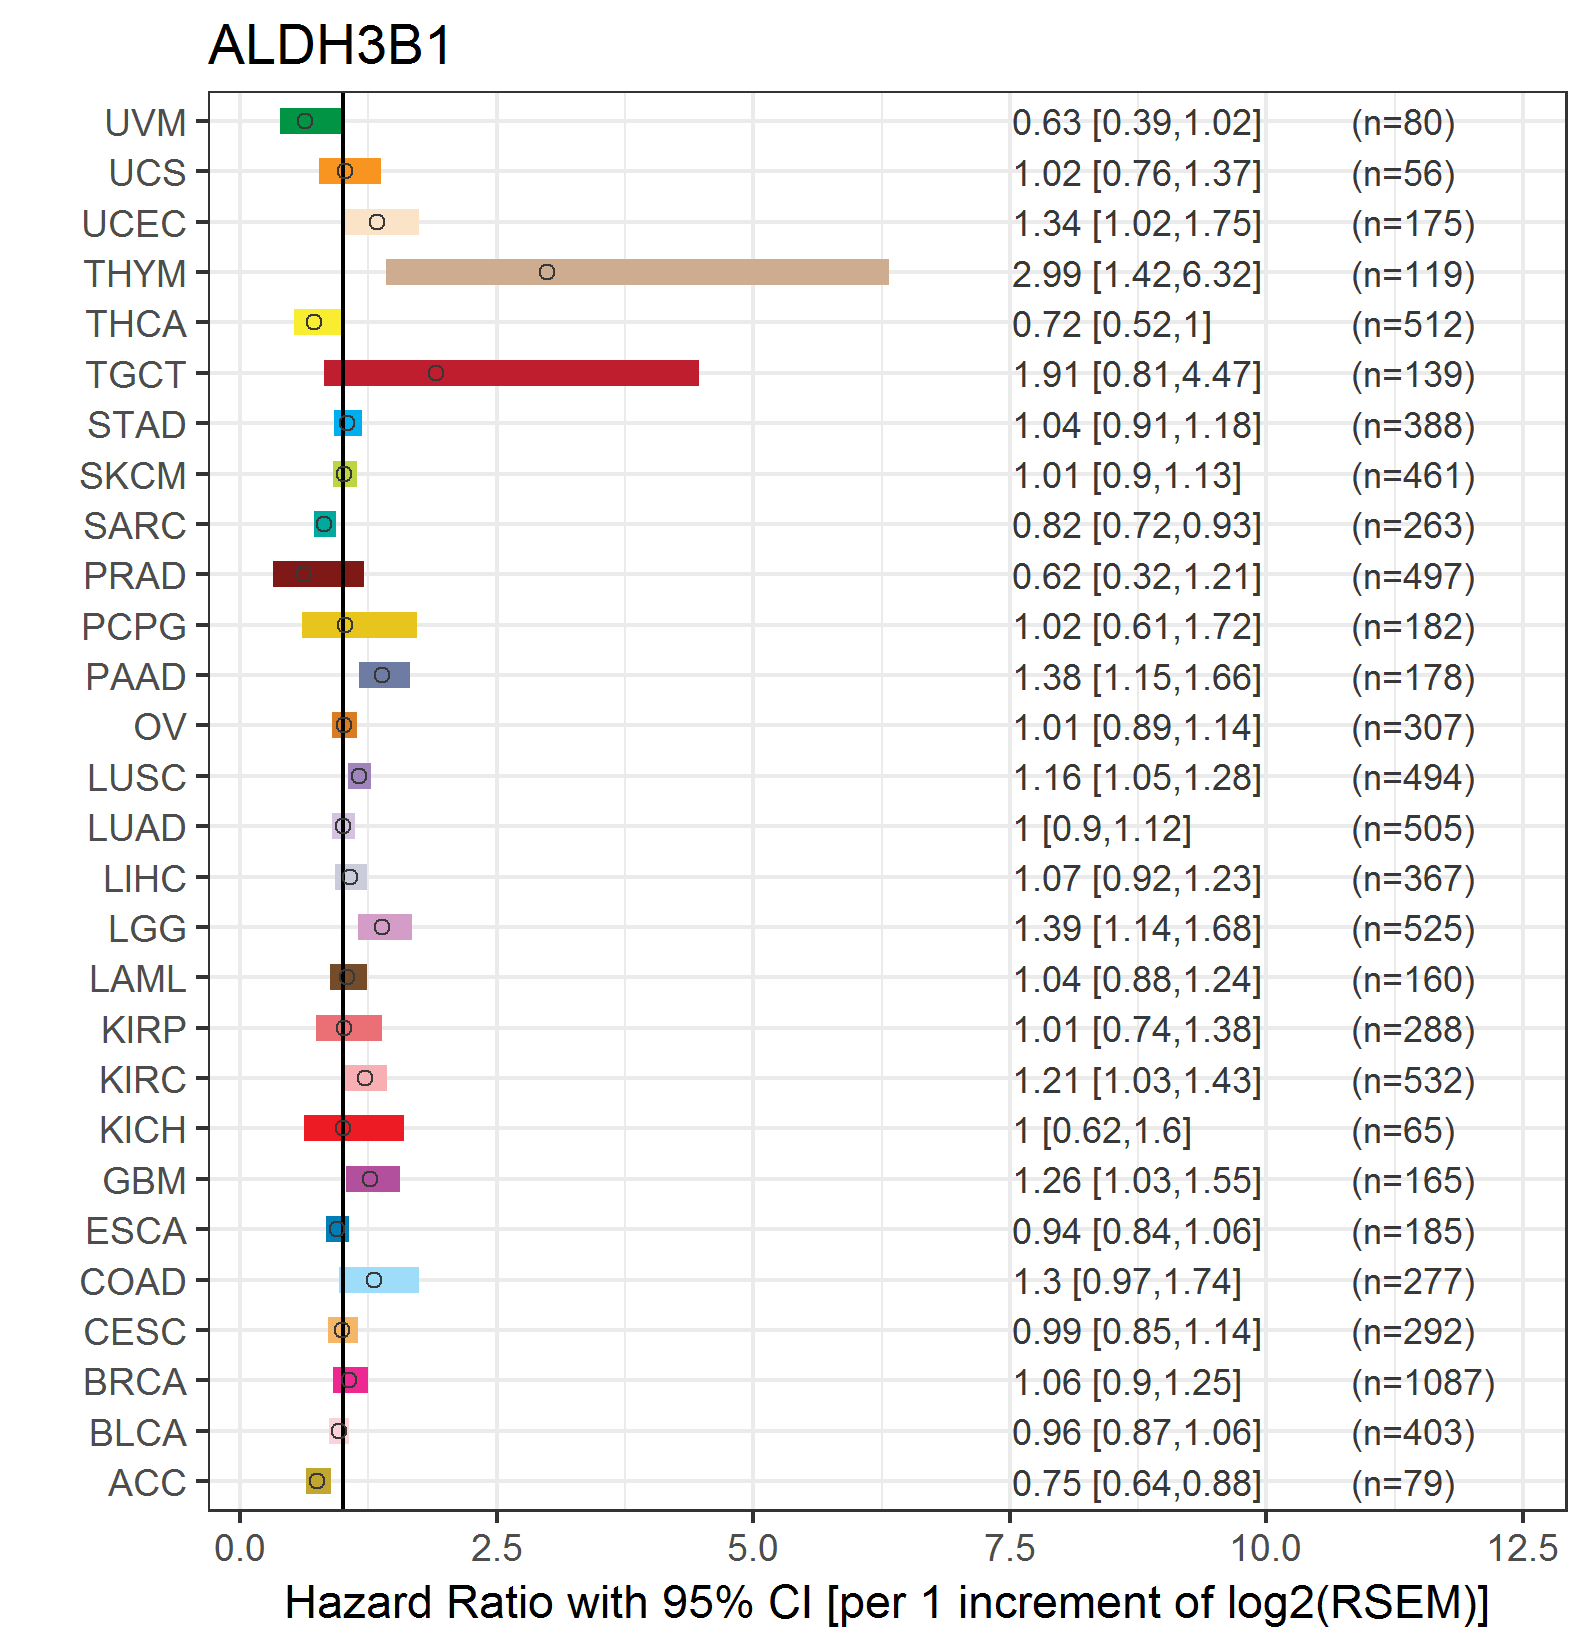 |
| Forest plot of Cox proportional hazard ratio (HR) and 95% CI of relapse free survival (RFS) using 28 cancer types (TCGA IlluminaHiSeq_RNASeqV2, pan-cancer normalized log2(norm_counts+1) data, version 2016-08-16) (TCGA clinicalMatrix, phenotype data, version 2016-04-27) * Click on the image enlarge it in a new window. |
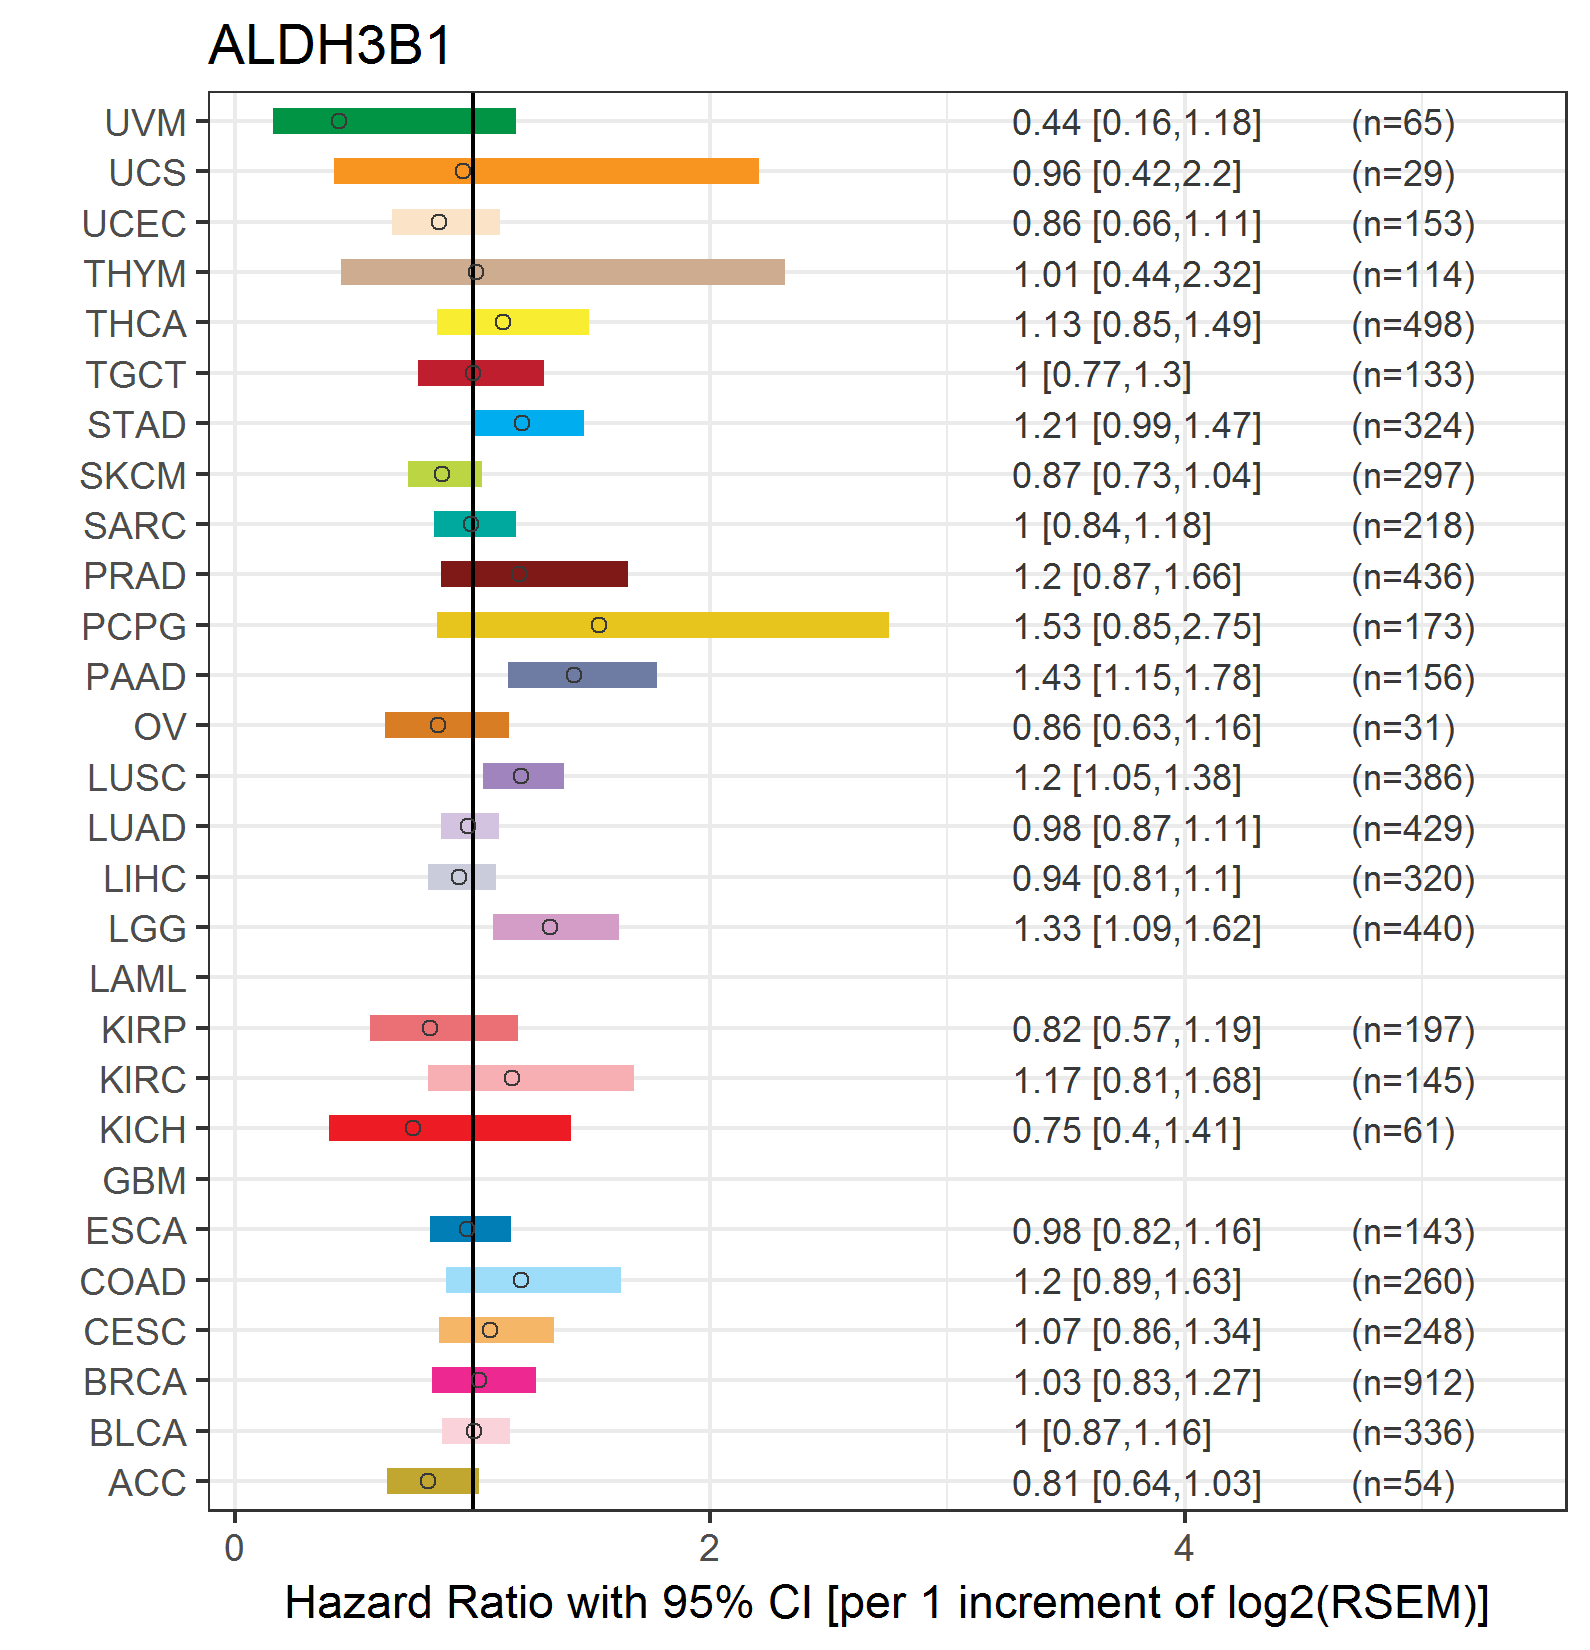 |
| Top |
| TissGeneClin for ALDH3B1 |
| TissGeneDrug for ALDH3B1 |
| Drug information targeting TissGene (DrugBank Version 5.0.6, 2017-04-01) |
| DrugBank ID | Drug name | Drug activity | Drug type | Drug status |
| Top |
| TissGeneDisease for ALDH3B1 |
| Disease information associated with TissGene (DisGeNet, 2016-06-01) |
| Disease ID | Disease name | # pubmeds | Source |
| umls:C0036341 | Schizophrenia | 2 | BeFree,GAD |
| umls:C0007134 | Renal Cell Carcinoma | 1 | BeFree |
| umls:C0011860 | Diabetes Mellitus, Non-Insulin-Dependent | 1 | BeFree |
| umls:C0018524 | Hallucinations | 1 | BeFree |
| umls:C0036349 | Paranoid Schizophrenia | 1 | BeFree |
|
Copyright 2016-Present - The University of Texas Health Science Center at Houston (UTHealth) Web File Viewing | How to Report, Fraud, Waste and Abuse | State of Texas | Statewide Search | Texas Homeland Security | Site Policies |