 |
| |
| |
| |
| |
| |
| |
|

| TissGeneSummary for GPC2 |
 Gene summary Gene summary |
| Basic gene information | Gene symbol | GPC2 |
| Gene name | glypican 2 | |
| Synonyms | - | |
| Cytomap | UCSC genome browser: 7q22.1 | |
| Type of gene | protein-coding | |
| RefGenes | NM_152742.1, | |
| Description | cerebroglycanglypican proteoglycan 2, cerebroglycan proteoglycanglypican-2 | |
| Modification date | 20141207 | |
| dbXrefs | HGNC : HGNC | |
| Ensembl : ENSG00000213420 | ||
| HPRD : 17051 | ||
| Vega : OTTHUMG00000154894 | ||
| Protein | UniProt: go to UniProt's Cross Reference DB Table | |
| Expression | CleanEX: HS_GPC2 | |
| BioGPS: 221914 | ||
| Pathway | NCI Pathway Interaction Database: GPC2 | |
| KEGG: GPC2 | ||
| REACTOME: GPC2 | ||
| Pathway Commons: GPC2 | ||
| Context | iHOP: GPC2 | |
| ligand binding site mutation search in PubMed: GPC2 | ||
| UCL Cancer Institute: GPC2 | ||
| Assigned class in TissGDB* | C | |
| Included tissue-specific gene expression resources | TiGER,GTEx | |
| Specific-tissues in normal samples (assigned by TissGDB using HPA, TiGER, and GTEx) | BrainTestis | |
| Cancer types related to the specific-tissues in cancer samples (assigned by TissGDB using TCGA) | GBM,LGGTGCT | |
| Reference showing the relevant tissue of GPC2 | ||
| Description by TissGene annotations | ||
| * Class A consists of genes with literature evidence and is part of the cTissGenes. Class B consists of only cTissGenes without additional evidence. The remaining genes belong to Class C. |
| Gene ontology having evidence of Inferred from Direct Assay (IDA) from Entrez |
| GO ID | GO term | PubMed ID |
| Top |
| TissGeneExp for GPC2 |
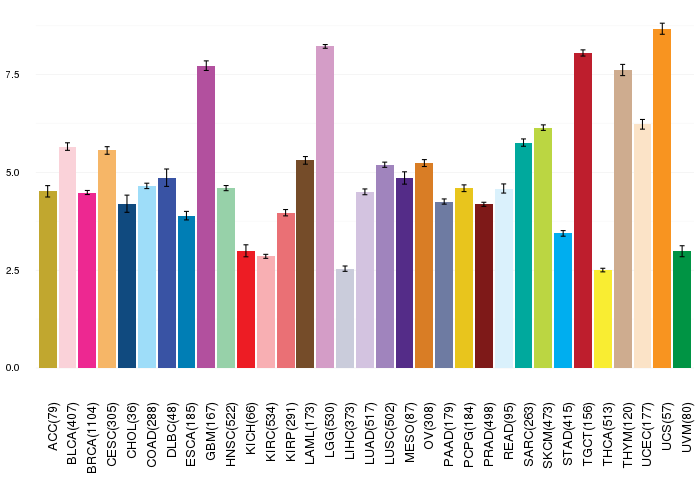
| Gene expressions across 28 cancer types (X-axis: cancer type and Y-axis: log2(norm_counts+1)) (TCGA IlluminaHiSeq_RNASeqV2, pan-cancer normalized log2(norm_counts+1) data, version 2016-08-16) |
 |
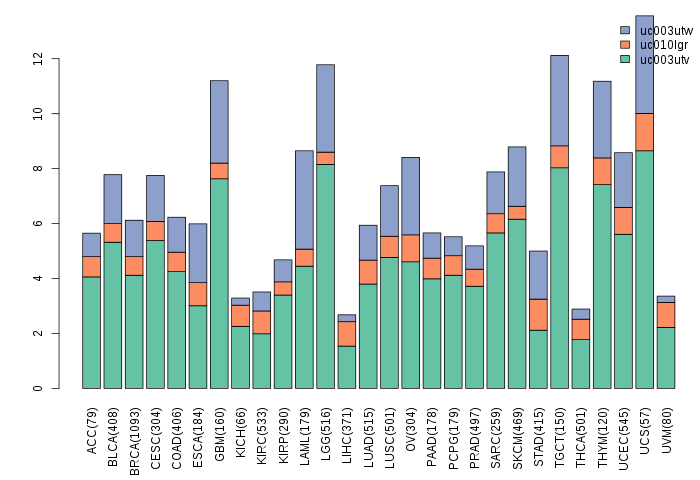
| Gene isoform expressions across 28 cancer types (X-axis: cancer type and Y-axis: log2(norm_counts+1)) (TCGA pan-cancer tcga_rsem_isoform_tpm, version 2016-09-01) |
 |
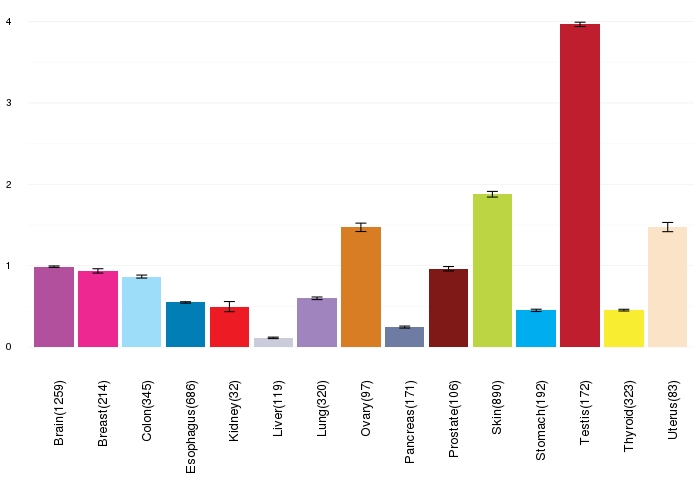
| Gene expressions across normal tissues of GTEx data (GTEx GTEx_Analysis_v6_RNA-seq_RNA-SeQCv1.1.8_gene_rpkm.gct) - Here, we shows the matched tissue types only among our 28 cancer types. |
 |
| Different expressions across 14 cancer types with more than 10 samples between matched tumors and normals (X-axis: cancer type and Y-axis: log2(norm_counts+1)) (TCGA IlluminaHiSeq_RNASeqV2, pan-cancer normalized log2(norm_counts+1) data, version 2016-08-16) |
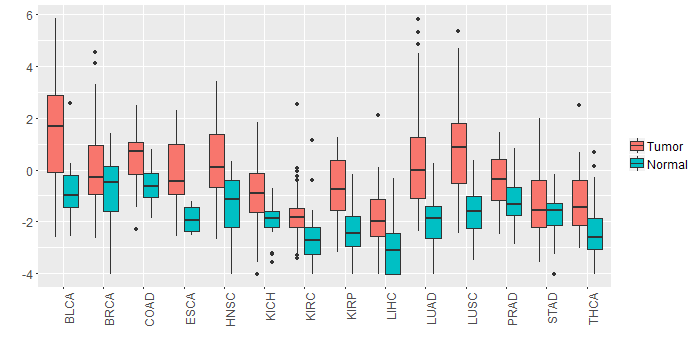 |
| - Significantly differentially expressed cancer types and information. (|Fold change|>1 and FDR<0.05) |
| Cancer type | Mean(exp) in tumor | Mean(exp) in matched normal | Log2FC | P-val. | FDR |
| LIHC | -1.791051125 | -2.986865125 | 1.195814 | 1.07E-07 | 7.54E-07 |
| LUAD | 0.296230323 | -1.96763347 | 2.263863793 | 5.29E-12 | 3.82E-11 |
| KIRP | -0.69200125 | -2.327435625 | 1.635434375 | 5.32E-08 | 3.44E-07 |
| LUSC | 0.868324914 | -1.649247635 | 2.517572549 | 5.50E-15 | 3.38E-14 |
| HNSC | 0.266485014 | -1.341294055 | 1.60777907 | 2.53E-07 | 2.23E-06 |
| THCA | -1.266442617 | -2.430617193 | 1.164174576 | 2.90E-08 | 1.35E-07 |
| ESCA | -0.19381858 | -1.890136762 | 1.696318182 | 0.00335 | 0.031043333 |
| KICH | -0.909433125 | -1.939389125 | 1.029956 | 0.00217 | 0.004424311 |
| BLCA | 1.515800559 | -0.790973125 | 2.306773684 | 0.000421 | 0.003493672 |
| COAD | 0.50291149 | -0.561919279 | 1.064830769 | 0.000174 | 0.000598484 |
| Top |
| TissGene-miRNA for GPC2 |
| Significantly anti-correlated miRNAs of TissGene across 28 cancer types (Gene-miRNA relations from TargetScanHuman Relsease 7.1, Conserved_Site_Context_Scores.txt.zip, 06.01.2016) (TCGA IlluminaHiSeq_miRNASeq, log2(RPM+1) data, version 2016-11-21) (TCGA IlluminaHiSeq_RNASeqV2, log2(normalized_count+1) data, version 2016-08-16) (Spearman’s Rank Correlation (p-value<0.05 and coefficient<-0.25)) |
| Cancer type | miRNA id | miRNA accession | P-val. | Coeff. | # samples |
| Top |
| TissGeneMut for GPC2 |
| TissGeneSNV for GPC2 |
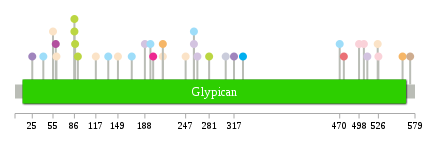
| nsSNV counts per each loci. Different colors of circles represent different cancer types. Circle size denotes number of samples. (TCGA somatic mutation (SNPs and small INDELs) data, version 2016-04-25) * Click on the image to enlarge it in a new window. |
 |
 |
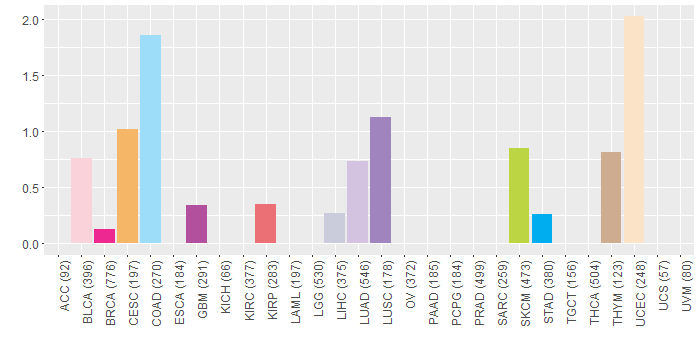
| Somatic nucleotide variants of TissGene across 28 cancer types (X-axis: cancer type and Y-axis: % of mutated samples) The numbers in parentheses are numbers of samples with mutation (nsSNVs). (TCGA somatic mutation (SNPs and small INDELs) data, version 2016-04-25) |
 |
| - nsSNVs sorted by frequency. |
| AAchange | Cancer type | # samples |
| p.R149* | UCEC | 1 |
| p.G505* | BLCA | 1 |
| p.G87S | SKCM | 1 |
| p.R214H | CESC | 1 |
| p.Y188* | LUAD | 1 |
| p.D91N | SKCM | 1 |
| p.R264Q | LUAD | 1 |
| p.S55T | UCEC | 1 |
| p.R470C | COAD | 1 |
| p.Q169R | COAD | 1 |
| p.R214H | UCEC | 1 |
| p.S247Y | UCEC | 1 |
| p.Y330C | STAD | 1 |
| p.R281C | SKCM | 1 |
| p.H561Y | CESC | 1 |
| p.A135V | COAD | 1 |
| p.R60W | UCEC | 1 |
| p.A317S | LUSC | 1 |
| p.E25* | LUSC | 1 |
| p.D510N | LUAD | 1 |
| p.D305N | LIHC | 1 |
| p.R86* | SKCM | 1 |
| p.R525Q | UCEC | 1 |
| p.G259S | COAD | 1 |
| p.P526S | BLCA | 1 |
| p.N386D | HNSC | 1 |
| p.A476E | KIRP | 1 |
| p.D498N | BLCA | 1 |
| p.A196V | COAD | 1 |
| p.A41V | COAD | 1 |
| p.L59F | GBM | 1 |
| p.D200N | BRCA | 1 |
| p.R86X | SKCM | 1 |
| p.A572T | THYM | 1 |
| p.V117I | UCEC | 1 |
| p.G259C | LUAD | 1 |
| Top |
| TissGeneCNV for GPC2 |
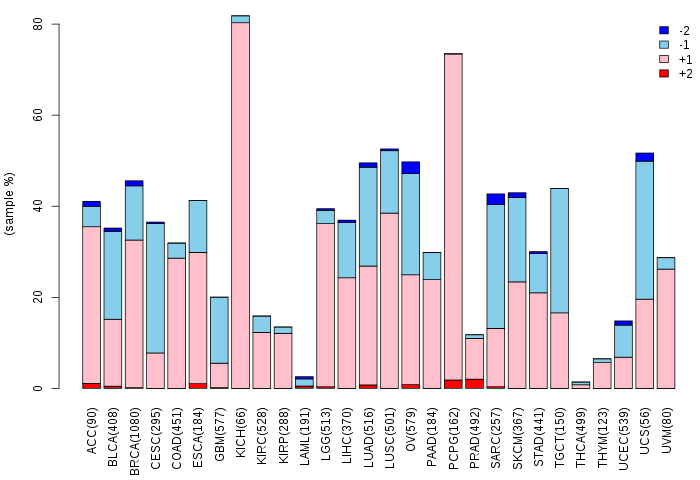
| Copy number variations of TissGene across 28 cancer types (X-axis: cancer type and Y-axis: % of CNV samples) (TCGA Gistic2_CopyNumber_Gistic2_all_data_by_genes, Gistic2 copy number data, version 2016-08-16) |
 |
| Top |
| TissGeneFusions for GPC2 |
| Fusion genes including TissGene (ChimerDB 3.0, 2016-12-01 and TCGA fusion Portal 2015-12-01) |
| Database | Src | Cancer type | Sample | Fusion gene | ORF | 5'-gene BP | 3'-gene BP |
| Top |
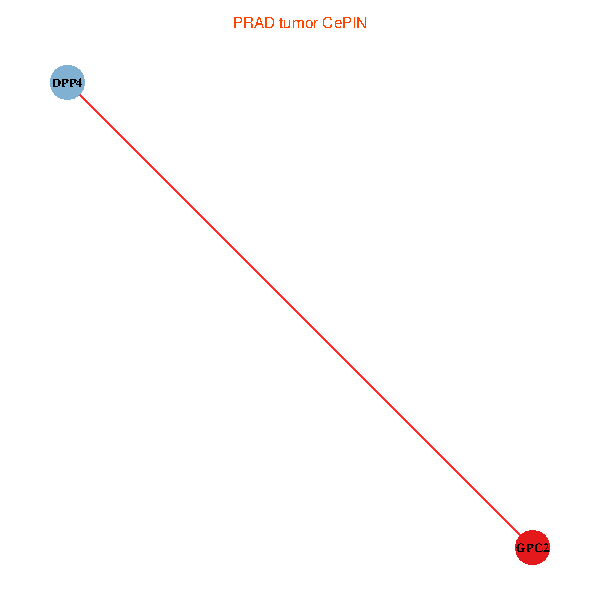
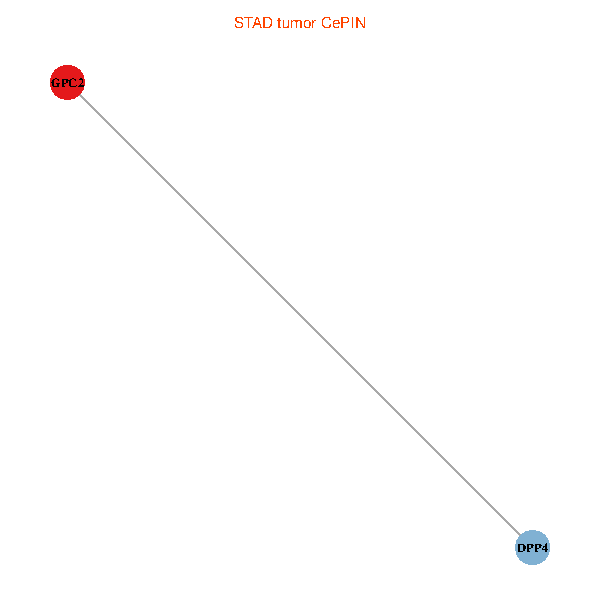
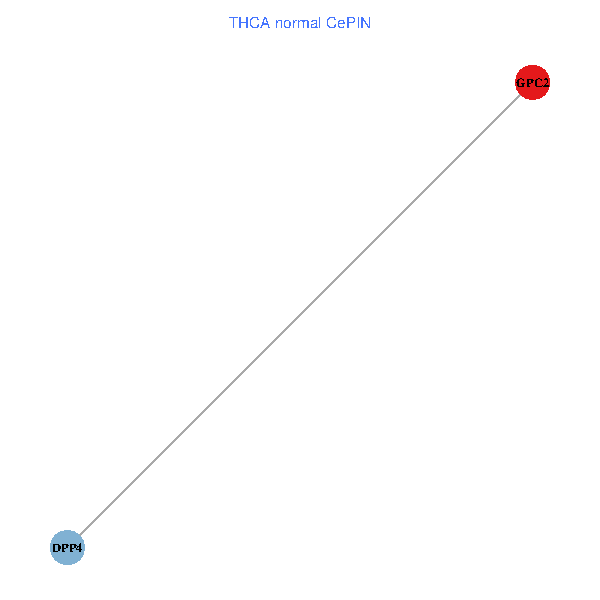
| TissGeneNet for GPC2 |
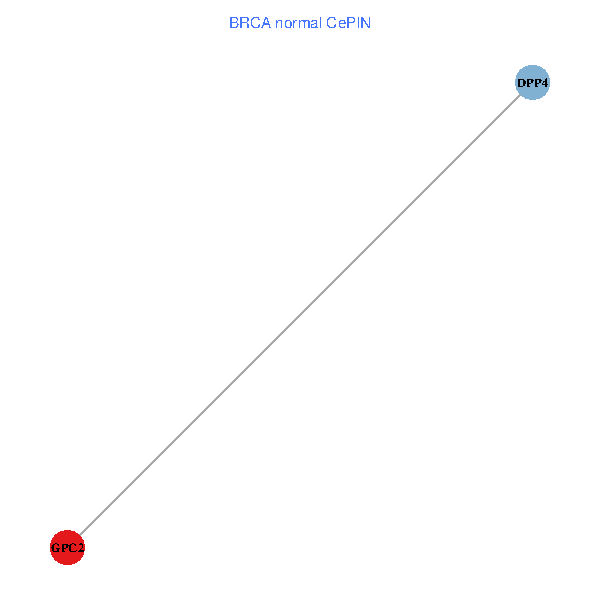
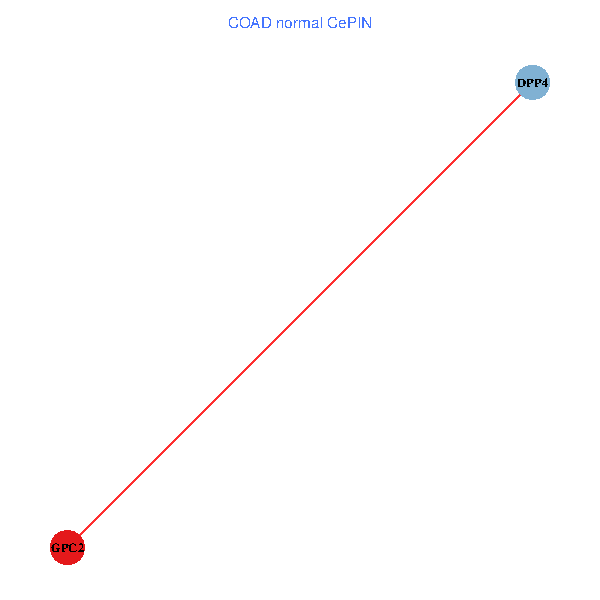
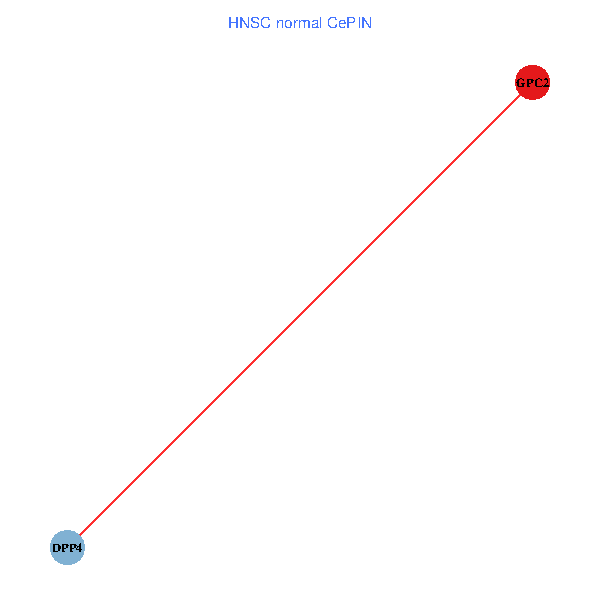
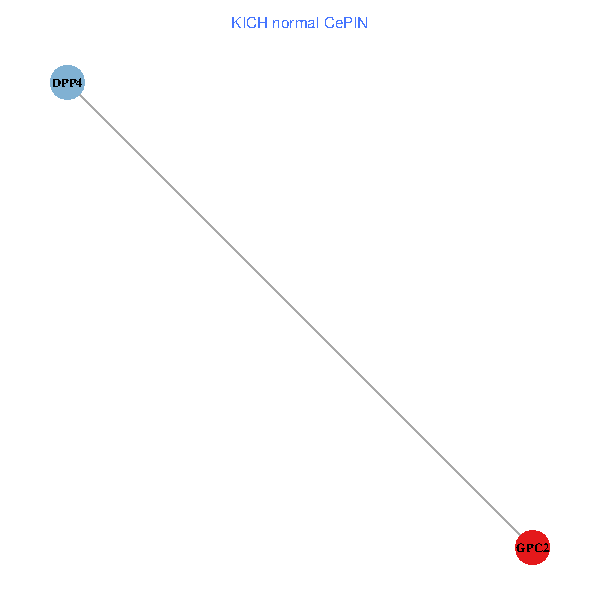
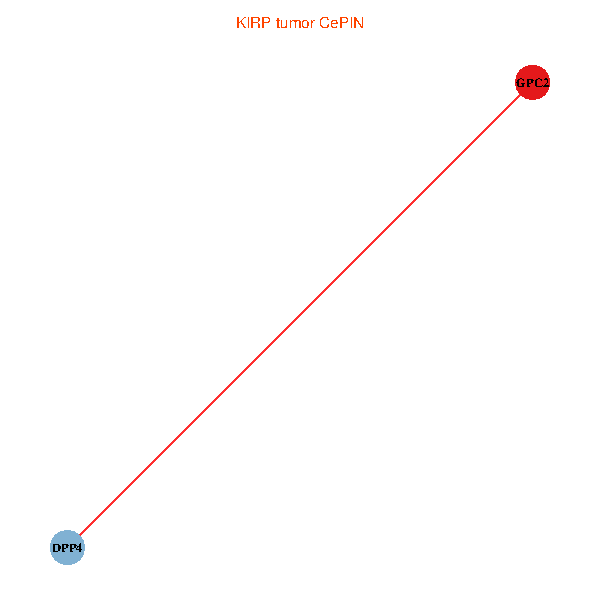
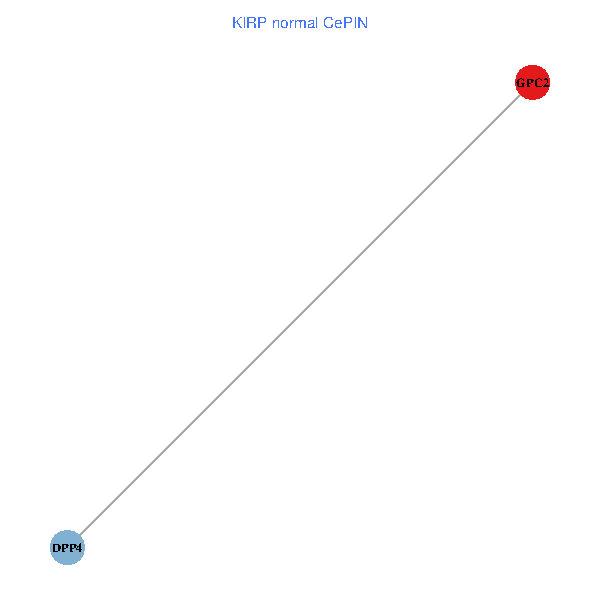
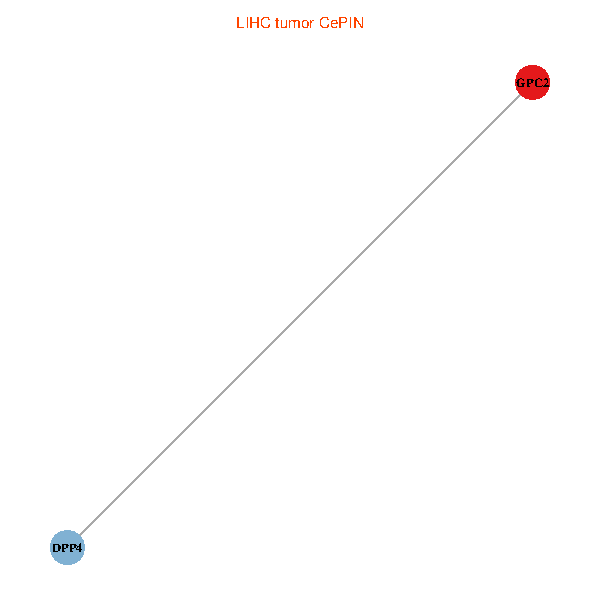
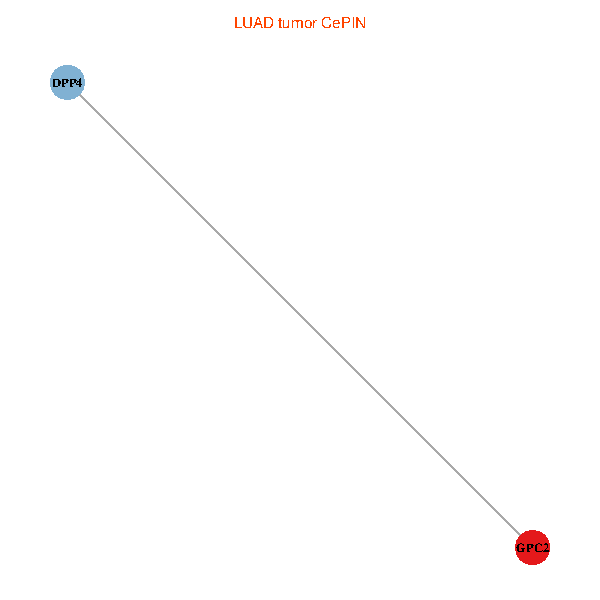
| Co-expressed gene networks based on protein-protein interaction data (CePIN) (TCGA IlluminaHiSeq_RNASeqV2, pan-cancer normalized log2(norm_counts+1) data, version 2016-08-16) (PINA2 ppi data) |
| BRCA (tumor) | BRCA (normal) |
| GPC2, DPP4 (tumor) | GPC2, DPP4 (normal) |
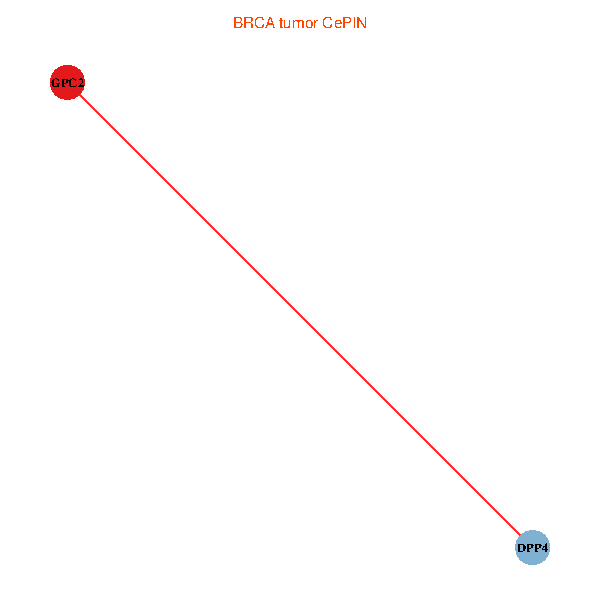 |  |
| COAD (tumor) | COAD (normal) |
| GPC2, DPP4 (tumor) | GPC2, DPP4 (normal) |
 |  |
| HNSC (tumor) | HNSC (normal) |
| GPC2, DPP4 (tumor) | GPC2, DPP4 (normal) |
 |  |
| KICH (tumor) | KICH (normal) |
| GPC2, DPP4 (tumor) | GPC2, DPP4 (normal) |
 |  |
| KIRC (tumor) | KIRC (normal) |
| GPC2, DPP4 (tumor) | GPC2, DPP4 (normal) |
 |  |
| KIRP (tumor) | KIRP (normal) |
| GPC2, DPP4 (tumor) | GPC2, DPP4 (normal) |
 |  |
| LIHC (tumor) | LIHC (normal) |
| GPC2, DPP4 (tumor) | GPC2, DPP4 (normal) |
 |  |
| LUAD (tumor) | LUAD (normal) |
| GPC2, DPP4 (tumor) | GPC2, DPP4 (normal) |
 |  |
| LUSC (tumor) | LUSC (normal) |
| GPC2, DPP4 (tumor) | GPC2, DPP4 (normal) |
 |  |
| PRAD (tumor) | PRAD (normal) |
| GPC2, DPP4 (tumor) | GPC2, DPP4 (normal) |
 |  |
| STAD (tumor) | STAD (normal) |
| GPC2, DPP4 (tumor) | GPC2, DPP4 (normal) |
 |  |
| THCA (tumor) | THCA (normal) |
| GPC2, DPP4 (tumor) | GPC2, DPP4 (normal) |
 |  |
| Top |
| TissGeneProg for GPC2 |
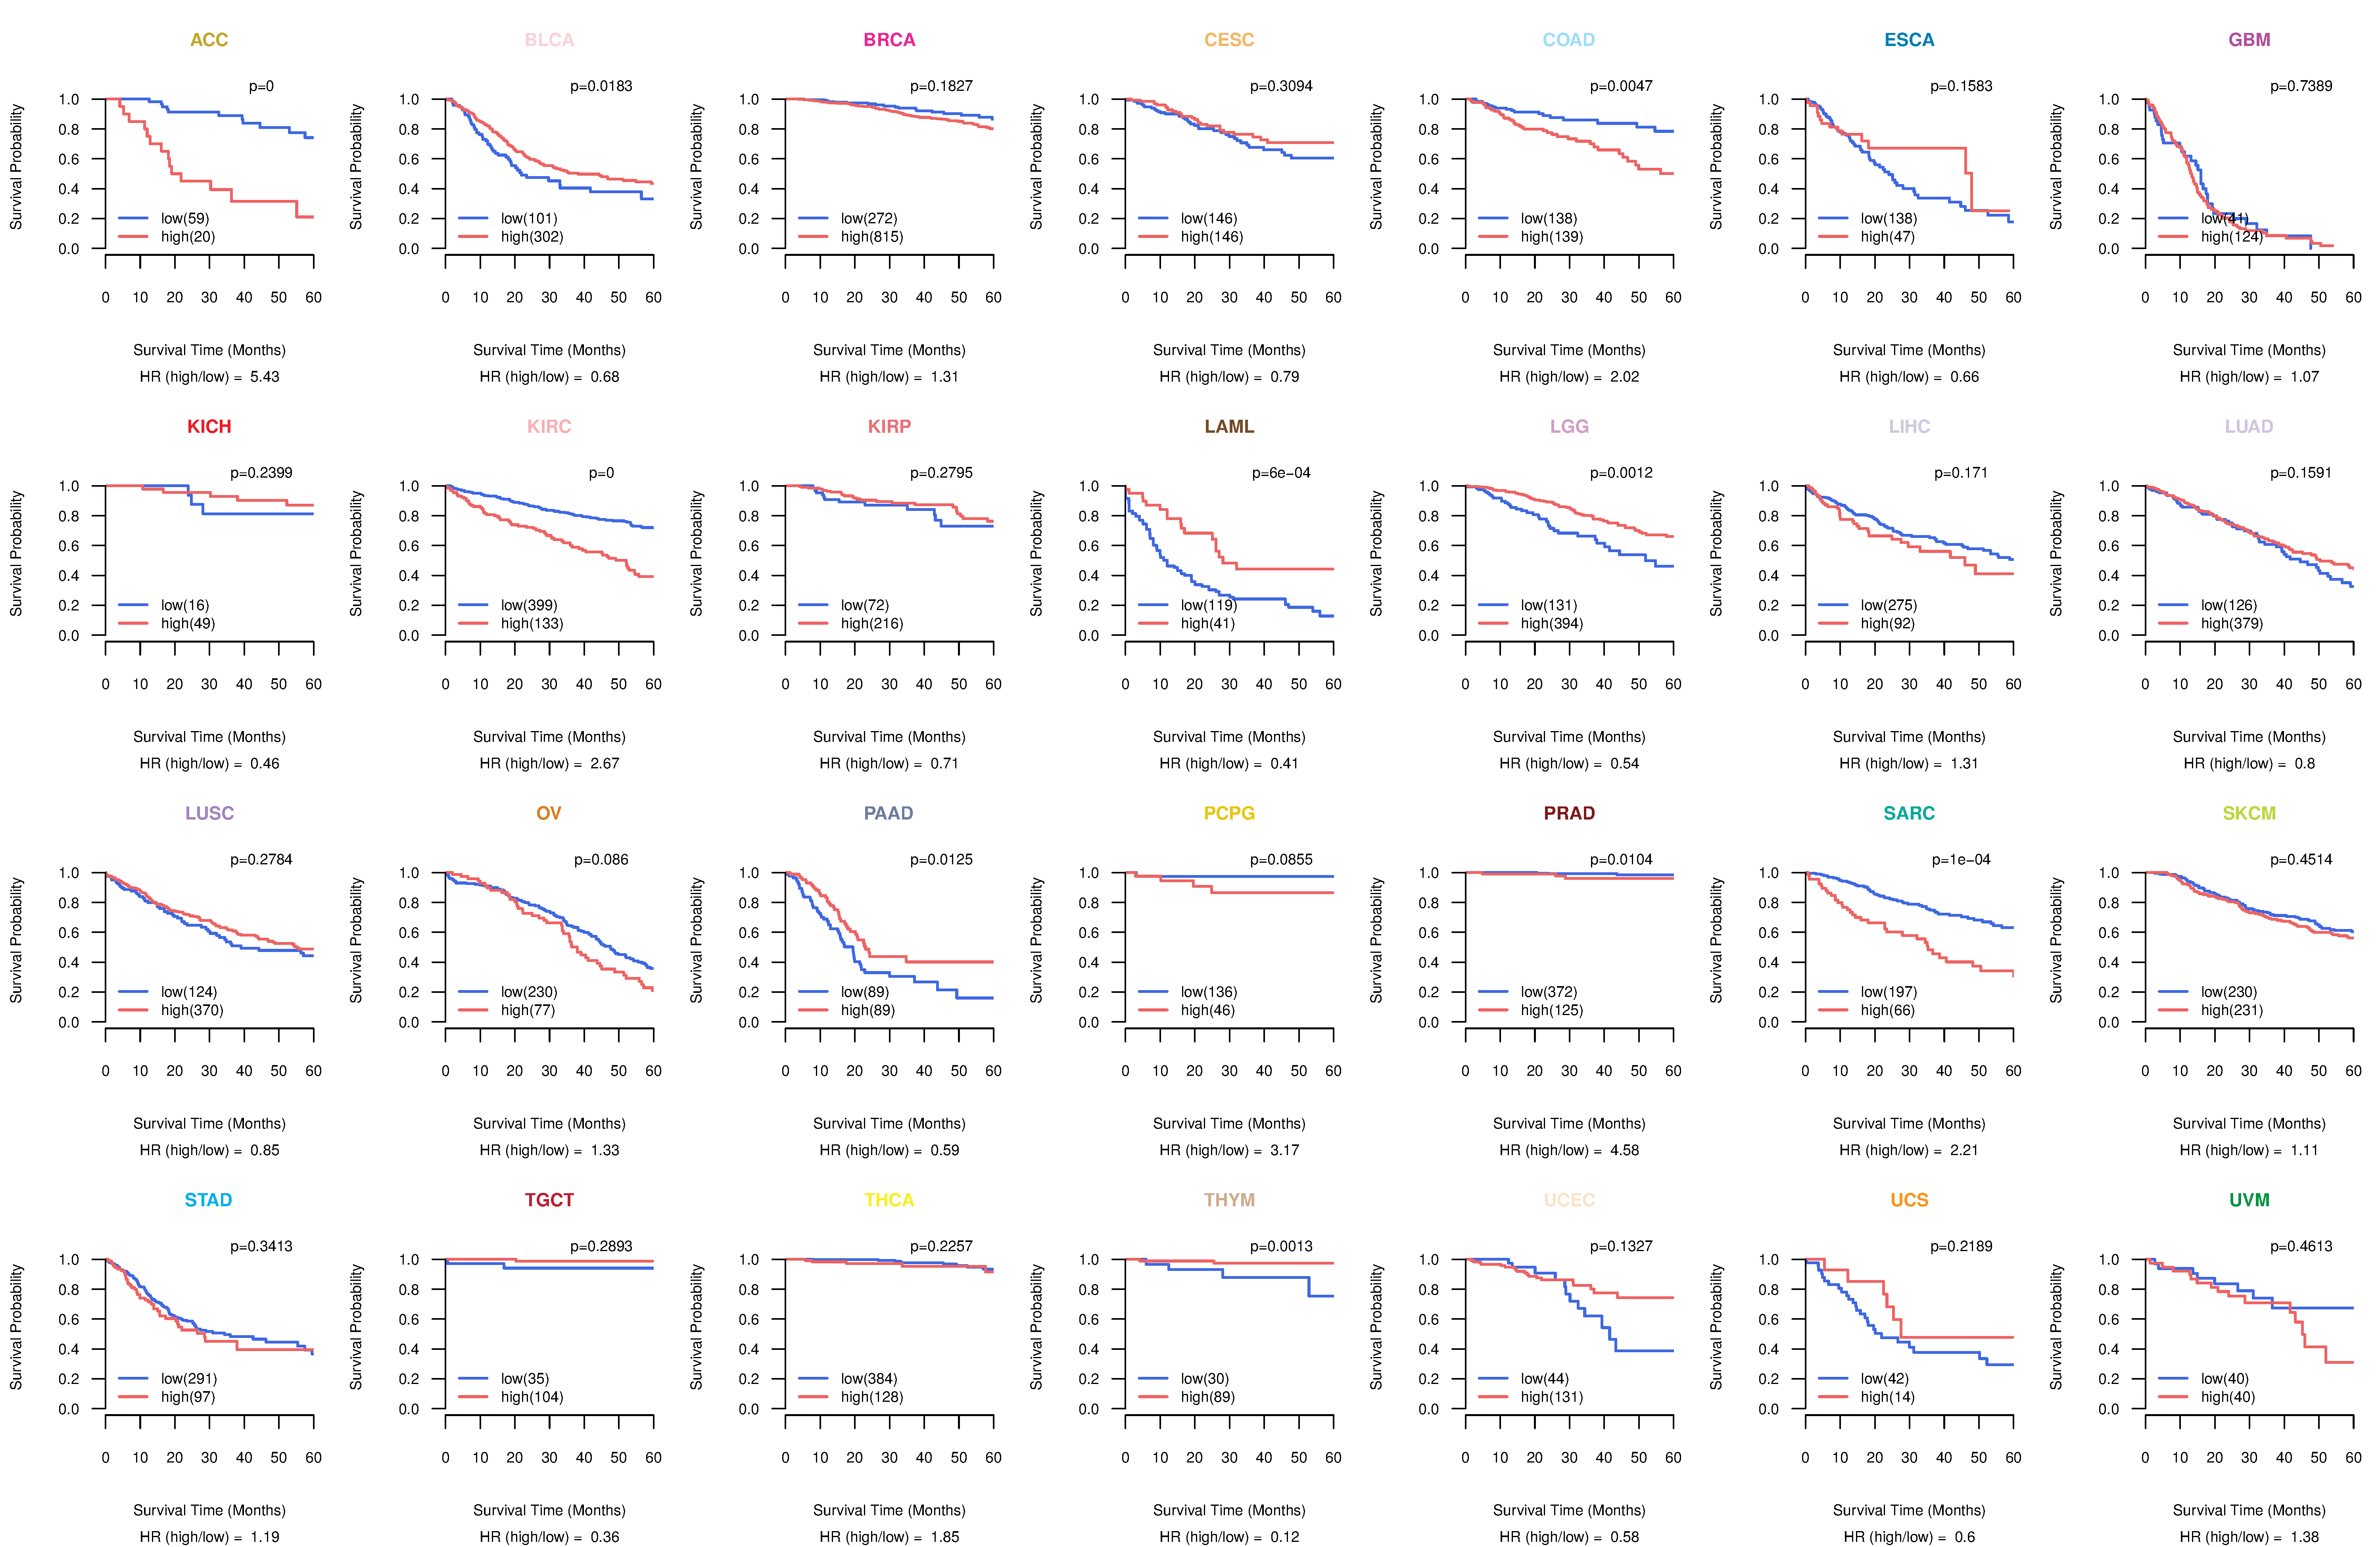
| Kaplan-Meier plots with logrank tests of overall survival (OS) using 28 cancer types (TCGA IlluminaHiSeq_RNASeqV2, pan-cancer normalized log2(norm_counts+1) data, version 2016-08-16) (TCGA clinicalMatrix, phenotype data, version 2016-04-27) * Click on the image to enlarge it in a new window. |
 |
| Kaplan-Meier plots with logrank test of relapse free survival (RFS) using 28 cancer types (TCGA IlluminaHiSeq_RNASeqV2, pan-cancer normalized log2(norm_counts+1) data, version 2016-08-16) (TCGA clinicalMatrix, phenotype data, version 2016-04-27) * Click on the image enlarge it in a new window. |
 |
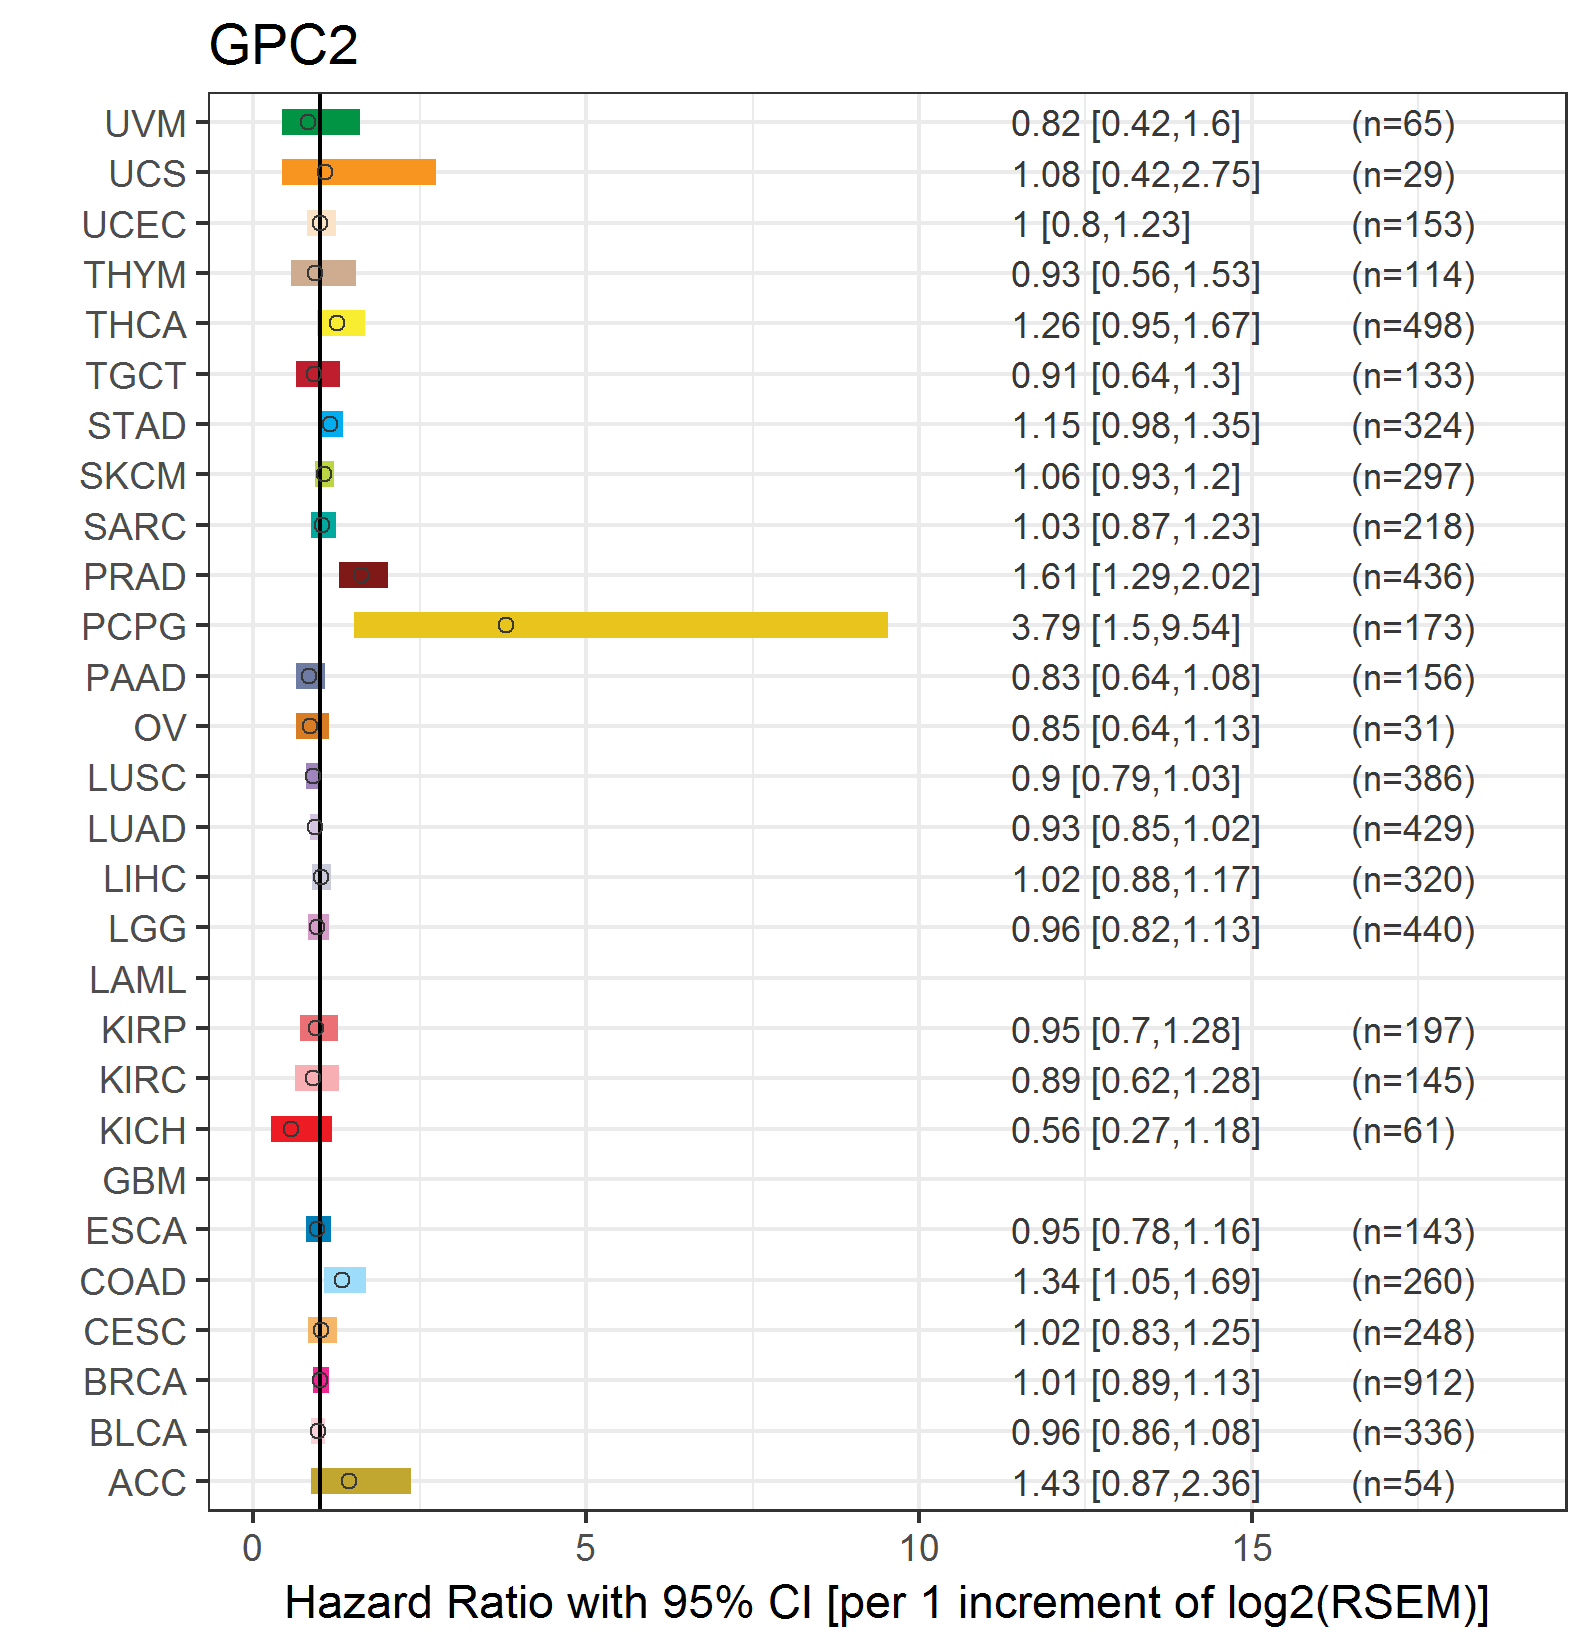
| Forest plot of Cox proportional hazard ratio (HR) and 95% CI of overall survival (OS) using 28 cancer types (TCGA IlluminaHiSeq_RNASeqV2, pan-cancer normalized log2(norm_counts+1) data, version 2016-08-16) (TCGA clinicalMatrix, phenotype data, version 2016-04-27) * Click on the image enlarge it in a new window. |
 |
| Forest plot of Cox proportional hazard ratio (HR) and 95% CI of relapse free survival (RFS) using 28 cancer types (TCGA IlluminaHiSeq_RNASeqV2, pan-cancer normalized log2(norm_counts+1) data, version 2016-08-16) (TCGA clinicalMatrix, phenotype data, version 2016-04-27) * Click on the image enlarge it in a new window. |
 |
| Top |
| TissGeneClin for GPC2 |
| TissGeneDrug for GPC2 |
| Drug information targeting TissGene (DrugBank Version 5.0.6, 2017-04-01) |
| DrugBank ID | Drug name | Drug activity | Drug type | Drug status |
| Top |
| TissGeneDisease for GPC2 |
| Disease information associated with TissGene (DisGeNet, 2016-06-01) |
| Disease ID | Disease name | # pubmeds | Source |
| umls:C0006142 | Malignant neoplasm of breast | 1 | BeFree |
|
Copyright 2016-Present - The University of Texas Health Science Center at Houston (UTHealth) Web File Viewing | How to Report, Fraud, Waste and Abuse | State of Texas | Statewide Search | Texas Homeland Security | Site Policies |