 |
| |
| |
| |
| |
| |
| |
|

| TissGeneSummary for FDXR |
 Gene summary Gene summary |
| Basic gene information | Gene symbol | FDXR |
| Gene name | ferredoxin reductase | |
| Synonyms | ADXR | |
| Cytomap | UCSC genome browser: 17q25.1 | |
| Type of gene | protein-coding | |
| RefGenes | NM_001258012.3, NM_001258013.3,NM_001258014.3,NM_001258015.2,NM_001258016.3, NM_004110.5,NM_024417.4,NR_047576.2, | |
| Description | ARNADPH:adrenodoxin oxidoreductase, mitochondrialadrenodoxin reductaseadrenodoxin-NADP(+) reductaseferredoxin--NADP(+) reductase | |
| Modification date | 20141212 | |
| dbXrefs | MIM : 103270 | |
| HGNC : HGNC | ||
| Ensembl : ENSG00000161513 | ||
| HPRD : 00060 | ||
| Vega : OTTHUMG00000179026 | ||
| Protein | UniProt: go to UniProt's Cross Reference DB Table | |
| Expression | CleanEX: HS_FDXR | |
| BioGPS: 2232 | ||
| Pathway | NCI Pathway Interaction Database: FDXR | |
| KEGG: FDXR | ||
| REACTOME: FDXR | ||
| Pathway Commons: FDXR | ||
| Context | iHOP: FDXR | |
| ligand binding site mutation search in PubMed: FDXR | ||
| UCL Cancer Institute: FDXR | ||
| Assigned class in TissGDB* | C | |
| Included tissue-specific gene expression resources | HPA,TiGER | |
| Specific-tissues in normal samples (assigned by TissGDB using HPA, TiGER, and GTEx) | CervixAdrenal gland | |
| Cancer types related to the specific-tissues in cancer samples (assigned by TissGDB using TCGA) | CESCPCPG,ACC | |
| Reference showing the relevant tissue of FDXR | ||
| Description by TissGene annotations | Have significant anti-correlated miRNA | |
| * Class A consists of genes with literature evidence and is part of the cTissGenes. Class B consists of only cTissGenes without additional evidence. The remaining genes belong to Class C. |
| Gene ontology having evidence of Inferred from Direct Assay (IDA) from Entrez |
| GO ID | GO term | PubMed ID |
| Top |
| TissGeneExp for FDXR |
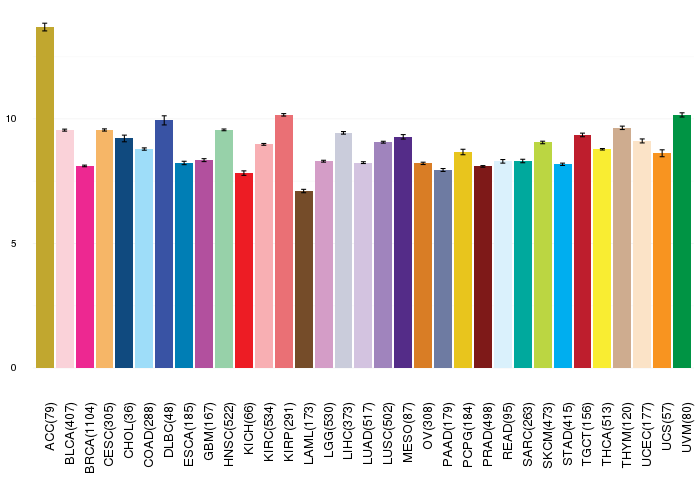
| Gene expressions across 28 cancer types (X-axis: cancer type and Y-axis: log2(norm_counts+1)) (TCGA IlluminaHiSeq_RNASeqV2, pan-cancer normalized log2(norm_counts+1) data, version 2016-08-16) |
 |
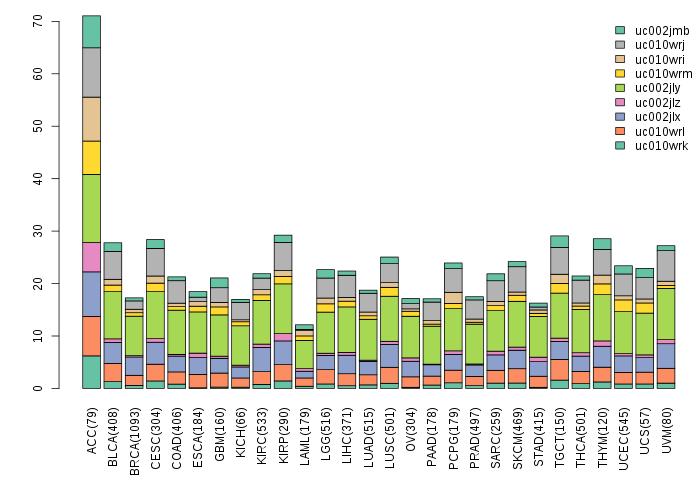
| Gene isoform expressions across 28 cancer types (X-axis: cancer type and Y-axis: log2(norm_counts+1)) (TCGA pan-cancer tcga_rsem_isoform_tpm, version 2016-09-01) |
 |
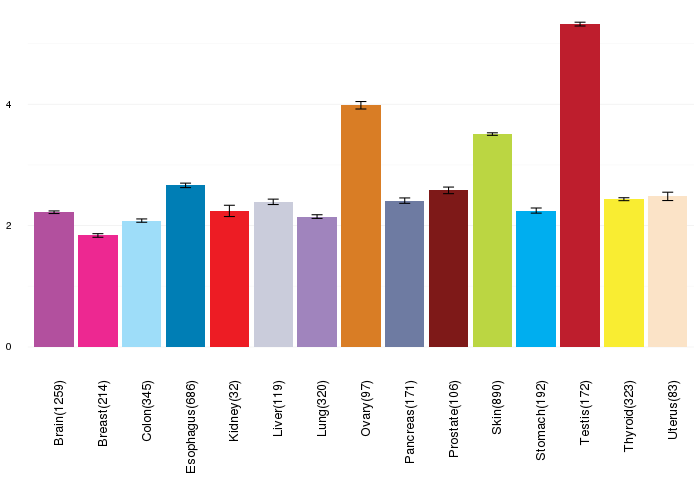
| Gene expressions across normal tissues of GTEx data (GTEx GTEx_Analysis_v6_RNA-seq_RNA-SeQCv1.1.8_gene_rpkm.gct) - Here, we shows the matched tissue types only among our 28 cancer types. |
 |
| Different expressions across 14 cancer types with more than 10 samples between matched tumors and normals (X-axis: cancer type and Y-axis: log2(norm_counts+1)) (TCGA IlluminaHiSeq_RNASeqV2, pan-cancer normalized log2(norm_counts+1) data, version 2016-08-16) |
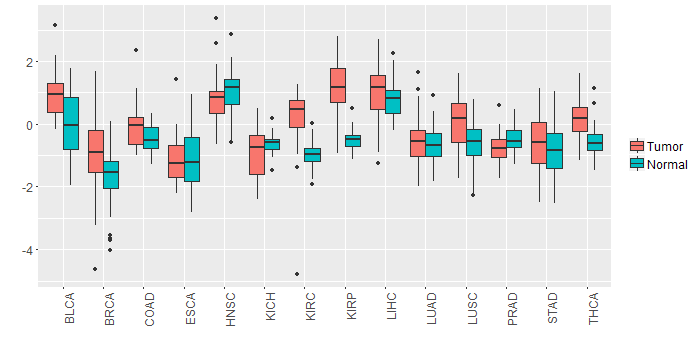 |
| - Significantly differentially expressed cancer types and information. (|Fold change|>1 and FDR<0.05) |
| Cancer type | Mean(exp) in tumor | Mean(exp) in matched normal | Log2FC | P-val. | FDR |
| KIRP | 1.232863631 | -0.482736369 | 1.7156 | 2.89E-14 | 6.89E-13 |
| KIRC | 0.243843492 | -0.995524563 | 1.239368056 | 3.75E-19 | 2.74E-18 |
| Top |
| TissGene-miRNA for FDXR |
| Significantly anti-correlated miRNAs of TissGene across 28 cancer types (Gene-miRNA relations from TargetScanHuman Relsease 7.1, Conserved_Site_Context_Scores.txt.zip, 06.01.2016) (TCGA IlluminaHiSeq_miRNASeq, log2(RPM+1) data, version 2016-11-21) (TCGA IlluminaHiSeq_RNASeqV2, log2(normalized_count+1) data, version 2016-08-16) (Spearman’s Rank Correlation (p-value<0.05 and coefficient<-0.25)) |
| Cancer type | miRNA id | miRNA accession | P-val. | Coeff. | # samples |
| ACC | hsa-miR-150-5p | MIMAT0000451 | 0.028 | -0.26 | 78 |
| ACC | hsa-miR-150-5p | MIMAT0000451 | 0.028 | -0.26 | 78 |
| LUAD | hsa-miR-24-3p | MIMAT0000080 | 0.0038 | -0.37 | 60 |
| ACC | hsa-miR-107 | MIMAT0000104 | 0.0014 | -0.38 | 78 |
| ACC | hsa-miR-107 | MIMAT0000104 | 0.0014 | -0.38 | 78 |
| Top |
| TissGeneMut for FDXR |
| TissGeneSNV for FDXR |
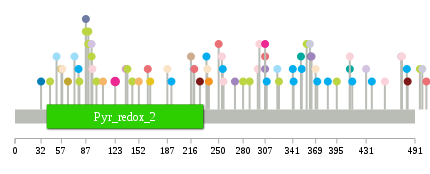
| nsSNV counts per each loci. Different colors of circles represent different cancer types. Circle size denotes number of samples. (TCGA somatic mutation (SNPs and small INDELs) data, version 2016-04-25) * Click on the image to enlarge it in a new window. |
 |
 |
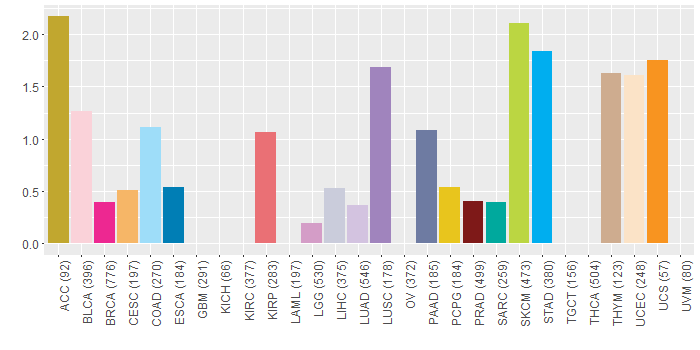
| Somatic nucleotide variants of TissGene across 28 cancer types (X-axis: cancer type and Y-axis: % of mutated samples) The numbers in parentheses are numbers of samples with mutation (nsSNVs). (TCGA somatic mutation (SNPs and small INDELs) data, version 2016-04-25) |
 |
| - nsSNVs sorted by frequency. |
| AAchange | Cancer type | # samples |
| p.R123Q | BRCA | 2 |
| p.V73A | COAD | 1 |
| p.S475C | BLCA | 1 |
| p.R227C | PRAD | 1 |
| p.S363F | PAAD | 1 |
| p.P474L | LUAD | 1 |
| p.G65A | ACC | 1 |
| p.C108Y | CESC | 1 |
| p.H94Y | LUAD | 1 |
| p.H534Y | SKCM | 1 |
| p.Q87H | PAAD | 1 |
| p.F32L | ESCA | 1 |
| p.R352Q | STAD | 1 |
| p.R219X | COAD | 1 |
| p.G90R | SKCM | 1 |
| p.G270V | LUSC | 1 |
| p.A324T | SKCM | 1 |
| p.H94Y | SKCM | 1 |
| p.R341H | STAD | 1 |
| p.P100S | SKCM | 1 |
| p.T351A | SARC | 1 |
| p.H57R | ACC | 1 |
| p.P525H | THYM | 1 |
| p.R95W | BLCA | 1 |
| p.I163S | KIRP | 1 |
| p.A342V | STAD | 1 |
| p.R384H | STAD | 1 |
| p.P431L | LUAD | 1 |
| p.H138Y | SKCM | 1 |
| p.A192T | STAD | 1 |
| p.G90E | SKCM | 1 |
| p.D307Y | LUSC | 1 |
| p.P43S | SKCM | 1 |
| p.S254L | BLCA | 1 |
| p.A255V | STAD | 1 |
| p.Y438H | STAD | 1 |
| p.R166Q | PCPG | 1 |
| p.D505N | KIRP | 1 |
| p.R309Q | STAD | 1 |
| p.Q483E | HNSC | 1 |
| p.R322W | COAD | 1 |
| p.Y481H | STAD | 1 |
| p.R236H | UCEC | 1 |
| p.S298L | BLCA | 1 |
| p.P144S | SKCM | 1 |
| p.C152Y | CESC | 1 |
| p.K369T | UCEC | 1 |
| p.R288K | SKCM | 1 |
| p.R238Q | UCS | 1 |
| p.W331C | HNSC | 1 |
| p.V78A | STAD | 1 |
| p.S497F | SKCM | 1 |
| p.S256F | BLCA | 1 |
| p.D307E | KIRP | 1 |
| p.P307R | BRCA | 1 |
| p.V136M | LGG | 1 |
| p.M454I | BLCA | 1 |
| p.R364L | LUSC | 1 |
| p.G369V | HNSC | 1 |
| p.V111M | HNSC | 1 |
| p.D220E | KIRP | 1 |
| p.D216E | THYM | 1 |
| p.P358L | SKCM | 1 |
| p.M411I | BLCA | 1 |
| p.S300F | BLCA | 1 |
| p.P474H | CHOL | 1 |
| p.D500E | LIHC | 1 |
| p.A482T | PRAD | 1 |
| p.K58T | UCEC | 1 |
| p.Q526E | HNSC | 1 |
| p.I250S | KIRP | 1 |
| p.V187M | UCEC | 1 |
| p.P87S | SKCM | 1 |
| p.D411N | SARC | 1 |
| p.E349Q | HNSC | 1 |
| p.A235T | STAD | 1 |
| p.P395S | SKCM | 1 |
| p.F51V | COAD | 1 |
| p.V371M | STAD | 1 |
| p.D362G | LIHC | 1 |
| p.E79K | SKCM | 1 |
| p.A280T | SKCM | 1 |
| p.V67M | HNSC | 1 |
| p.V414M | STAD | 1 |
| Top |
| TissGeneCNV for FDXR |
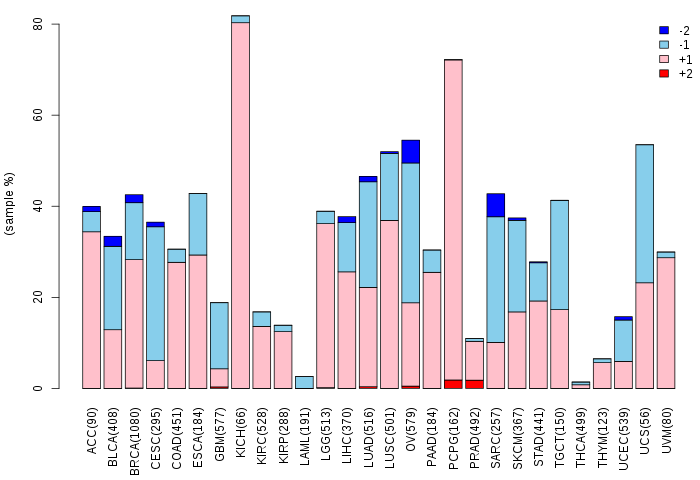
| Copy number variations of TissGene across 28 cancer types (X-axis: cancer type and Y-axis: % of CNV samples) (TCGA Gistic2_CopyNumber_Gistic2_all_data_by_genes, Gistic2 copy number data, version 2016-08-16) |
 |
| Top |
| TissGeneFusions for FDXR |
| Fusion genes including TissGene (ChimerDB 3.0, 2016-12-01 and TCGA fusion Portal 2015-12-01) |
| Database | Src | Cancer type | Sample | Fusion gene | ORF | 5'-gene BP | 3'-gene BP |
| Top |
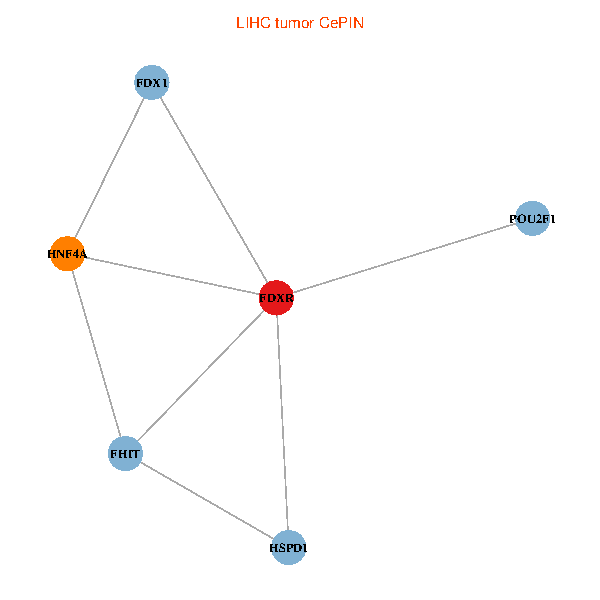
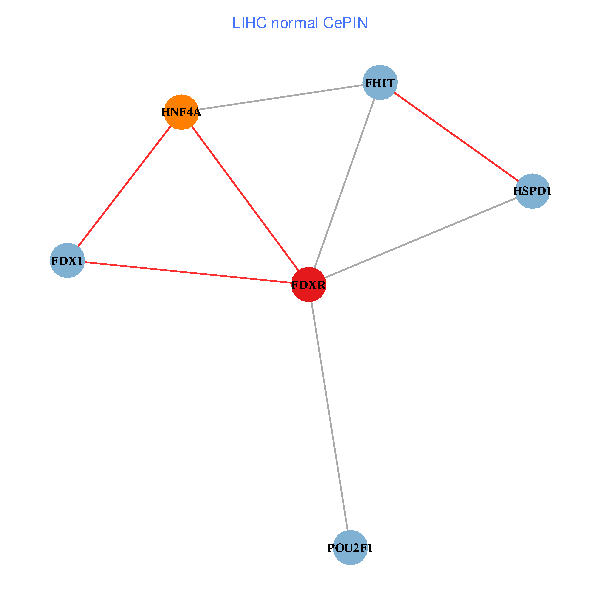
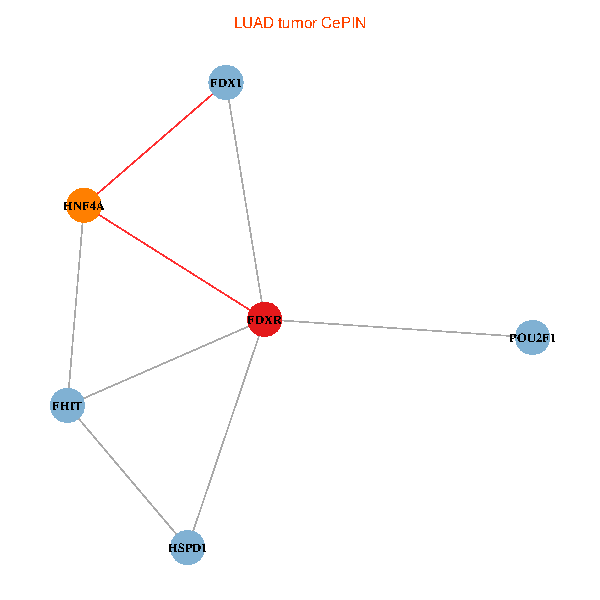
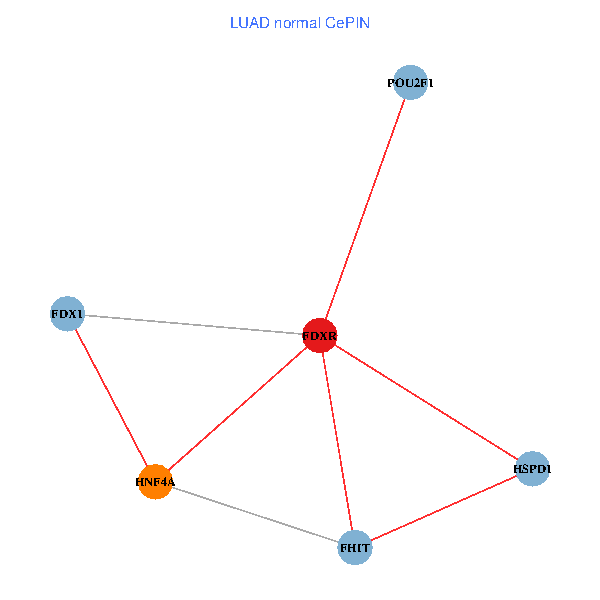
| TissGeneNet for FDXR |
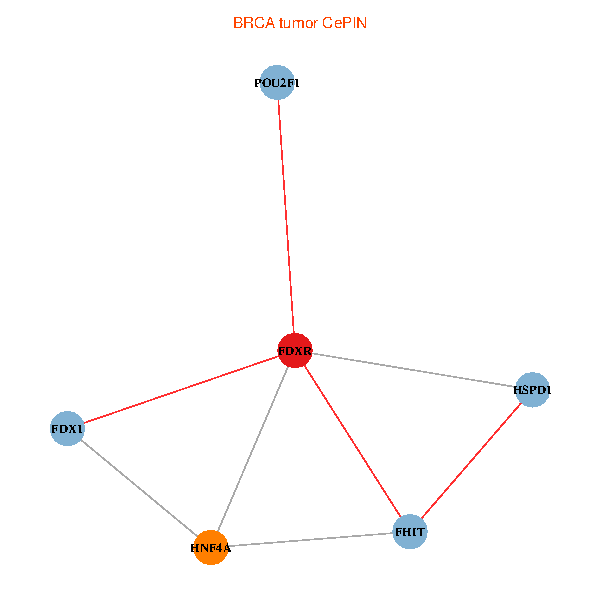
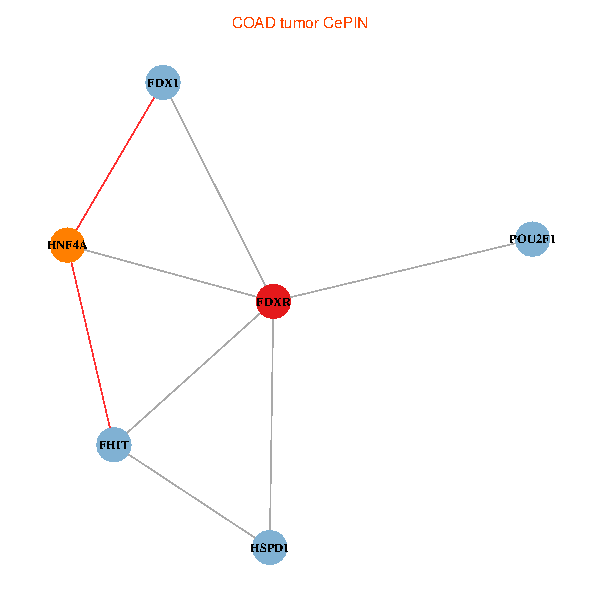
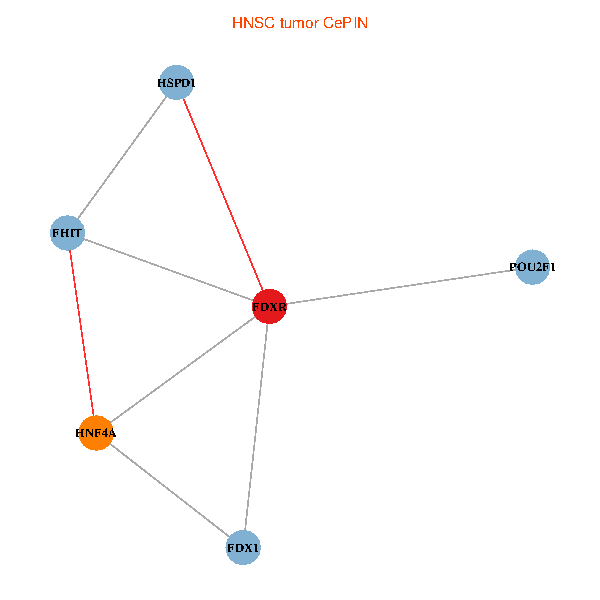
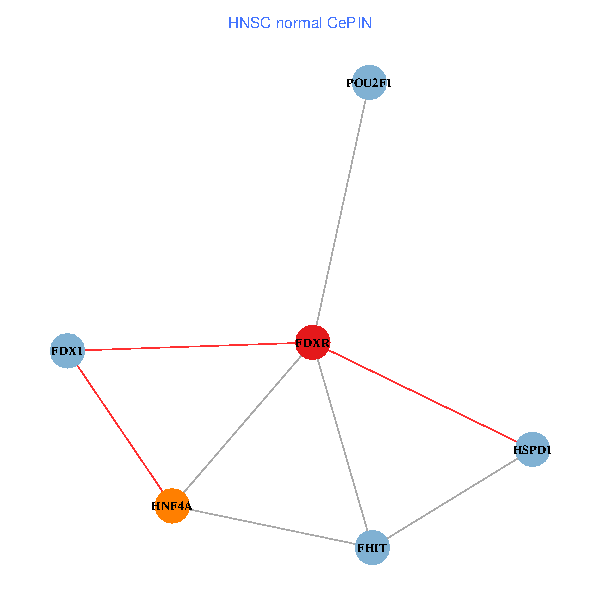
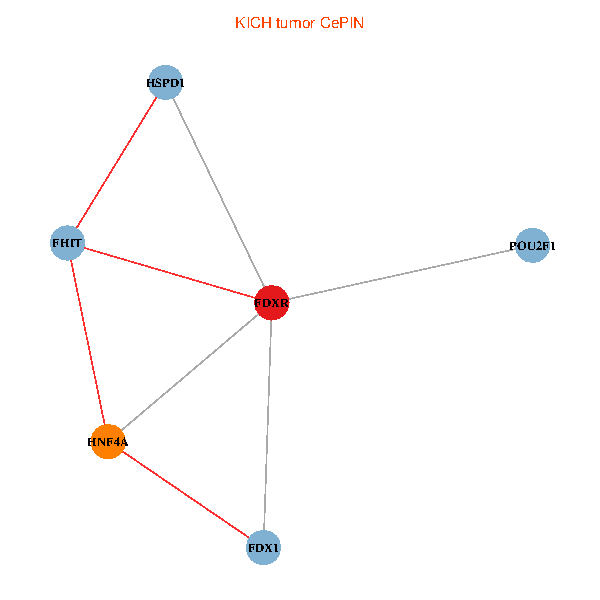
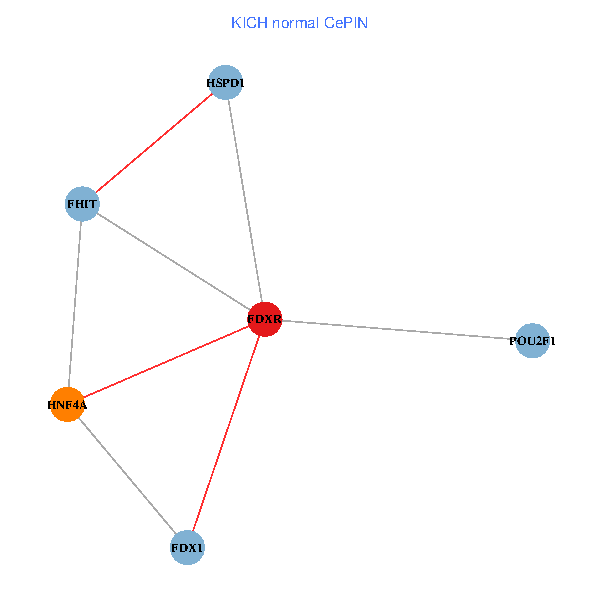
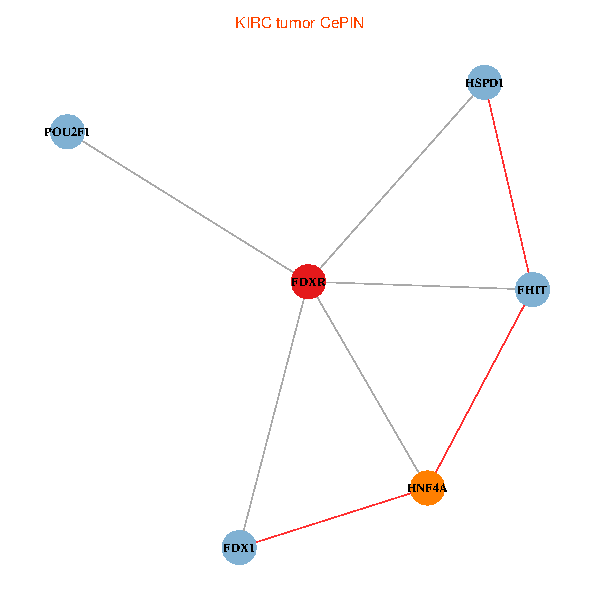
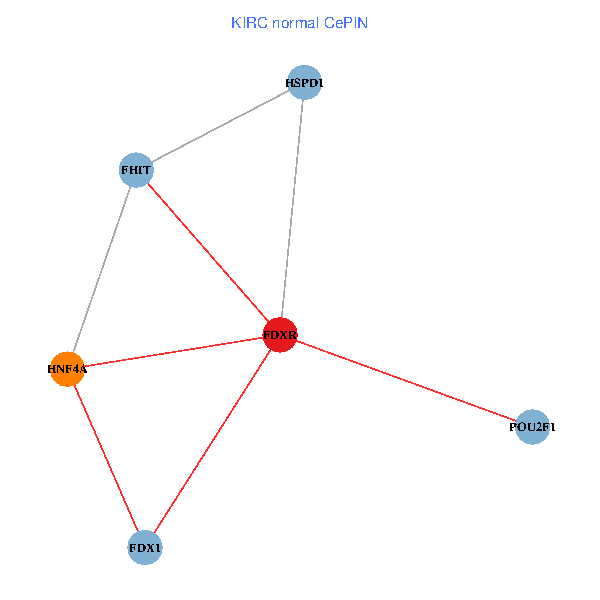
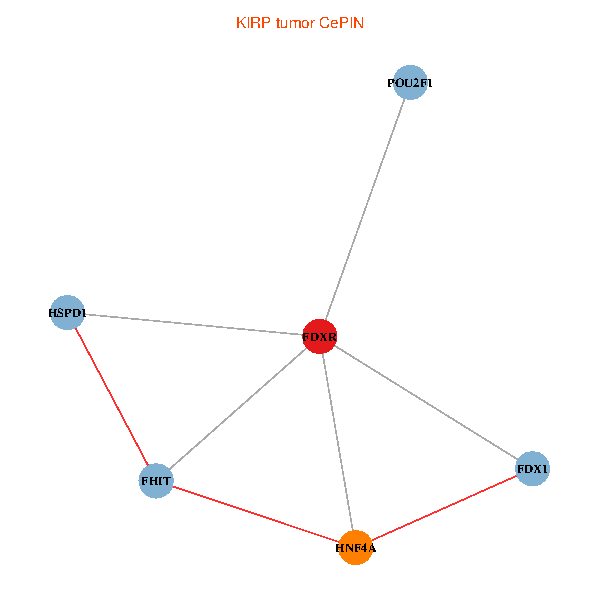
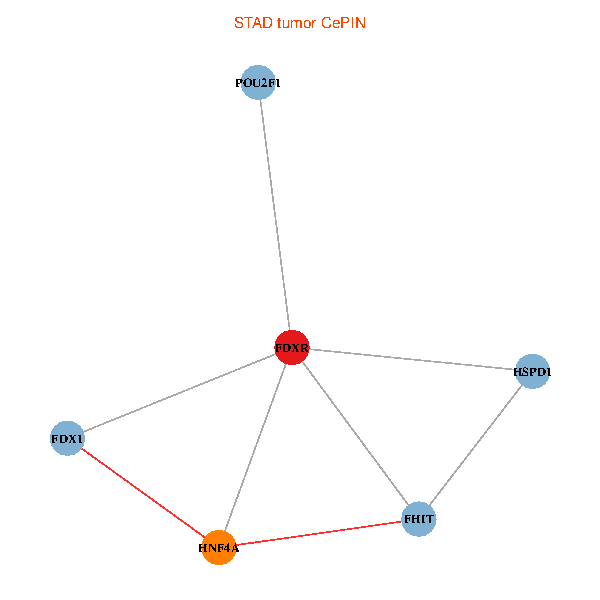
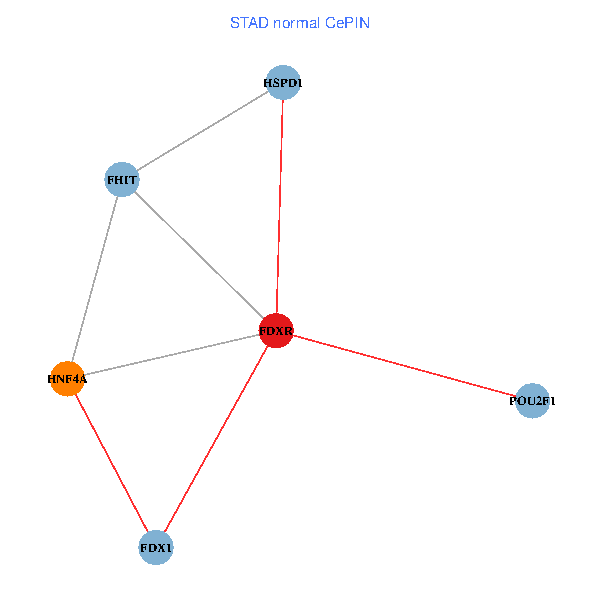
| Co-expressed gene networks based on protein-protein interaction data (CePIN) (TCGA IlluminaHiSeq_RNASeqV2, pan-cancer normalized log2(norm_counts+1) data, version 2016-08-16) (PINA2 ppi data) |
| BRCA (tumor) | BRCA (normal) |
| FDXR, HNF4A, POU2F1, HSPD1, FHIT, FDX1 (tumor) | FDXR, HNF4A, POU2F1, HSPD1, FHIT, FDX1 (normal) |
 |  |
| COAD (tumor) | COAD (normal) |
| FDXR, HNF4A, POU2F1, HSPD1, FHIT, FDX1 (tumor) | FDXR, HNF4A, POU2F1, HSPD1, FHIT, FDX1 (normal) |
 |  |
| HNSC (tumor) | HNSC (normal) |
| FDXR, HNF4A, POU2F1, HSPD1, FHIT, FDX1 (tumor) | FDXR, HNF4A, POU2F1, HSPD1, FHIT, FDX1 (normal) |
 |  |
| KICH (tumor) | KICH (normal) |
| FDXR, HNF4A, POU2F1, HSPD1, FHIT, FDX1 (tumor) | FDXR, HNF4A, POU2F1, HSPD1, FHIT, FDX1 (normal) |
 |  |
| KIRC (tumor) | KIRC (normal) |
| FDXR, HNF4A, POU2F1, HSPD1, FHIT, FDX1 (tumor) | FDXR, HNF4A, POU2F1, HSPD1, FHIT, FDX1 (normal) |
 |  |
| KIRP (tumor) | KIRP (normal) |
| FDXR, HNF4A, POU2F1, HSPD1, FHIT, FDX1 (tumor) | FDXR, HNF4A, POU2F1, HSPD1, FHIT, FDX1 (normal) |
 |  |
| LIHC (tumor) | LIHC (normal) |
| FDXR, HNF4A, POU2F1, HSPD1, FHIT, FDX1 (tumor) | FDXR, HNF4A, POU2F1, HSPD1, FHIT, FDX1 (normal) |
 |  |
| LUAD (tumor) | LUAD (normal) |
| FDXR, HNF4A, POU2F1, HSPD1, FHIT, FDX1 (tumor) | FDXR, HNF4A, POU2F1, HSPD1, FHIT, FDX1 (normal) |
 |  |
| LUSC (tumor) | LUSC (normal) |
| FDXR, HNF4A, POU2F1, HSPD1, FHIT, FDX1 (tumor) | FDXR, HNF4A, POU2F1, HSPD1, FHIT, FDX1 (normal) |
 |  |
| PRAD (tumor) | PRAD (normal) |
| FDXR, HNF4A, POU2F1, HSPD1, FHIT, FDX1 (tumor) | FDXR, HNF4A, POU2F1, HSPD1, FHIT, FDX1 (normal) |
 | 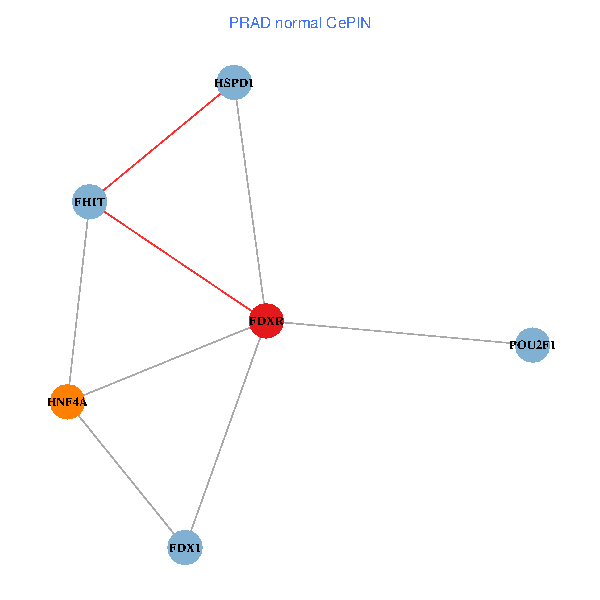 |
| STAD (tumor) | STAD (normal) |
| FDXR, HNF4A, POU2F1, HSPD1, FHIT, FDX1 (tumor) | FDXR, HNF4A, POU2F1, HSPD1, FHIT, FDX1 (normal) |
 |  |
| THCA (tumor) | THCA (normal) |
| FDXR, HNF4A, POU2F1, HSPD1, FHIT, FDX1 (tumor) | FDXR, HNF4A, POU2F1, HSPD1, FHIT, FDX1 (normal) |
 |  |
| Top |
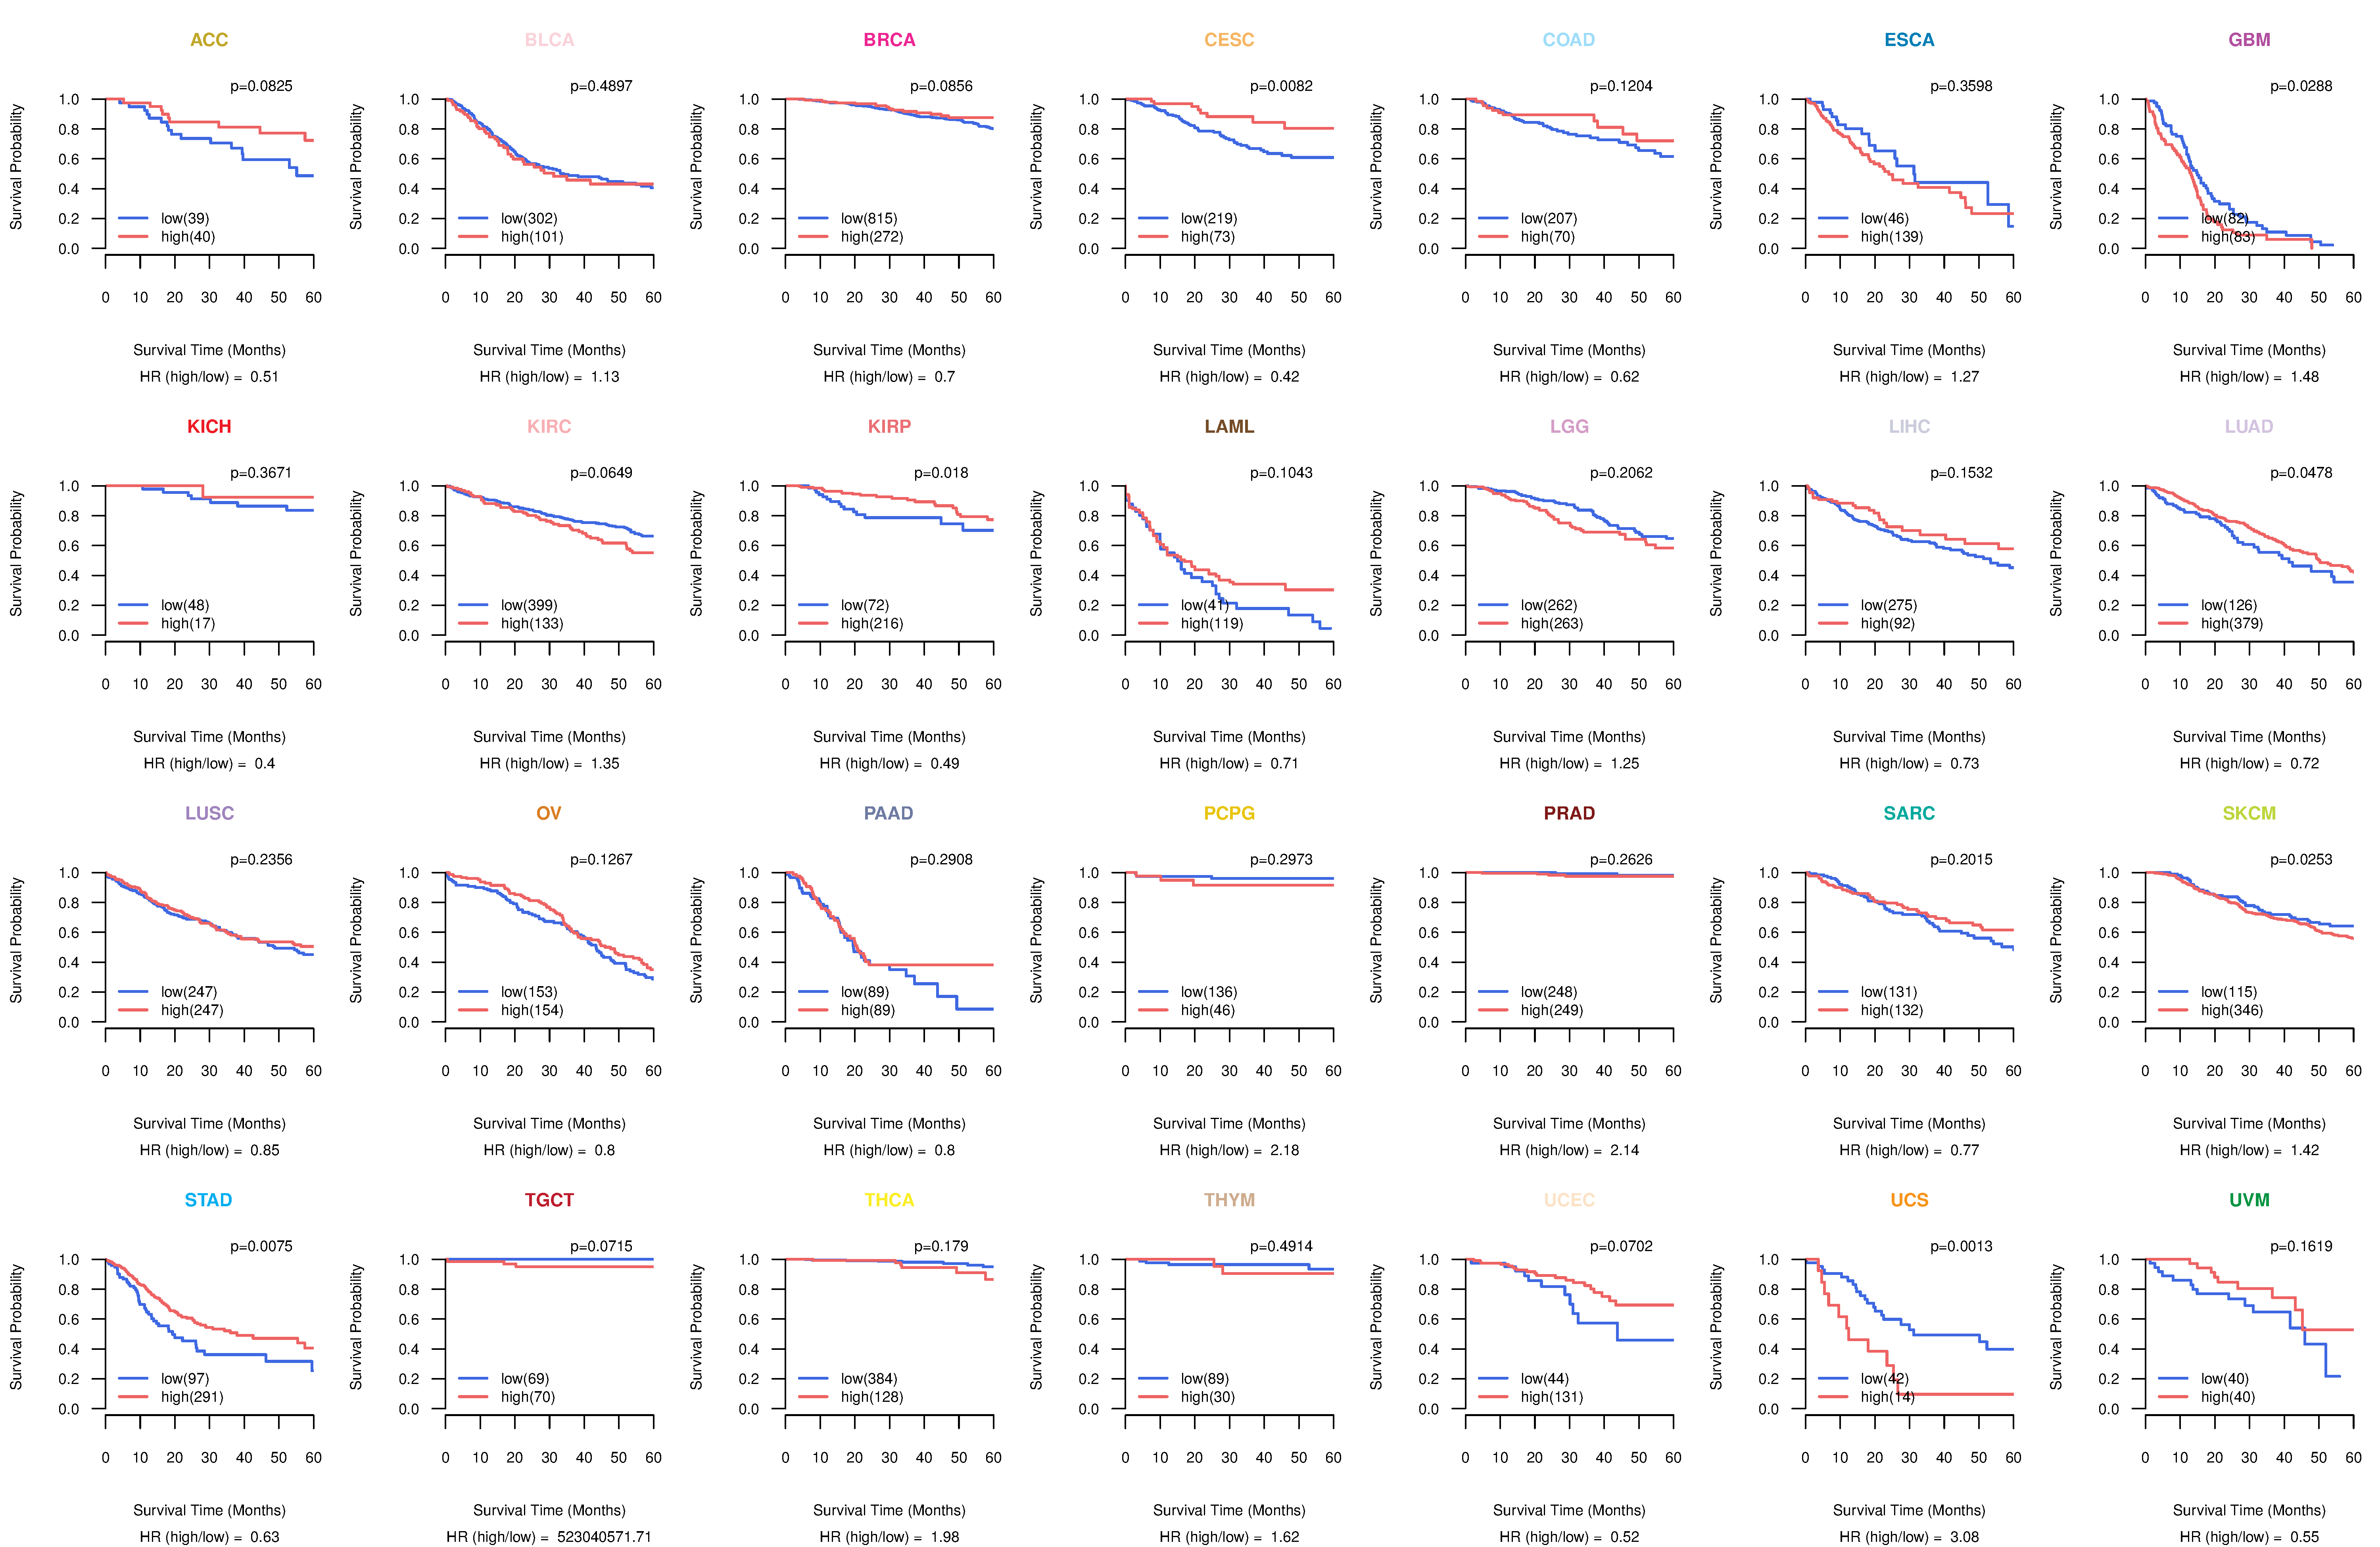
| TissGeneProg for FDXR |
| Kaplan-Meier plots with logrank tests of overall survival (OS) using 28 cancer types (TCGA IlluminaHiSeq_RNASeqV2, pan-cancer normalized log2(norm_counts+1) data, version 2016-08-16) (TCGA clinicalMatrix, phenotype data, version 2016-04-27) * Click on the image to enlarge it in a new window. |
 |
| Kaplan-Meier plots with logrank test of relapse free survival (RFS) using 28 cancer types (TCGA IlluminaHiSeq_RNASeqV2, pan-cancer normalized log2(norm_counts+1) data, version 2016-08-16) (TCGA clinicalMatrix, phenotype data, version 2016-04-27) * Click on the image enlarge it in a new window. |
 |
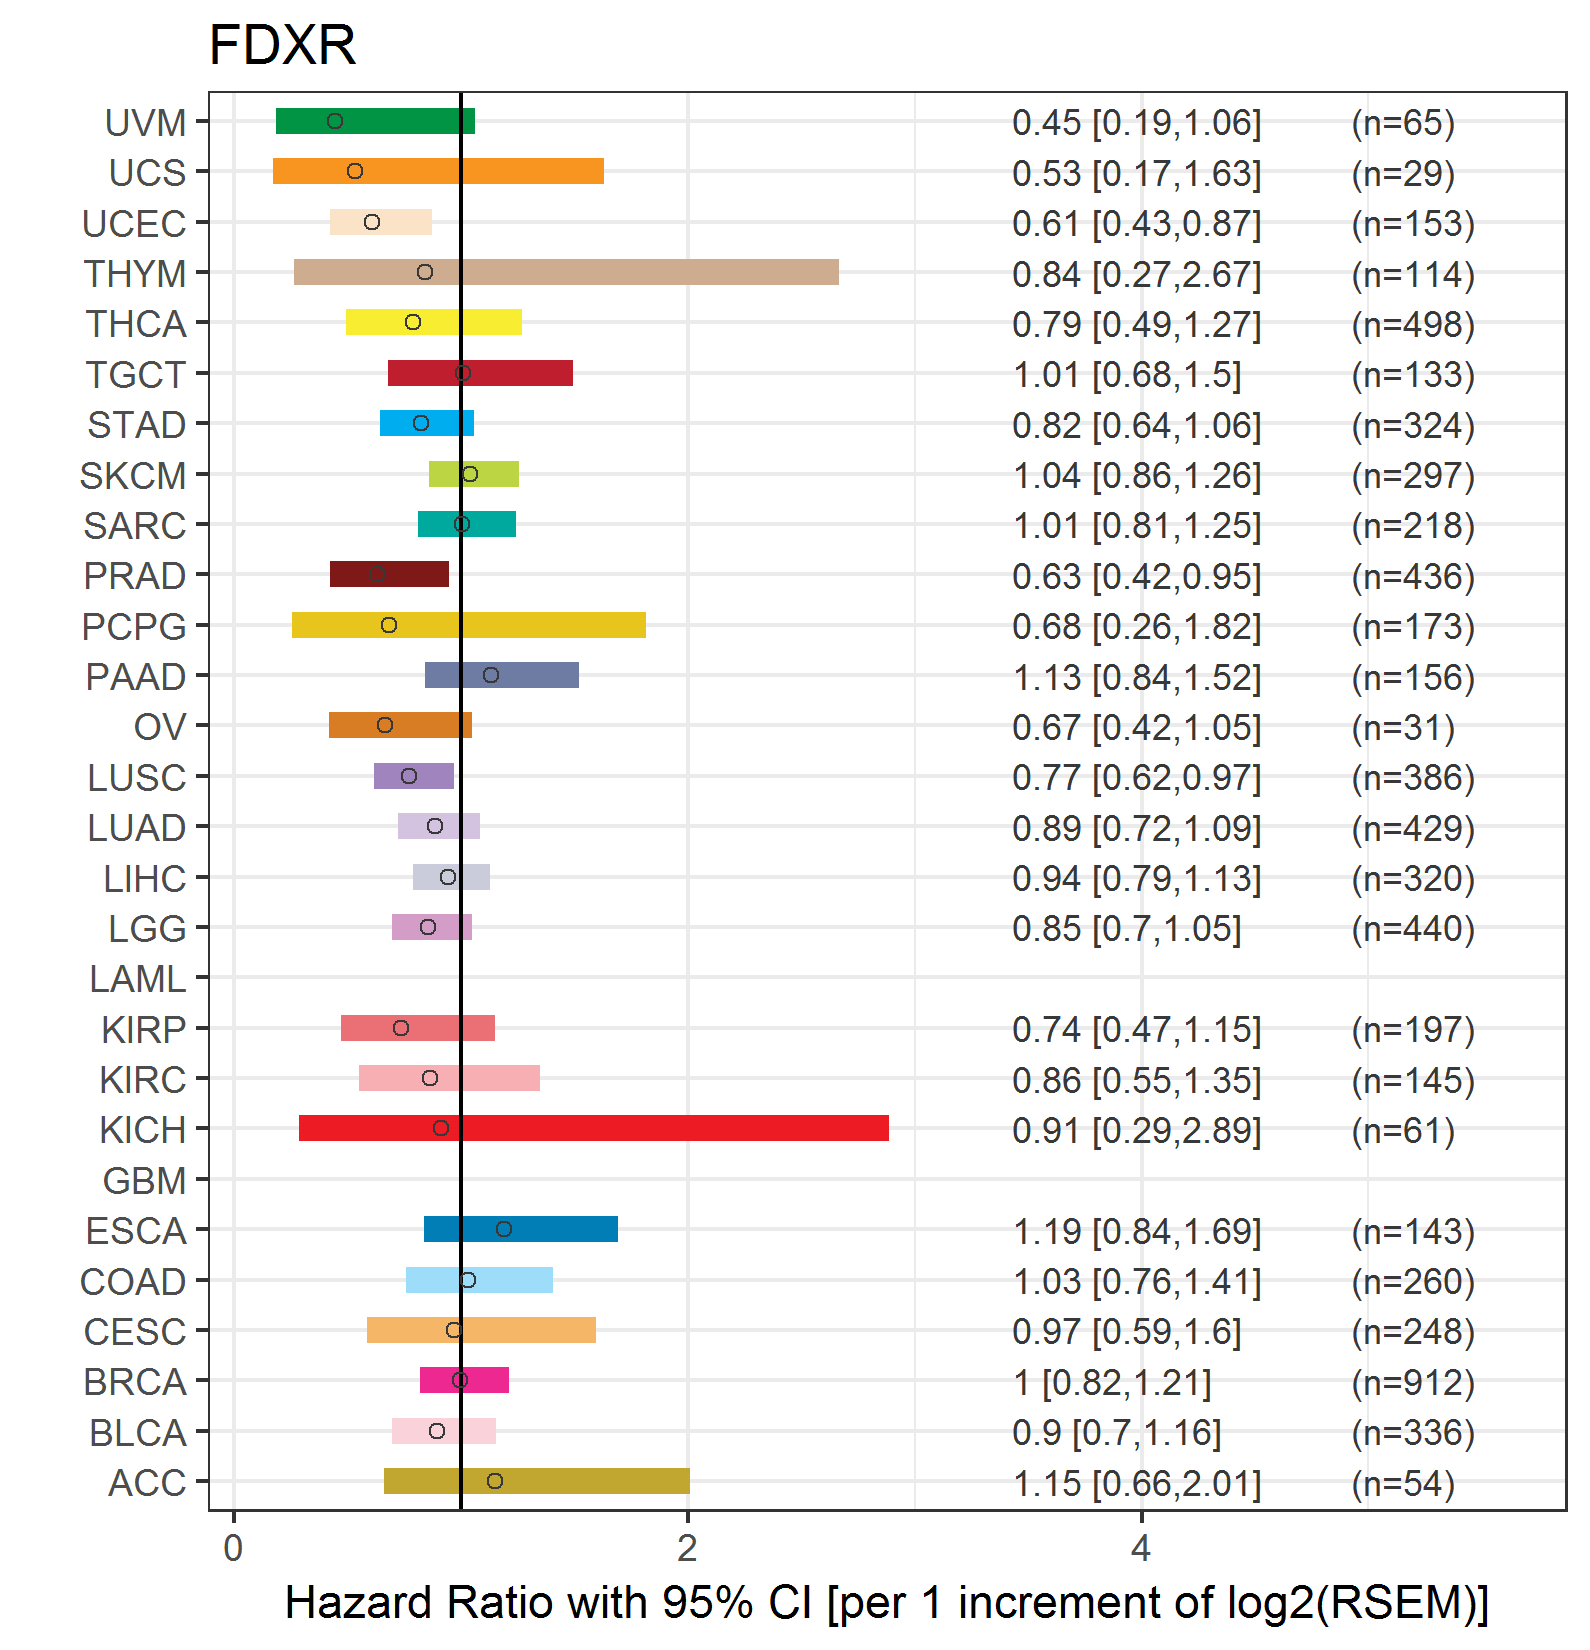
| Forest plot of Cox proportional hazard ratio (HR) and 95% CI of overall survival (OS) using 28 cancer types (TCGA IlluminaHiSeq_RNASeqV2, pan-cancer normalized log2(norm_counts+1) data, version 2016-08-16) (TCGA clinicalMatrix, phenotype data, version 2016-04-27) * Click on the image enlarge it in a new window. |
 |
| Forest plot of Cox proportional hazard ratio (HR) and 95% CI of relapse free survival (RFS) using 28 cancer types (TCGA IlluminaHiSeq_RNASeqV2, pan-cancer normalized log2(norm_counts+1) data, version 2016-08-16) (TCGA clinicalMatrix, phenotype data, version 2016-04-27) * Click on the image enlarge it in a new window. |
 |
| Top |
| TissGeneClin for FDXR |
| TissGeneDrug for FDXR |
| Drug information targeting TissGene (DrugBank Version 5.0.6, 2017-04-01) |
| DrugBank ID | Drug name | Drug activity | Drug type | Drug status |
| Top |
| TissGeneDisease for FDXR |
| Disease information associated with TissGene (DisGeNet, 2016-06-01) |
| Disease ID | Disease name | # pubmeds | Source |
| umls:C0007102 | Malignant tumor of colon | 1 | BeFree |
| umls:C0007131 | Non-Small Cell Lung Carcinoma | 1 | BeFree |
| umls:C0699790 | Colon Carcinoma | 1 | BeFree |
| umls:C0948380 | Colorectal cancer metastatic | 1 | BeFree |
|
Copyright 2016-Present - The University of Texas Health Science Center at Houston (UTHealth) Web File Viewing | How to Report, Fraud, Waste and Abuse | State of Texas | Statewide Search | Texas Homeland Security | Site Policies |