 |
| |
| |
| |
| |
| |
| |
|

| TissGeneSummary for HSPA4L |
 Gene summary Gene summary |
| Basic gene information | Gene symbol | HSPA4L |
| Gene name | heat shock 70kDa protein 4-like | |
| Synonyms | APG-1|HSPH3|Osp94 | |
| Cytomap | UCSC genome browser: 4q28 | |
| Type of gene | protein-coding | |
| RefGenes | NM_014278.2, | |
| Description | heat shock 70 kDa protein 4-like proteinheat shock 70 kDa protein 4Lheat shock 70-related protein APG-1heat shock protein (hsp110 family)osmotic stress protein 94 | |
| Modification date | 20141207 | |
| dbXrefs | HGNC : HGNC | |
| HPRD : 07137 | ||
| Protein | UniProt: go to UniProt's Cross Reference DB Table | |
| Expression | CleanEX: HS_HSPA4L | |
| BioGPS: 22824 | ||
| Pathway | NCI Pathway Interaction Database: HSPA4L | |
| KEGG: HSPA4L | ||
| REACTOME: HSPA4L | ||
| Pathway Commons: HSPA4L | ||
| Context | iHOP: HSPA4L | |
| ligand binding site mutation search in PubMed: HSPA4L | ||
| UCL Cancer Institute: HSPA4L | ||
| Assigned class in TissGDB* | C | |
| Included tissue-specific gene expression resources | HPA,GTEx | |
| Specific-tissues in normal samples (assigned by TissGDB using HPA, TiGER, and GTEx) | Testis | |
| Cancer types related to the specific-tissues in cancer samples (assigned by TissGDB using TCGA) | TGCT | |
| Reference showing the relevant tissue of HSPA4L | ||
| Description by TissGene annotations | Have significant anti-correlated miRNA Fused withTSGene | |
| * Class A consists of genes with literature evidence and is part of the cTissGenes. Class B consists of only cTissGenes without additional evidence. The remaining genes belong to Class C. |
| Gene ontology having evidence of Inferred from Direct Assay (IDA) from Entrez |
| GO ID | GO term | PubMed ID |
| Top |
| TissGeneExp for HSPA4L |
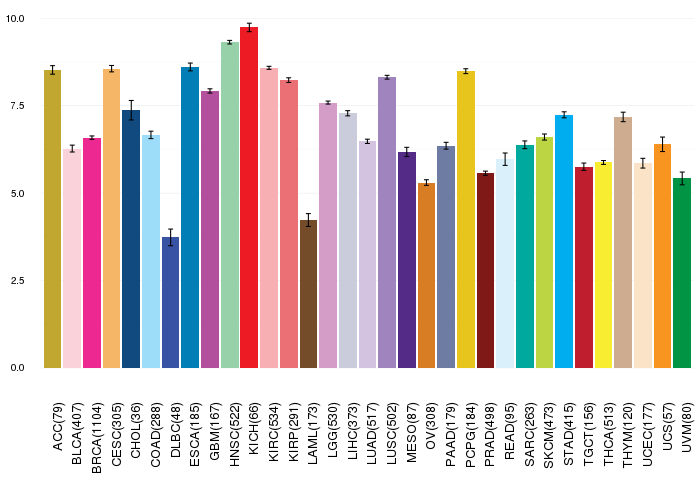
| Gene expressions across 28 cancer types (X-axis: cancer type and Y-axis: log2(norm_counts+1)) (TCGA IlluminaHiSeq_RNASeqV2, pan-cancer normalized log2(norm_counts+1) data, version 2016-08-16) |
 |
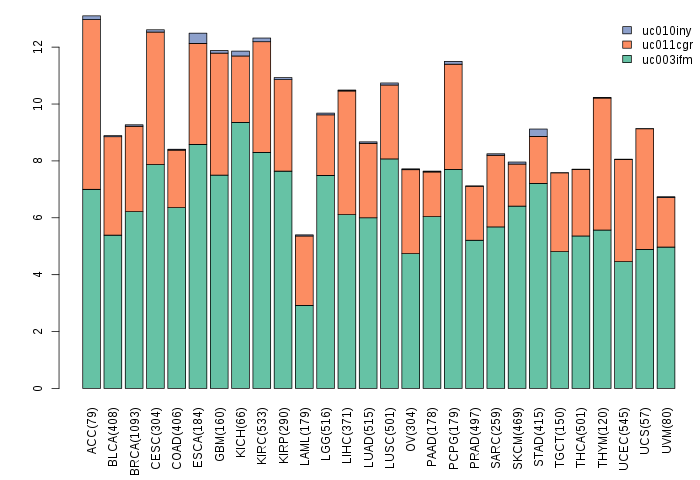
| Gene isoform expressions across 28 cancer types (X-axis: cancer type and Y-axis: log2(norm_counts+1)) (TCGA pan-cancer tcga_rsem_isoform_tpm, version 2016-09-01) |
 |
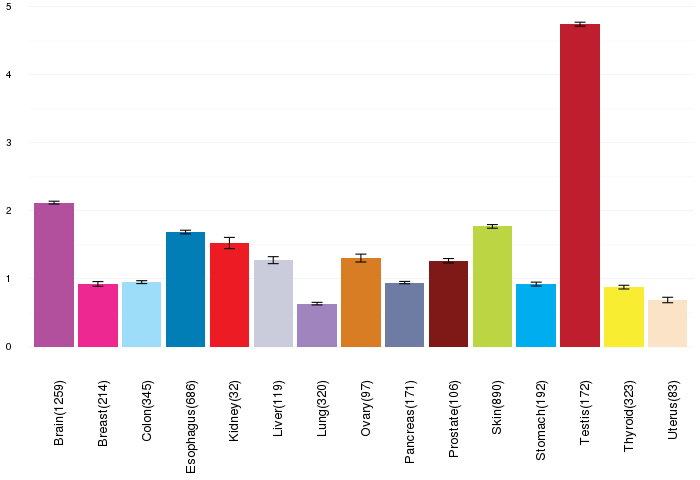
| Gene expressions across normal tissues of GTEx data (GTEx GTEx_Analysis_v6_RNA-seq_RNA-SeQCv1.1.8_gene_rpkm.gct) - Here, we shows the matched tissue types only among our 28 cancer types. |
 |
| Different expressions across 14 cancer types with more than 10 samples between matched tumors and normals (X-axis: cancer type and Y-axis: log2(norm_counts+1)) (TCGA IlluminaHiSeq_RNASeqV2, pan-cancer normalized log2(norm_counts+1) data, version 2016-08-16) |
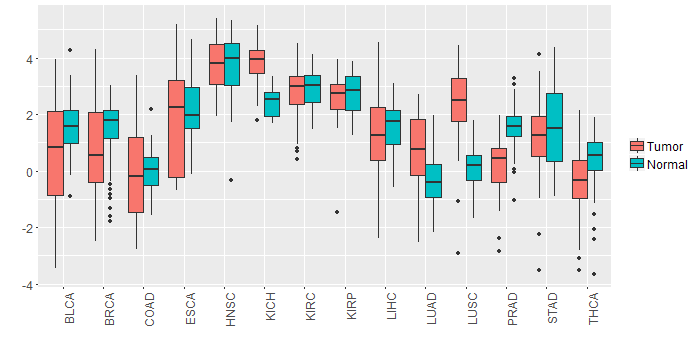 |
| - Significantly differentially expressed cancer types and information. (|Fold change|>1 and FDR<0.05) |
| Cancer type | Mean(exp) in tumor | Mean(exp) in matched normal | Log2FC | P-val. | FDR |
| KICH | 3.787812381 | 2.403140381 | 1.384672 | 1.19E-08 | 6.24E-08 |
| LUAD | 0.766162864 | -0.279518171 | 1.045681034 | 1.08E-06 | 3.62E-06 |
| LUSC | 2.33702642 | 0.191098969 | 2.145927451 | 3.31E-16 | 2.40E-15 |
| PRAD | 0.218411073 | 1.495299535 | -1.276888462 | 8.40E-11 | 1.92E-09 |
| Top |
| TissGene-miRNA for HSPA4L |
| Significantly anti-correlated miRNAs of TissGene across 28 cancer types (Gene-miRNA relations from TargetScanHuman Relsease 7.1, Conserved_Site_Context_Scores.txt.zip, 06.01.2016) (TCGA IlluminaHiSeq_miRNASeq, log2(RPM+1) data, version 2016-11-21) (TCGA IlluminaHiSeq_RNASeqV2, log2(normalized_count+1) data, version 2016-08-16) (Spearman’s Rank Correlation (p-value<0.05 and coefficient<-0.25)) |
| Cancer type | miRNA id | miRNA accession | P-val. | Coeff. | # samples |
| ACC | hsa-miR-15b-5p | MIMAT0000417 | 0.017 | -0.27 | 78 |
| ACC | hsa-miR-15b-5p | MIMAT0000417 | 0.017 | -0.27 | 78 |
| LUAD | hsa-miR-410-3p | MIMAT0002171 | 0.042 | -0.27 | 60 |
| LUAD | hsa-miR-140-5p | MIMAT0000431 | 0.03 | -0.28 | 60 |
| LUAD | hsa-miR-758-3p | MIMAT0003879 | 0.0041 | -0.37 | 60 |
| UCS | hsa-miR-146b-5p | MIMAT0002809 | 0.0051 | -0.37 | 56 |
| Top |
| TissGeneMut for HSPA4L |
| TissGeneSNV for HSPA4L |
| nsSNV counts per each loci. Different colors of circles represent different cancer types. Circle size denotes number of samples. (TCGA somatic mutation (SNPs and small INDELs) data, version 2016-04-25) * Click on the image to enlarge it in a new window. |
 |
 |
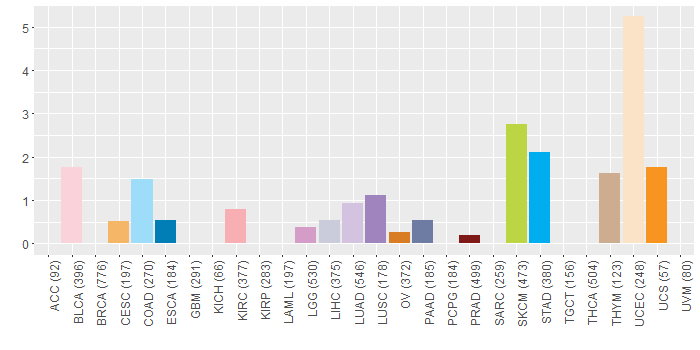
| Somatic nucleotide variants of TissGene across 28 cancer types (X-axis: cancer type and Y-axis: % of mutated samples) The numbers in parentheses are numbers of samples with mutation (nsSNVs). (TCGA somatic mutation (SNPs and small INDELs) data, version 2016-04-25) |
 |
| - nsSNVs sorted by frequency. |
| AAchange | Cancer type | # samples |
| p.R483C | UCEC | 3 |
| p.A180V | UCEC | 2 |
| p.F781L | UCEC | 2 |
| p.R483C | SKCM | 2 |
| p.R261Q | HNSC | 1 |
| p.R261W | UCEC | 1 |
| p.R346* | PRAD | 1 |
| p.E614K | SKCM | 1 |
| p.H450L | KIRC | 1 |
| p.M171I | BLCA | 1 |
| p.Q305E | STAD | 1 |
| p.K700Q | COAD | 1 |
| p.M693V | STAD | 1 |
| p.S461R | KIRC | 1 |
| p.R346Q | COAD | 1 |
| p.A386T | UCEC | 1 |
| p.I486V | BLCA | 1 |
| p.N756K | SKCM | 1 |
| p.G666R | SKCM | 1 |
| p.R617I | UCEC | 1 |
| p.T149I | SKCM | 1 |
| p.K558N | STAD | 1 |
| p.L284F | LUSC | 1 |
| p.T35A | UCEC | 1 |
| p.T816A | STAD | 1 |
| p.S260Y | UCEC | 1 |
| p.F428C | UCEC | 1 |
| p.R196T | BLCA | 1 |
| p.S832F | UCEC | 1 |
| p.E794D | LGG | 1 |
| p.H806Q | HNSC | 1 |
| p.S40L | PAAD | 1 |
| p.D7Y | UCEC | 1 |
| p.P229L | SKCM | 1 |
| p.I369T | CESC | 1 |
| p.L188I | LUAD | 1 |
| p.D611Y | HNSC | 1 |
| p.L295P | LUSC | 1 |
| p.R346X | PRAD | 1 |
| p.P190Q | UCEC | 1 |
| p.Q353K | READ | 1 |
| p.A18V | KIRC | 1 |
| p.K275R | LIHC | 1 |
| p.G100X | THYM | 1 |
| p.D566H | HNSC | 1 |
| p.D77N | SKCM | 1 |
| p.F357L | UCEC | 1 |
| p.Y14C | READ | 1 |
| p.Q570H | UCS | 1 |
| p.A754S | OV | 1 |
| p.K573T | LUAD | 1 |
| p.R374G | STAD | 1 |
| p.A495V | HNSC | 1 |
| p.R104W | UCEC | 1 |
| p.Q92H | READ | 1 |
| p.A123T | UCEC | 1 |
| p.H728Y | SKCM | 1 |
| p.G49E | SKCM | 1 |
| p.A37V | COAD | 1 |
| p.M277T | STAD | 1 |
| p.I56V | LIHC | 1 |
| p.E115D | THYM | 1 |
| p.C740R | BLCA | 1 |
| p.E504K | SKCM | 1 |
| p.Q610X | CHOL | 1 |
| p.A381V | STAD | 1 |
| p.Q762* | LUAD | 1 |
| p.F357L | COAD | 1 |
| p.E694Q | HNSC | 1 |
| p.A180S | LUAD | 1 |
| p.E24* | BLCA | 1 |
| p.G413E | SKCM | 1 |
| p.D551G | STAD | 1 |
| p.S769* | BLCA | 1 |
| p.G666E | SKCM | 1 |
| p.D361H | ESCA | 1 |
| p.E29K | BLCA | 1 |
| p.G554E | LGG | 1 |
| p.G685D | SKCM | 1 |
| p.L188I | UCEC | 1 |
| p.P809Q | LUAD | 1 |
| p.N259S | COAD | 1 |
| Top |
| TissGeneCNV for HSPA4L |
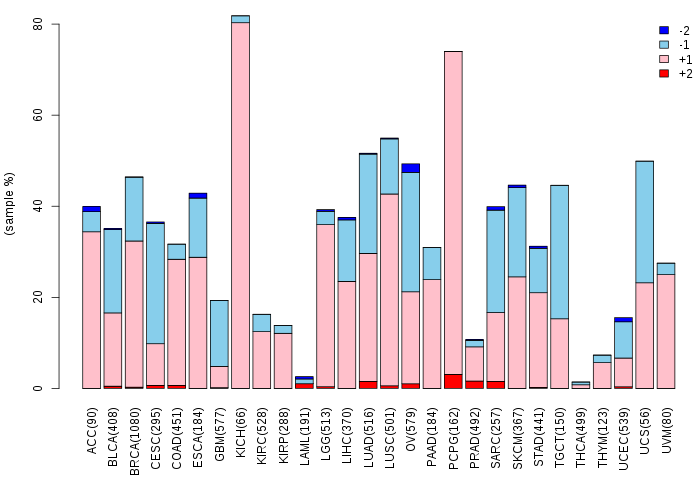
| Copy number variations of TissGene across 28 cancer types (X-axis: cancer type and Y-axis: % of CNV samples) (TCGA Gistic2_CopyNumber_Gistic2_all_data_by_genes, Gistic2 copy number data, version 2016-08-16) |
 |
| Top |
| TissGeneFusions for HSPA4L |
| Fusion genes including TissGene (ChimerDB 3.0, 2016-12-01 and TCGA fusion Portal 2015-12-01) |
| Database | Src | Cancer type | Sample | Fusion gene | ORF | 5'-gene BP | 3'-gene BP |
| Chimerdb3.0 | ChiTaRs | NA | BF746859 | HSPA4L-DSP | chr4:128754142 | chr6:7586608 | |
| Chimerdb3.0 | ChiTaRs | NA | BF700151 | C15orf63-HSPA4L | chr15:44094039 | chr4:128734053 |
| Top |
| TissGeneNet for HSPA4L |
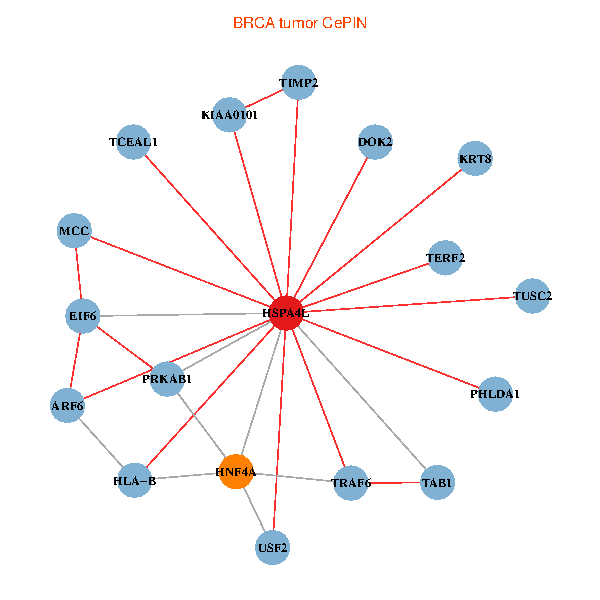
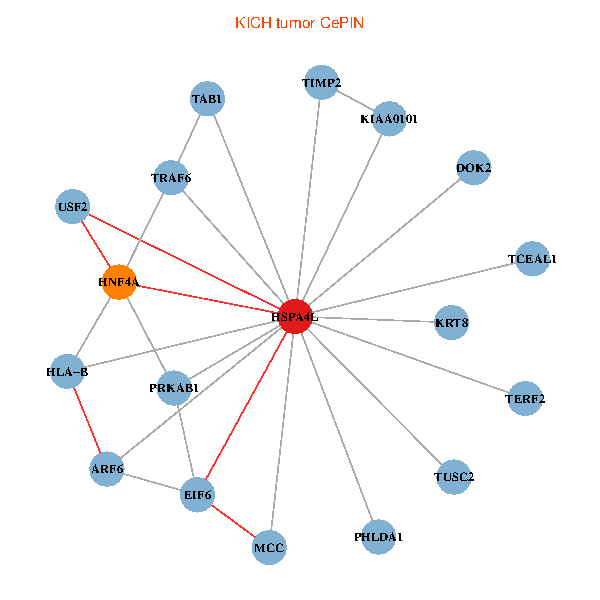
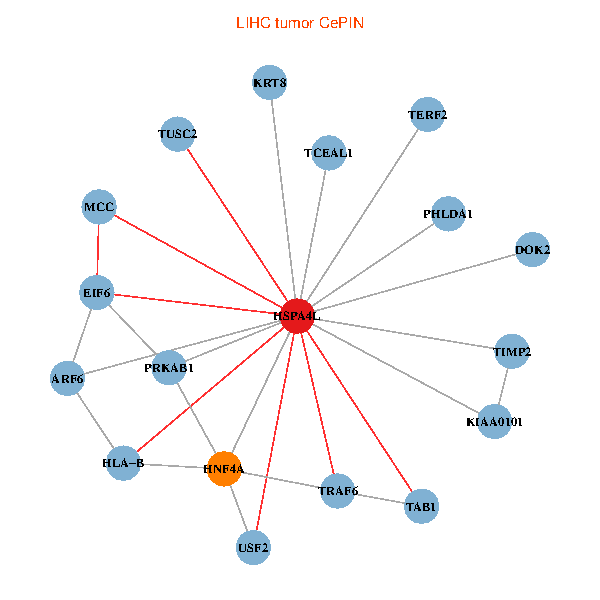
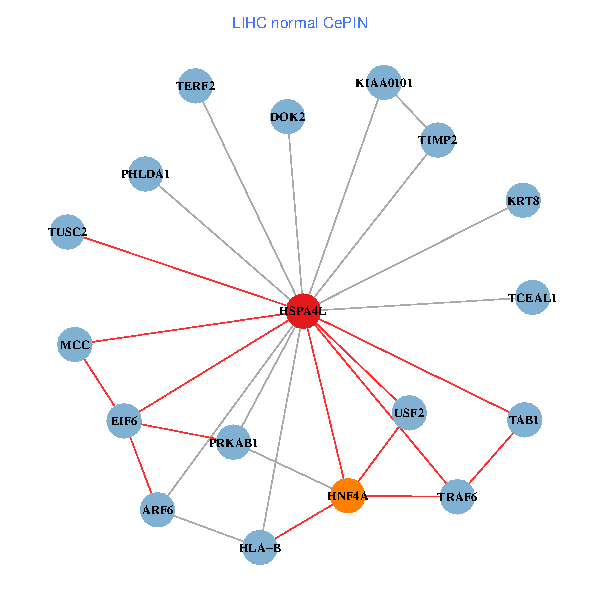
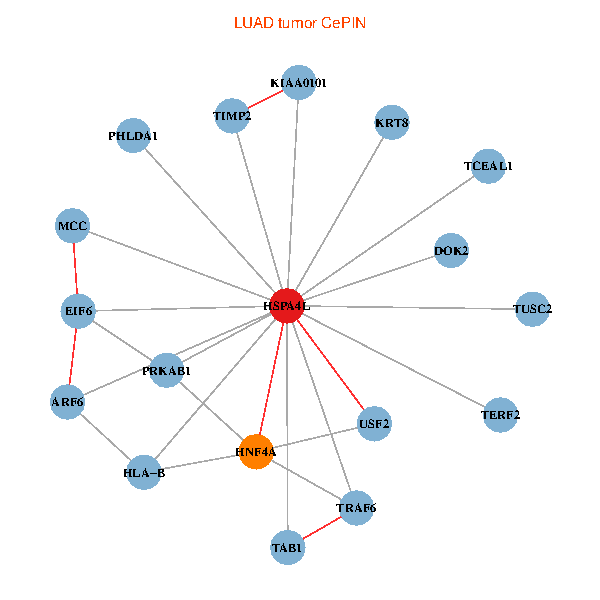
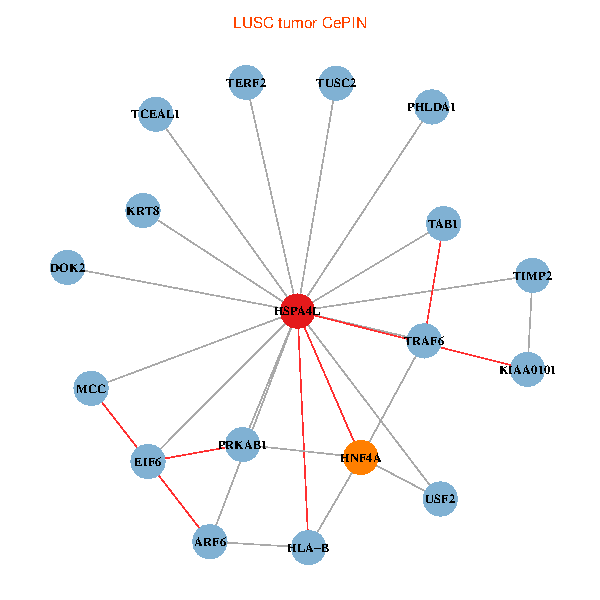
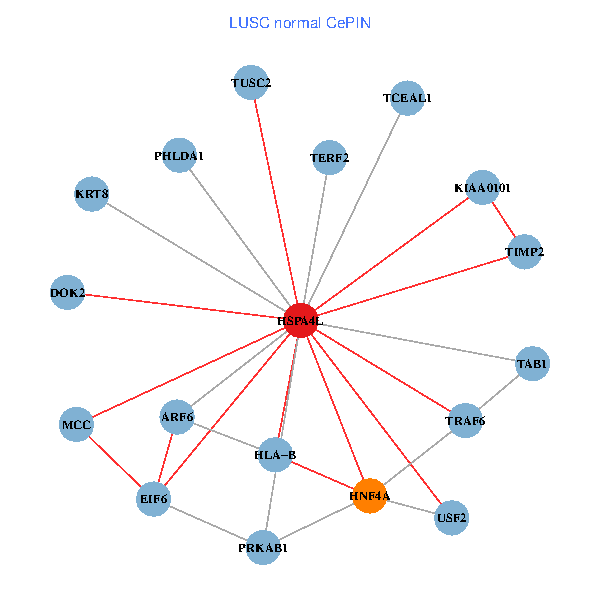
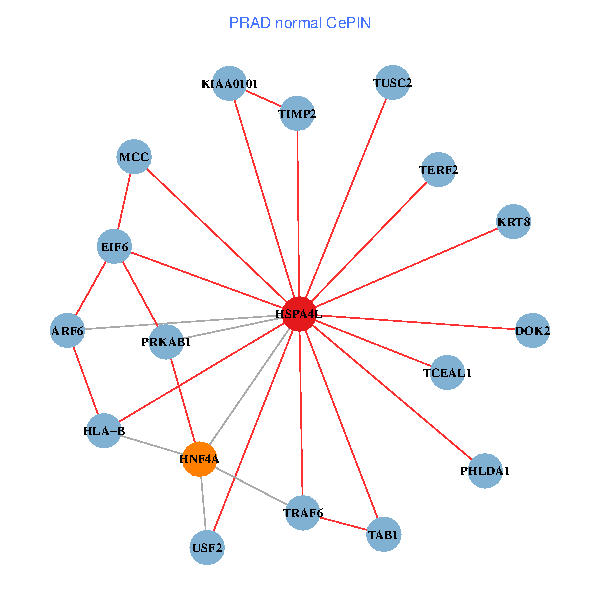
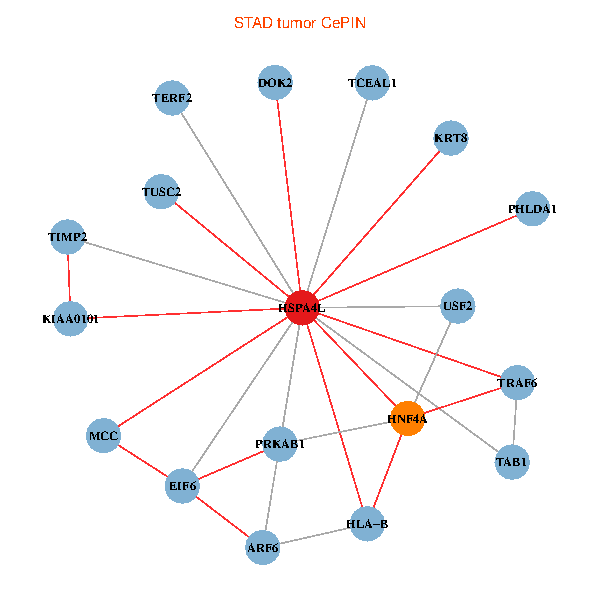
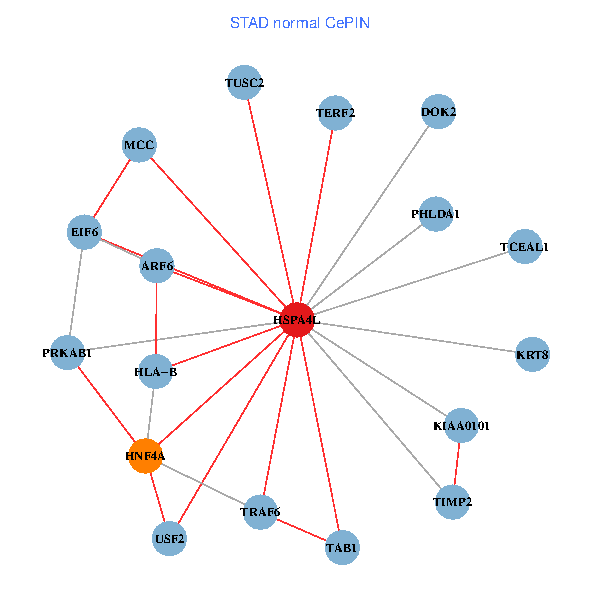
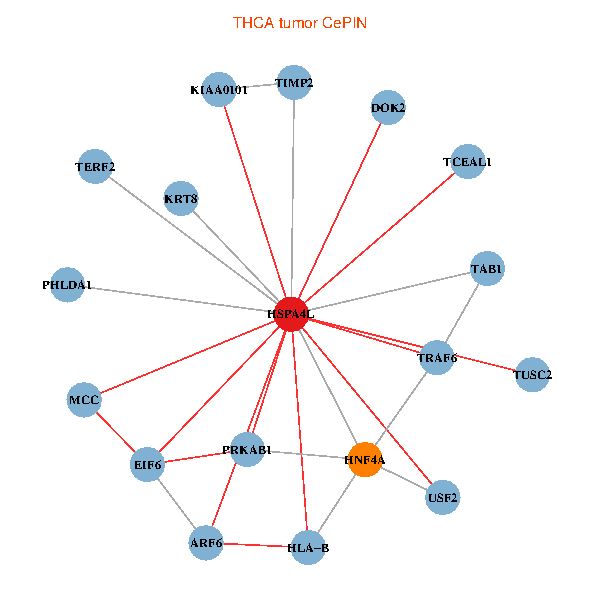
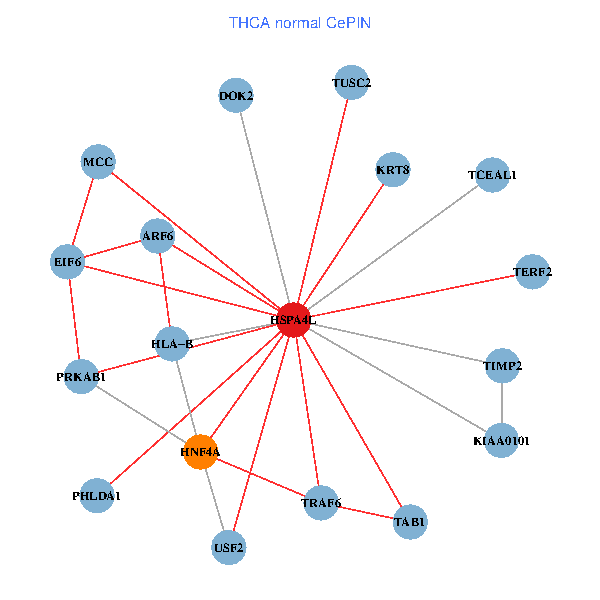
| Co-expressed gene networks based on protein-protein interaction data (CePIN) (TCGA IlluminaHiSeq_RNASeqV2, pan-cancer normalized log2(norm_counts+1) data, version 2016-08-16) (PINA2 ppi data) |
| BRCA (tumor) | BRCA (normal) |
| HSPA4L, HNF4A, TRAF6, KIAA0101, TERF2, HLA-B, MCC, KRT8, USF2, TIMP2, PRKAB1, ARF6, TAB1, EIF6, PHLDA1, TCEAL1, DOK2, TUSC2 (tumor) | HSPA4L, HNF4A, TRAF6, KIAA0101, TERF2, HLA-B, MCC, KRT8, USF2, TIMP2, PRKAB1, ARF6, TAB1, EIF6, PHLDA1, TCEAL1, DOK2, TUSC2 (normal) |
 |  |
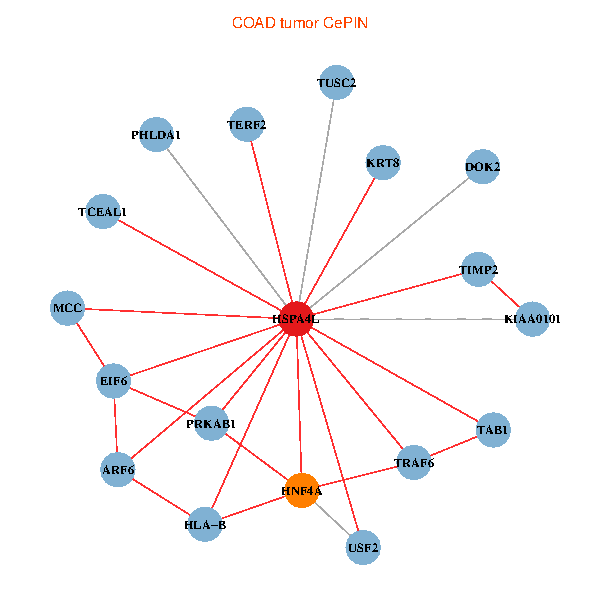
| COAD (tumor) | COAD (normal) |
| HSPA4L, HNF4A, TRAF6, KIAA0101, TERF2, HLA-B, MCC, KRT8, USF2, TIMP2, PRKAB1, ARF6, TAB1, EIF6, PHLDA1, TCEAL1, DOK2, TUSC2 (tumor) | HSPA4L, HNF4A, TRAF6, KIAA0101, TERF2, HLA-B, MCC, KRT8, USF2, TIMP2, PRKAB1, ARF6, TAB1, EIF6, PHLDA1, TCEAL1, DOK2, TUSC2 (normal) |
 |  |
| HNSC (tumor) | HNSC (normal) |
| HSPA4L, HNF4A, TRAF6, KIAA0101, TERF2, HLA-B, MCC, KRT8, USF2, TIMP2, PRKAB1, ARF6, TAB1, EIF6, PHLDA1, TCEAL1, DOK2, TUSC2 (tumor) | HSPA4L, HNF4A, TRAF6, KIAA0101, TERF2, HLA-B, MCC, KRT8, USF2, TIMP2, PRKAB1, ARF6, TAB1, EIF6, PHLDA1, TCEAL1, DOK2, TUSC2 (normal) |
 |  |
| KICH (tumor) | KICH (normal) |
| HSPA4L, HNF4A, TRAF6, KIAA0101, TERF2, HLA-B, MCC, KRT8, USF2, TIMP2, PRKAB1, ARF6, TAB1, EIF6, PHLDA1, TCEAL1, DOK2, TUSC2 (tumor) | HSPA4L, HNF4A, TRAF6, KIAA0101, TERF2, HLA-B, MCC, KRT8, USF2, TIMP2, PRKAB1, ARF6, TAB1, EIF6, PHLDA1, TCEAL1, DOK2, TUSC2 (normal) |
 |  |
| KIRC (tumor) | KIRC (normal) |
| HSPA4L, HNF4A, TRAF6, KIAA0101, TERF2, HLA-B, MCC, KRT8, USF2, TIMP2, PRKAB1, ARF6, TAB1, EIF6, PHLDA1, TCEAL1, DOK2, TUSC2 (tumor) | HSPA4L, HNF4A, TRAF6, KIAA0101, TERF2, HLA-B, MCC, KRT8, USF2, TIMP2, PRKAB1, ARF6, TAB1, EIF6, PHLDA1, TCEAL1, DOK2, TUSC2 (normal) |
 |  |
| KIRP (tumor) | KIRP (normal) |
| HSPA4L, HNF4A, TRAF6, KIAA0101, TERF2, HLA-B, MCC, KRT8, USF2, TIMP2, PRKAB1, ARF6, TAB1, EIF6, PHLDA1, TCEAL1, DOK2, TUSC2 (tumor) | HSPA4L, HNF4A, TRAF6, KIAA0101, TERF2, HLA-B, MCC, KRT8, USF2, TIMP2, PRKAB1, ARF6, TAB1, EIF6, PHLDA1, TCEAL1, DOK2, TUSC2 (normal) |
 |  |
| LIHC (tumor) | LIHC (normal) |
| HSPA4L, HNF4A, TRAF6, KIAA0101, TERF2, HLA-B, MCC, KRT8, USF2, TIMP2, PRKAB1, ARF6, TAB1, EIF6, PHLDA1, TCEAL1, DOK2, TUSC2 (tumor) | HSPA4L, HNF4A, TRAF6, KIAA0101, TERF2, HLA-B, MCC, KRT8, USF2, TIMP2, PRKAB1, ARF6, TAB1, EIF6, PHLDA1, TCEAL1, DOK2, TUSC2 (normal) |
 |  |
| LUAD (tumor) | LUAD (normal) |
| HSPA4L, HNF4A, TRAF6, KIAA0101, TERF2, HLA-B, MCC, KRT8, USF2, TIMP2, PRKAB1, ARF6, TAB1, EIF6, PHLDA1, TCEAL1, DOK2, TUSC2 (tumor) | HSPA4L, HNF4A, TRAF6, KIAA0101, TERF2, HLA-B, MCC, KRT8, USF2, TIMP2, PRKAB1, ARF6, TAB1, EIF6, PHLDA1, TCEAL1, DOK2, TUSC2 (normal) |
 |  |
| LUSC (tumor) | LUSC (normal) |
| HSPA4L, HNF4A, TRAF6, KIAA0101, TERF2, HLA-B, MCC, KRT8, USF2, TIMP2, PRKAB1, ARF6, TAB1, EIF6, PHLDA1, TCEAL1, DOK2, TUSC2 (tumor) | HSPA4L, HNF4A, TRAF6, KIAA0101, TERF2, HLA-B, MCC, KRT8, USF2, TIMP2, PRKAB1, ARF6, TAB1, EIF6, PHLDA1, TCEAL1, DOK2, TUSC2 (normal) |
 |  |
| PRAD (tumor) | PRAD (normal) |
| HSPA4L, HNF4A, TRAF6, KIAA0101, TERF2, HLA-B, MCC, KRT8, USF2, TIMP2, PRKAB1, ARF6, TAB1, EIF6, PHLDA1, TCEAL1, DOK2, TUSC2 (tumor) | HSPA4L, HNF4A, TRAF6, KIAA0101, TERF2, HLA-B, MCC, KRT8, USF2, TIMP2, PRKAB1, ARF6, TAB1, EIF6, PHLDA1, TCEAL1, DOK2, TUSC2 (normal) |
 |  |
| STAD (tumor) | STAD (normal) |
| HSPA4L, HNF4A, TRAF6, KIAA0101, TERF2, HLA-B, MCC, KRT8, USF2, TIMP2, PRKAB1, ARF6, TAB1, EIF6, PHLDA1, TCEAL1, DOK2, TUSC2 (tumor) | HSPA4L, HNF4A, TRAF6, KIAA0101, TERF2, HLA-B, MCC, KRT8, USF2, TIMP2, PRKAB1, ARF6, TAB1, EIF6, PHLDA1, TCEAL1, DOK2, TUSC2 (normal) |
 |  |
| THCA (tumor) | THCA (normal) |
| HSPA4L, HNF4A, TRAF6, KIAA0101, TERF2, HLA-B, MCC, KRT8, USF2, TIMP2, PRKAB1, ARF6, TAB1, EIF6, PHLDA1, TCEAL1, DOK2, TUSC2 (tumor) | HSPA4L, HNF4A, TRAF6, KIAA0101, TERF2, HLA-B, MCC, KRT8, USF2, TIMP2, PRKAB1, ARF6, TAB1, EIF6, PHLDA1, TCEAL1, DOK2, TUSC2 (normal) |
 |  |
| Top |
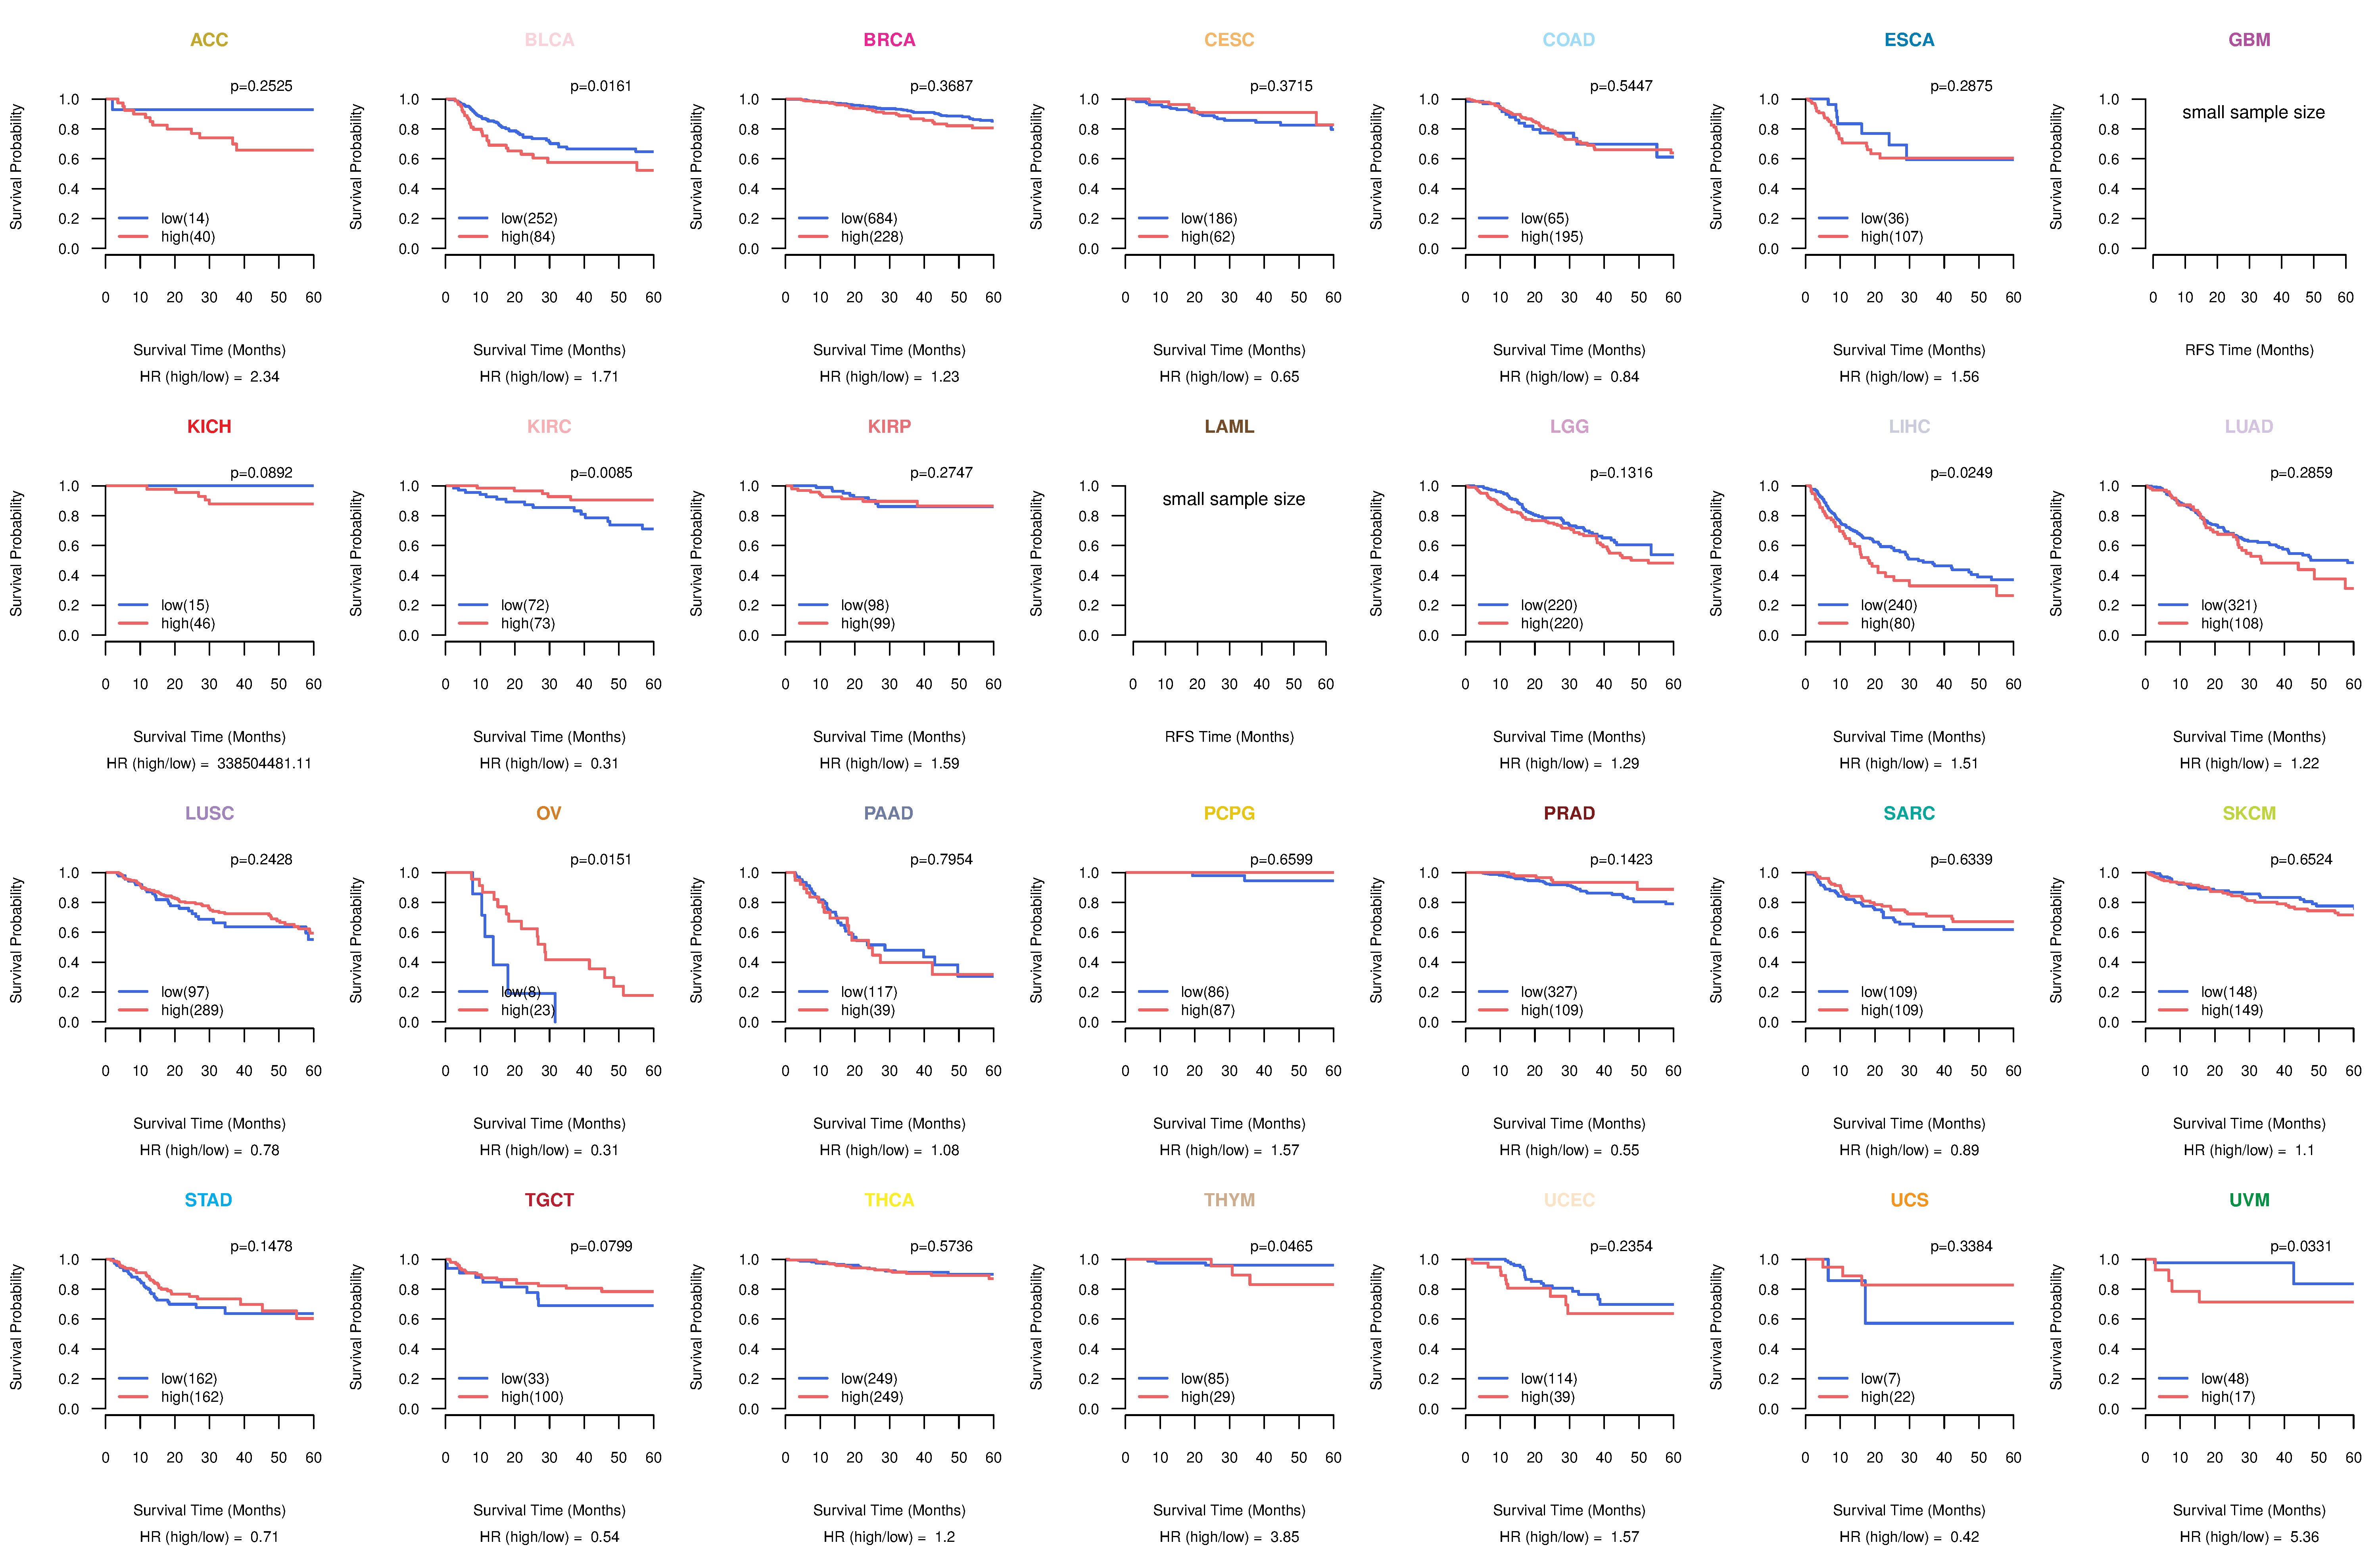
| TissGeneProg for HSPA4L |
| Kaplan-Meier plots with logrank tests of overall survival (OS) using 28 cancer types (TCGA IlluminaHiSeq_RNASeqV2, pan-cancer normalized log2(norm_counts+1) data, version 2016-08-16) (TCGA clinicalMatrix, phenotype data, version 2016-04-27) * Click on the image to enlarge it in a new window. |
 |
| Kaplan-Meier plots with logrank test of relapse free survival (RFS) using 28 cancer types (TCGA IlluminaHiSeq_RNASeqV2, pan-cancer normalized log2(norm_counts+1) data, version 2016-08-16) (TCGA clinicalMatrix, phenotype data, version 2016-04-27) * Click on the image enlarge it in a new window. |
 |
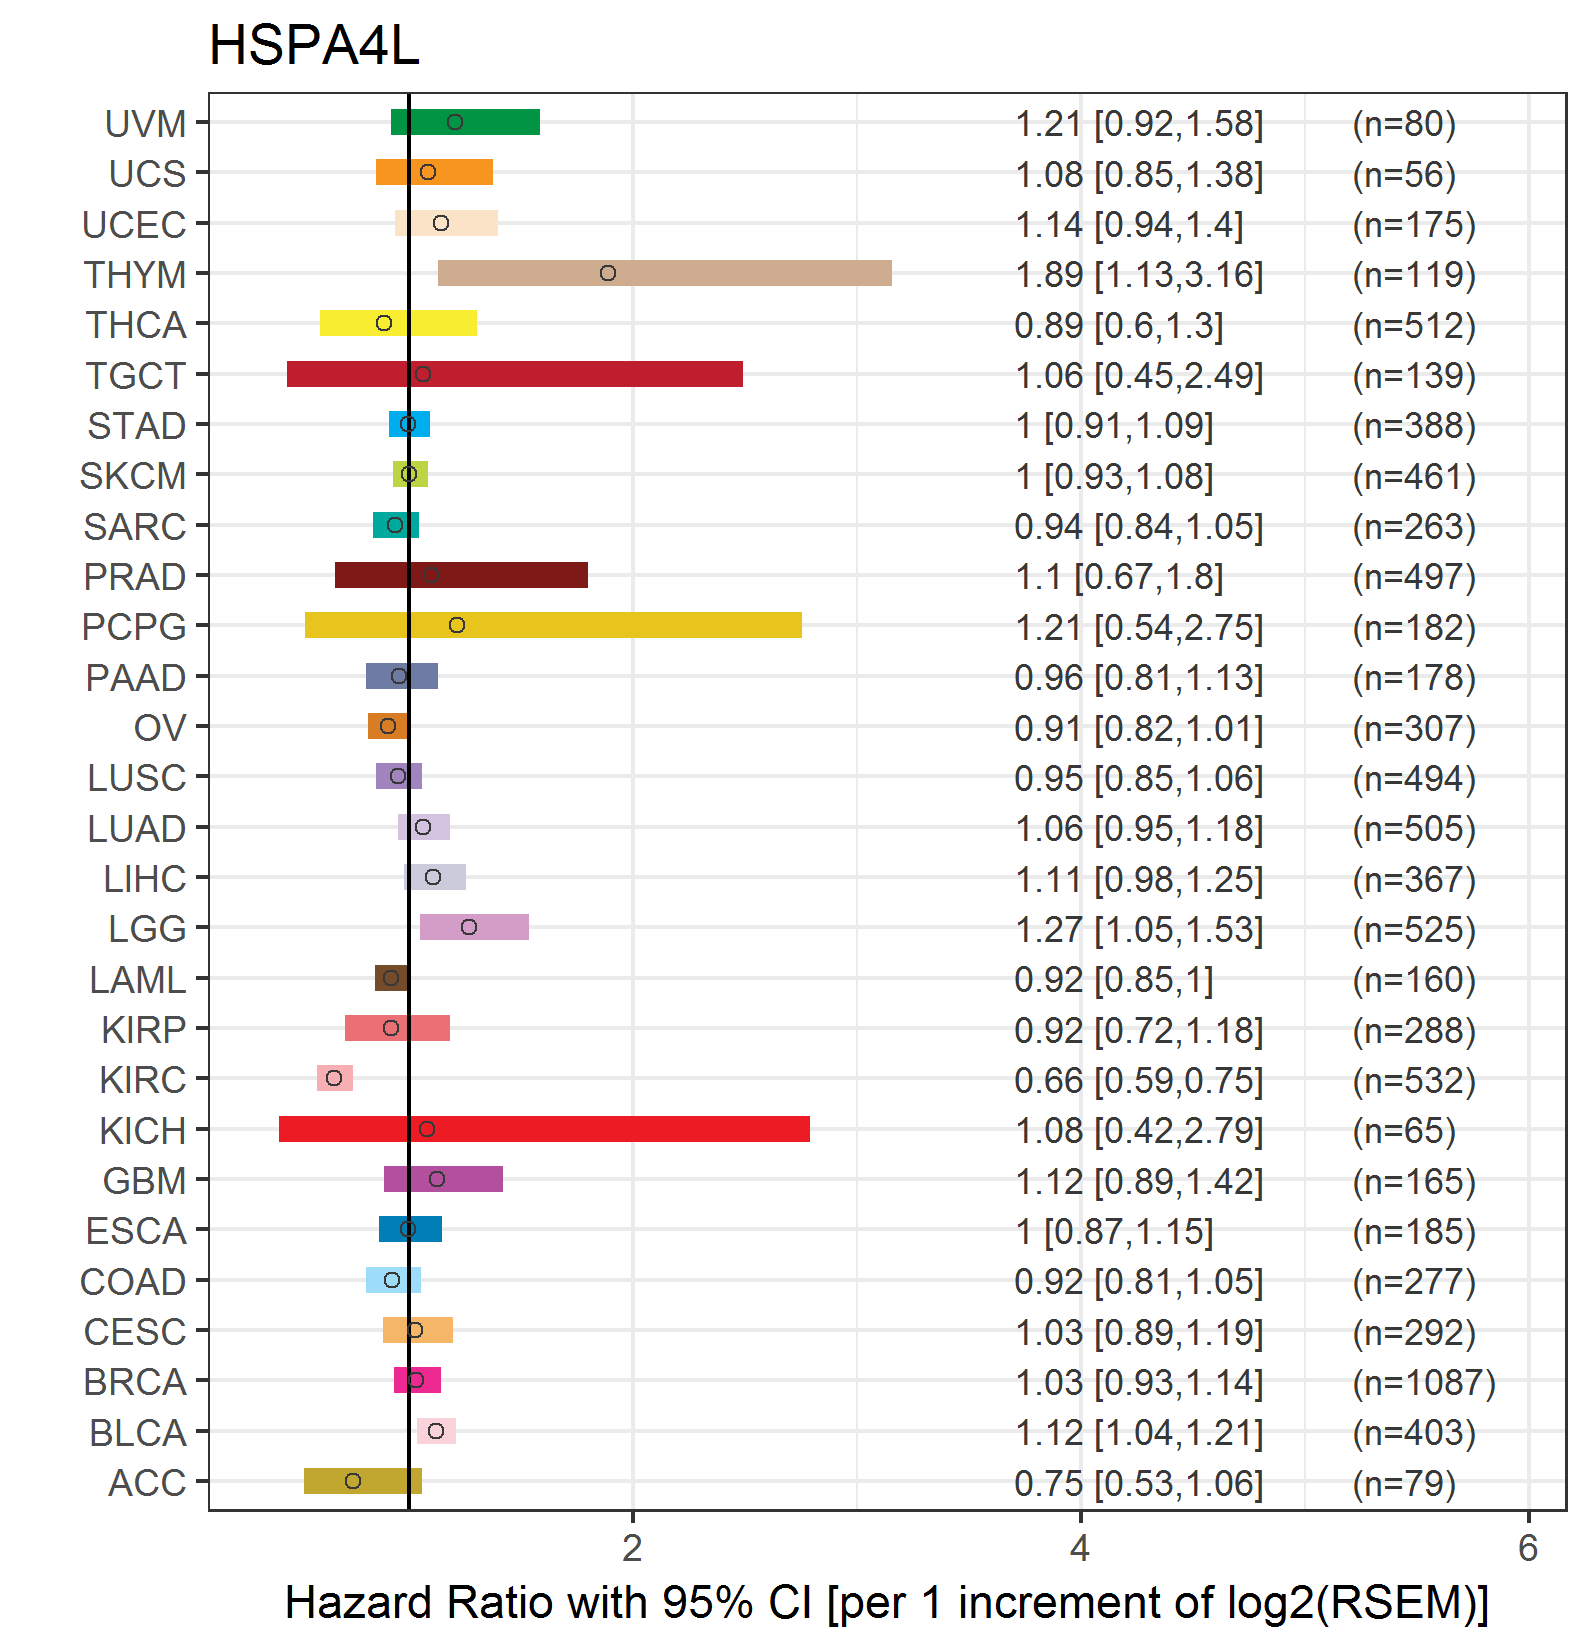
| Forest plot of Cox proportional hazard ratio (HR) and 95% CI of overall survival (OS) using 28 cancer types (TCGA IlluminaHiSeq_RNASeqV2, pan-cancer normalized log2(norm_counts+1) data, version 2016-08-16) (TCGA clinicalMatrix, phenotype data, version 2016-04-27) * Click on the image enlarge it in a new window. |
 |
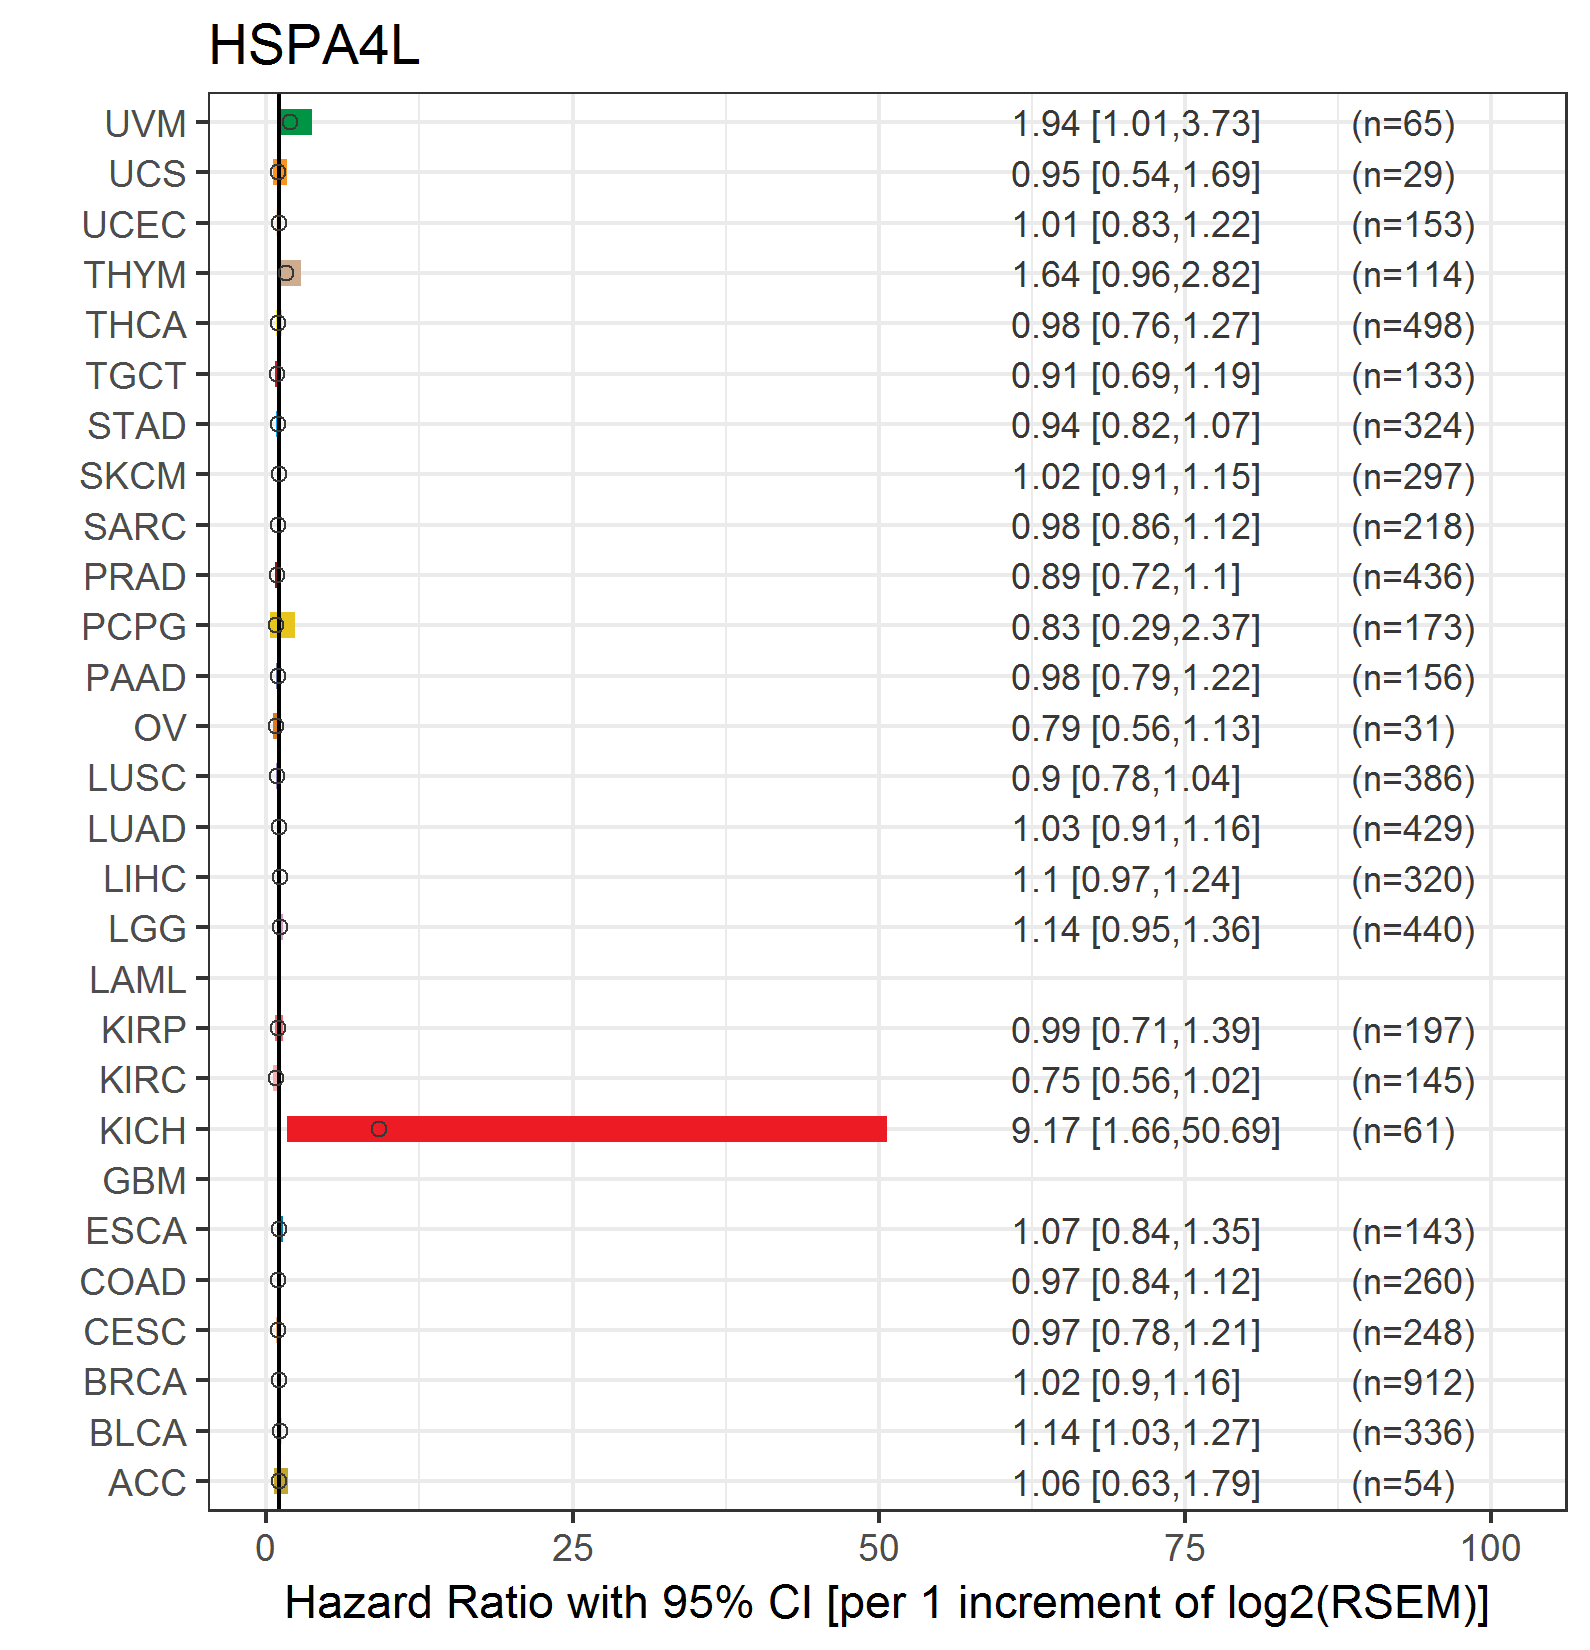
| Forest plot of Cox proportional hazard ratio (HR) and 95% CI of relapse free survival (RFS) using 28 cancer types (TCGA IlluminaHiSeq_RNASeqV2, pan-cancer normalized log2(norm_counts+1) data, version 2016-08-16) (TCGA clinicalMatrix, phenotype data, version 2016-04-27) * Click on the image enlarge it in a new window. |
 |
| Top |
| TissGeneClin for HSPA4L |
| TissGeneDrug for HSPA4L |
| Drug information targeting TissGene (DrugBank Version 5.0.6, 2017-04-01) |
| DrugBank ID | Drug name | Drug activity | Drug type | Drug status |
| Top |
| TissGeneDisease for HSPA4L |
| Disease information associated with TissGene (DisGeNet, 2016-06-01) |
| Disease ID | Disease name | # pubmeds | Source |
| umls:C0023418 | leukemia | 1 | BeFree |
| umls:C0029456 | Osteoporosis | 1 | GAD |
|
Copyright 2016-Present - The University of Texas Health Science Center at Houston (UTHealth) Web File Viewing | How to Report, Fraud, Waste and Abuse | State of Texas | Statewide Search | Texas Homeland Security | Site Policies |