 |
| |
| |
| |
| |
| |
| |
|

| TissGeneSummary for RPH3A |
 Gene summary Gene summary |
| Basic gene information | Gene symbol | RPH3A |
| Gene name | rabphilin 3A | |
| Synonyms | - | |
| Cytomap | UCSC genome browser: 12q24.13 | |
| Type of gene | protein-coding | |
| RefGenes | NM_001143854.1, NM_014954.3, | |
| Description | exophilin-1rabphilin 3A homolograbphilin-3A | |
| Modification date | 20141207 | |
| dbXrefs | MIM : 612159 | |
| HGNC : HGNC | ||
| Ensembl : ENSG00000089169 | ||
| HPRD : 15273 | ||
| Vega : OTTHUMG00000169713 | ||
| Protein | UniProt: go to UniProt's Cross Reference DB Table | |
| Expression | CleanEX: HS_RPH3A | |
| BioGPS: 22895 | ||
| Pathway | NCI Pathway Interaction Database: RPH3A | |
| KEGG: RPH3A | ||
| REACTOME: RPH3A | ||
| Pathway Commons: RPH3A | ||
| Context | iHOP: RPH3A | |
| ligand binding site mutation search in PubMed: RPH3A | ||
| UCL Cancer Institute: RPH3A | ||
| Assigned class in TissGDB* | C | |
| Included tissue-specific gene expression resources | HPA,TiGER | |
| Specific-tissues in normal samples (assigned by TissGDB using HPA, TiGER, and GTEx) | Brain | |
| Cancer types related to the specific-tissues in cancer samples (assigned by TissGDB using TCGA) | GBM,LGG | |
| Reference showing the relevant tissue of RPH3A | ||
| Description by TissGene annotations | Have significant anti-correlated miRNA | |
| * Class A consists of genes with literature evidence and is part of the cTissGenes. Class B consists of only cTissGenes without additional evidence. The remaining genes belong to Class C. |
| Gene ontology having evidence of Inferred from Direct Assay (IDA) from Entrez |
| GO ID | GO term | PubMed ID |
| Top |
| TissGeneExp for RPH3A |
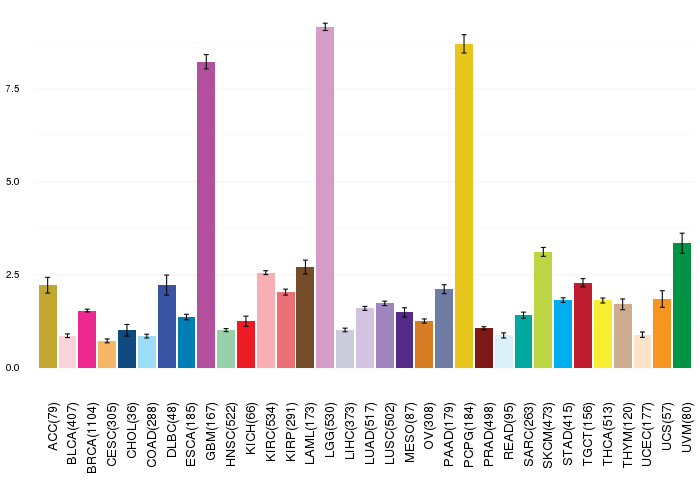
| Gene expressions across 28 cancer types (X-axis: cancer type and Y-axis: log2(norm_counts+1)) (TCGA IlluminaHiSeq_RNASeqV2, pan-cancer normalized log2(norm_counts+1) data, version 2016-08-16) |
 |
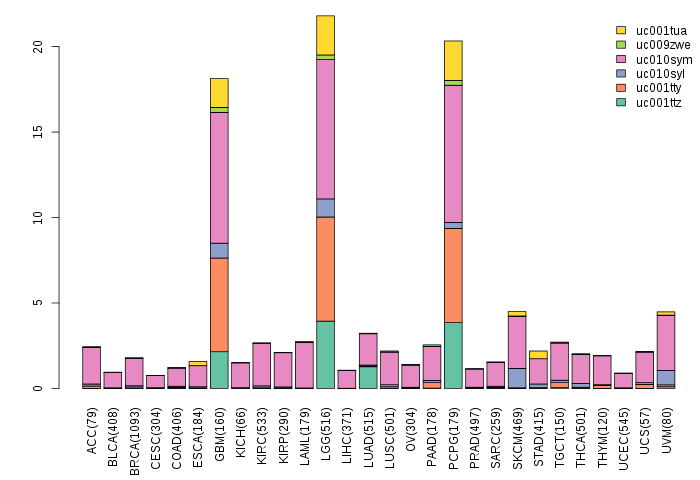
| Gene isoform expressions across 28 cancer types (X-axis: cancer type and Y-axis: log2(norm_counts+1)) (TCGA pan-cancer tcga_rsem_isoform_tpm, version 2016-09-01) |
 |
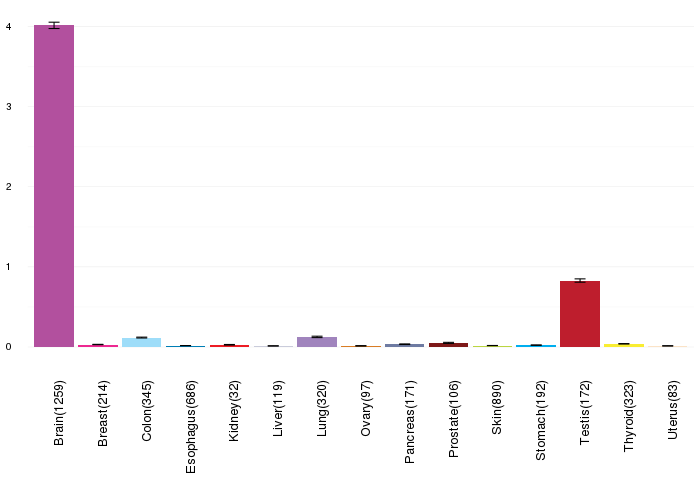
| Gene expressions across normal tissues of GTEx data (GTEx GTEx_Analysis_v6_RNA-seq_RNA-SeQCv1.1.8_gene_rpkm.gct) - Here, we shows the matched tissue types only among our 28 cancer types. |
 |
| Different expressions across 14 cancer types with more than 10 samples between matched tumors and normals (X-axis: cancer type and Y-axis: log2(norm_counts+1)) (TCGA IlluminaHiSeq_RNASeqV2, pan-cancer normalized log2(norm_counts+1) data, version 2016-08-16) |
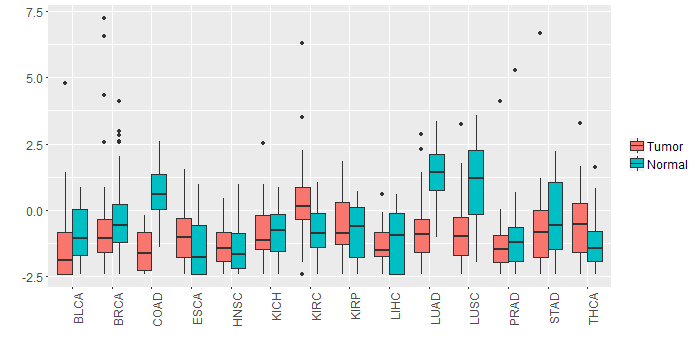 |
| - Significantly differentially expressed cancer types and information. (|Fold change|>1 and FDR<0.05) |
| Cancer type | Mean(exp) in tumor | Mean(exp) in matched normal | Log2FC | P-val. | FDR |
| LUAD | -0.810001368 | 1.353971046 | -2.163972414 | 3.98E-19 | 6.87E-18 |
| LUSC | -0.807450929 | 1.062990248 | -1.870441176 | 8.26E-11 | 3.16E-10 |
| COAD | -1.503330944 | 0.658030595 | -2.161361538 | 1.03E-11 | 2.01E-10 |
| KIRC | 0.315770232 | -0.820188102 | 1.135958333 | 5.46E-09 | 1.70E-08 |
| Top |
| TissGene-miRNA for RPH3A |
| Significantly anti-correlated miRNAs of TissGene across 28 cancer types (Gene-miRNA relations from TargetScanHuman Relsease 7.1, Conserved_Site_Context_Scores.txt.zip, 06.01.2016) (TCGA IlluminaHiSeq_miRNASeq, log2(RPM+1) data, version 2016-11-21) (TCGA IlluminaHiSeq_RNASeqV2, log2(normalized_count+1) data, version 2016-08-16) (Spearman’s Rank Correlation (p-value<0.05 and coefficient<-0.25)) |
| Cancer type | miRNA id | miRNA accession | P-val. | Coeff. | # samples |
| UCS | hsa-miR-502-3p | MIMAT0004775 | 0.047 | -0.27 | 56 |
| LUAD | hsa-miR-31-5p | MIMAT0000089 | 0.0092 | -0.35 | 60 |
| Top |
| TissGeneMut for RPH3A |
| TissGeneSNV for RPH3A |
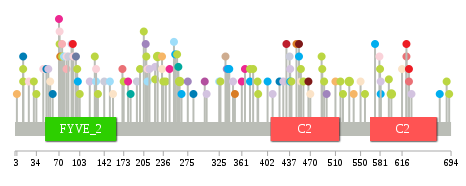
| nsSNV counts per each loci. Different colors of circles represent different cancer types. Circle size denotes number of samples. (TCGA somatic mutation (SNPs and small INDELs) data, version 2016-04-25) * Click on the image to enlarge it in a new window. |
 |
 |
| Somatic nucleotide variants of TissGene across 28 cancer types (X-axis: cancer type and Y-axis: % of mutated samples) The numbers in parentheses are numbers of samples with mutation (nsSNVs). (TCGA somatic mutation (SNPs and small INDELs) data, version 2016-04-25) |
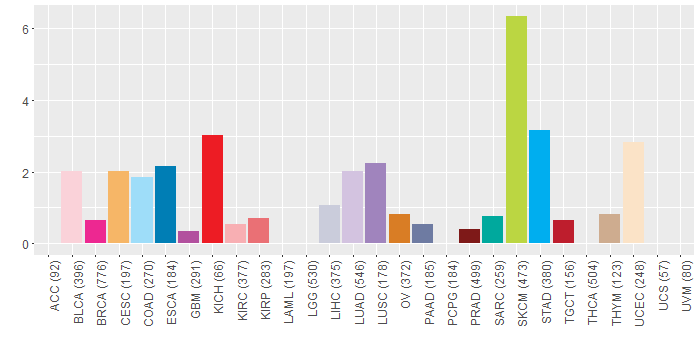 |
| - nsSNVs sorted by frequency. |
| AAchange | Cancer type | # samples |
| p.R532Q | SKCM | 2 |
| p.G599R | SKCM | 2 |
| p.R262Q | SKCM | 2 |
| p.G227E | SKCM | 2 |
| p.A265S | STAD | 1 |
| p.R236Q | SKCM | 1 |
| p.H627Q | KICH | 1 |
| p.W13* | SKCM | 1 |
| p.G211V | BLCA | 1 |
| p.Q22* | BLCA | 1 |
| p.R452Q | STAD | 1 |
| p.G350R | OV | 1 |
| p.P421S | ESCA | 1 |
| p.R240Q | SKCM | 1 |
| p.D386N | SKCM | 1 |
| p.K510T | CESC | 1 |
| p.V432F | TGCT | 1 |
| p.R97H | PAAD | 1 |
| p.A275S | LUSC | 1 |
| p.S34F | SKCM | 1 |
| p.D347E | LUAD | 1 |
| p.R129H | COAD | 1 |
| p.H623N | KIRP | 1 |
| p.R452W | PRAD | 1 |
| p.W455X | SKCM | 1 |
| p.K119N | LUAD | 1 |
| p.Q284X | ESCA | 1 |
| p.R71Q | SKCM | 1 |
| p.G223E | SKCM | 1 |
| p.P374L | SKCM | 1 |
| p.T527I | READ | 1 |
| p.E539K | CESC | 1 |
| p.R78C | COAD | 1 |
| p.D3H | CESC | 1 |
| p.M580K | BLCA | 1 |
| p.R45M | BLCA | 1 |
| p.H627N | KIRP | 1 |
| p.G489D | SKCM | 1 |
| p.Y402C | STAD | 1 |
| p.G127E | SKCM | 1 |
| p.R448Q | OV | 1 |
| p.A341S | STAD | 1 |
| p.V691M | SKCM | 1 |
| p.Q30* | SKCM | 1 |
| p.V90L | LUAD | 1 |
| p.R82C | BLCA | 1 |
| p.A223D | LUAD | 1 |
| p.P366R | BRCA | 1 |
| p.P194H | LIHC | 1 |
| p.K173T | SKCM | 1 |
| p.V687M | SKCM | 1 |
| p.P184S | SARC | 1 |
| p.Y339H | STAD | 1 |
| p.N92S | KICH | 1 |
| p.G467D | PRAD | 1 |
| p.E550* | UCEC | 1 |
| p.L50M | ESCA | 1 |
| p.E56* | UCEC | 1 |
| p.E616K | UCEC | 1 |
| p.P180H | BRCA | 1 |
| p.L437P | LIHC | 1 |
| p.R205K | SKCM | 1 |
| p.S557F | SKCM | 1 |
| p.G255V | STAD | 1 |
| p.R199Q | SKCM | 1 |
| p.R234C | CESC | 1 |
| p.W156* | UCEC | 1 |
| p.G595R | SKCM | 1 |
| p.R75Q | KIRC | 1 |
| p.A440T | SKCM | 1 |
| p.R75Q | SKCM | 1 |
| p.E70K | BRCA | 1 |
| p.P374T | STAD | 1 |
| p.A631T | LUAD | 1 |
| p.W459* | SKCM | 1 |
| p.E488K | SKCM | 1 |
| p.D676Y | STAD | 1 |
| p.R573C | STAD | 1 |
| p.I142M | LIHC | 1 |
| p.A582S | LUAD | 1 |
| p.W13C | ESCA | 1 |
| p.G337R | LUSC | 1 |
| p.N132H | SKCM | 1 |
| p.Q214E | LUAD | 1 |
| p.R234C | UCEC | 1 |
| p.R209K | SKCM | 1 |
| p.R246Q | BRCA | 1 |
| p.A582T | STAD | 1 |
| p.E99K | SKCM | 1 |
| p.S387L | SKCM | 1 |
| p.G305R | LUAD | 1 |
| p.N85I | LIHC | 1 |
| p.M522I | SKCM | 1 |
| p.P302L | GBM | 1 |
| p.P438R | LUAD | 1 |
| p.A361S | BRCA | 1 |
| p.A361E | HNSC | 1 |
| p.Q410R | LUAD | 1 |
| p.E103K | SKCM | 1 |
| p.P171T | KIRP | 1 |
| p.P224H | HNSC | 1 |
| p.E129D | BLCA | 1 |
| p.E72V | OV | 1 |
| p.A151V | COAD | 1 |
| p.E492K | SKCM | 1 |
| p.S260P | SARC | 1 |
| p.R258Q | SKCM | 1 |
| p.E53D | LUAD | 1 |
| p.M518I | SKCM | 1 |
| p.M71I | BLCA | 1 |
| p.L100Q | STAD | 1 |
| p.R60M | ESCA | 1 |
| p.A253T | COAD | 1 |
| p.P327S | SKCM | 1 |
| p.R455Q | UCEC | 1 |
| p.R82H | KIRC | 1 |
| p.K211X | COAD | 1 |
| p.D208H | LUSC | 1 |
| p.P173L | READ | 1 |
| p.R12H | CHOL | 1 |
| p.D470N | UCEC | 1 |
| p.E496K | LUSC | 1 |
| p.G255R | HNSC | 1 |
| p.H623Q | KICH | 1 |
| p.P438L | STAD | 1 |
| p.D93N | BLCA | 1 |
| p.E619K | HNSC | 1 |
| p.G335X | THYM | 1 |
| p.V233M | HNSC | 1 |
| p.R325X | COAD | 1 |
| p.R210G | HNSC | 1 |
| p.L463F | HNSC | 1 |
| p.L427F | LUAD | 1 |
| p.E379K | SKCM | 1 |
| p.D581N | SKCM | 1 |
| p.W13X | SKCM | 1 |
| Top |
| TissGeneCNV for RPH3A |
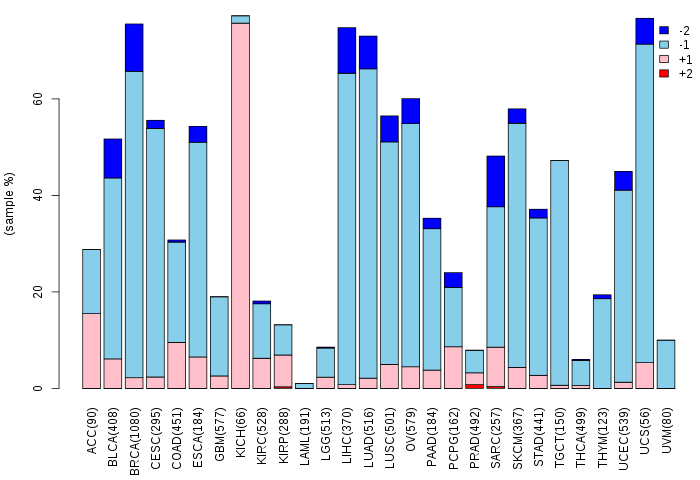
| Copy number variations of TissGene across 28 cancer types (X-axis: cancer type and Y-axis: % of CNV samples) (TCGA Gistic2_CopyNumber_Gistic2_all_data_by_genes, Gistic2 copy number data, version 2016-08-16) |
 |
| Top |
| TissGeneFusions for RPH3A |
| Fusion genes including TissGene (ChimerDB 3.0, 2016-12-01 and TCGA fusion Portal 2015-12-01) |
| Database | Src | Cancer type | Sample | Fusion gene | ORF | 5'-gene BP | 3'-gene BP |
| Chimerdb3.0 | ChiTaRs | NA | DA112381 | PPIL3-RPH3A | chr2:201753887 | chr12:113229729 | |
| TCGAfusionPortal | PRADA | BRCA | TCGA-A8-A06X-01A | OAS3-RPH3A | Out-of-frame | Chr12:113403834 | Chr12:113325602 |
| Top |
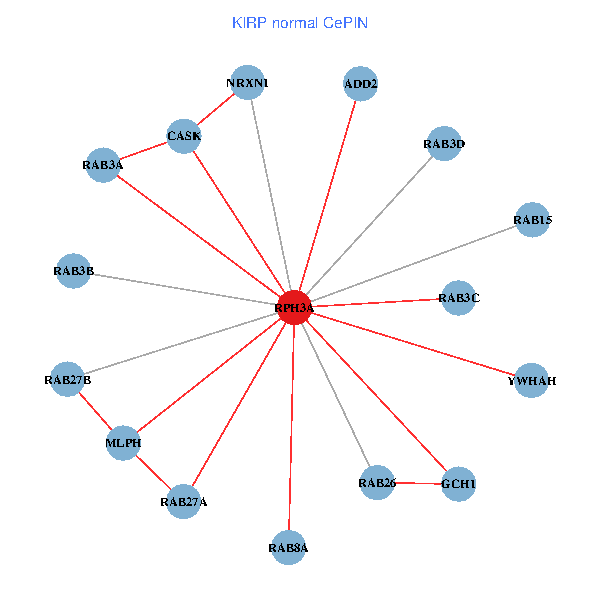
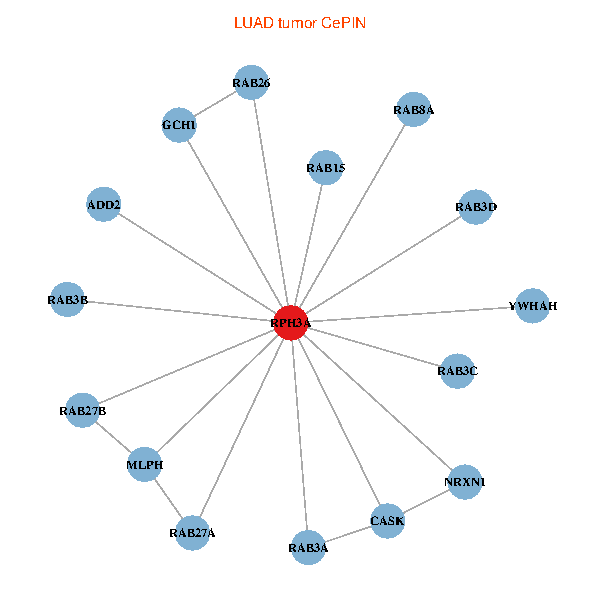
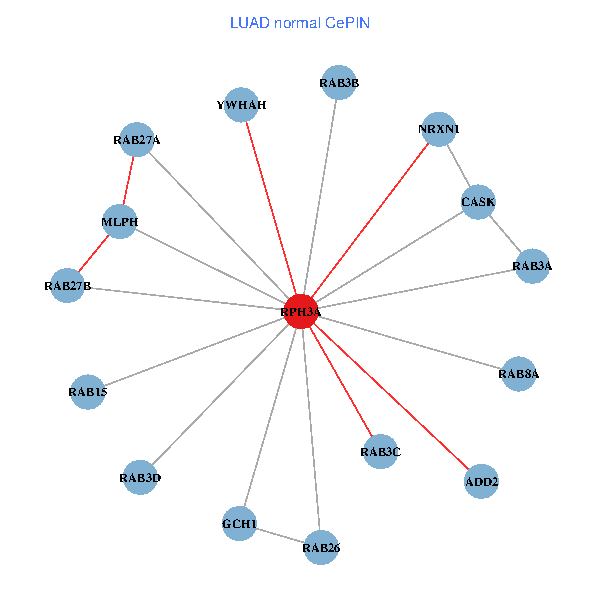
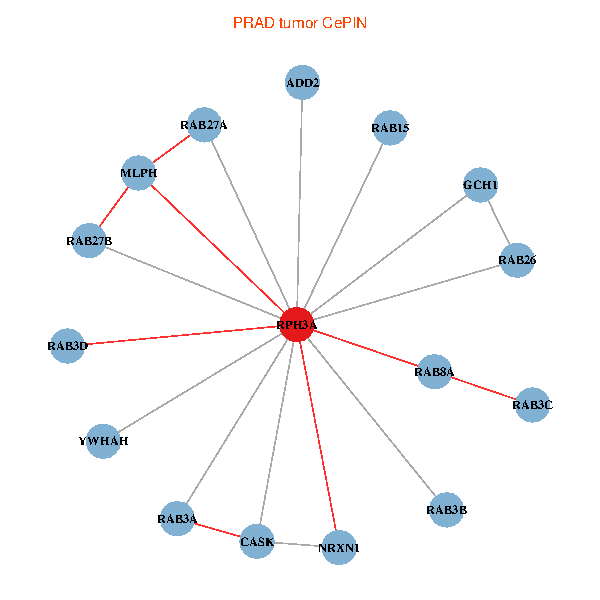
| TissGeneNet for RPH3A |
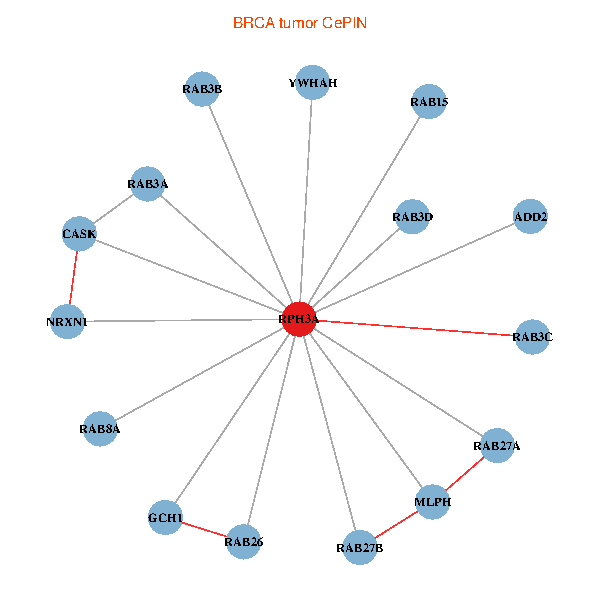
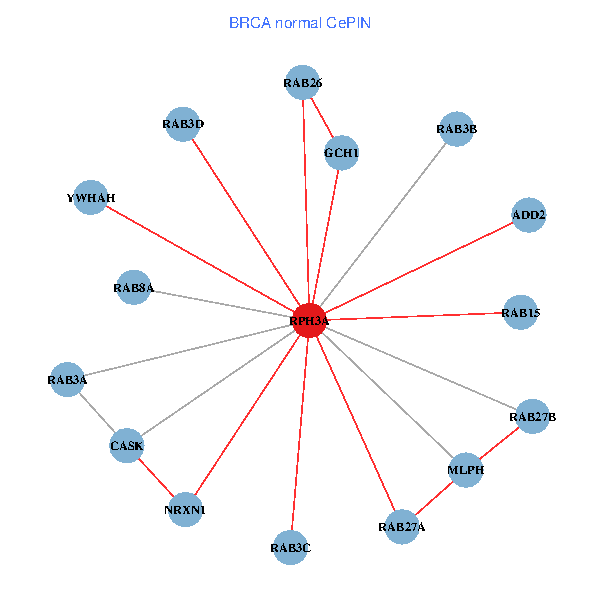
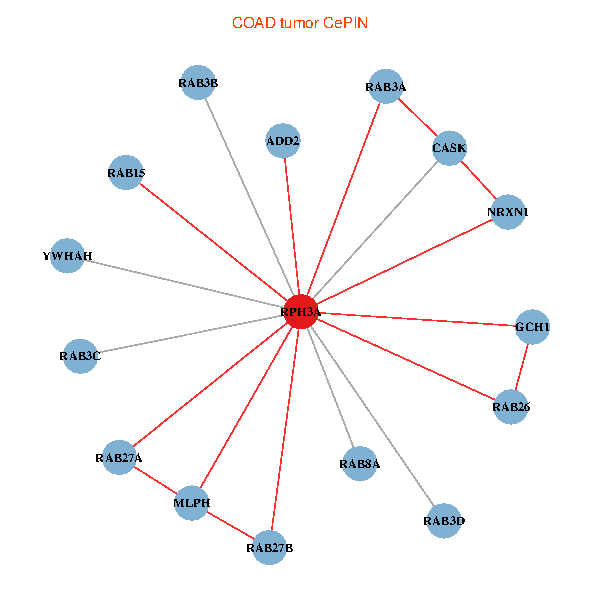
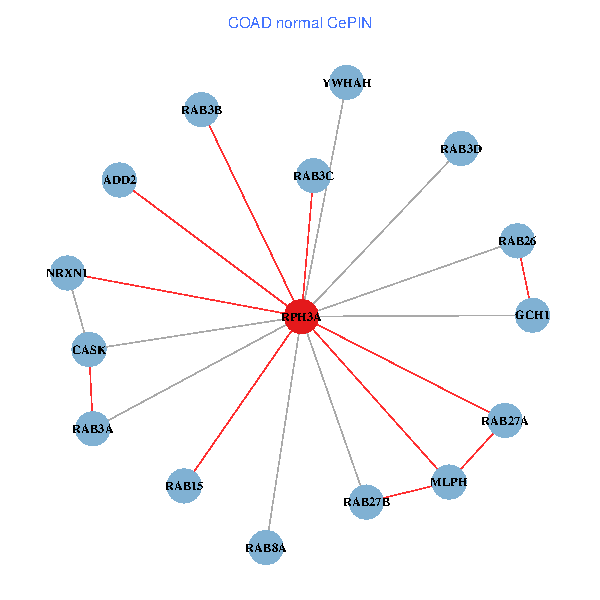
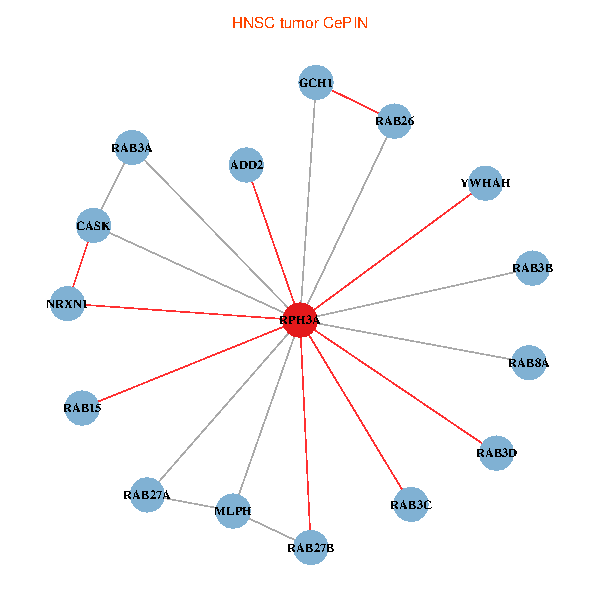
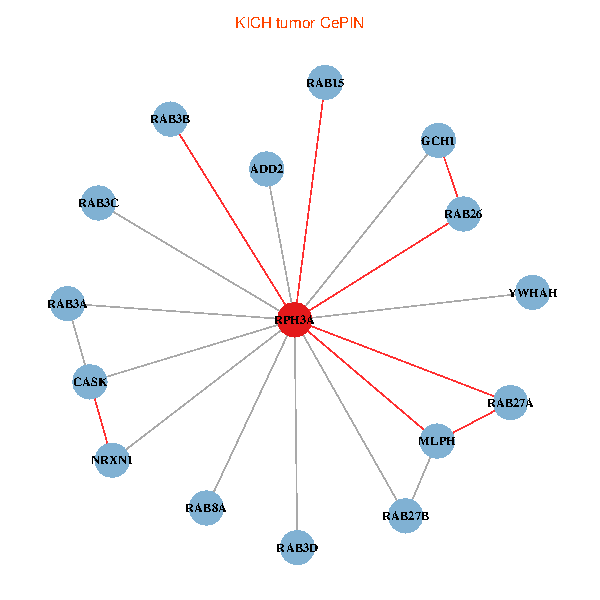
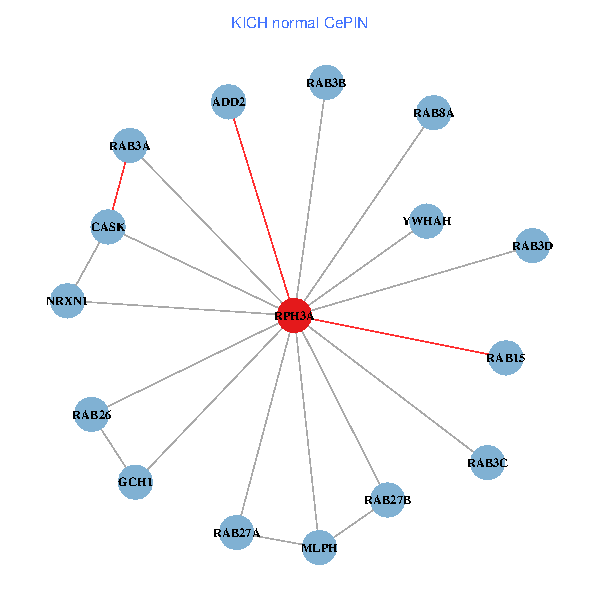
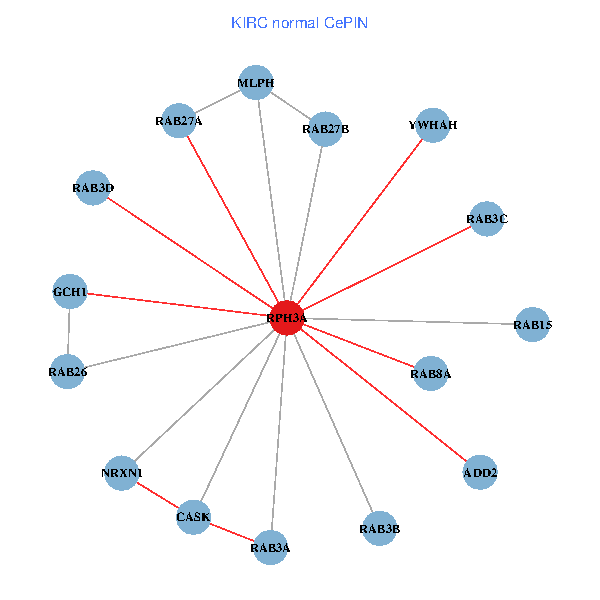
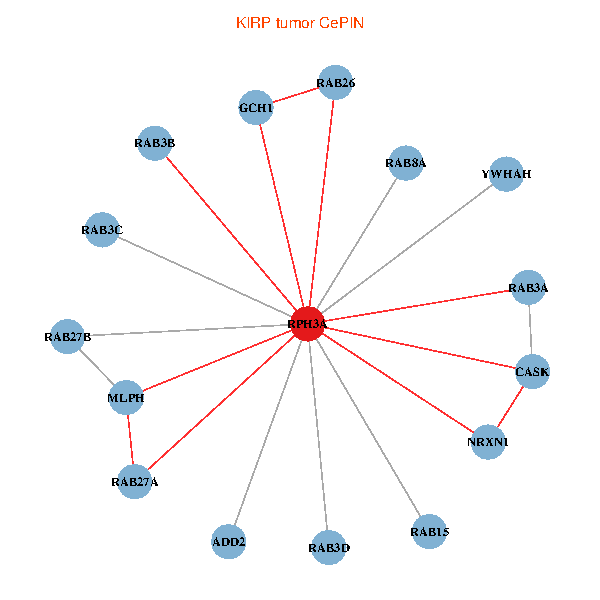
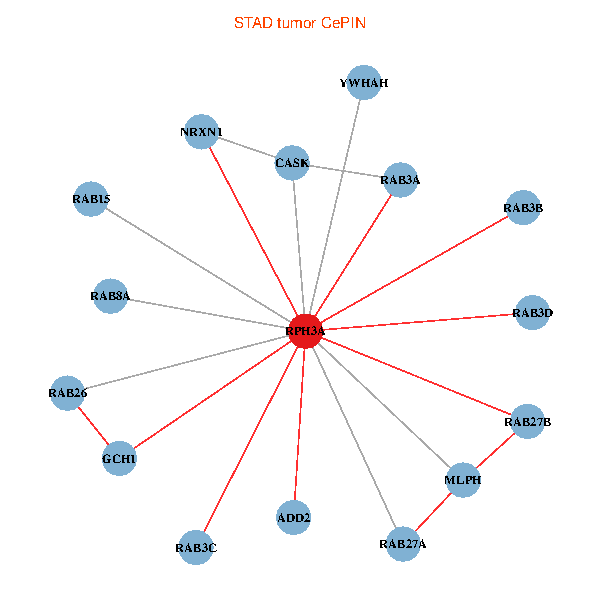
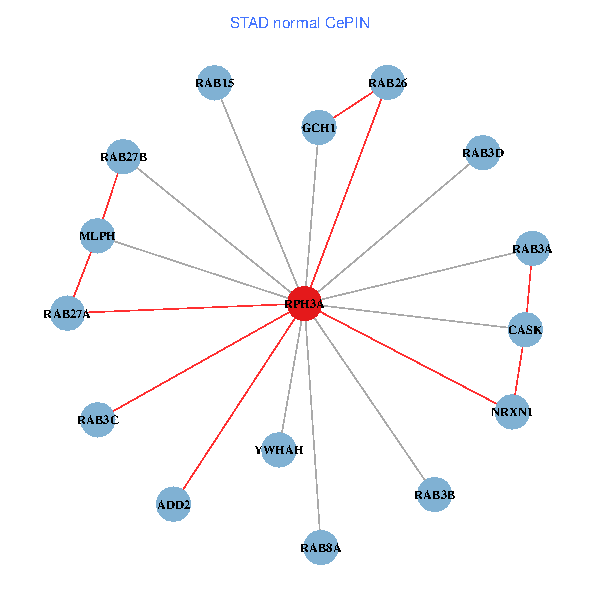
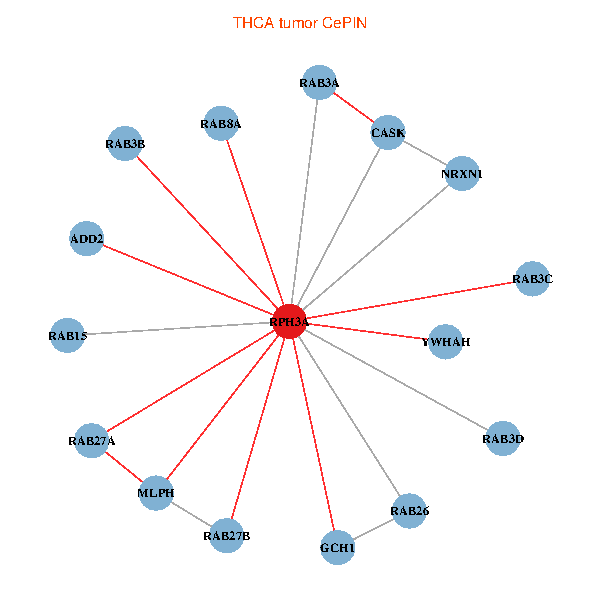
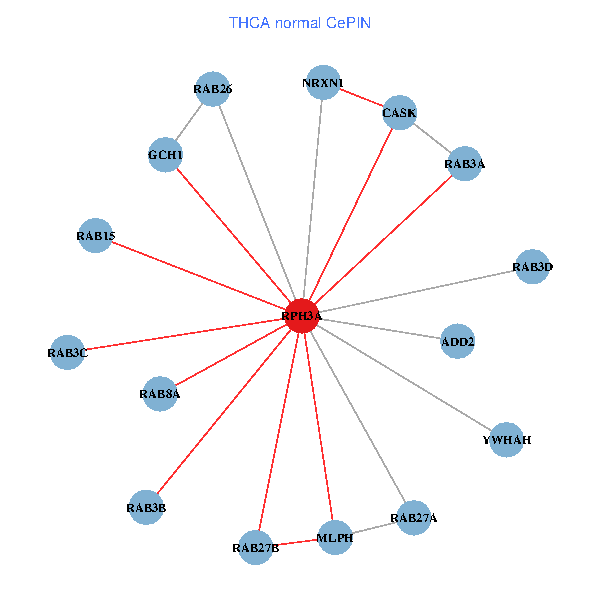
| Co-expressed gene networks based on protein-protein interaction data (CePIN) (TCGA IlluminaHiSeq_RNASeqV2, pan-cancer normalized log2(norm_counts+1) data, version 2016-08-16) (PINA2 ppi data) |
| BRCA (tumor) | BRCA (normal) |
| RPH3A, CASK, YWHAH, RAB27B, GCH1, RAB27A, ADD2, RAB3A, NRXN1, RAB8A, MLPH, RAB3B, RAB15, RAB3D, RAB3C, RAB26 (tumor) | RPH3A, CASK, YWHAH, RAB27B, GCH1, RAB27A, ADD2, RAB3A, NRXN1, RAB8A, MLPH, RAB3B, RAB15, RAB3D, RAB3C, RAB26 (normal) |
 |  |
| COAD (tumor) | COAD (normal) |
| RPH3A, CASK, YWHAH, RAB27B, GCH1, RAB27A, ADD2, RAB3A, NRXN1, RAB8A, MLPH, RAB3B, RAB15, RAB3D, RAB3C, RAB26 (tumor) | RPH3A, CASK, YWHAH, RAB27B, GCH1, RAB27A, ADD2, RAB3A, NRXN1, RAB8A, MLPH, RAB3B, RAB15, RAB3D, RAB3C, RAB26 (normal) |
 |  |
| HNSC (tumor) | HNSC (normal) |
| RPH3A, CASK, YWHAH, RAB27B, GCH1, RAB27A, ADD2, RAB3A, NRXN1, RAB8A, MLPH, RAB3B, RAB15, RAB3D, RAB3C, RAB26 (tumor) | RPH3A, CASK, YWHAH, RAB27B, GCH1, RAB27A, ADD2, RAB3A, NRXN1, RAB8A, MLPH, RAB3B, RAB15, RAB3D, RAB3C, RAB26 (normal) |
 |  |
| KICH (tumor) | KICH (normal) |
| RPH3A, CASK, YWHAH, RAB27B, GCH1, RAB27A, ADD2, RAB3A, NRXN1, RAB8A, MLPH, RAB3B, RAB15, RAB3D, RAB3C, RAB26 (tumor) | RPH3A, CASK, YWHAH, RAB27B, GCH1, RAB27A, ADD2, RAB3A, NRXN1, RAB8A, MLPH, RAB3B, RAB15, RAB3D, RAB3C, RAB26 (normal) |
 |  |
| KIRC (tumor) | KIRC (normal) |
| RPH3A, CASK, YWHAH, RAB27B, GCH1, RAB27A, ADD2, RAB3A, NRXN1, RAB8A, MLPH, RAB3B, RAB15, RAB3D, RAB3C, RAB26 (tumor) | RPH3A, CASK, YWHAH, RAB27B, GCH1, RAB27A, ADD2, RAB3A, NRXN1, RAB8A, MLPH, RAB3B, RAB15, RAB3D, RAB3C, RAB26 (normal) |
 |  |
| KIRP (tumor) | KIRP (normal) |
| RPH3A, CASK, YWHAH, RAB27B, GCH1, RAB27A, ADD2, RAB3A, NRXN1, RAB8A, MLPH, RAB3B, RAB15, RAB3D, RAB3C, RAB26 (tumor) | RPH3A, CASK, YWHAH, RAB27B, GCH1, RAB27A, ADD2, RAB3A, NRXN1, RAB8A, MLPH, RAB3B, RAB15, RAB3D, RAB3C, RAB26 (normal) |
 |  |
| LIHC (tumor) | LIHC (normal) |
| RPH3A, CASK, YWHAH, RAB27B, GCH1, RAB27A, ADD2, RAB3A, NRXN1, RAB8A, MLPH, RAB3B, RAB15, RAB3D, RAB3C, RAB26 (tumor) | RPH3A, CASK, YWHAH, RAB27B, GCH1, RAB27A, ADD2, RAB3A, NRXN1, RAB8A, MLPH, RAB3B, RAB15, RAB3D, RAB3C, RAB26 (normal) |
 |  |
| LUAD (tumor) | LUAD (normal) |
| RPH3A, CASK, YWHAH, RAB27B, GCH1, RAB27A, ADD2, RAB3A, NRXN1, RAB8A, MLPH, RAB3B, RAB15, RAB3D, RAB3C, RAB26 (tumor) | RPH3A, CASK, YWHAH, RAB27B, GCH1, RAB27A, ADD2, RAB3A, NRXN1, RAB8A, MLPH, RAB3B, RAB15, RAB3D, RAB3C, RAB26 (normal) |
 |  |
| LUSC (tumor) | LUSC (normal) |
| RPH3A, CASK, YWHAH, RAB27B, GCH1, RAB27A, ADD2, RAB3A, NRXN1, RAB8A, MLPH, RAB3B, RAB15, RAB3D, RAB3C, RAB26 (tumor) | RPH3A, CASK, YWHAH, RAB27B, GCH1, RAB27A, ADD2, RAB3A, NRXN1, RAB8A, MLPH, RAB3B, RAB15, RAB3D, RAB3C, RAB26 (normal) |
 |  |
| PRAD (tumor) | PRAD (normal) |
| RPH3A, CASK, YWHAH, RAB27B, GCH1, RAB27A, ADD2, RAB3A, NRXN1, RAB8A, MLPH, RAB3B, RAB15, RAB3D, RAB3C, RAB26 (tumor) | RPH3A, CASK, YWHAH, RAB27B, GCH1, RAB27A, ADD2, RAB3A, NRXN1, RAB8A, MLPH, RAB3B, RAB15, RAB3D, RAB3C, RAB26 (normal) |
 | 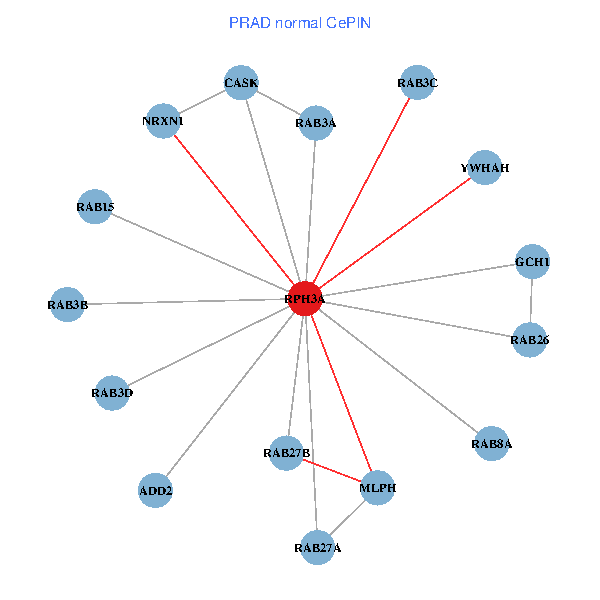 |
| STAD (tumor) | STAD (normal) |
| RPH3A, CASK, YWHAH, RAB27B, GCH1, RAB27A, ADD2, RAB3A, NRXN1, RAB8A, MLPH, RAB3B, RAB15, RAB3D, RAB3C, RAB26 (tumor) | RPH3A, CASK, YWHAH, RAB27B, GCH1, RAB27A, ADD2, RAB3A, NRXN1, RAB8A, MLPH, RAB3B, RAB15, RAB3D, RAB3C, RAB26 (normal) |
 |  |
| THCA (tumor) | THCA (normal) |
| RPH3A, CASK, YWHAH, RAB27B, GCH1, RAB27A, ADD2, RAB3A, NRXN1, RAB8A, MLPH, RAB3B, RAB15, RAB3D, RAB3C, RAB26 (tumor) | RPH3A, CASK, YWHAH, RAB27B, GCH1, RAB27A, ADD2, RAB3A, NRXN1, RAB8A, MLPH, RAB3B, RAB15, RAB3D, RAB3C, RAB26 (normal) |
 |  |
| Top |
| TissGeneProg for RPH3A |
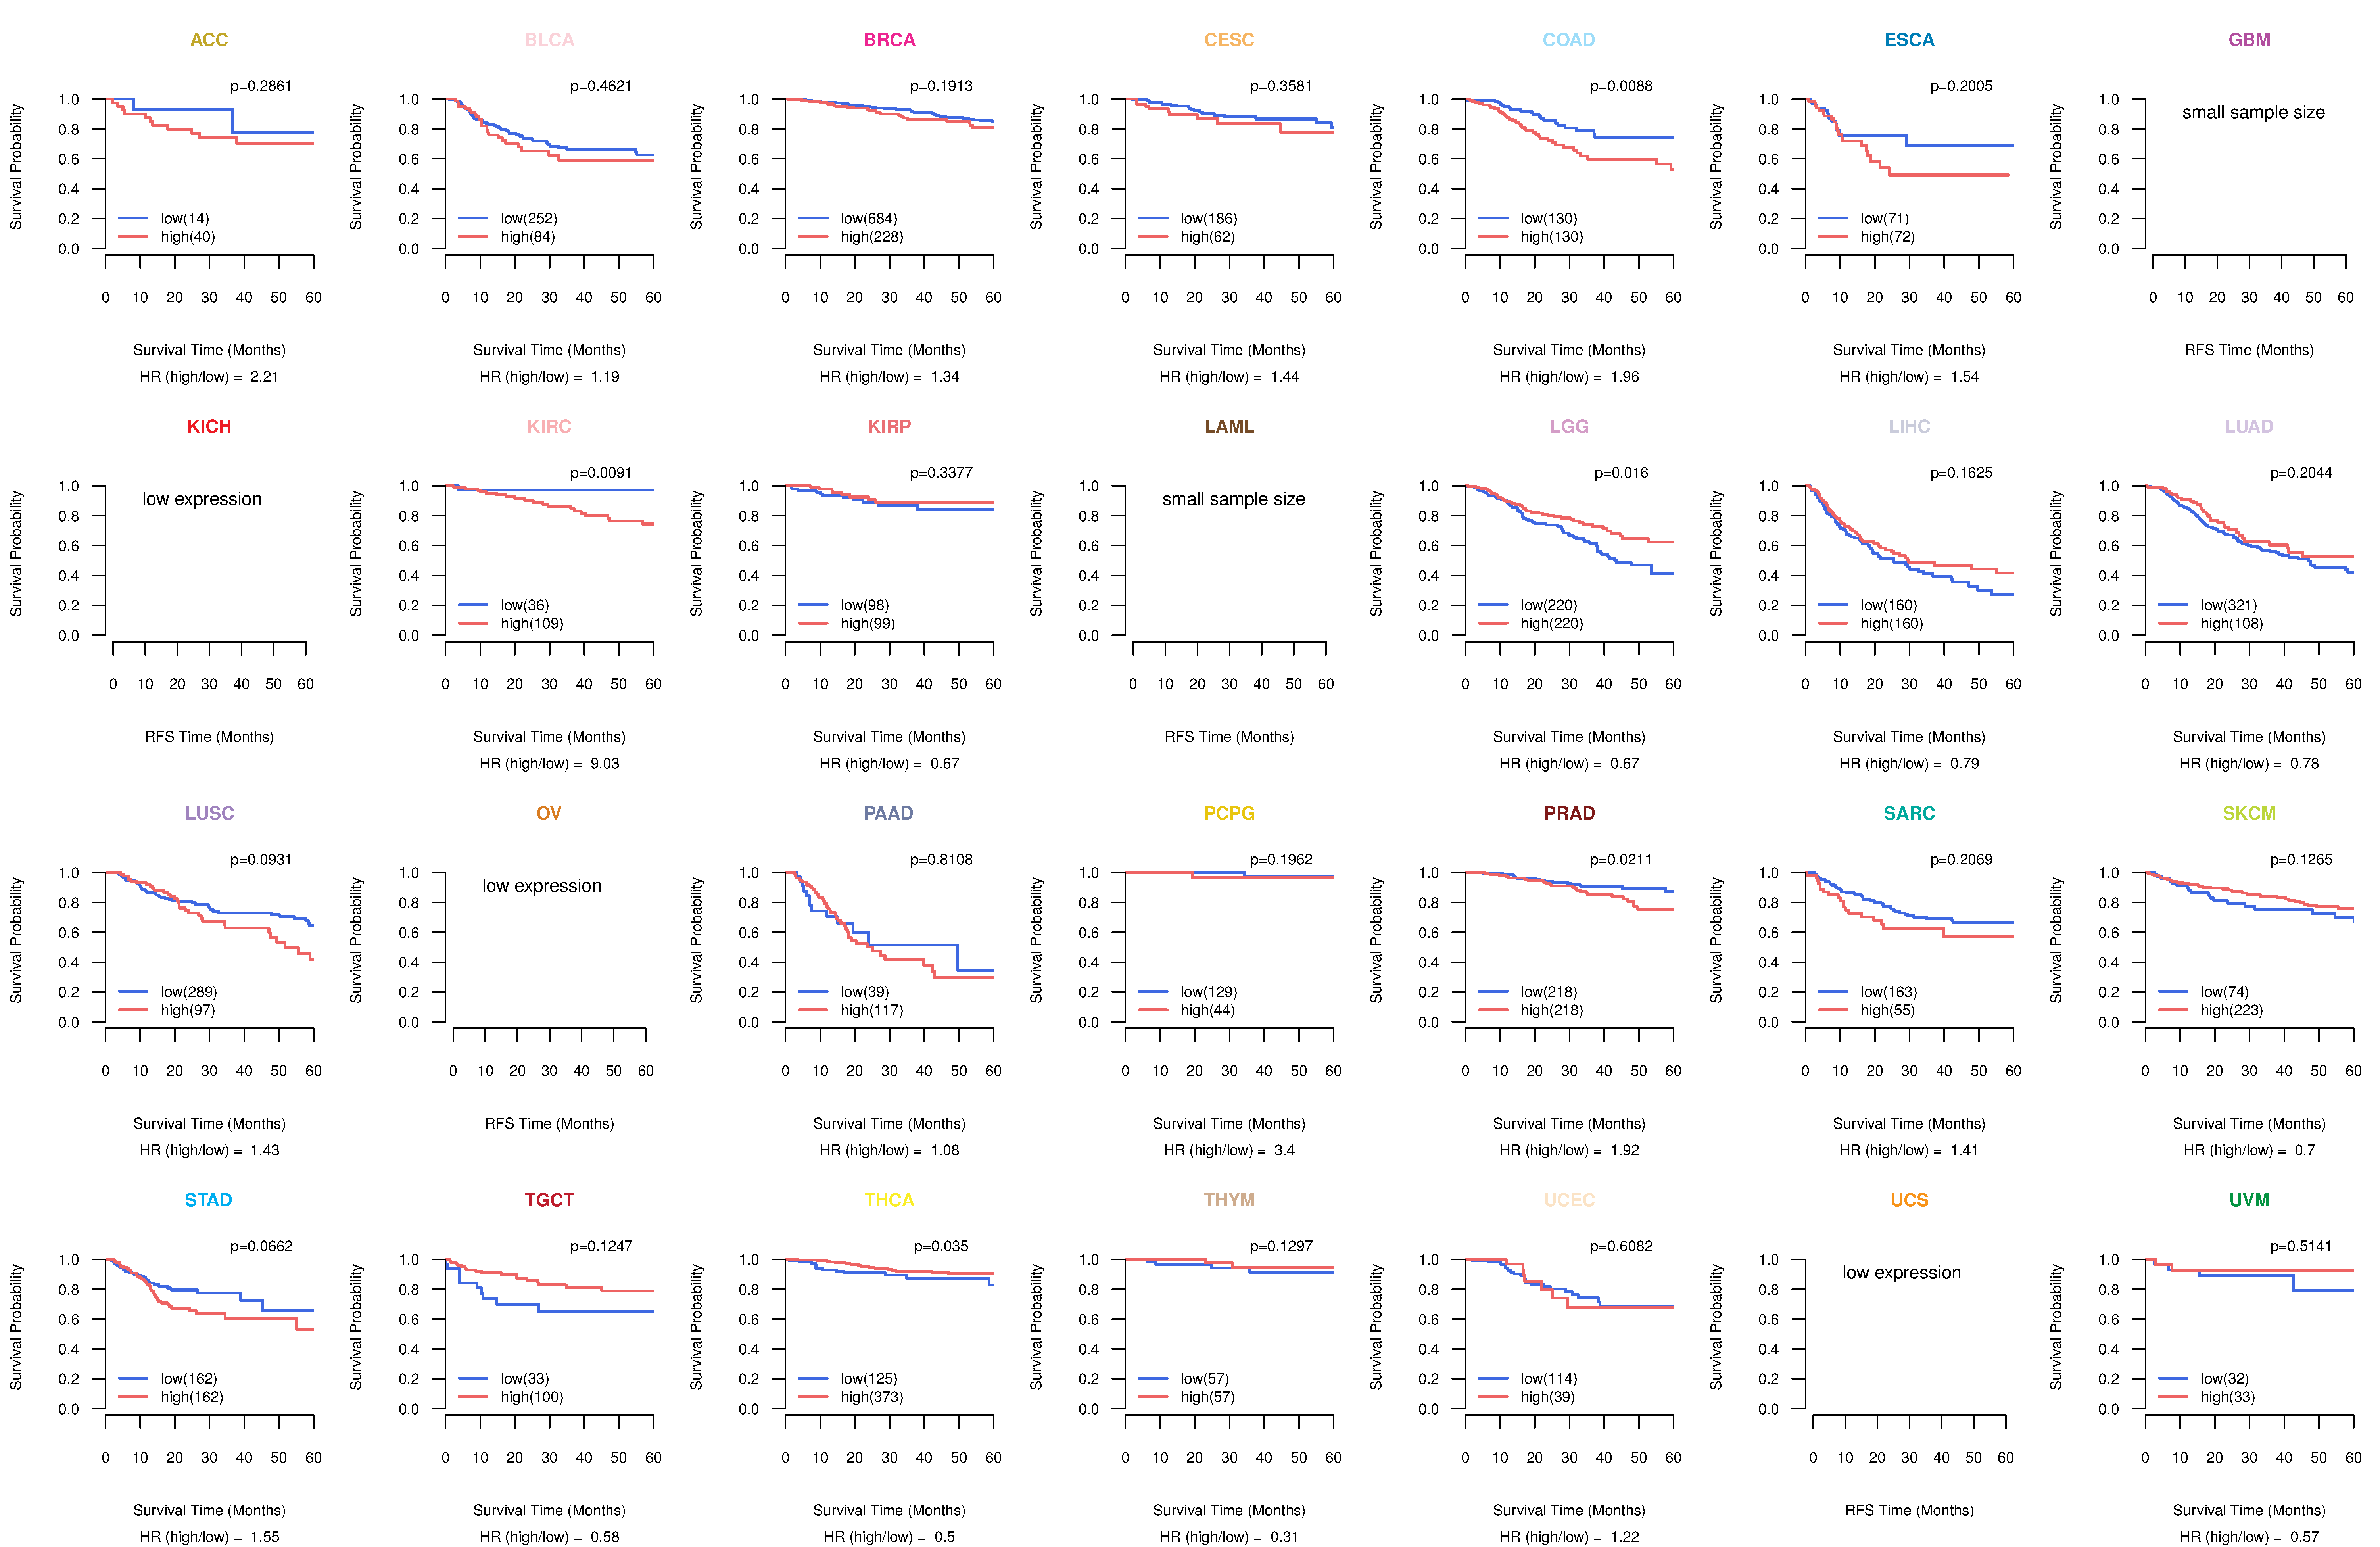
| Kaplan-Meier plots with logrank tests of overall survival (OS) using 28 cancer types (TCGA IlluminaHiSeq_RNASeqV2, pan-cancer normalized log2(norm_counts+1) data, version 2016-08-16) (TCGA clinicalMatrix, phenotype data, version 2016-04-27) * Click on the image to enlarge it in a new window. |
 |
| Kaplan-Meier plots with logrank test of relapse free survival (RFS) using 28 cancer types (TCGA IlluminaHiSeq_RNASeqV2, pan-cancer normalized log2(norm_counts+1) data, version 2016-08-16) (TCGA clinicalMatrix, phenotype data, version 2016-04-27) * Click on the image enlarge it in a new window. |
 |
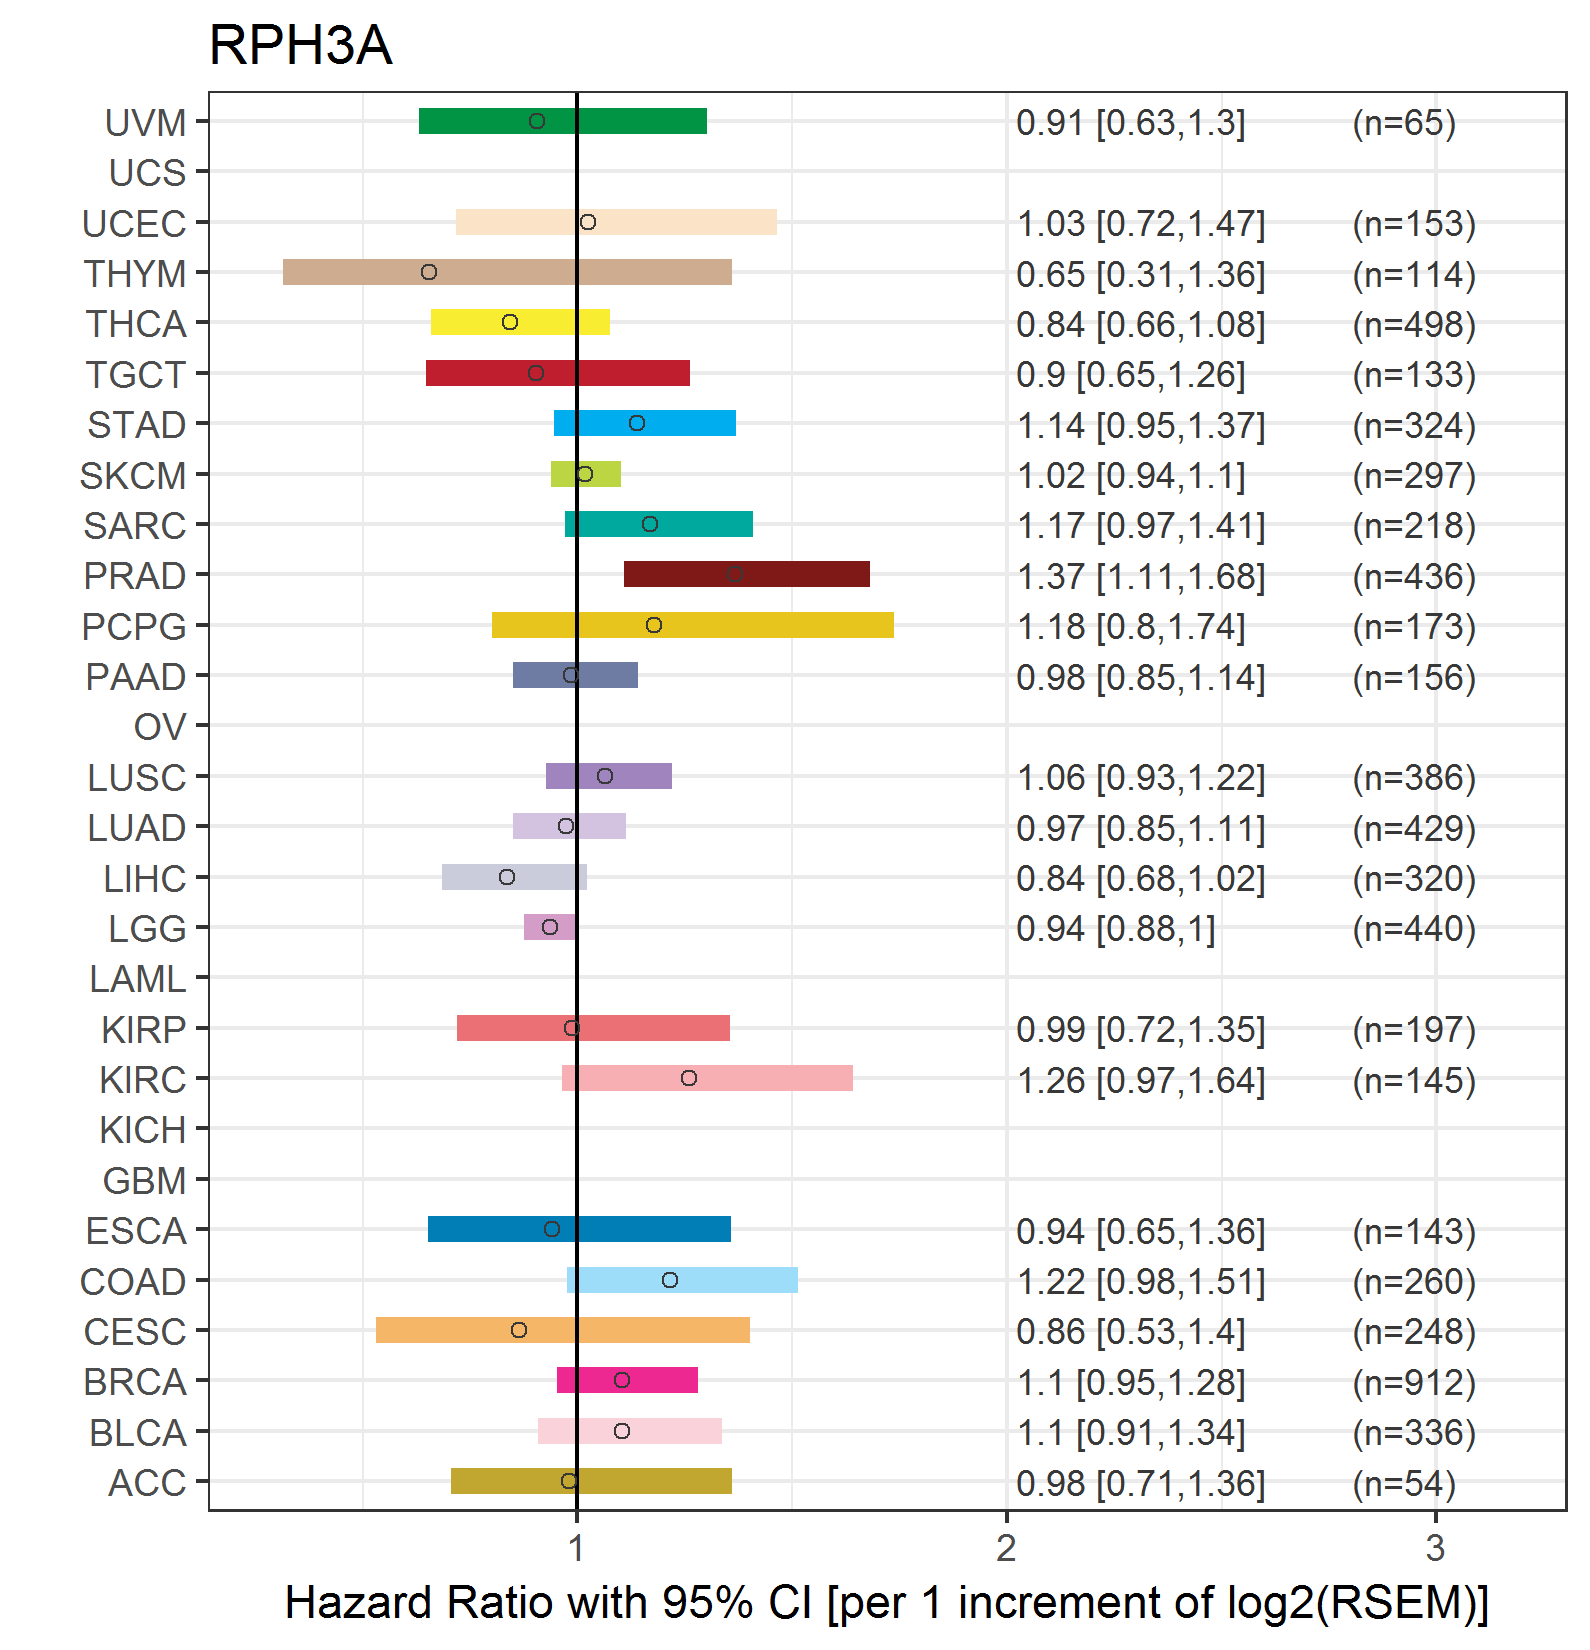
| Forest plot of Cox proportional hazard ratio (HR) and 95% CI of overall survival (OS) using 28 cancer types (TCGA IlluminaHiSeq_RNASeqV2, pan-cancer normalized log2(norm_counts+1) data, version 2016-08-16) (TCGA clinicalMatrix, phenotype data, version 2016-04-27) * Click on the image enlarge it in a new window. |
 |
| Forest plot of Cox proportional hazard ratio (HR) and 95% CI of relapse free survival (RFS) using 28 cancer types (TCGA IlluminaHiSeq_RNASeqV2, pan-cancer normalized log2(norm_counts+1) data, version 2016-08-16) (TCGA clinicalMatrix, phenotype data, version 2016-04-27) * Click on the image enlarge it in a new window. |
 |
| Top |
| TissGeneClin for RPH3A |
| TissGeneDrug for RPH3A |
| Drug information targeting TissGene (DrugBank Version 5.0.6, 2017-04-01) |
| DrugBank ID | Drug name | Drug activity | Drug type | Drug status |
| Top |
| TissGeneDisease for RPH3A |
| Disease information associated with TissGene (DisGeNet, 2016-06-01) |
| Disease ID | Disease name | # pubmeds | Source |
| umls:C0001418 | Adenocarcinoma | 1 | LHGDN |
| umls:C0001925 | Albuminuria | 1 | GAD |
| umls:C0009402 | Colorectal Carcinoma | 1 | BeFree |
| umls:C0020179 | Huntington Disease | 1 | LHGDN |
| umls:C0596263 | Carcinogenesis | 1 | BeFree |
| umls:C0752347 | Lewy Body Disease | 1 | LHGDN |
| umls:C1527249 | Colorectal Cancer | 1 | BeFree |
|
Copyright 2016-Present - The University of Texas Health Science Center at Houston (UTHealth) Web File Viewing | How to Report, Fraud, Waste and Abuse | State of Texas | Statewide Search | Texas Homeland Security | Site Policies |