 |
| |
| |
| |
| |
| |
| |
|

| TissGeneSummary for AKR7A3 |
 Gene summary Gene summary |
| Basic gene information | Gene symbol | AKR7A3 |
| Gene name | aldo-keto reductase family 7, member A3 (aflatoxin aldehyde reductase) | |
| Synonyms | AFAR2 | |
| Cytomap | UCSC genome browser: 1p36.13 | |
| Type of gene | protein-coding | |
| RefGenes | NM_012067.2, | |
| Description | AFB1 aldehyde reductase 2AFB1-AR 2aflatoxin B1 aldehyde reductase 2aflatoxin B1 aldehyde reductase member 3 | |
| Modification date | 20141207 | |
| dbXrefs | MIM : 608477 | |
| HGNC : HGNC | ||
| HPRD : 07089 | ||
| Protein | UniProt: go to UniProt's Cross Reference DB Table | |
| Expression | CleanEX: HS_AKR7A3 | |
| BioGPS: 22977 | ||
| Pathway | NCI Pathway Interaction Database: AKR7A3 | |
| KEGG: AKR7A3 | ||
| REACTOME: AKR7A3 | ||
| Pathway Commons: AKR7A3 | ||
| Context | iHOP: AKR7A3 | |
| ligand binding site mutation search in PubMed: AKR7A3 | ||
| UCL Cancer Institute: AKR7A3 | ||
| Assigned class in TissGDB* | C | |
| Included tissue-specific gene expression resources | TiGER,GTEx | |
| Specific-tissues in normal samples (assigned by TissGDB using HPA, TiGER, and GTEx) | ColonPancreasStomach | |
| Cancer types related to the specific-tissues in cancer samples (assigned by TissGDB using TCGA) | COADPAADSTAD | |
| Reference showing the relevant tissue of AKR7A3 | ||
| Description by TissGene annotations | Protective TissGene in RFS | |
| * Class A consists of genes with literature evidence and is part of the cTissGenes. Class B consists of only cTissGenes without additional evidence. The remaining genes belong to Class C. |
| Gene ontology having evidence of Inferred from Direct Assay (IDA) from Entrez |
| GO ID | GO term | PubMed ID |
| Top |
| TissGeneExp for AKR7A3 |
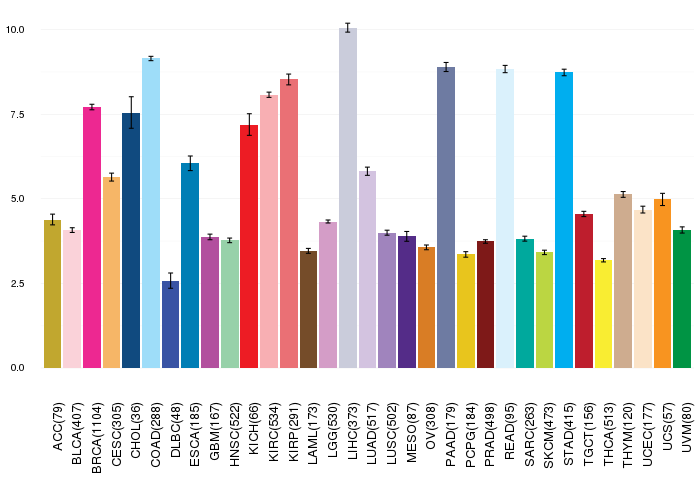
| Gene expressions across 28 cancer types (X-axis: cancer type and Y-axis: log2(norm_counts+1)) (TCGA IlluminaHiSeq_RNASeqV2, pan-cancer normalized log2(norm_counts+1) data, version 2016-08-16) |
 |
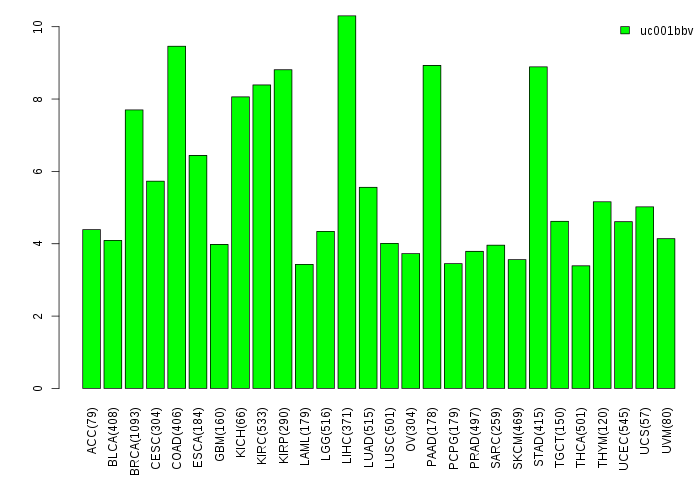
| Gene isoform expressions across 28 cancer types (X-axis: cancer type and Y-axis: log2(norm_counts+1)) (TCGA pan-cancer tcga_rsem_isoform_tpm, version 2016-09-01) |
 |
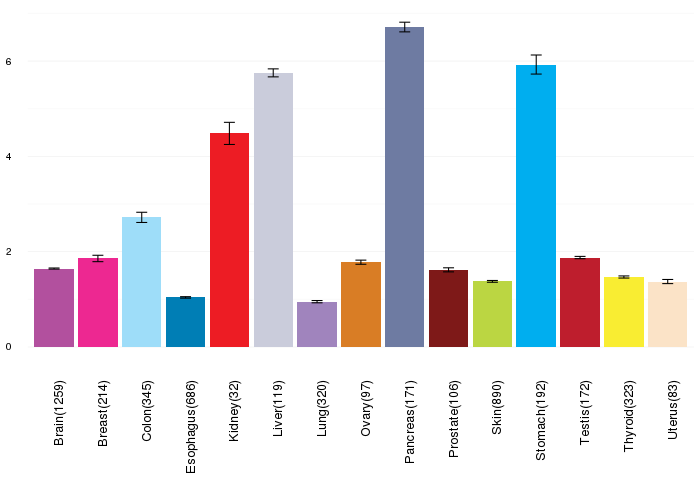
| Gene expressions across normal tissues of GTEx data (GTEx GTEx_Analysis_v6_RNA-seq_RNA-SeQCv1.1.8_gene_rpkm.gct) - Here, we shows the matched tissue types only among our 28 cancer types. |
 |
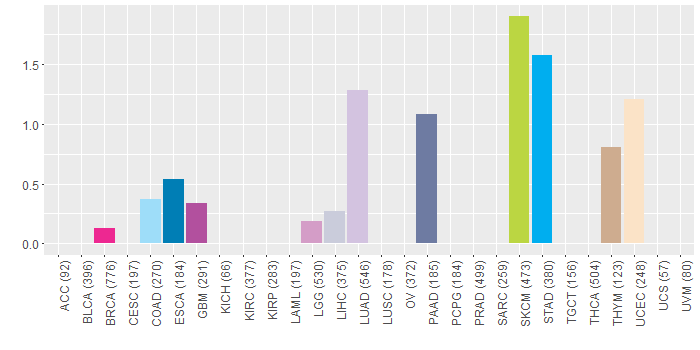
| Different expressions across 14 cancer types with more than 10 samples between matched tumors and normals (X-axis: cancer type and Y-axis: log2(norm_counts+1)) (TCGA IlluminaHiSeq_RNASeqV2, pan-cancer normalized log2(norm_counts+1) data, version 2016-08-16) |
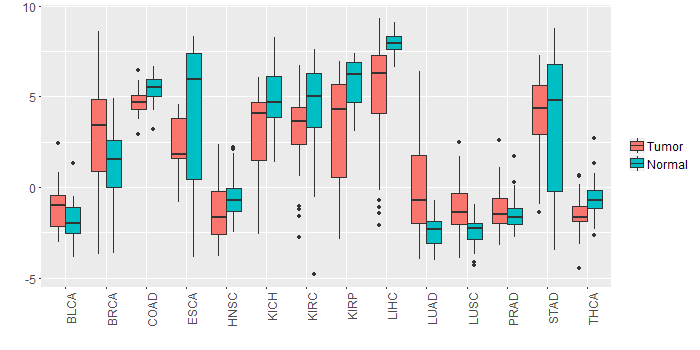 |
| - Significantly differentially expressed cancer types and information. (|Fold change|>1 and FDR<0.05) |
| Cancer type | Mean(exp) in tumor | Mean(exp) in matched normal | Log2FC | P-val. | FDR |
| LUSC | -1.185788072 | -2.428648856 | 1.242860784 | 3.52E-07 | 9.28E-07 |
| LIHC | 5.298897301 | 7.956585301 | -2.657688 | 6.78E-08 | 4.99E-07 |
| KIRC | 3.31648219 | 4.769137745 | -1.452655556 | 1.58E-05 | 3.64E-05 |
| BRCA | 2.810142424 | 1.22479681 | 1.585345614 | 9.88E-07 | 2.69E-06 |
| LUAD | 0.039638128 | -2.419001527 | 2.458639655 | 2.66E-09 | 1.31E-08 |
| KICH | 2.923527301 | 4.873015301 | -1.949488 | 0.00319 | 0.006277464 |
| KIRP | 3.149180801 | 5.770246426 | -2.621065625 | 7.52E-05 | 0.000265928 |
| Top |
| TissGene-miRNA for AKR7A3 |
| Significantly anti-correlated miRNAs of TissGene across 28 cancer types (Gene-miRNA relations from TargetScanHuman Relsease 7.1, Conserved_Site_Context_Scores.txt.zip, 06.01.2016) (TCGA IlluminaHiSeq_miRNASeq, log2(RPM+1) data, version 2016-11-21) (TCGA IlluminaHiSeq_RNASeqV2, log2(normalized_count+1) data, version 2016-08-16) (Spearman’s Rank Correlation (p-value<0.05 and coefficient<-0.25)) |
| Cancer type | miRNA id | miRNA accession | P-val. | Coeff. | # samples |
| Top |
| TissGeneMut for AKR7A3 |
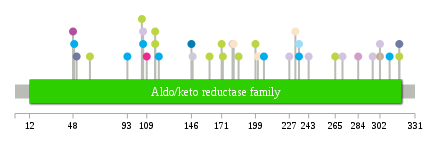
| TissGeneSNV for AKR7A3 |
| nsSNV counts per each loci. Different colors of circles represent different cancer types. Circle size denotes number of samples. (TCGA somatic mutation (SNPs and small INDELs) data, version 2016-04-25) * Click on the image to enlarge it in a new window. |
 |
 |
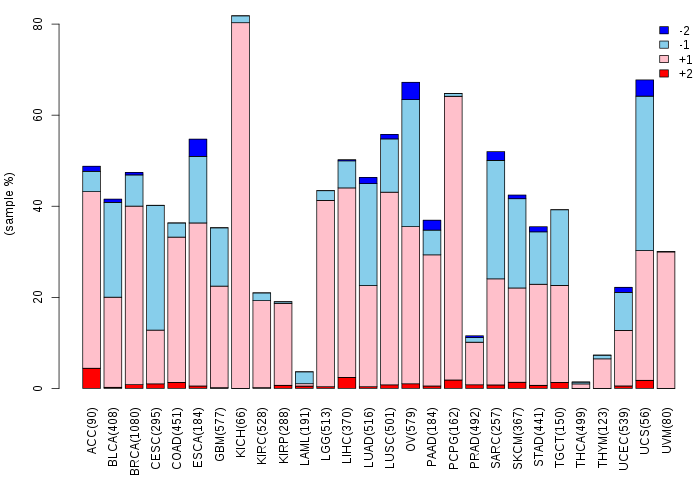
| Somatic nucleotide variants of TissGene across 28 cancer types (X-axis: cancer type and Y-axis: % of mutated samples) The numbers in parentheses are numbers of samples with mutation (nsSNVs). (TCGA somatic mutation (SNPs and small INDELs) data, version 2016-04-25) |
 |
| - nsSNVs sorted by frequency. |
| AAchange | Cancer type | # samples |
| p.P199S | SKCM | 1 |
| p.Y232H | UCEC | 1 |
| p.T181M | UCEC | 1 |
| p.P185S | SKCM | 1 |
| p.A201T | UCEC | 1 |
| p.Y49H | STAD | 1 |
| p.Y172N | SKCM | 1 |
| p.A318V | SKCM | 1 |
| p.S265L | SKCM | 1 |
| p.A284T | LGG | 1 |
| p.T206A | STAD | 1 |
| p.R106Q | HNSC | 1 |
| p.R106* | STAD | 1 |
| p.T227S | LUAD | 1 |
| p.A147S | LIHC | 1 |
| p.F93S | STAD | 1 |
| p.E296D | LUAD | 1 |
| p.V48L | GBM | 1 |
| p.E180K | LUAD | 1 |
| p.E243V | LUAD | 1 |
| p.M171I | SKCM | 1 |
| p.A318V | PAAD | 1 |
| p.M271I | LUAD | 1 |
| p.R235C | STAD | 1 |
| p.R106Q | LUAD | 1 |
| p.T119A | STAD | 1 |
| p.A146V | ESCA | 1 |
| p.L109V | BRCA | 1 |
| p.P105L | SKCM | 1 |
| p.G62E | SKCM | 1 |
| p.E51D | PAAD | 1 |
| p.G161D | SKCM | 1 |
| p.R235H | COAD | 1 |
| p.D116G | SKCM | 1 |
| p.D116N | SKCM | 1 |
| p.A302P | LUAD | 1 |
| p.A302V | THYM | 1 |
| p.A310V | STAD | 1 |
| Top |
| TissGeneCNV for AKR7A3 |
| Copy number variations of TissGene across 28 cancer types (X-axis: cancer type and Y-axis: % of CNV samples) (TCGA Gistic2_CopyNumber_Gistic2_all_data_by_genes, Gistic2 copy number data, version 2016-08-16) |
 |
| Top |
| TissGeneFusions for AKR7A3 |
| Fusion genes including TissGene (ChimerDB 3.0, 2016-12-01 and TCGA fusion Portal 2015-12-01) |
| Database | Src | Cancer type | Sample | Fusion gene | ORF | 5'-gene BP | 3'-gene BP |
| Chimerdb3.0 | FusionScan | BRCA | TCGA-D8-A1JM-01A | AKR7A3-CAPZB | In-Frame | chr1:19610489 | chr1:19746244 |
| Chimerdb3.0 | FusionScan | BRCA | TCGA-B6-A3ZX-01A | PADI4-AKR7A3 | Out-of-Frame | chr1:17657644 | chr1:19612866 |
| Top |
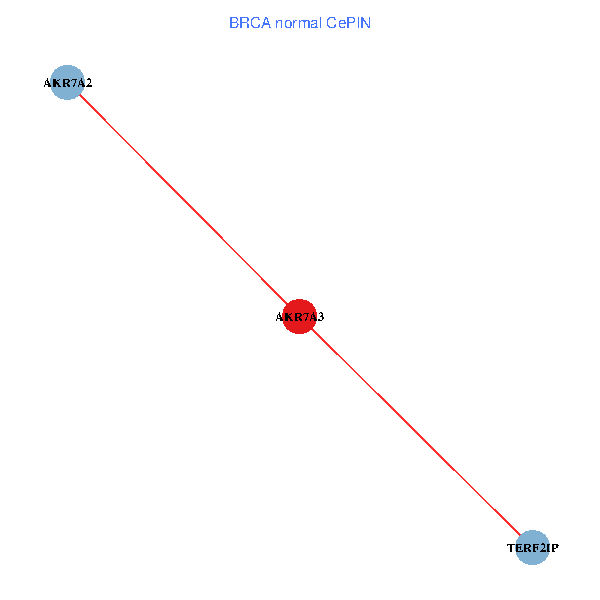
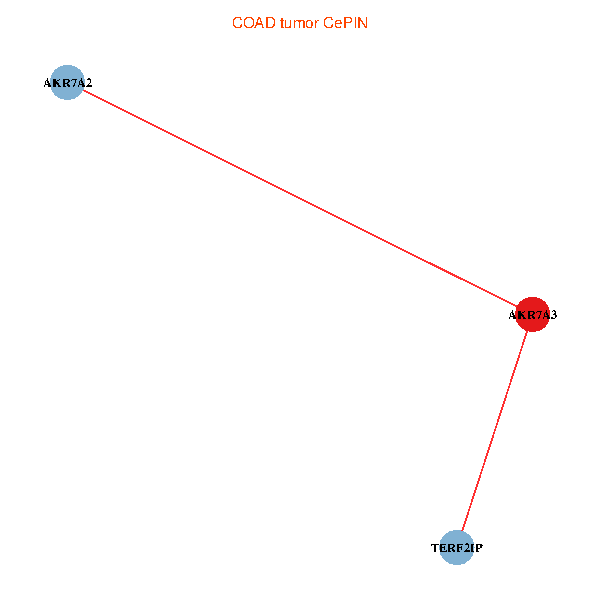
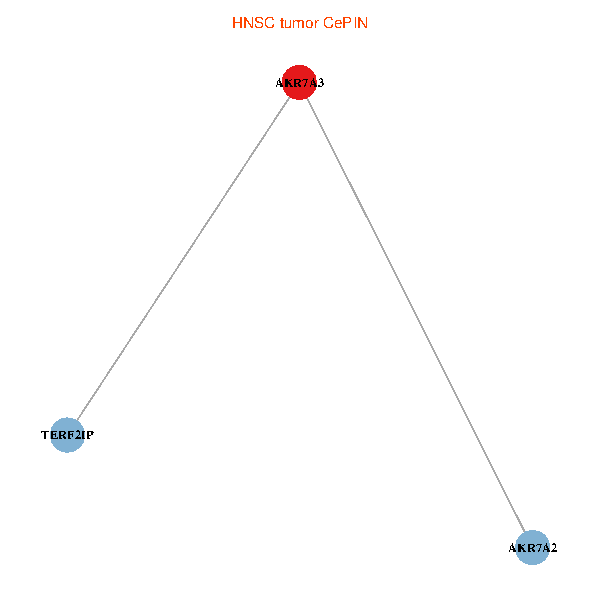
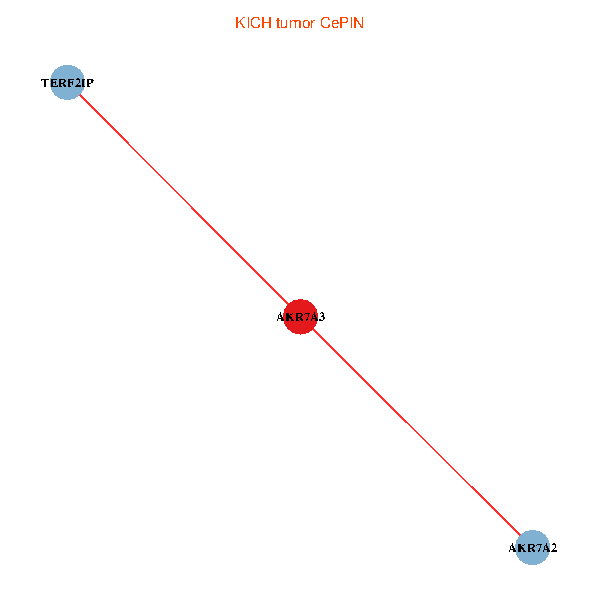
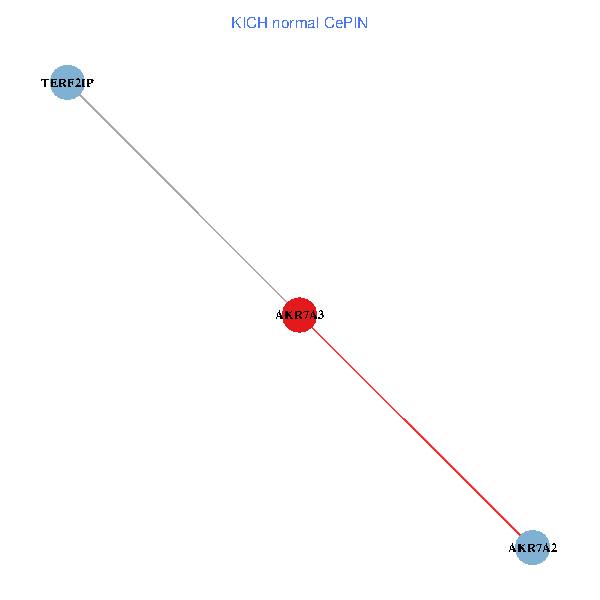
| TissGeneNet for AKR7A3 |
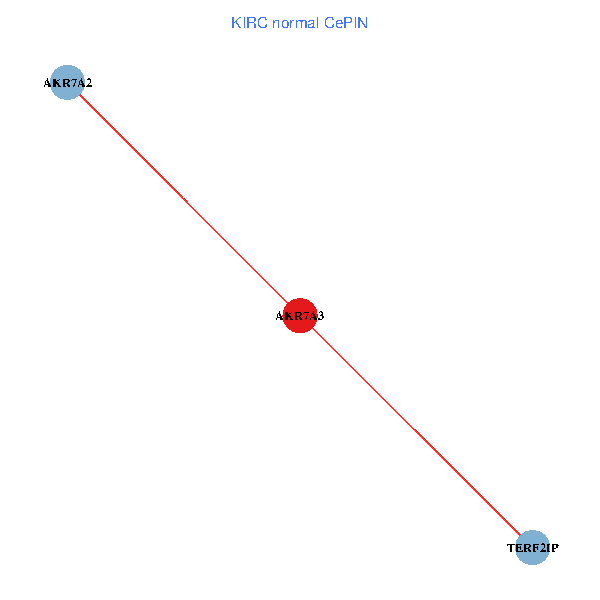
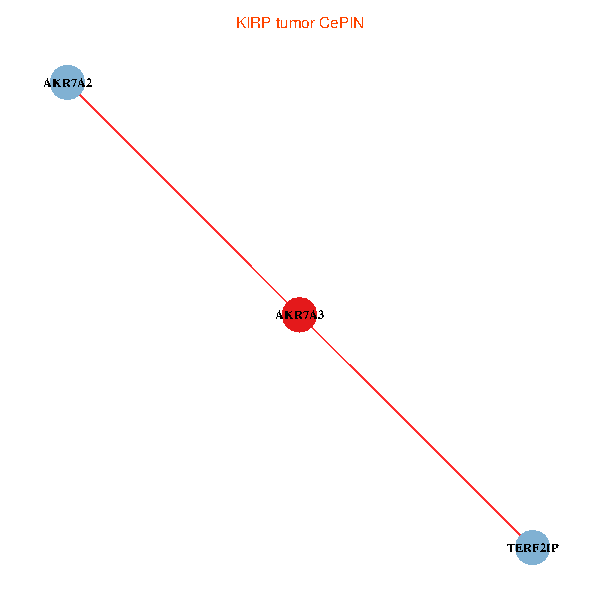
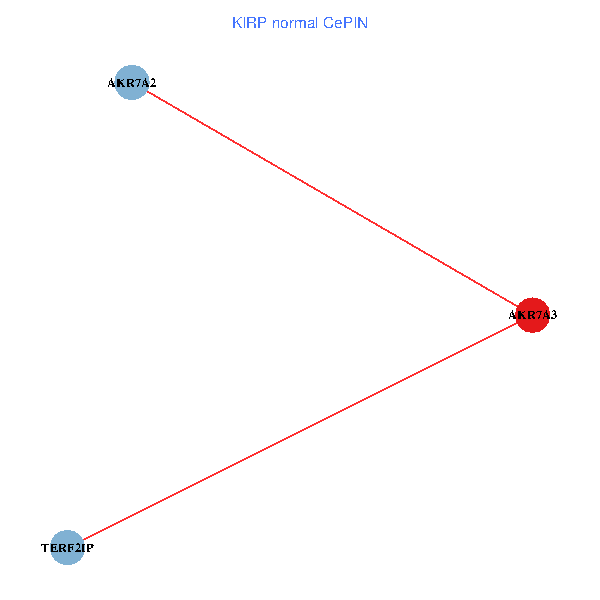
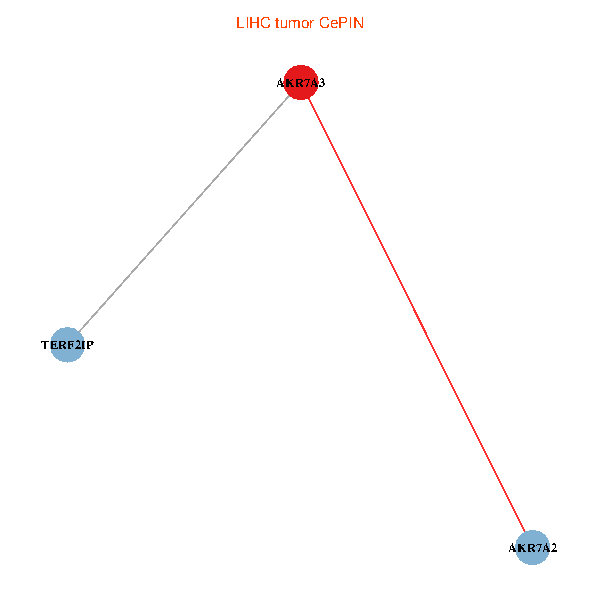
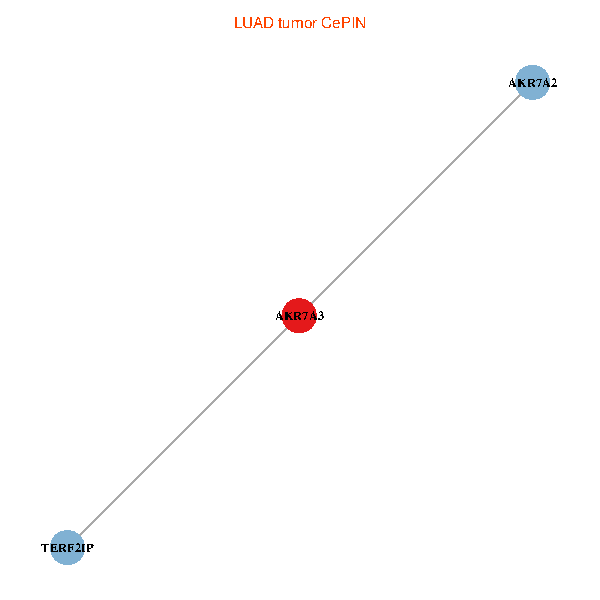
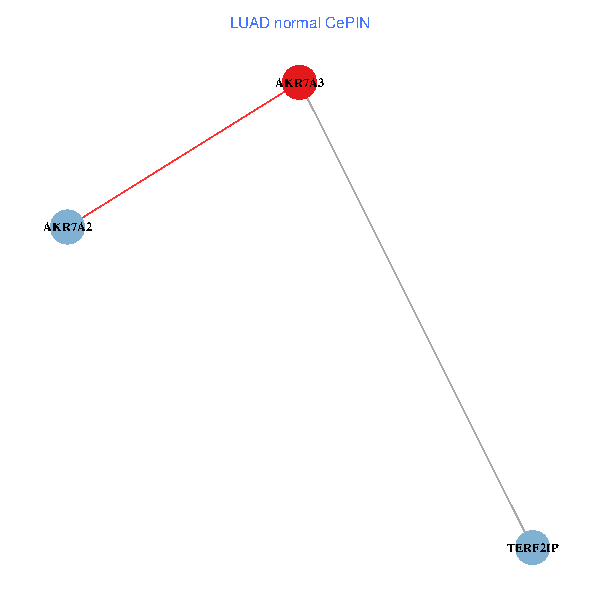
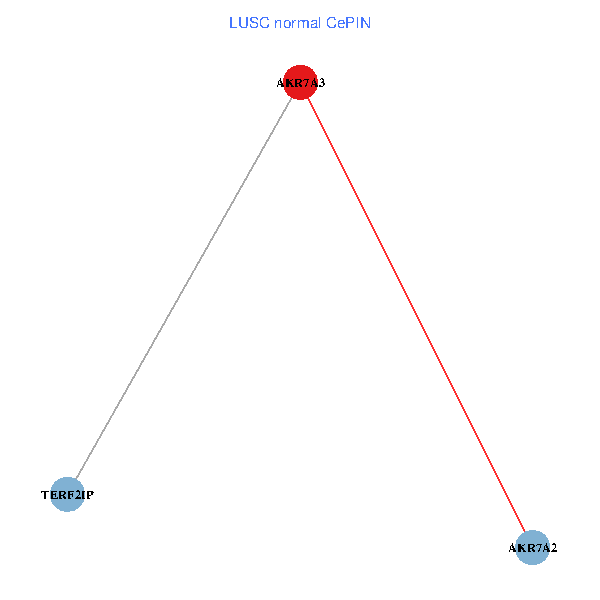
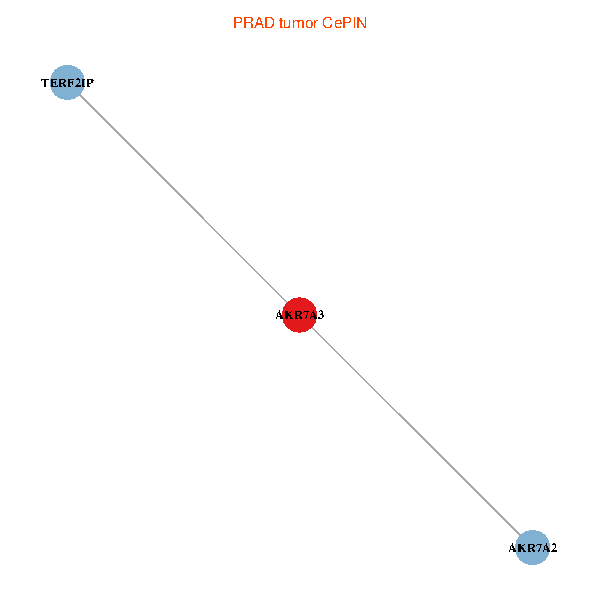
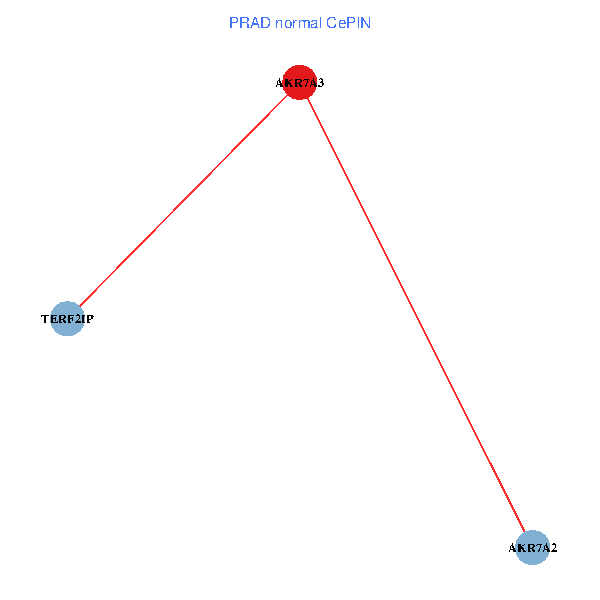
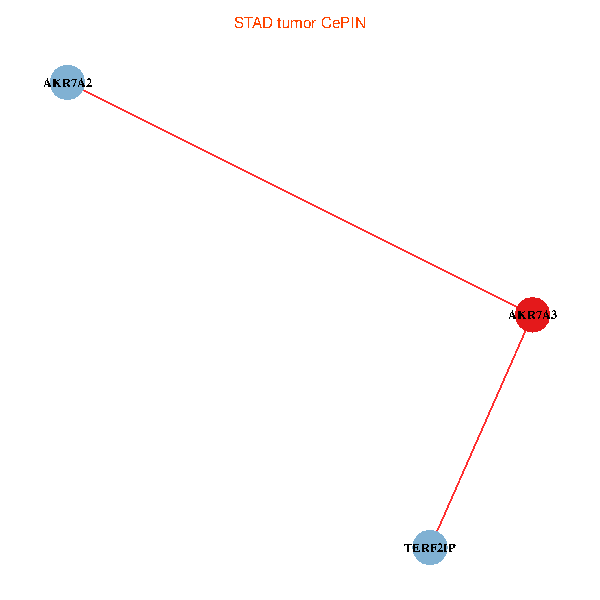
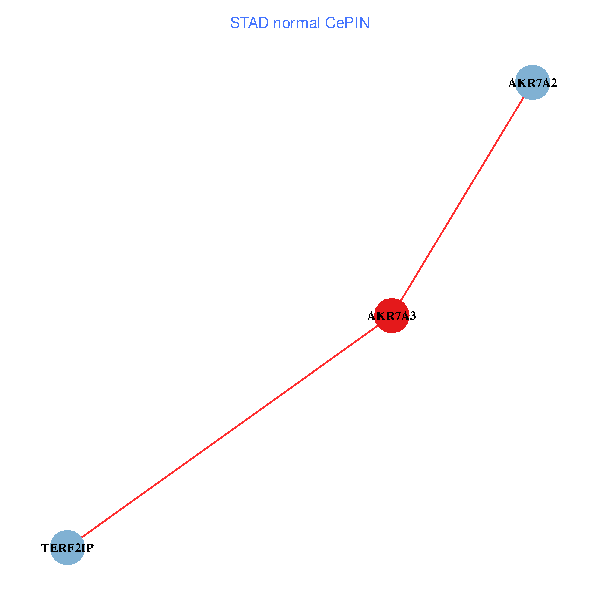
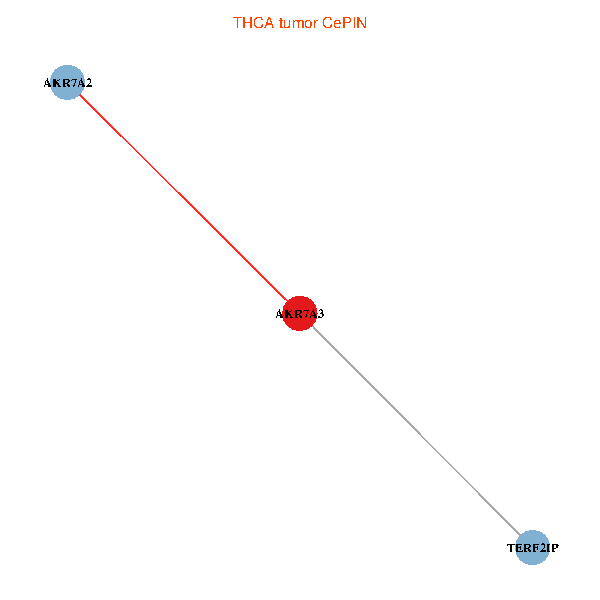
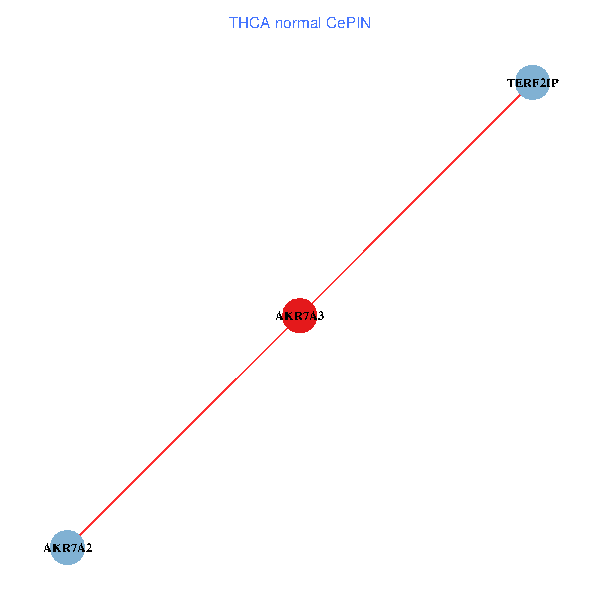
| Co-expressed gene networks based on protein-protein interaction data (CePIN) (TCGA IlluminaHiSeq_RNASeqV2, pan-cancer normalized log2(norm_counts+1) data, version 2016-08-16) (PINA2 ppi data) |
| BRCA (tumor) | BRCA (normal) |
| AKR7A3, TERF2IP, AKR7A2 (tumor) | AKR7A3, TERF2IP, AKR7A2 (normal) |
 |  |
| COAD (tumor) | COAD (normal) |
| AKR7A3, TERF2IP, AKR7A2 (tumor) | AKR7A3, TERF2IP, AKR7A2 (normal) |
 |  |
| HNSC (tumor) | HNSC (normal) |
| AKR7A3, TERF2IP, AKR7A2 (tumor) | AKR7A3, TERF2IP, AKR7A2 (normal) |
 |  |
| KICH (tumor) | KICH (normal) |
| AKR7A3, TERF2IP, AKR7A2 (tumor) | AKR7A3, TERF2IP, AKR7A2 (normal) |
 |  |
| KIRC (tumor) | KIRC (normal) |
| AKR7A3, TERF2IP, AKR7A2 (tumor) | AKR7A3, TERF2IP, AKR7A2 (normal) |
 |  |
| KIRP (tumor) | KIRP (normal) |
| AKR7A3, TERF2IP, AKR7A2 (tumor) | AKR7A3, TERF2IP, AKR7A2 (normal) |
 |  |
| LIHC (tumor) | LIHC (normal) |
| AKR7A3, TERF2IP, AKR7A2 (tumor) | AKR7A3, TERF2IP, AKR7A2 (normal) |
 |  |
| LUAD (tumor) | LUAD (normal) |
| AKR7A3, TERF2IP, AKR7A2 (tumor) | AKR7A3, TERF2IP, AKR7A2 (normal) |
 |  |
| LUSC (tumor) | LUSC (normal) |
| AKR7A3, TERF2IP, AKR7A2 (tumor) | AKR7A3, TERF2IP, AKR7A2 (normal) |
 |  |
| PRAD (tumor) | PRAD (normal) |
| AKR7A3, TERF2IP, AKR7A2 (tumor) | AKR7A3, TERF2IP, AKR7A2 (normal) |
 |  |
| STAD (tumor) | STAD (normal) |
| AKR7A3, TERF2IP, AKR7A2 (tumor) | AKR7A3, TERF2IP, AKR7A2 (normal) |
 |  |
| THCA (tumor) | THCA (normal) |
| AKR7A3, TERF2IP, AKR7A2 (tumor) | AKR7A3, TERF2IP, AKR7A2 (normal) |
 |  |
| Top |
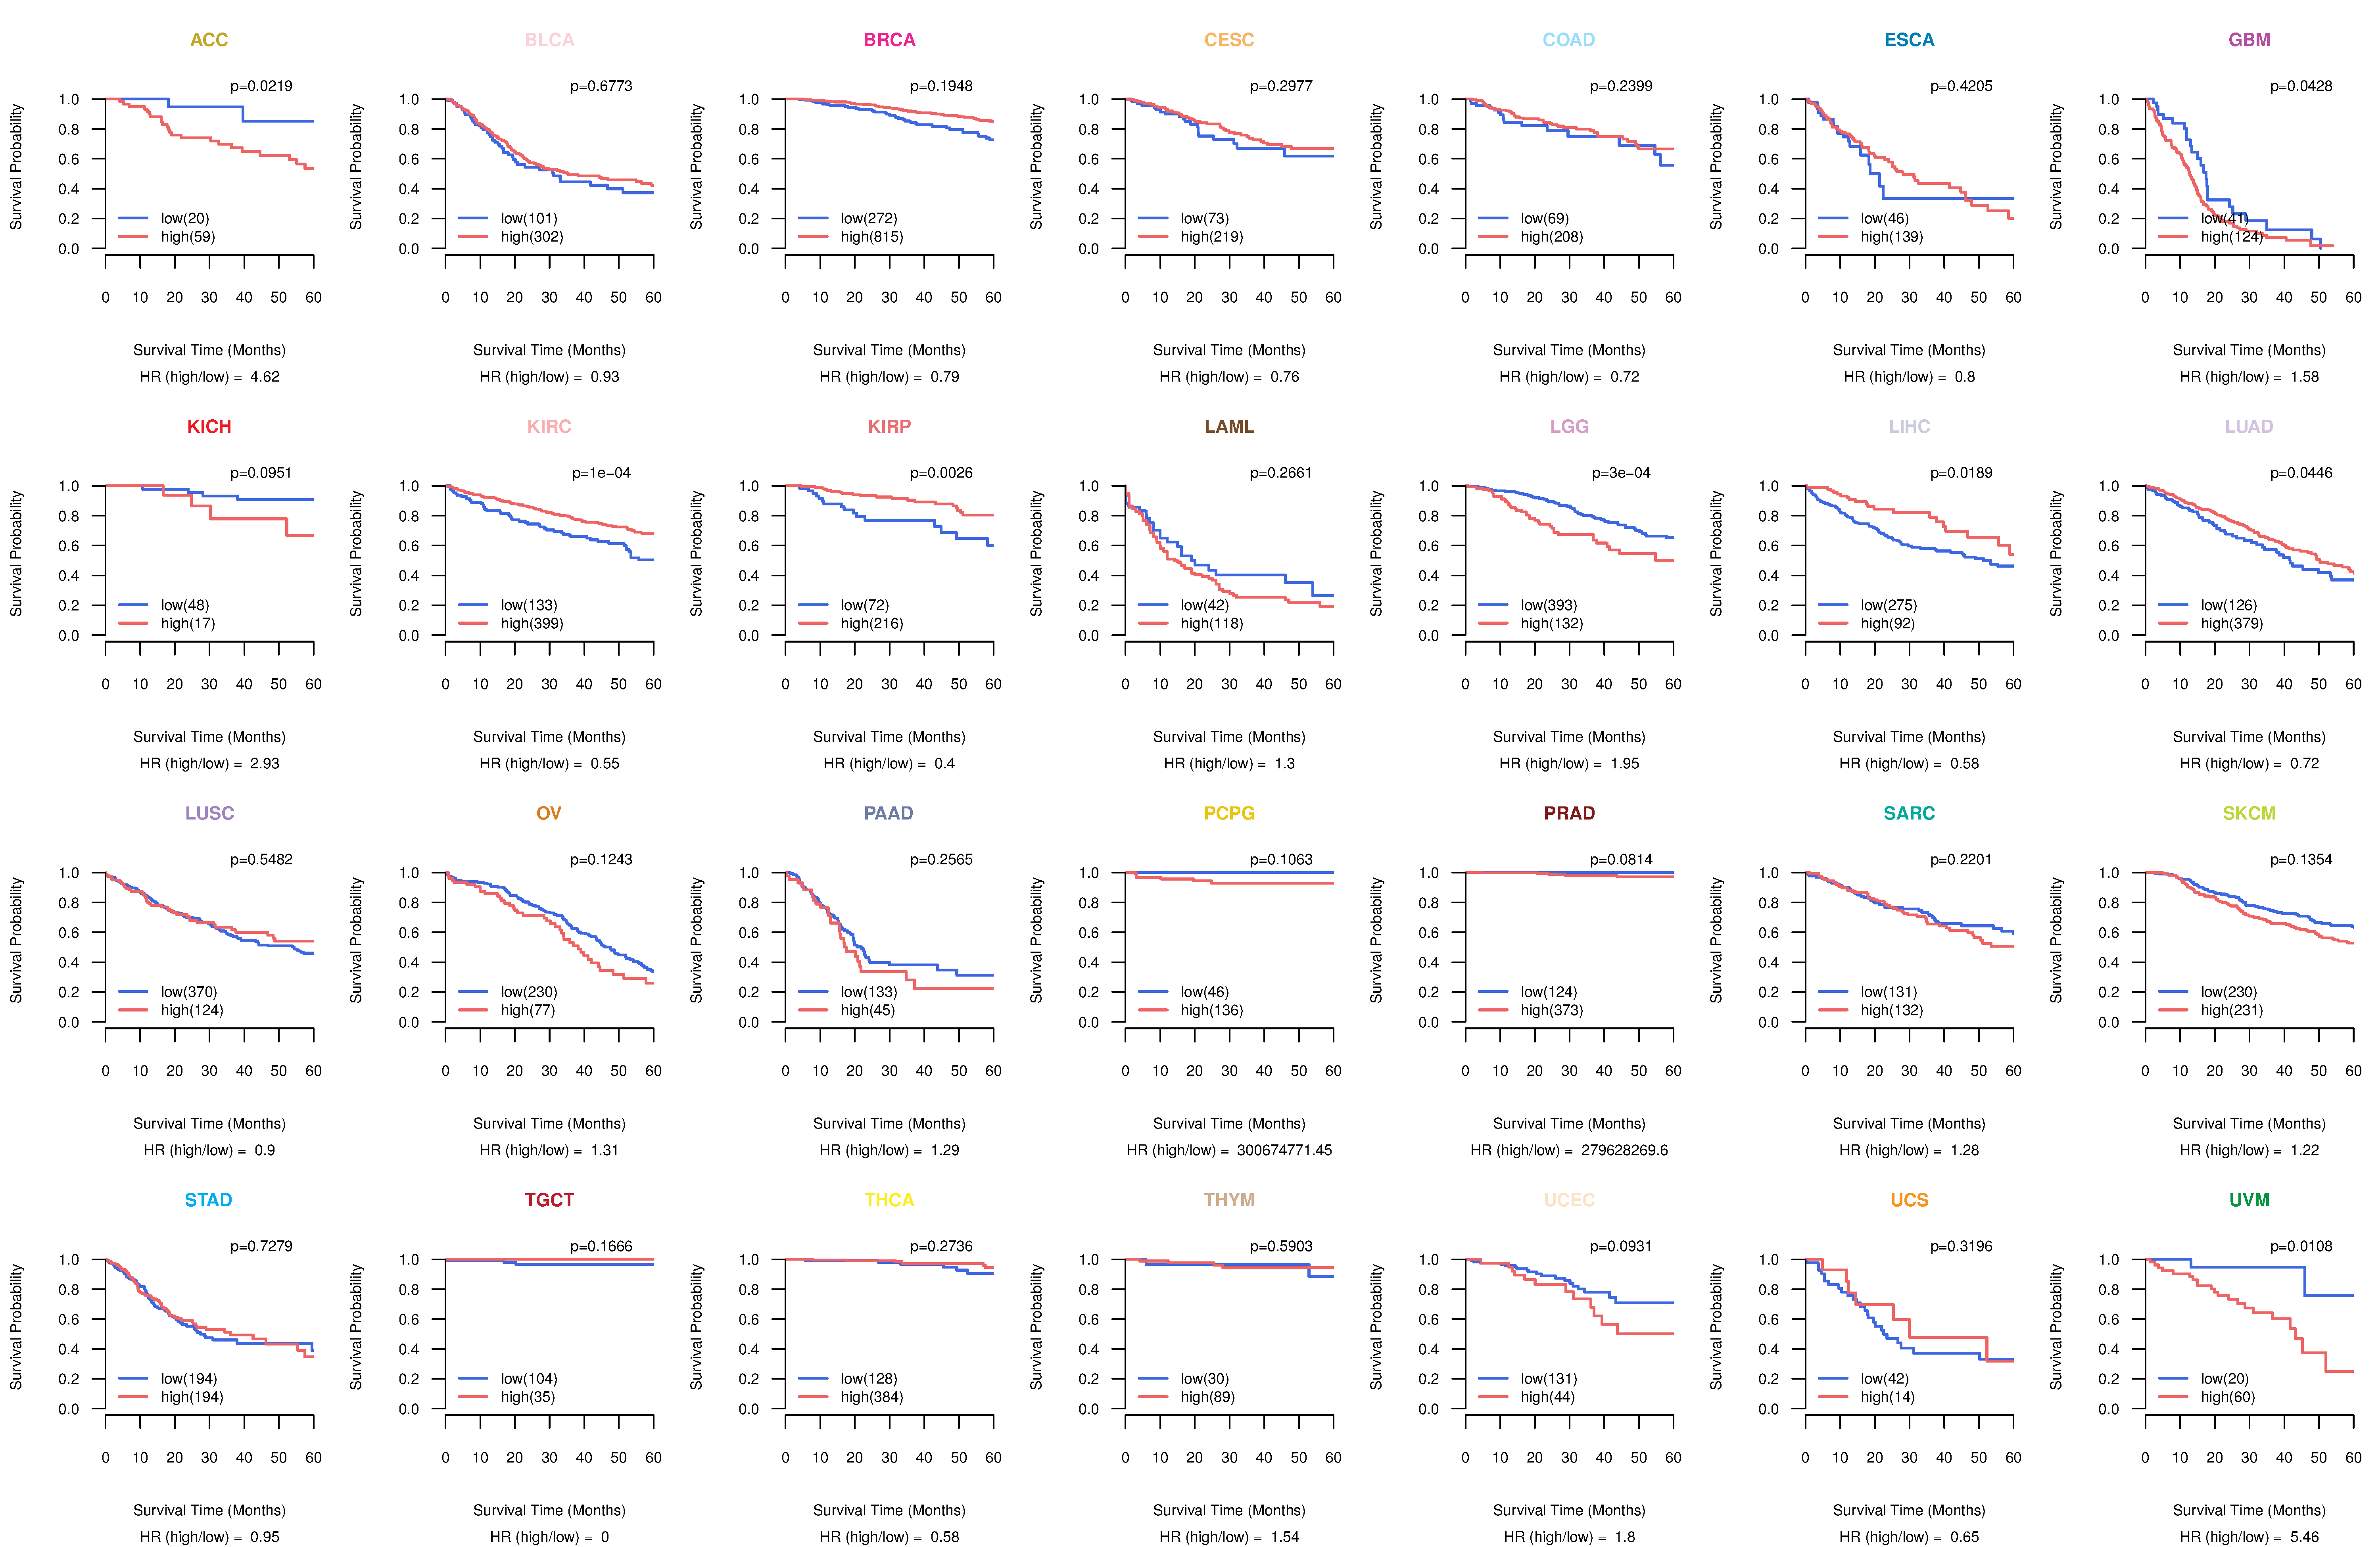
| TissGeneProg for AKR7A3 |
| Kaplan-Meier plots with logrank tests of overall survival (OS) using 28 cancer types (TCGA IlluminaHiSeq_RNASeqV2, pan-cancer normalized log2(norm_counts+1) data, version 2016-08-16) (TCGA clinicalMatrix, phenotype data, version 2016-04-27) * Click on the image to enlarge it in a new window. |
 |
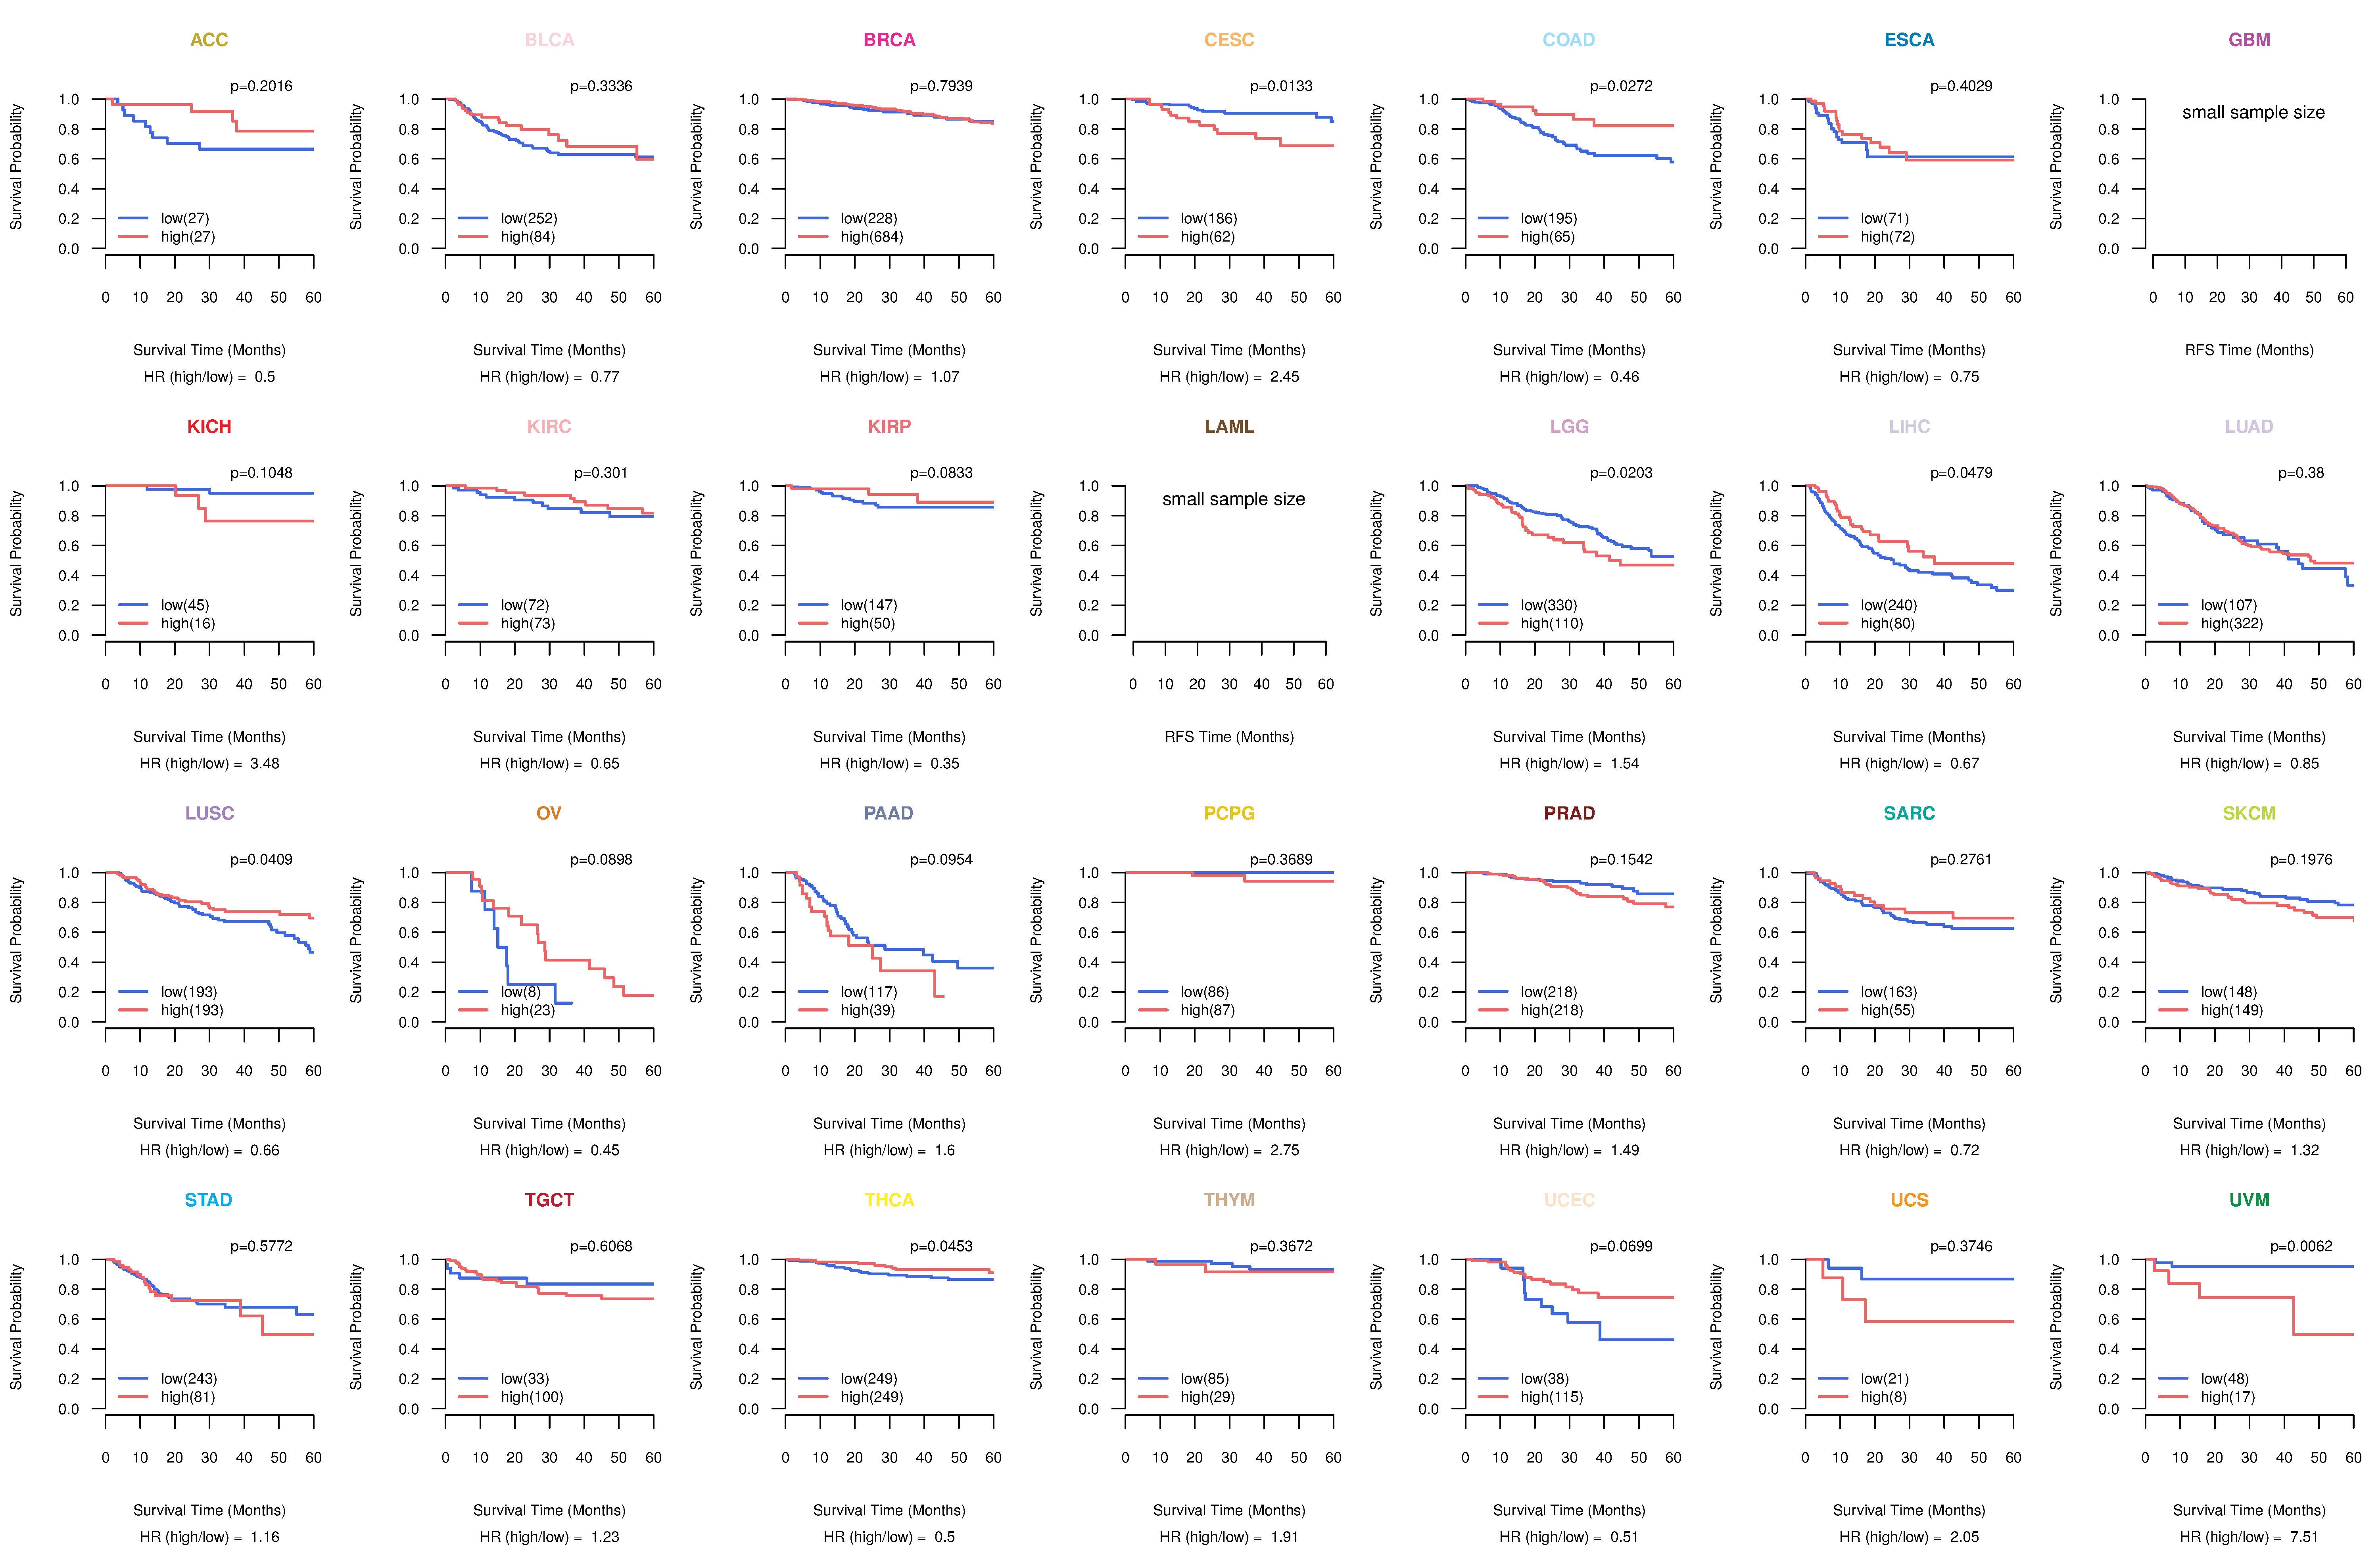
| Kaplan-Meier plots with logrank test of relapse free survival (RFS) using 28 cancer types (TCGA IlluminaHiSeq_RNASeqV2, pan-cancer normalized log2(norm_counts+1) data, version 2016-08-16) (TCGA clinicalMatrix, phenotype data, version 2016-04-27) * Click on the image enlarge it in a new window. |
 |
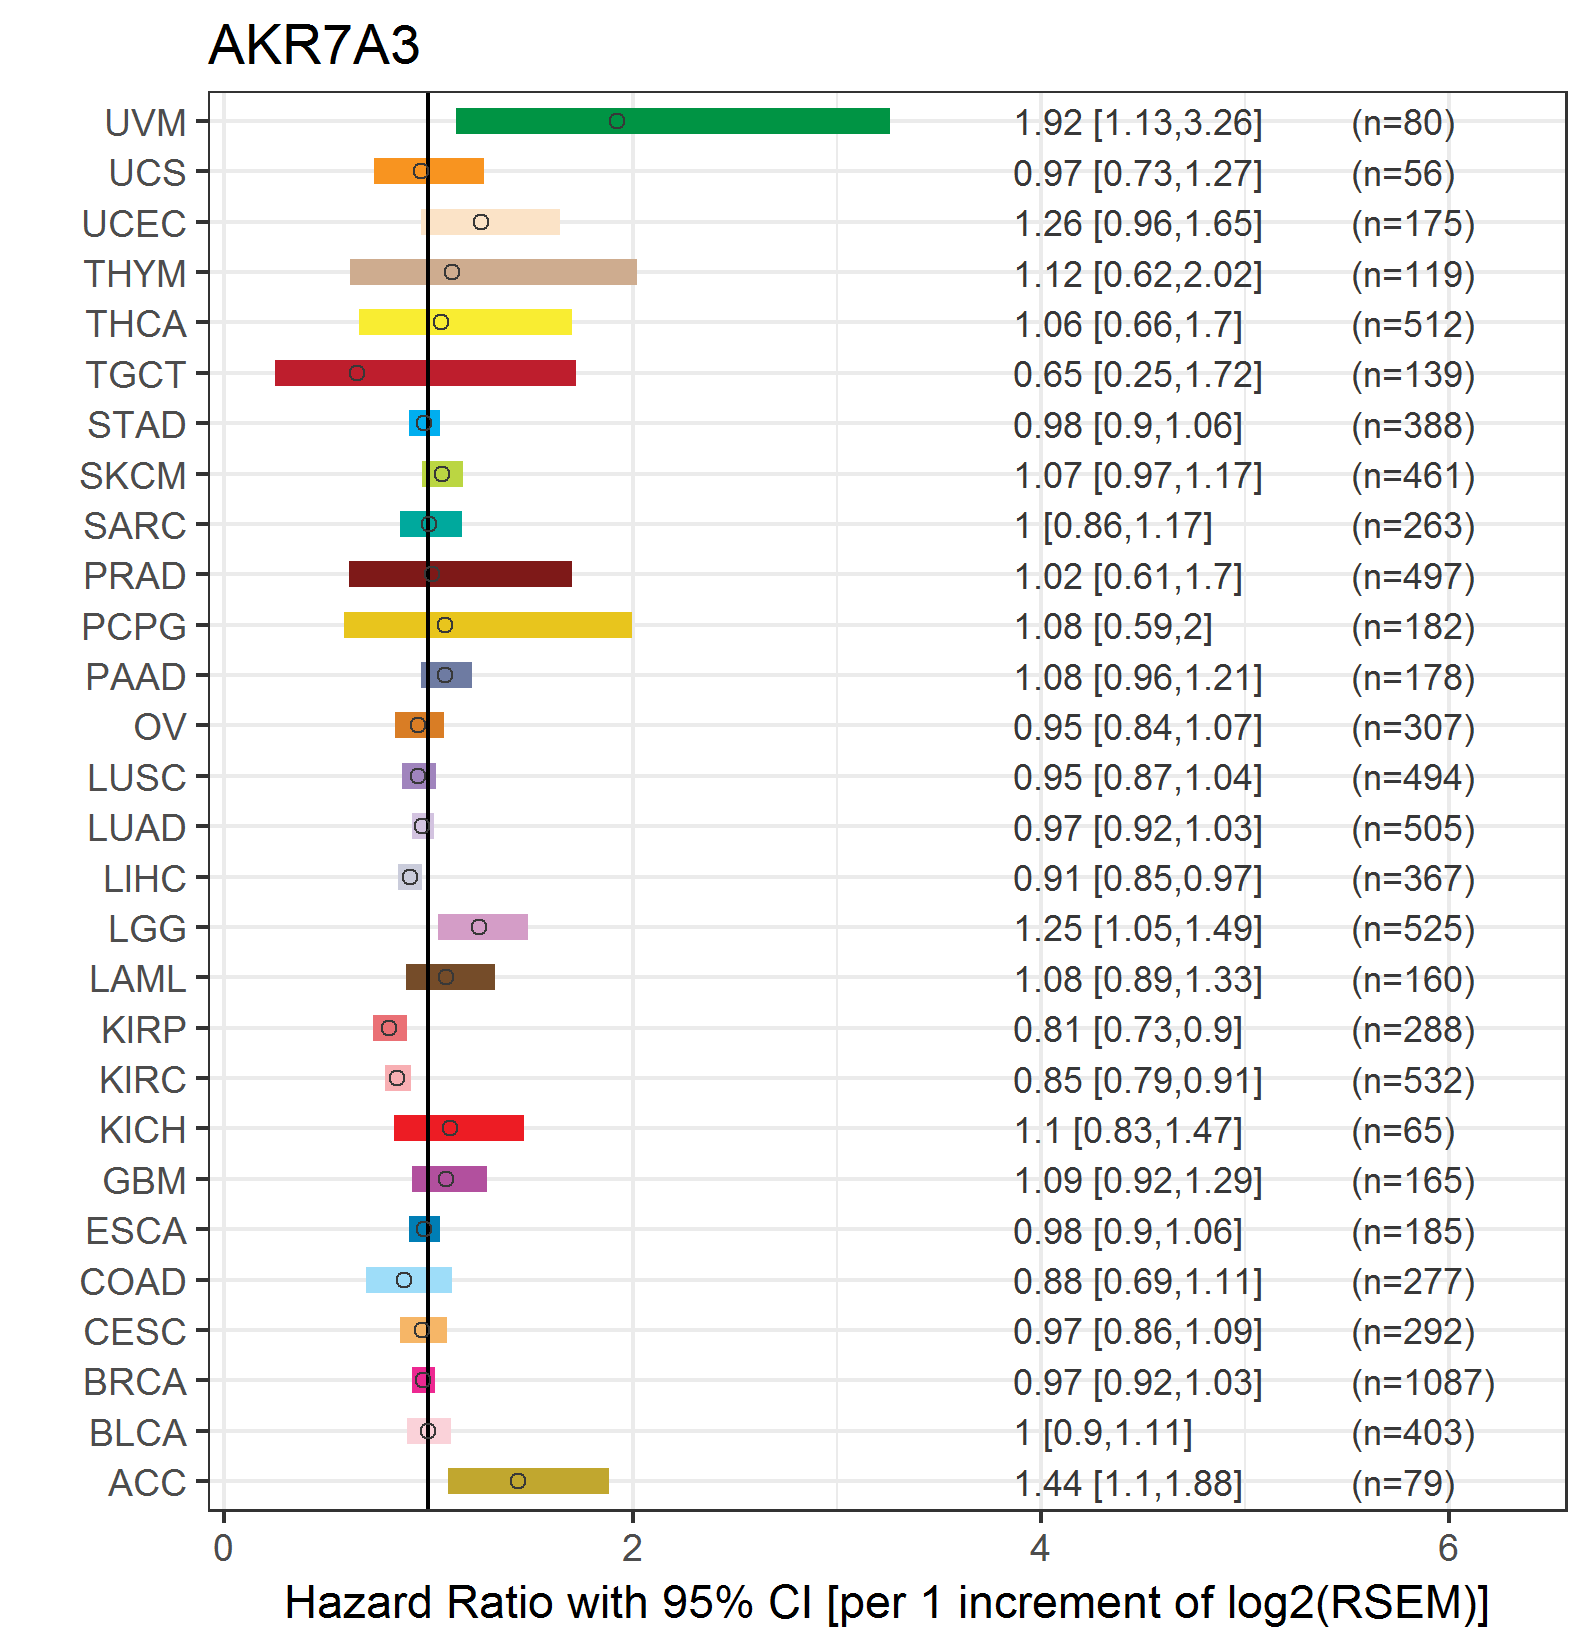
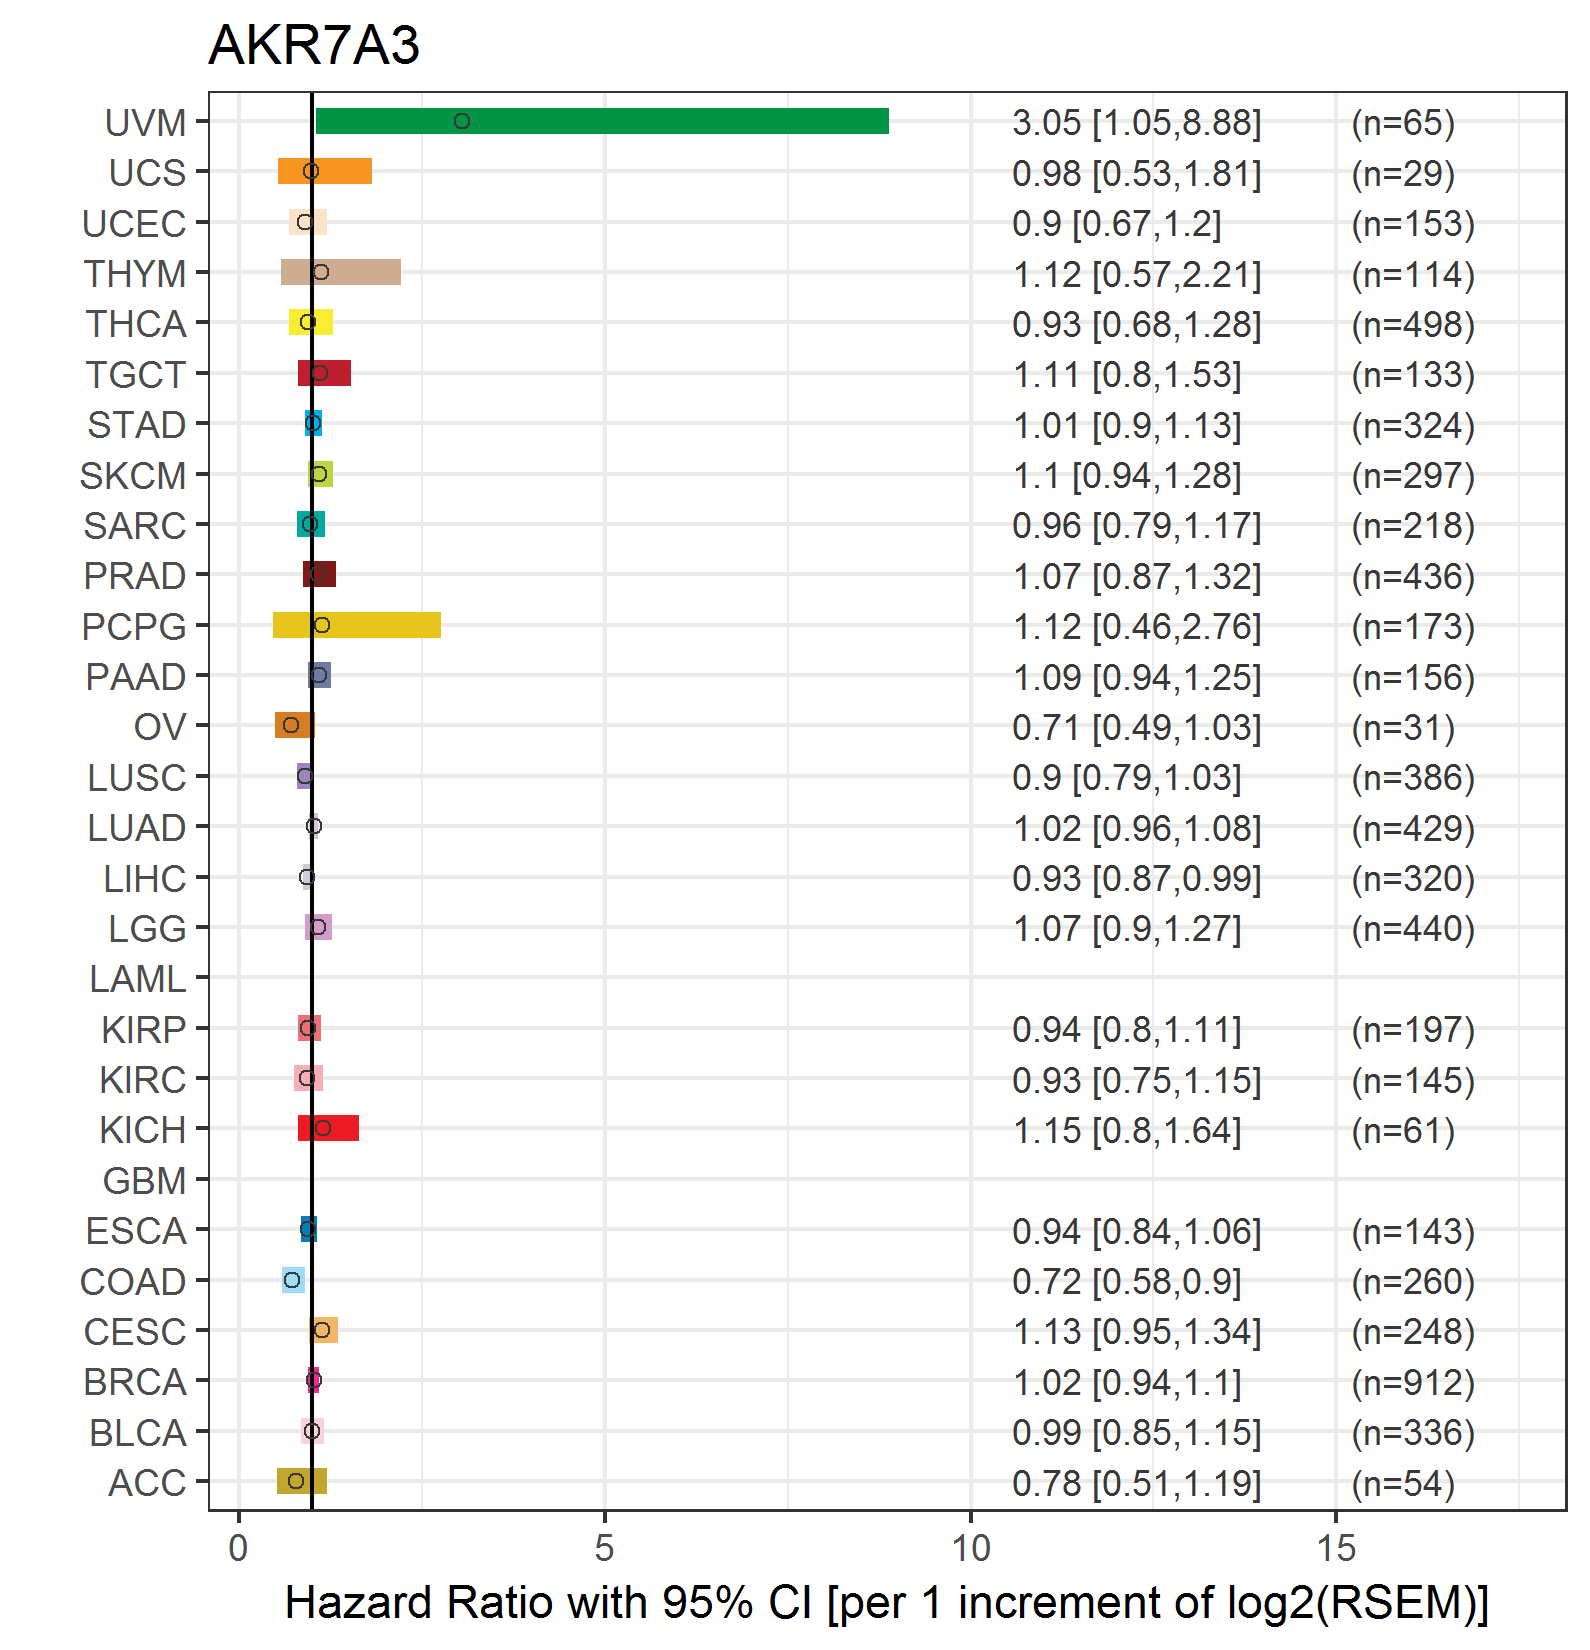
| Forest plot of Cox proportional hazard ratio (HR) and 95% CI of overall survival (OS) using 28 cancer types (TCGA IlluminaHiSeq_RNASeqV2, pan-cancer normalized log2(norm_counts+1) data, version 2016-08-16) (TCGA clinicalMatrix, phenotype data, version 2016-04-27) * Click on the image enlarge it in a new window. |
 |
| Forest plot of Cox proportional hazard ratio (HR) and 95% CI of relapse free survival (RFS) using 28 cancer types (TCGA IlluminaHiSeq_RNASeqV2, pan-cancer normalized log2(norm_counts+1) data, version 2016-08-16) (TCGA clinicalMatrix, phenotype data, version 2016-04-27) * Click on the image enlarge it in a new window. |
 |
| Top |
| TissGeneClin for AKR7A3 |
| TissGeneDrug for AKR7A3 |
| Drug information targeting TissGene (DrugBank Version 5.0.6, 2017-04-01) |
| DrugBank ID | Drug name | Drug activity | Drug type | Drug status |
| Top |
| TissGeneDisease for AKR7A3 |
| Disease information associated with TissGene (DisGeNet, 2016-06-01) |
| Disease ID | Disease name | # pubmeds | Source |
|
Copyright 2016-Present - The University of Texas Health Science Center at Houston (UTHealth) Web File Viewing | How to Report, Fraud, Waste and Abuse | State of Texas | Statewide Search | Texas Homeland Security | Site Policies |