 |
| |
| |
| |
| |
| |
| |
|

| TissGeneSummary for FAIM2 |
 Gene summary Gene summary |
| Basic gene information | Gene symbol | FAIM2 |
| Gene name | Fas apoptotic inhibitory molecule 2 | |
| Synonyms | LFG|LFG2|NGP35|NMP35|TMBIM2 | |
| Cytomap | UCSC genome browser: 12q13 | |
| Type of gene | protein-coding | |
| RefGenes | NM_012306.3, | |
| Description | neural membrane protein 35protein lifeguard 2transmembrane BAX inhibitor motif-containing protein 2 | |
| Modification date | 20141207 | |
| dbXrefs | MIM : 604306 | |
| HGNC : HGNC | ||
| Ensembl : ENSG00000135472 | ||
| HPRD : 09184 | ||
| Vega : OTTHUMG00000169808 | ||
| Protein | UniProt: go to UniProt's Cross Reference DB Table | |
| Expression | CleanEX: HS_FAIM2 | |
| BioGPS: 23017 | ||
| Pathway | NCI Pathway Interaction Database: FAIM2 | |
| KEGG: FAIM2 | ||
| REACTOME: FAIM2 | ||
| Pathway Commons: FAIM2 | ||
| Context | iHOP: FAIM2 | |
| ligand binding site mutation search in PubMed: FAIM2 | ||
| UCL Cancer Institute: FAIM2 | ||
| Assigned class in TissGDB* | C | |
| Included tissue-specific gene expression resources | HPA,TiGER | |
| Specific-tissues in normal samples (assigned by TissGDB using HPA, TiGER, and GTEx) | Brain | |
| Cancer types related to the specific-tissues in cancer samples (assigned by TissGDB using TCGA) | GBM,LGG | |
| Reference showing the relevant tissue of FAIM2 | ||
| Description by TissGene annotations | Protective TissGene in OS Cancer gene Fused withOncogene | |
| * Class A consists of genes with literature evidence and is part of the cTissGenes. Class B consists of only cTissGenes without additional evidence. The remaining genes belong to Class C. |
| Gene ontology having evidence of Inferred from Direct Assay (IDA) from Entrez |
| GO ID | GO term | PubMed ID |
| Top |
| TissGeneExp for FAIM2 |
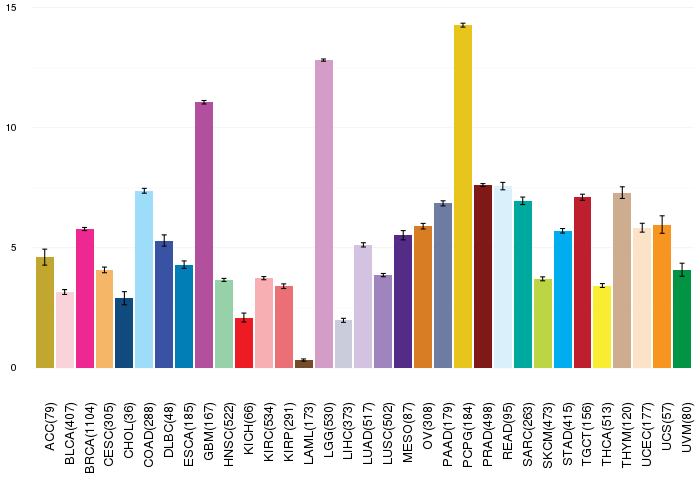
| Gene expressions across 28 cancer types (X-axis: cancer type and Y-axis: log2(norm_counts+1)) (TCGA IlluminaHiSeq_RNASeqV2, pan-cancer normalized log2(norm_counts+1) data, version 2016-08-16) |
 |
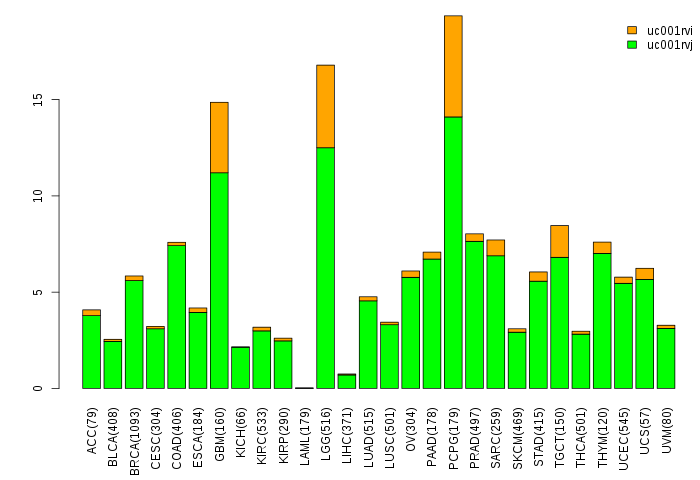
| Gene isoform expressions across 28 cancer types (X-axis: cancer type and Y-axis: log2(norm_counts+1)) (TCGA pan-cancer tcga_rsem_isoform_tpm, version 2016-09-01) |
 |
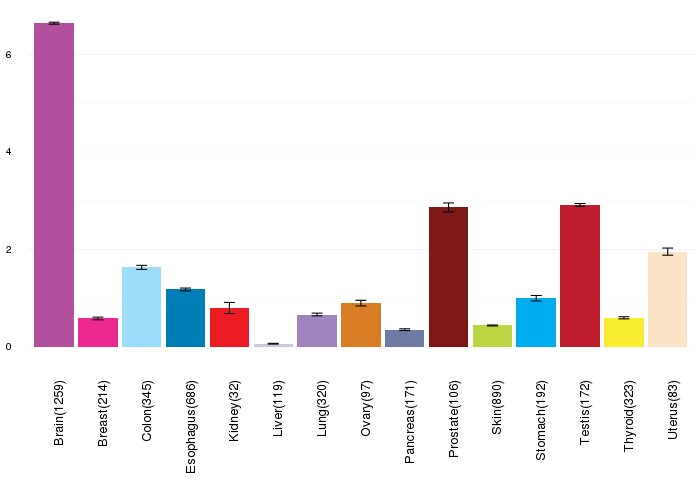
| Gene expressions across normal tissues of GTEx data (GTEx GTEx_Analysis_v6_RNA-seq_RNA-SeQCv1.1.8_gene_rpkm.gct) - Here, we shows the matched tissue types only among our 28 cancer types. |
 |
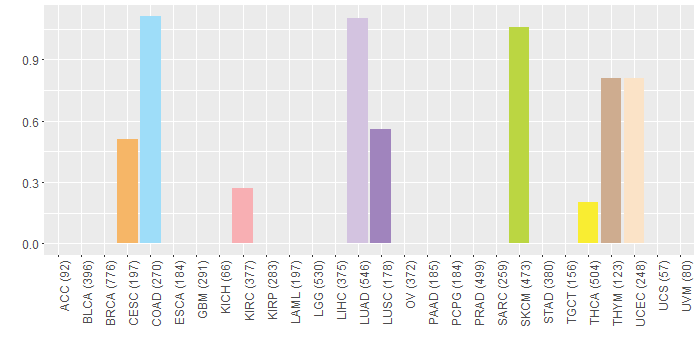
| Different expressions across 14 cancer types with more than 10 samples between matched tumors and normals (X-axis: cancer type and Y-axis: log2(norm_counts+1)) (TCGA IlluminaHiSeq_RNASeqV2, pan-cancer normalized log2(norm_counts+1) data, version 2016-08-16) |
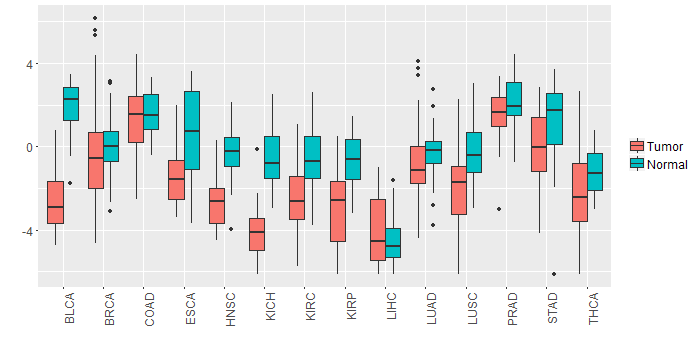 |
| - Significantly differentially expressed cancer types and information. (|Fold change|>1 and FDR<0.05) |
| Cancer type | Mean(exp) in tumor | Mean(exp) in matched normal | Log2FC | P-val. | FDR |
| LUSC | -2.081730927 | -0.377734848 | -1.703996078 | 3.51E-07 | 9.27E-07 |
| KIRP | -2.773381478 | -0.671772103 | -2.101609375 | 1.27E-06 | 6.29E-06 |
| KIRC | -2.422715159 | -0.564422103 | -1.858293056 | 1.22E-12 | 5.20E-12 |
| HNSC | -2.591811638 | -0.336930243 | -2.254881395 | 7.01E-13 | 2.82E-11 |
| KICH | -4.082244103 | -0.537704103 | -3.54454 | 1.90E-12 | 2.14E-11 |
| BLCA | -2.585777366 | 1.93924895 | -4.525026316 | 2.39E-11 | 1.00E-08 |
| THCA | -2.288065323 | -1.214117866 | -1.073947458 | 0.000584 | 0.001423982 |
| Top |
| TissGene-miRNA for FAIM2 |
| Significantly anti-correlated miRNAs of TissGene across 28 cancer types (Gene-miRNA relations from TargetScanHuman Relsease 7.1, Conserved_Site_Context_Scores.txt.zip, 06.01.2016) (TCGA IlluminaHiSeq_miRNASeq, log2(RPM+1) data, version 2016-11-21) (TCGA IlluminaHiSeq_RNASeqV2, log2(normalized_count+1) data, version 2016-08-16) (Spearman’s Rank Correlation (p-value<0.05 and coefficient<-0.25)) |
| Cancer type | miRNA id | miRNA accession | P-val. | Coeff. | # samples |
| Top |
| TissGeneMut for FAIM2 |
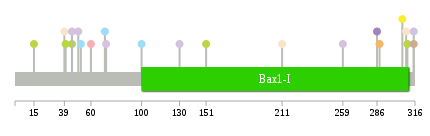
| TissGeneSNV for FAIM2 |
| nsSNV counts per each loci. Different colors of circles represent different cancer types. Circle size denotes number of samples. (TCGA somatic mutation (SNPs and small INDELs) data, version 2016-04-25) * Click on the image to enlarge it in a new window. |
 |
 |
| Somatic nucleotide variants of TissGene across 28 cancer types (X-axis: cancer type and Y-axis: % of mutated samples) The numbers in parentheses are numbers of samples with mutation (nsSNVs). (TCGA somatic mutation (SNPs and small INDELs) data, version 2016-04-25) |
 |
| - nsSNVs sorted by frequency. |
| AAchange | Cancer type | # samples |
| p.E45X | CHOL | 1 |
| p.L310F | SKCM | 1 |
| p.E45Q | LUAD | 1 |
| p.A259E | LUAD | 1 |
| p.E40K | SKCM | 1 |
| p.R315G | LUAD | 1 |
| p.T15I | SKCM | 1 |
| p.T151A | SKCM | 1 |
| p.P286T | LUSC | 1 |
| p.E288K | CESC | 1 |
| p.V130F | LUAD | 1 |
| p.S71C | COAD | 1 |
| p.E39D | UCEC | 1 |
| p.G50V | LUAD | 1 |
| p.V211I | UCEC | 1 |
| p.F306S | THCA | 1 |
| p.R100X | COAD | 1 |
| p.P60H | KIRC | 1 |
| p.R315L | THYM | 1 |
| p.S72C | LUAD | 1 |
| p.E45K | SKCM | 1 |
| p.Q309H | UCEC | 1 |
| p.F52L | COAD | 1 |
| Top |
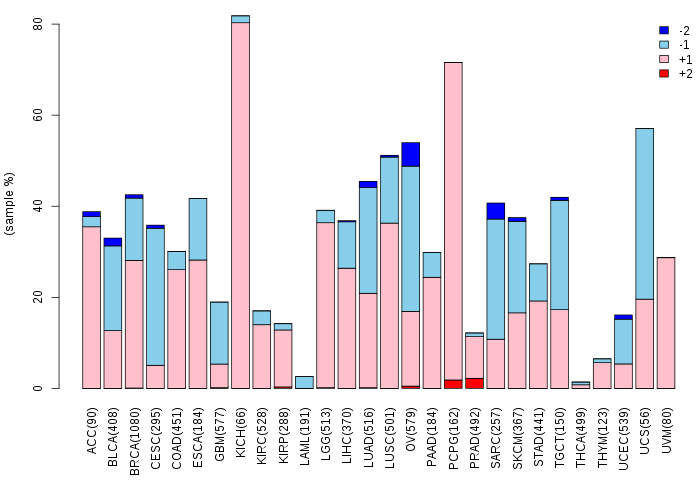
| TissGeneCNV for FAIM2 |
| Copy number variations of TissGene across 28 cancer types (X-axis: cancer type and Y-axis: % of CNV samples) (TCGA Gistic2_CopyNumber_Gistic2_all_data_by_genes, Gistic2 copy number data, version 2016-08-16) |
 |
| Top |
| TissGeneFusions for FAIM2 |
| Fusion genes including TissGene (ChimerDB 3.0, 2016-12-01 and TCGA fusion Portal 2015-12-01) |
| Database | Src | Cancer type | Sample | Fusion gene | ORF | 5'-gene BP | 3'-gene BP |
| Chimerdb3.0 | ChiTaRs | NA | DR978508 | PBXIP1-FAIM2 | chr1:154918626 | chr12:50264182 | |
| Chimerdb3.0 | ChiTaRs | NA | AA564475 | FAIM2-FAIM2 | chr12:50261216 | chr12:50260678 |
| Top |
| TissGeneNet for FAIM2 |
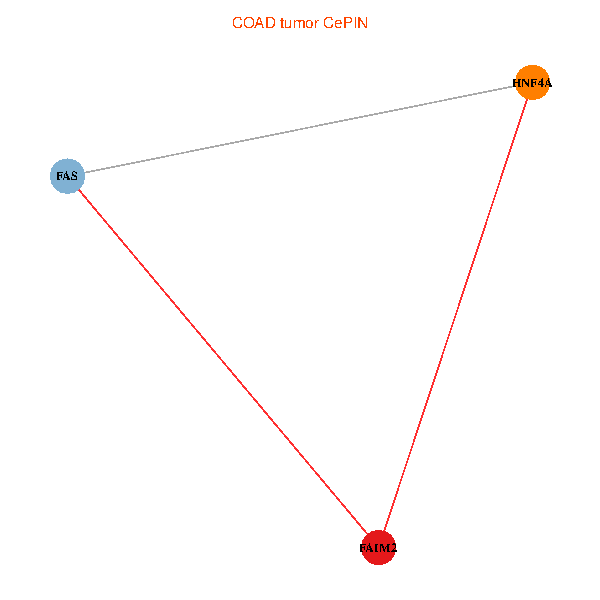
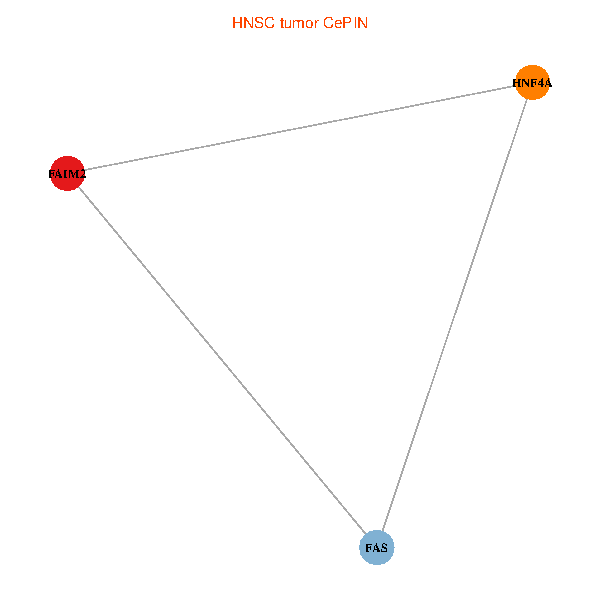
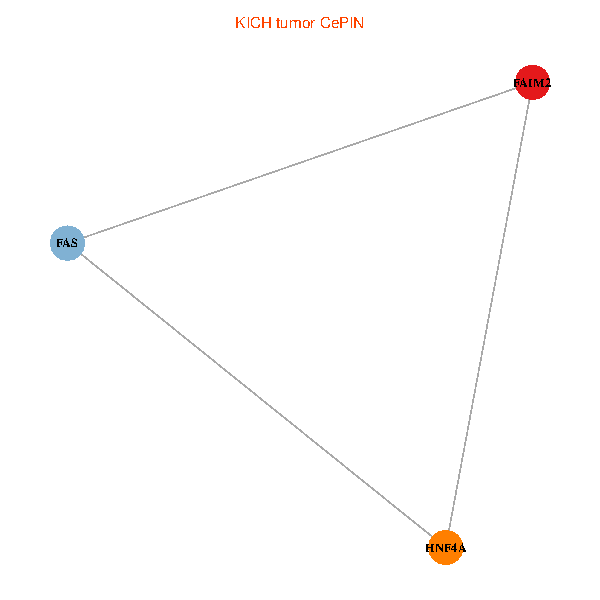
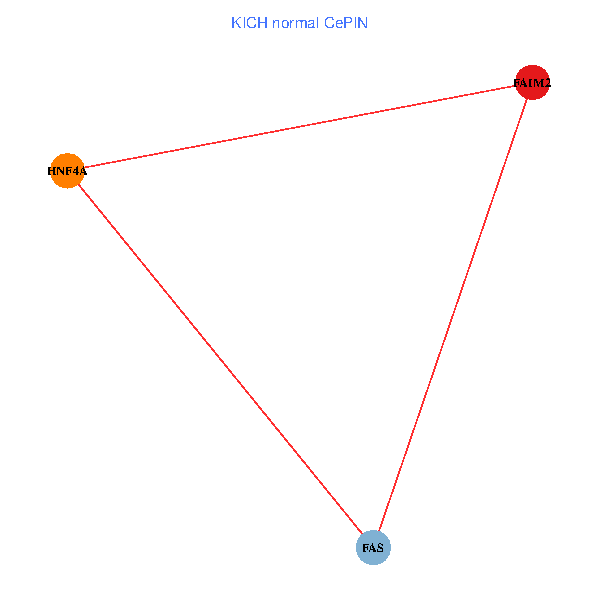
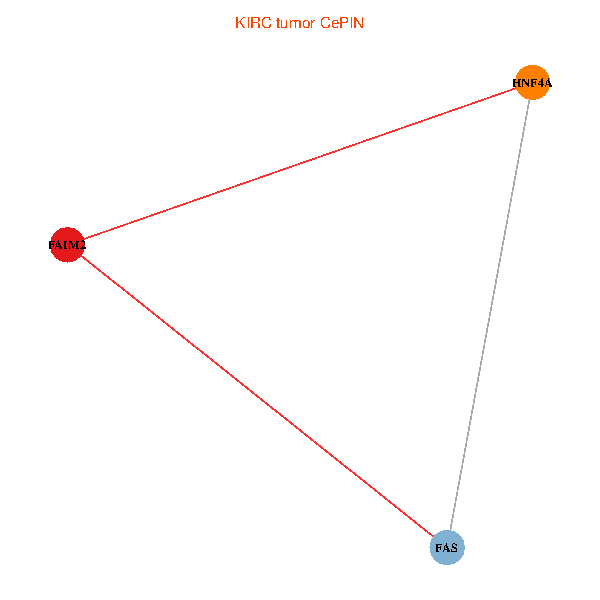
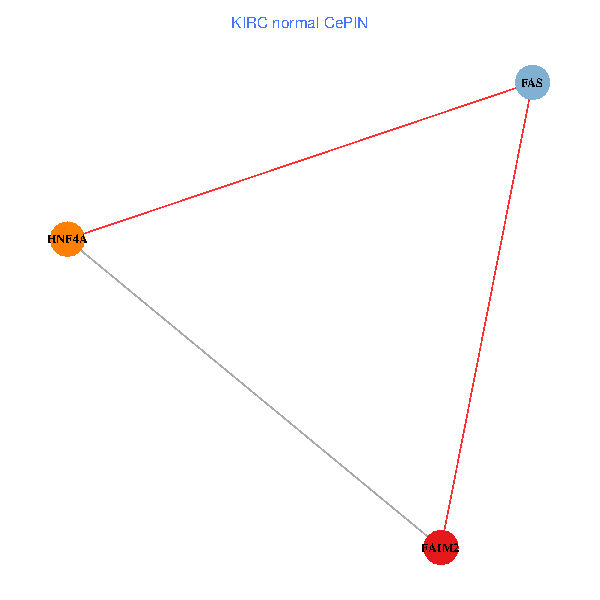
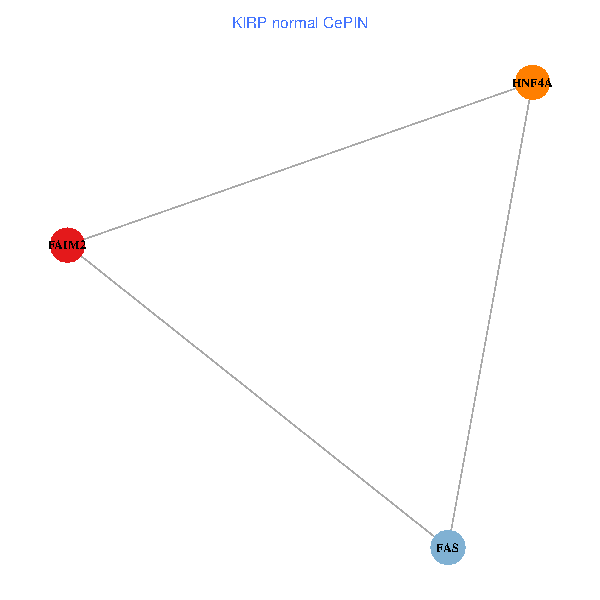
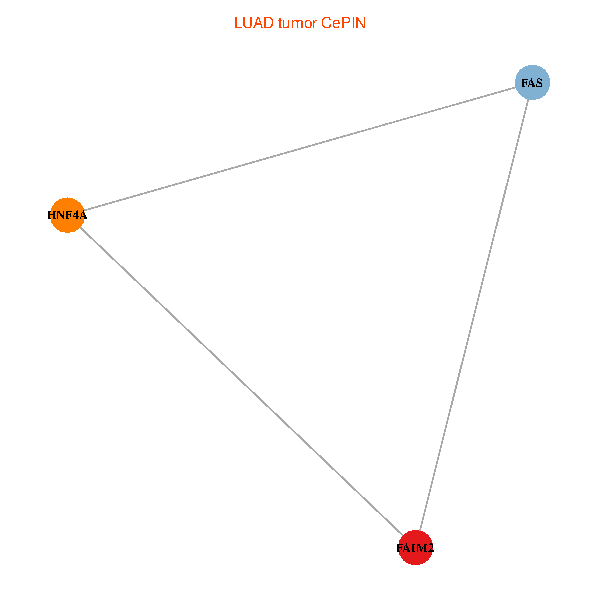
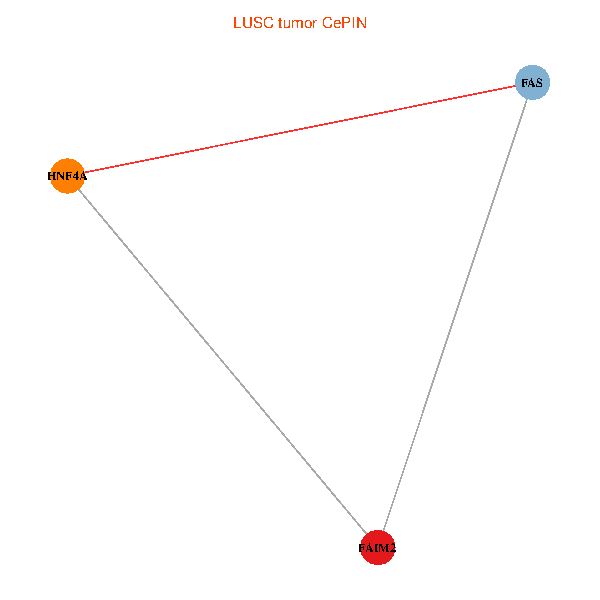
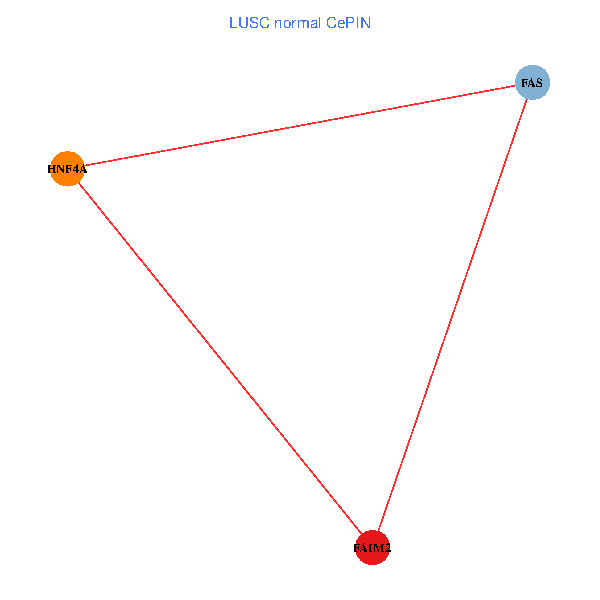
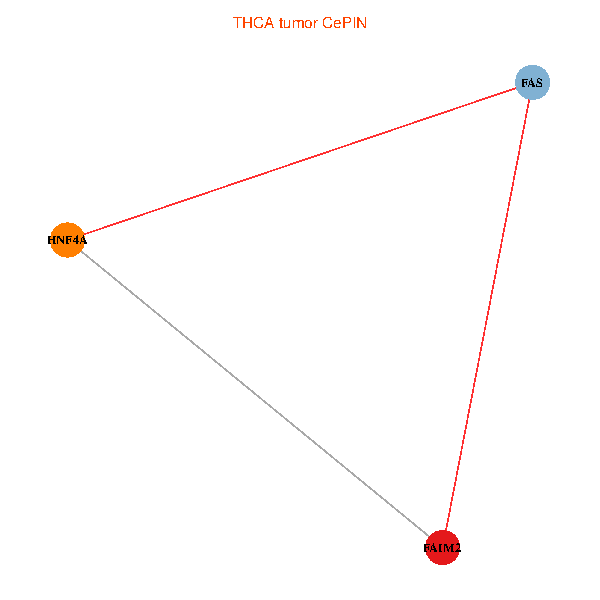
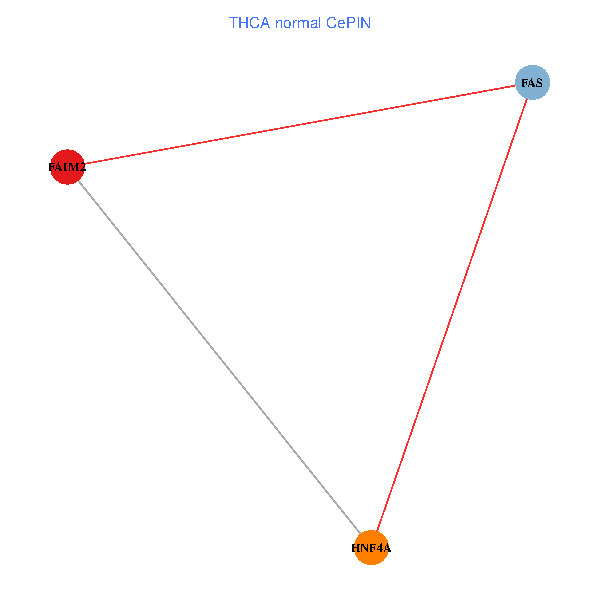
| Co-expressed gene networks based on protein-protein interaction data (CePIN) (TCGA IlluminaHiSeq_RNASeqV2, pan-cancer normalized log2(norm_counts+1) data, version 2016-08-16) (PINA2 ppi data) |
| BRCA (tumor) | BRCA (normal) |
| FAIM2, HNF4A, FAS (tumor) | FAIM2, HNF4A, FAS (normal) |
 | 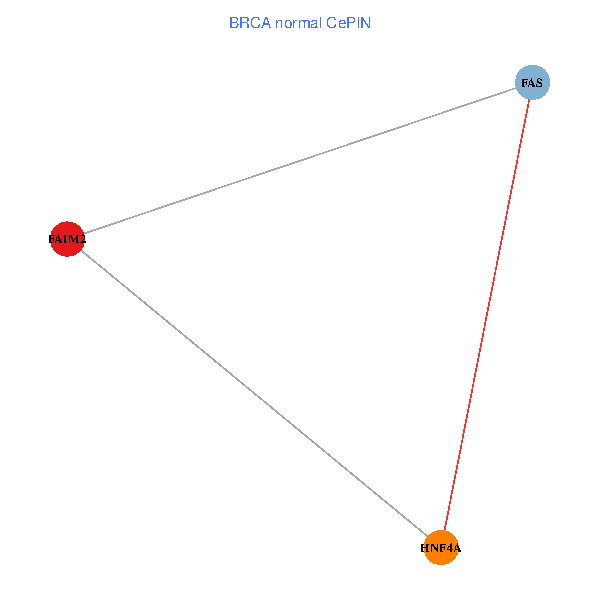 |
| COAD (tumor) | COAD (normal) |
| FAIM2, HNF4A, FAS (tumor) | FAIM2, HNF4A, FAS (normal) |
 |  |
| HNSC (tumor) | HNSC (normal) |
| FAIM2, HNF4A, FAS (tumor) | FAIM2, HNF4A, FAS (normal) |
 |  |
| KICH (tumor) | KICH (normal) |
| FAIM2, HNF4A, FAS (tumor) | FAIM2, HNF4A, FAS (normal) |
 |  |
| KIRC (tumor) | KIRC (normal) |
| FAIM2, HNF4A, FAS (tumor) | FAIM2, HNF4A, FAS (normal) |
 |  |
| KIRP (tumor) | KIRP (normal) |
| FAIM2, HNF4A, FAS (tumor) | FAIM2, HNF4A, FAS (normal) |
 |  |
| LIHC (tumor) | LIHC (normal) |
| FAIM2, HNF4A, FAS (tumor) | FAIM2, HNF4A, FAS (normal) |
 |  |
| LUAD (tumor) | LUAD (normal) |
| FAIM2, HNF4A, FAS (tumor) | FAIM2, HNF4A, FAS (normal) |
 |  |
| LUSC (tumor) | LUSC (normal) |
| FAIM2, HNF4A, FAS (tumor) | FAIM2, HNF4A, FAS (normal) |
 |  |
| PRAD (tumor) | PRAD (normal) |
| FAIM2, HNF4A, FAS (tumor) | FAIM2, HNF4A, FAS (normal) |
 |  |
| STAD (tumor) | STAD (normal) |
| FAIM2, HNF4A, FAS (tumor) | FAIM2, HNF4A, FAS (normal) |
 |  |
| THCA (tumor) | THCA (normal) |
| FAIM2, HNF4A, FAS (tumor) | FAIM2, HNF4A, FAS (normal) |
 |  |
| Top |
| TissGeneProg for FAIM2 |
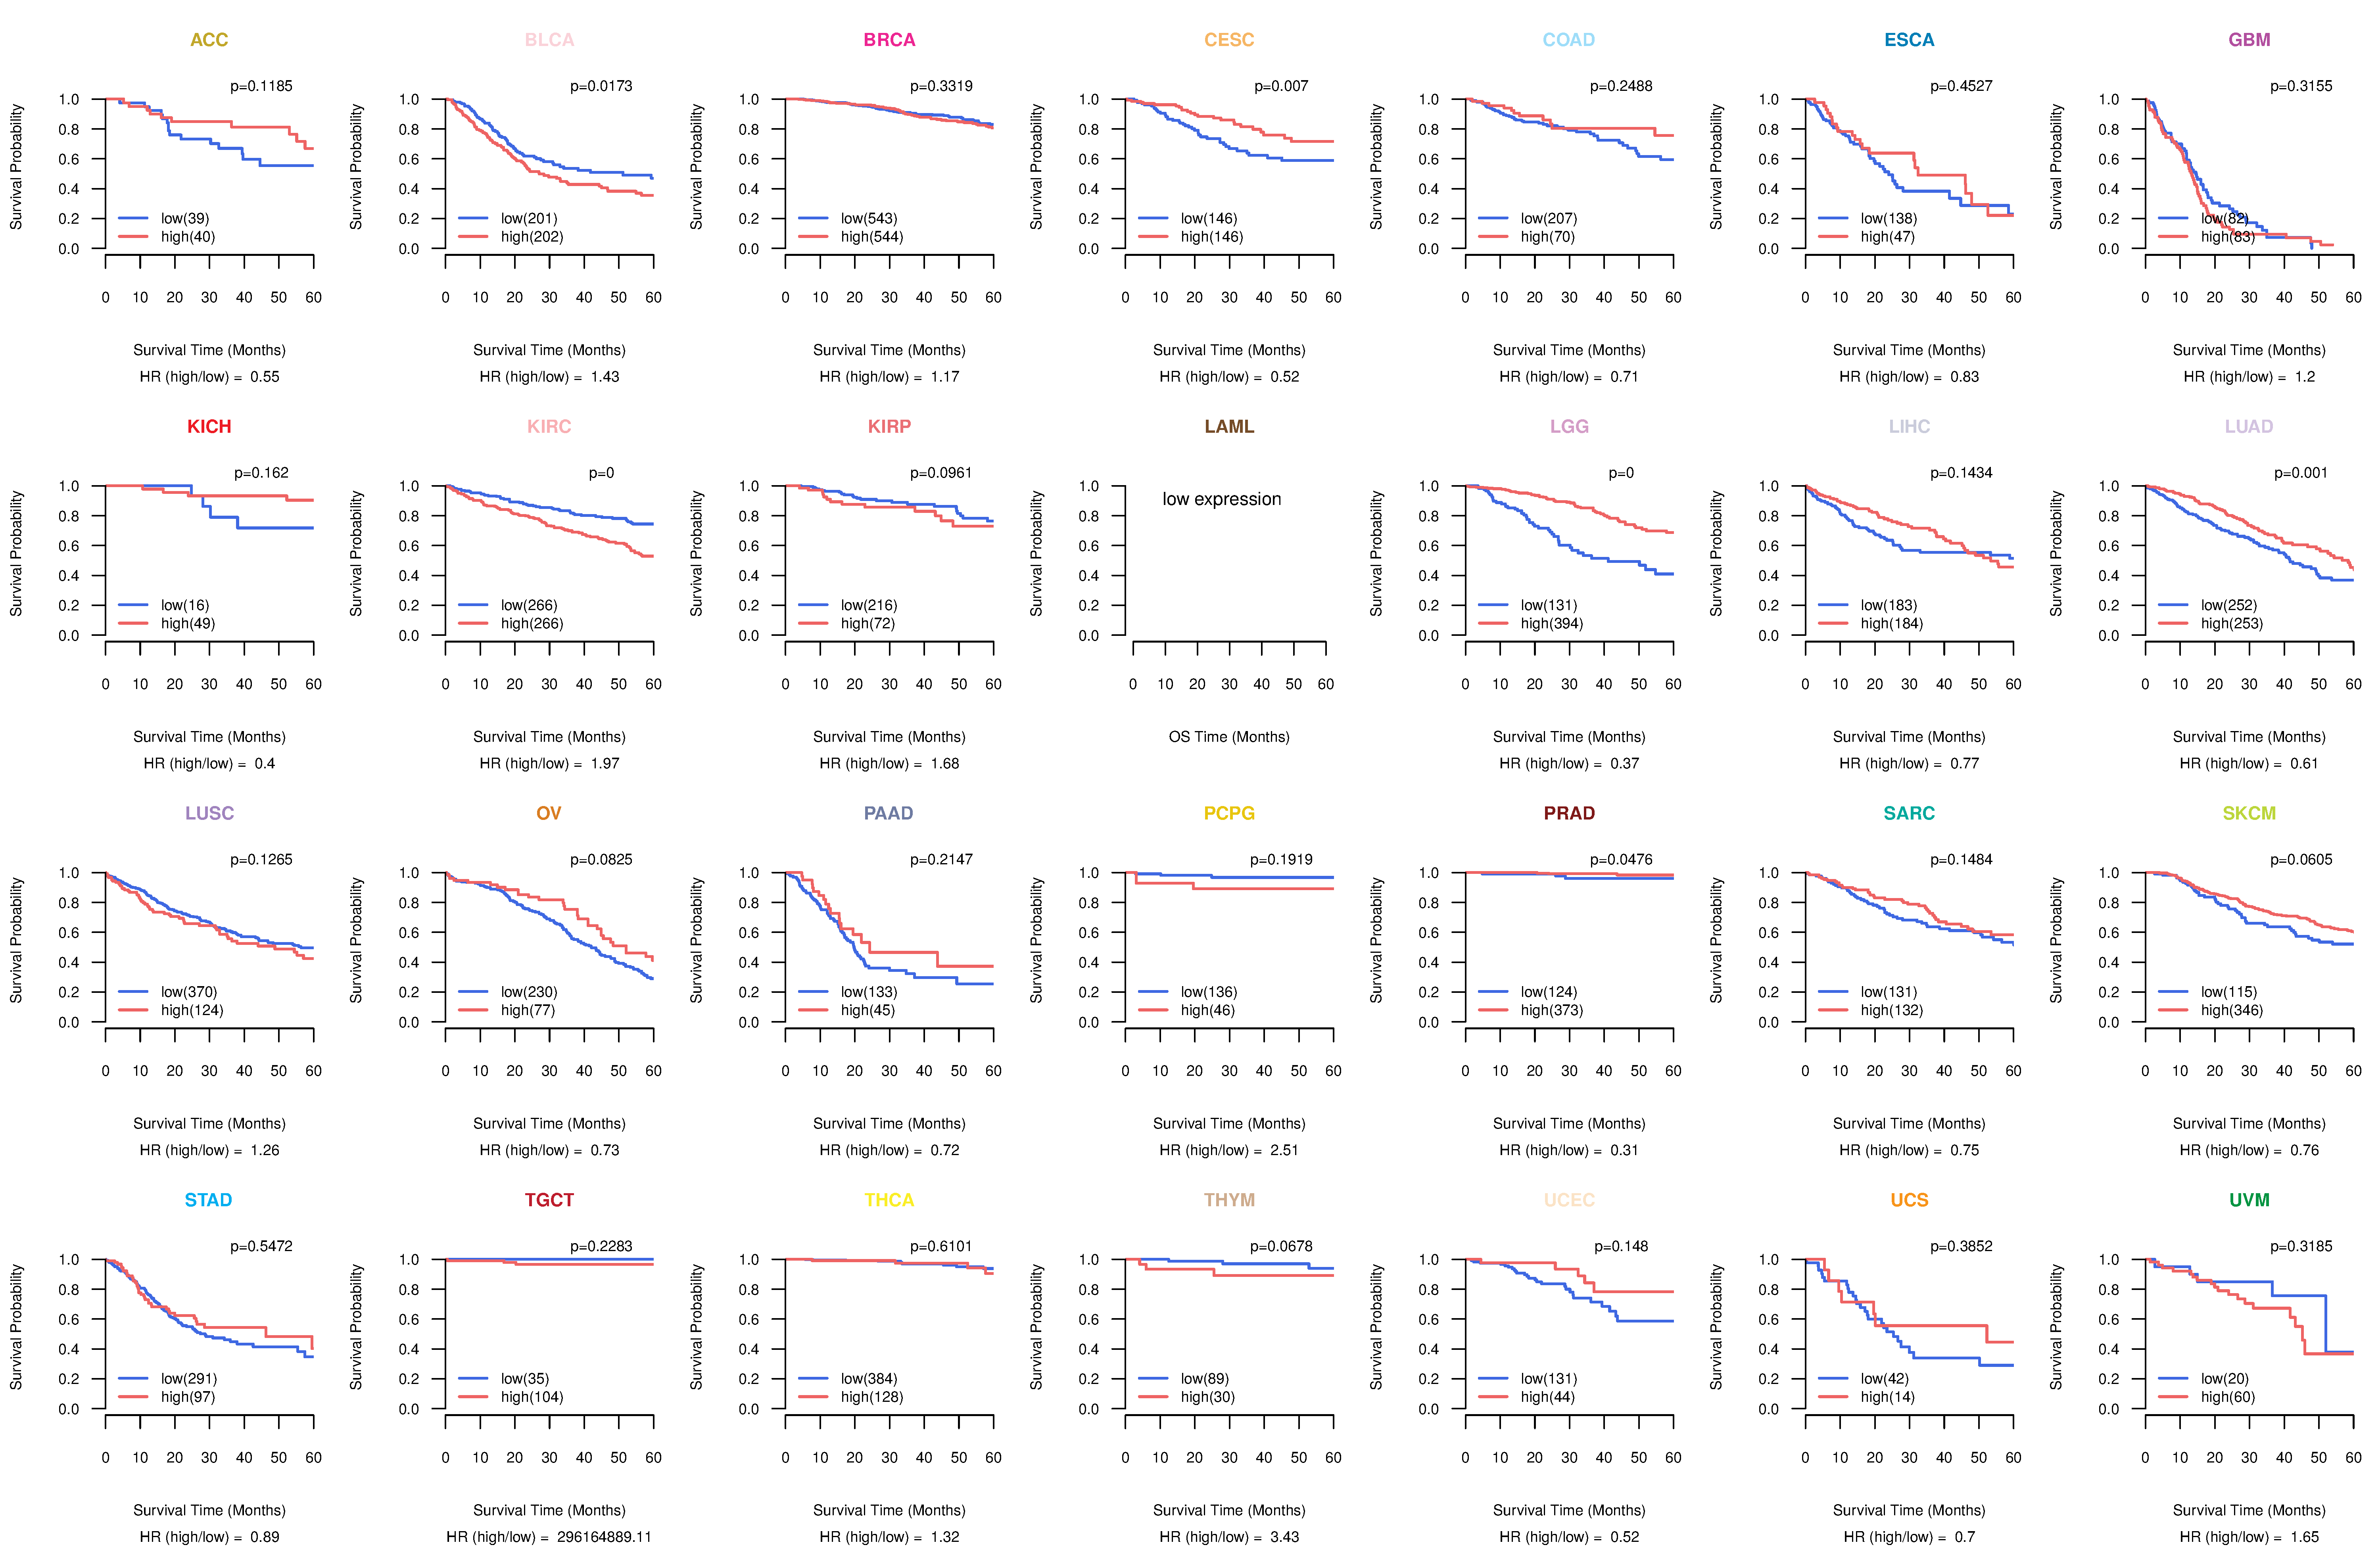
| Kaplan-Meier plots with logrank tests of overall survival (OS) using 28 cancer types (TCGA IlluminaHiSeq_RNASeqV2, pan-cancer normalized log2(norm_counts+1) data, version 2016-08-16) (TCGA clinicalMatrix, phenotype data, version 2016-04-27) * Click on the image to enlarge it in a new window. |
 |
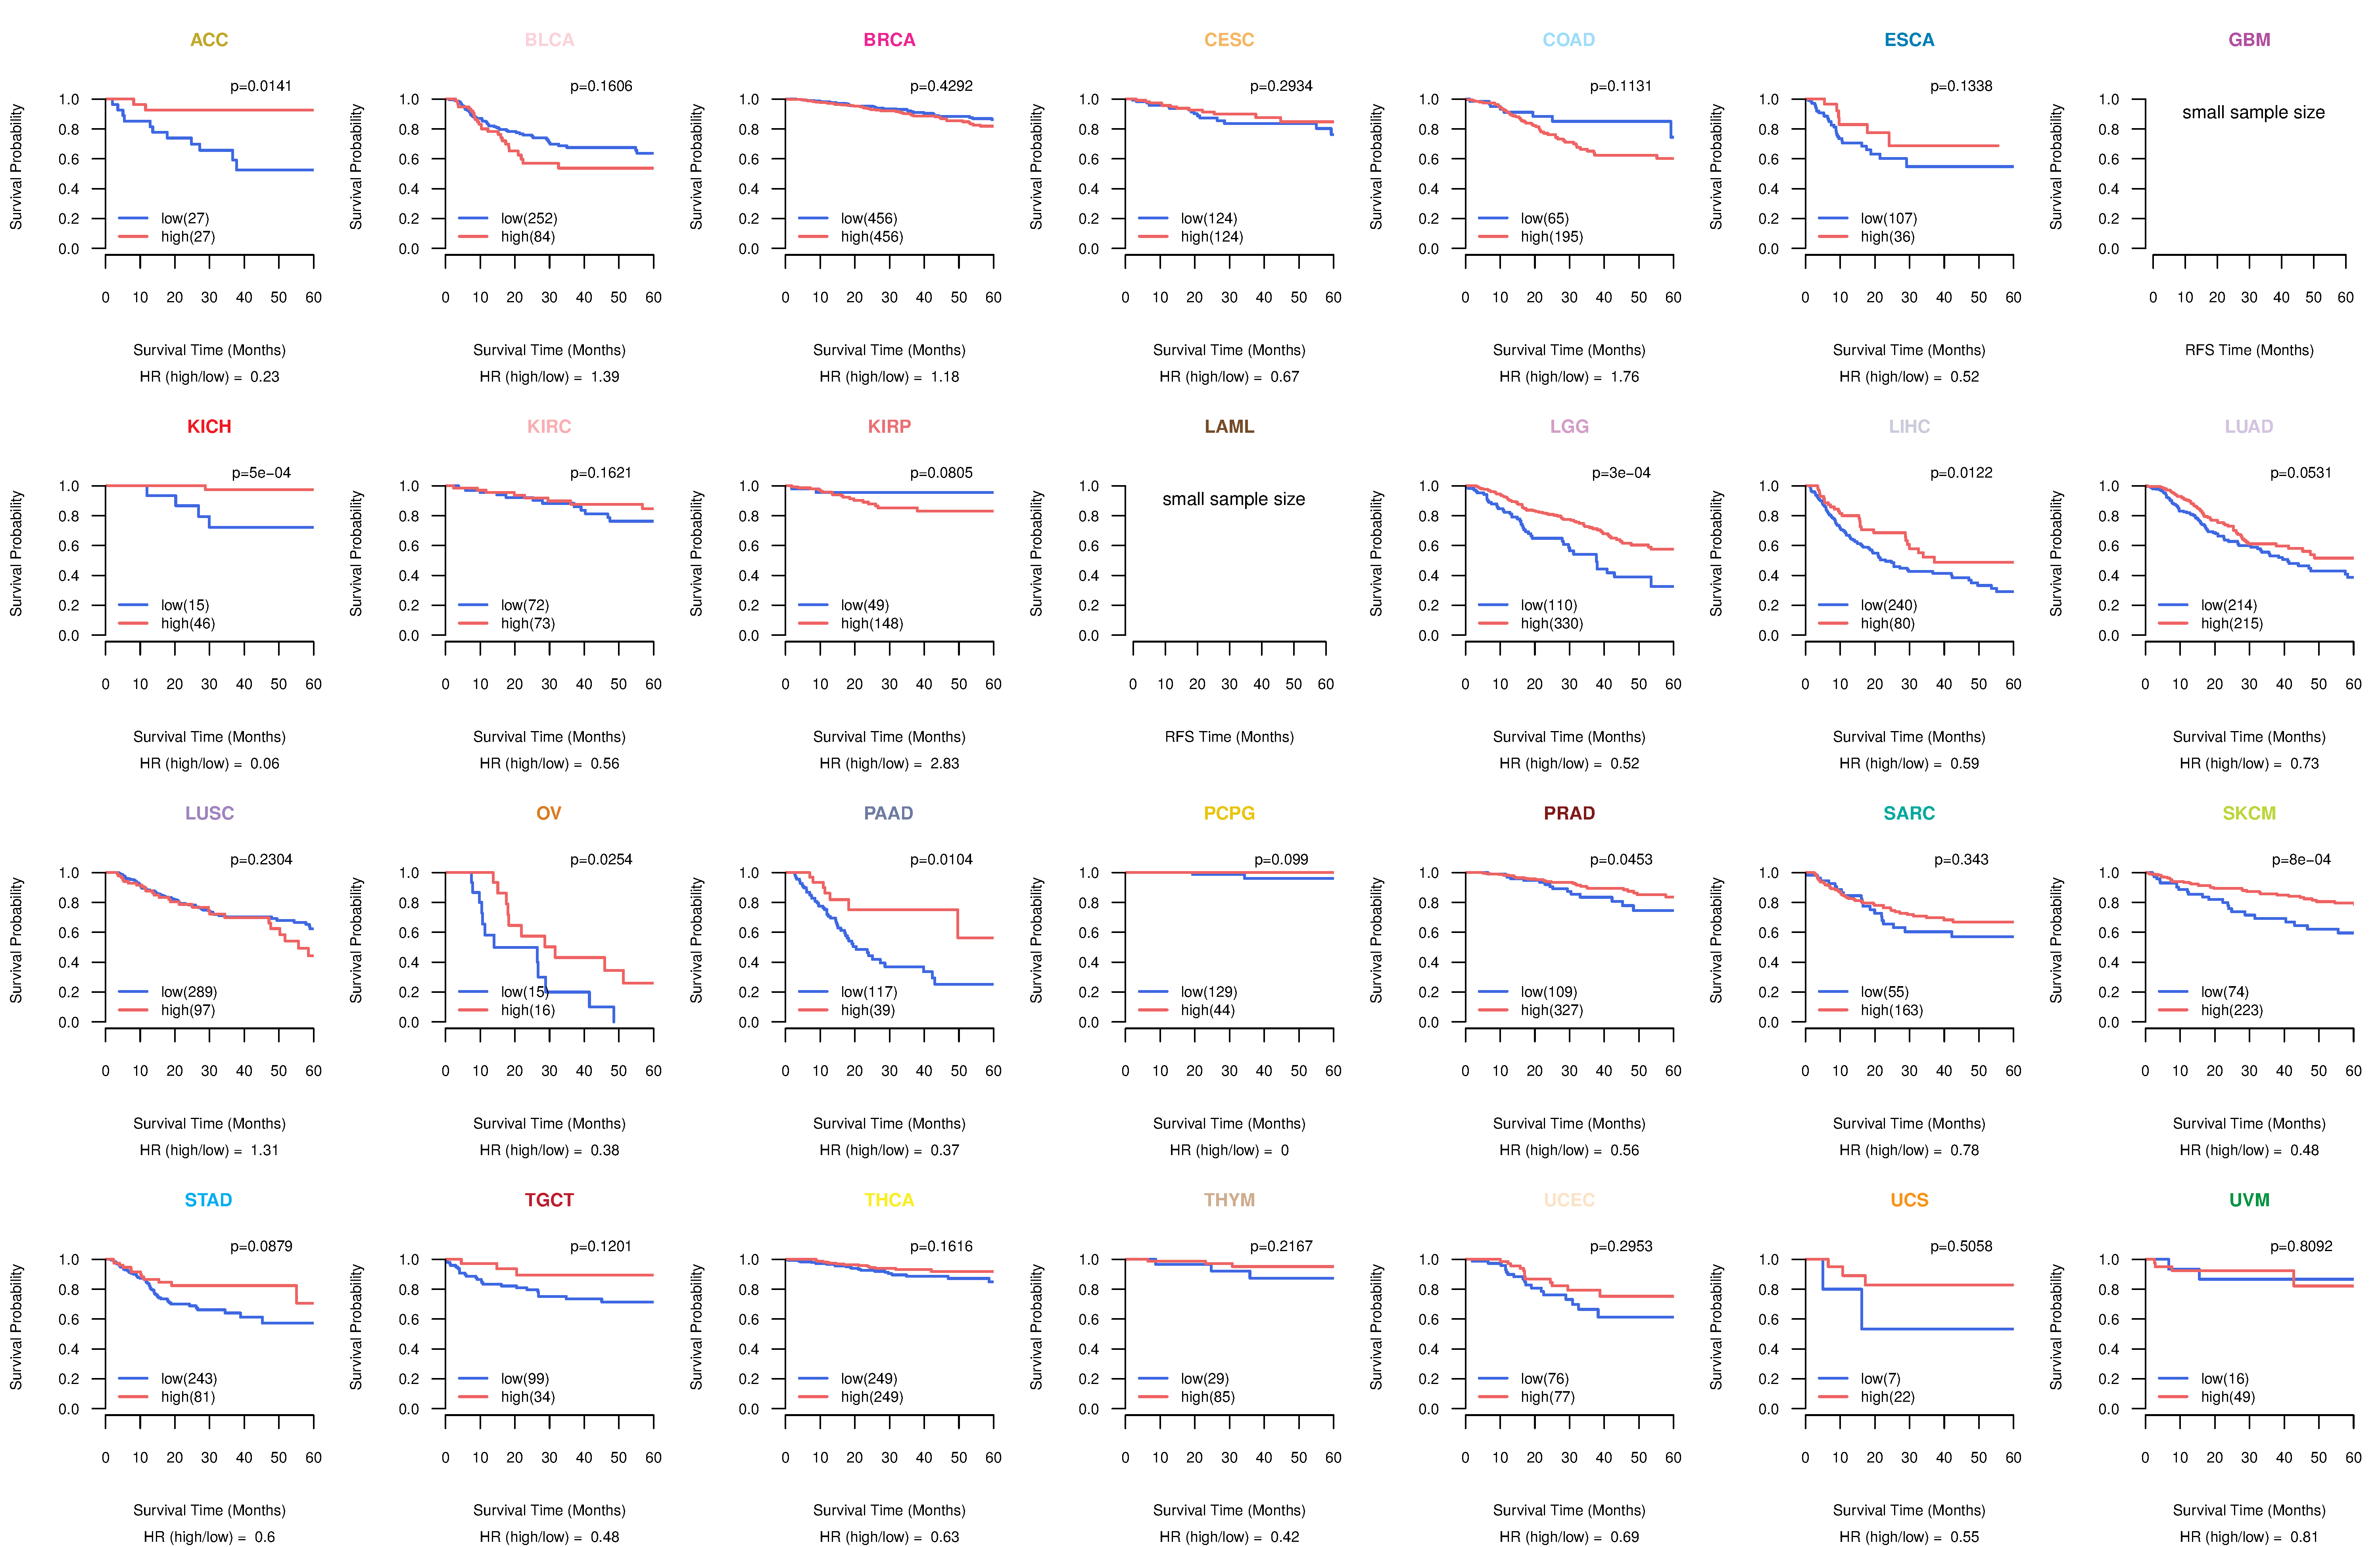
| Kaplan-Meier plots with logrank test of relapse free survival (RFS) using 28 cancer types (TCGA IlluminaHiSeq_RNASeqV2, pan-cancer normalized log2(norm_counts+1) data, version 2016-08-16) (TCGA clinicalMatrix, phenotype data, version 2016-04-27) * Click on the image enlarge it in a new window. |
 |
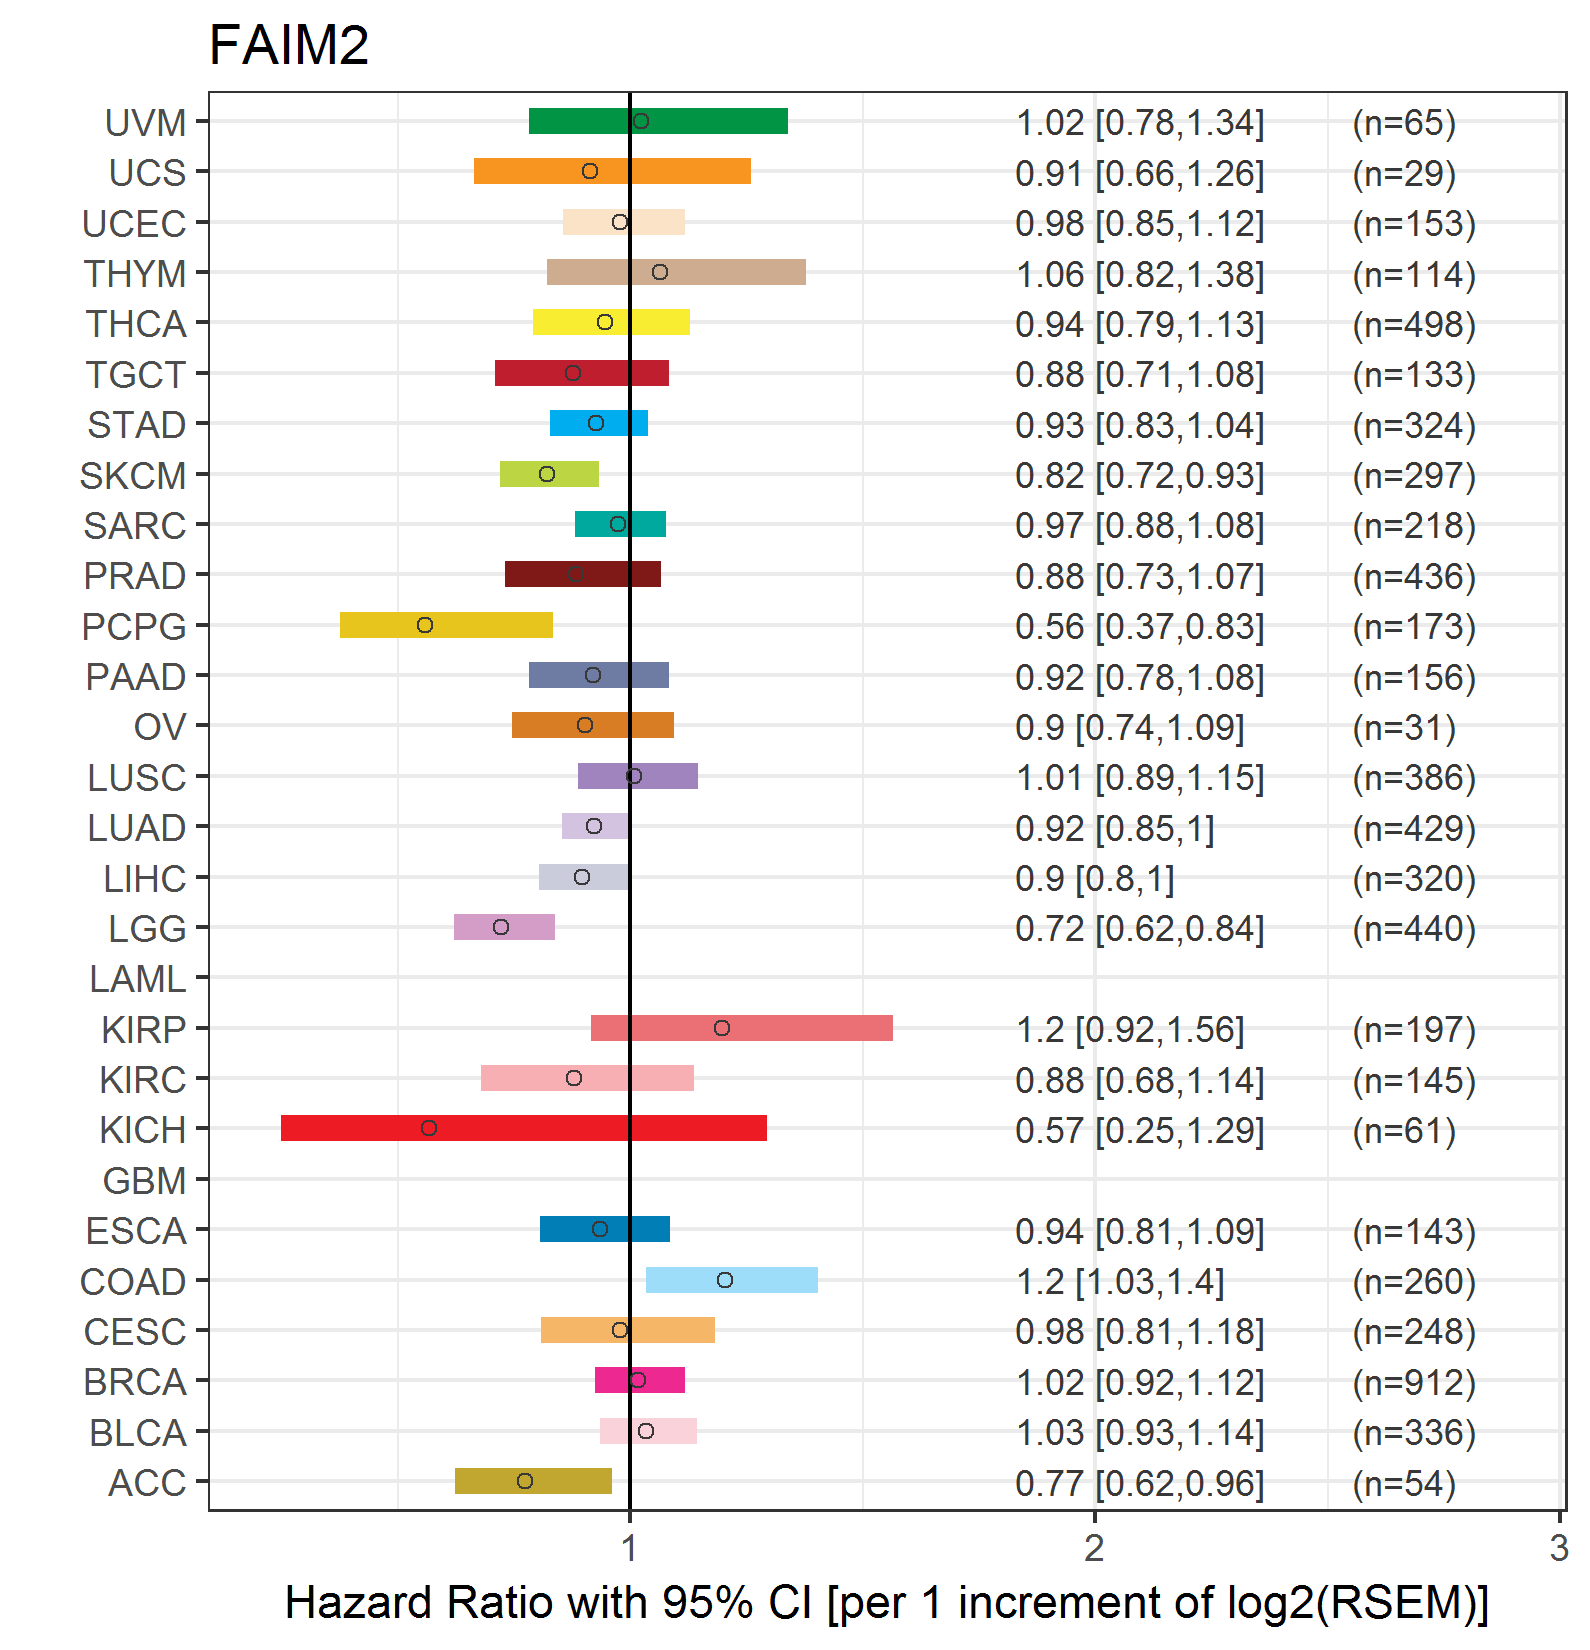
| Forest plot of Cox proportional hazard ratio (HR) and 95% CI of overall survival (OS) using 28 cancer types (TCGA IlluminaHiSeq_RNASeqV2, pan-cancer normalized log2(norm_counts+1) data, version 2016-08-16) (TCGA clinicalMatrix, phenotype data, version 2016-04-27) * Click on the image enlarge it in a new window. |
 |
| Forest plot of Cox proportional hazard ratio (HR) and 95% CI of relapse free survival (RFS) using 28 cancer types (TCGA IlluminaHiSeq_RNASeqV2, pan-cancer normalized log2(norm_counts+1) data, version 2016-08-16) (TCGA clinicalMatrix, phenotype data, version 2016-04-27) * Click on the image enlarge it in a new window. |
 |
| Top |
| TissGeneClin for FAIM2 |
| TissGeneDrug for FAIM2 |
| Drug information targeting TissGene (DrugBank Version 5.0.6, 2017-04-01) |
| DrugBank ID | Drug name | Drug activity | Drug type | Drug status |
| Top |
| TissGeneDisease for FAIM2 |
| Disease information associated with TissGene (DisGeNet, 2016-06-01) |
| Disease ID | Disease name | # pubmeds | Source |
| umls:C0028754 | Obesity | 12 | BeFree,GAD |
| umls:C0011860 | Diabetes Mellitus, Non-Insulin-Dependent | 1 | GAD |
| umls:C0020538 | Hypertensive disease | 1 | BeFree |
| umls:C0027051 | Myocardial Infarction | 1 | BeFree |
| umls:C0027627 | Neoplasm Metastasis | 1 | BeFree |
| umls:C0027819 | Neuroblastoma | 1 | BeFree |
| umls:C0153676 | Secondary malignant neoplasm of lung | 1 | BeFree |
| umls:C0242339 | Dyslipidemias | 1 | BeFree |
| umls:C0700095 | Central neuroblastoma | 1 | BeFree |
|
Copyright 2016-Present - The University of Texas Health Science Center at Houston (UTHealth) Web File Viewing | How to Report, Fraud, Waste and Abuse | State of Texas | Statewide Search | Texas Homeland Security | Site Policies |