 |
| |
| |
| |
| |
| |
| |
|

| TissGeneSummary for MLC1 |
 Gene summary Gene summary |
| Basic gene information | Gene symbol | MLC1 |
| Gene name | megalencephalic leukoencephalopathy with subcortical cysts 1 | |
| Synonyms | LVM|MLC|VL | |
| Cytomap | UCSC genome browser: 22q13.33 | |
| Type of gene | protein-coding | |
| RefGenes | NM_015166.3, NM_139202.2, | |
| Description | membrane protein MLC1 | |
| Modification date | 20141219 | |
| dbXrefs | MIM : 605908 | |
| HGNC : HGNC | ||
| Ensembl : ENSG00000100427 | ||
| HPRD : 05800 | ||
| Vega : OTTHUMG00000150236 | ||
| Protein | UniProt: go to UniProt's Cross Reference DB Table | |
| Expression | CleanEX: HS_MLC1 | |
| BioGPS: 23209 | ||
| Pathway | NCI Pathway Interaction Database: MLC1 | |
| KEGG: MLC1 | ||
| REACTOME: MLC1 | ||
| Pathway Commons: MLC1 | ||
| Context | iHOP: MLC1 | |
| ligand binding site mutation search in PubMed: MLC1 | ||
| UCL Cancer Institute: MLC1 | ||
| Assigned class in TissGDB* | C | |
| Included tissue-specific gene expression resources | HPA,TiGER | |
| Specific-tissues in normal samples (assigned by TissGDB using HPA, TiGER, and GTEx) | Brain | |
| Cancer types related to the specific-tissues in cancer samples (assigned by TissGDB using TCGA) | GBM,LGG | |
| Reference showing the relevant tissue of MLC1 | ||
| Description by TissGene annotations | ||
| * Class A consists of genes with literature evidence and is part of the cTissGenes. Class B consists of only cTissGenes without additional evidence. The remaining genes belong to Class C. |
| Gene ontology having evidence of Inferred from Direct Assay (IDA) from Entrez |
| GO ID | GO term | PubMed ID | GO:0032388 | positive regulation of intracellular transport | 19931615 | GO:0051259 | protein oligomerization | 15367490 | GO:0032388 | positive regulation of intracellular transport | 19931615 | GO:0051259 | protein oligomerization | 15367490 |
| Top |
| TissGeneExp for MLC1 |
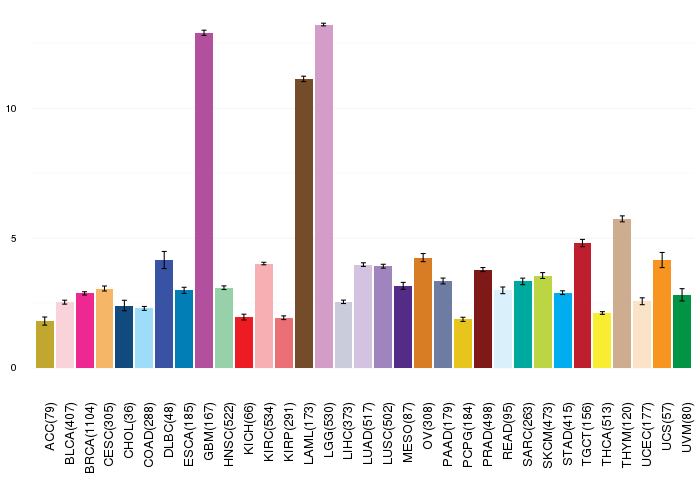
| Gene expressions across 28 cancer types (X-axis: cancer type and Y-axis: log2(norm_counts+1)) (TCGA IlluminaHiSeq_RNASeqV2, pan-cancer normalized log2(norm_counts+1) data, version 2016-08-16) |
 |
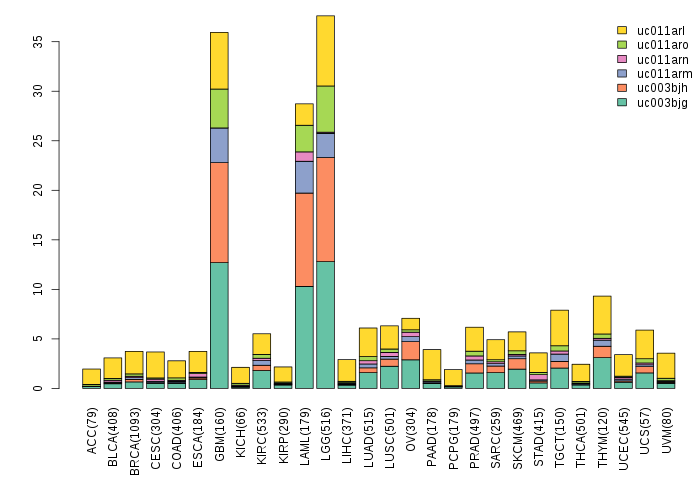
| Gene isoform expressions across 28 cancer types (X-axis: cancer type and Y-axis: log2(norm_counts+1)) (TCGA pan-cancer tcga_rsem_isoform_tpm, version 2016-09-01) |
 |
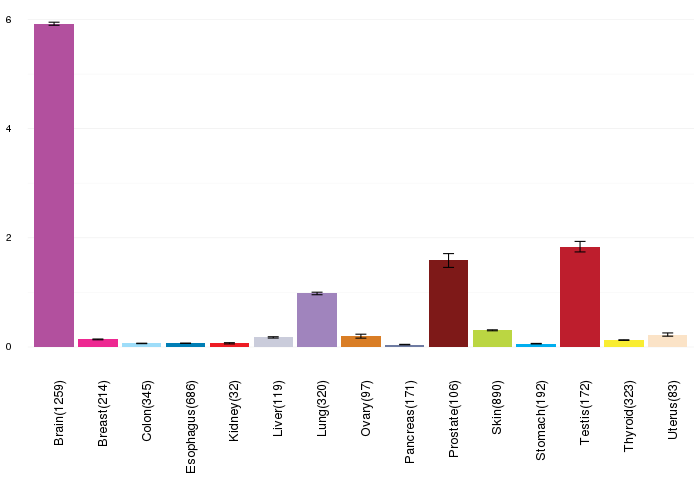
| Gene expressions across normal tissues of GTEx data (GTEx GTEx_Analysis_v6_RNA-seq_RNA-SeQCv1.1.8_gene_rpkm.gct) - Here, we shows the matched tissue types only among our 28 cancer types. |
 |
| Different expressions across 14 cancer types with more than 10 samples between matched tumors and normals (X-axis: cancer type and Y-axis: log2(norm_counts+1)) (TCGA IlluminaHiSeq_RNASeqV2, pan-cancer normalized log2(norm_counts+1) data, version 2016-08-16) |
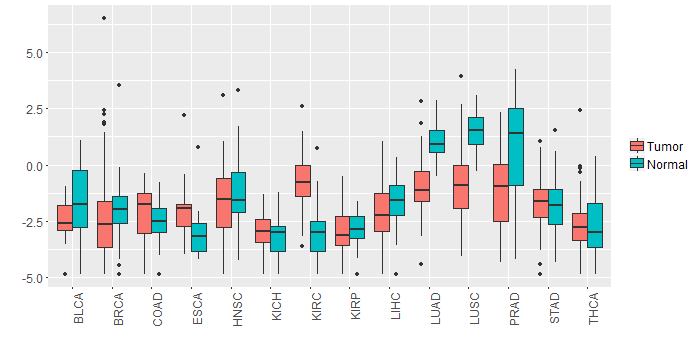 |
| - Significantly differentially expressed cancer types and information. (|Fold change|>1 and FDR<0.05) |
| Cancer type | Mean(exp) in tumor | Mean(exp) in matched normal | Log2FC | P-val. | FDR |
| KIRC | -0.755355613 | -2.992454224 | 2.237098611 | 5.38E-25 | 6.48E-24 |
| LUSC | -0.890959126 | 1.472740874 | -2.3637 | 8.58E-13 | 3.98E-12 |
| PRAD | -1.100960634 | 0.84452975 | -1.945490385 | 5.17E-06 | 3.14E-05 |
| LUAD | -0.92489273 | 1.074965891 | -1.999858621 | 9.34E-17 | 1.14E-15 |
| Top |
| TissGene-miRNA for MLC1 |
| Significantly anti-correlated miRNAs of TissGene across 28 cancer types (Gene-miRNA relations from TargetScanHuman Relsease 7.1, Conserved_Site_Context_Scores.txt.zip, 06.01.2016) (TCGA IlluminaHiSeq_miRNASeq, log2(RPM+1) data, version 2016-11-21) (TCGA IlluminaHiSeq_RNASeqV2, log2(normalized_count+1) data, version 2016-08-16) (Spearman’s Rank Correlation (p-value<0.05 and coefficient<-0.25)) |
| Cancer type | miRNA id | miRNA accession | P-val. | Coeff. | # samples |
| Top |
| TissGeneMut for MLC1 |
| TissGeneSNV for MLC1 |
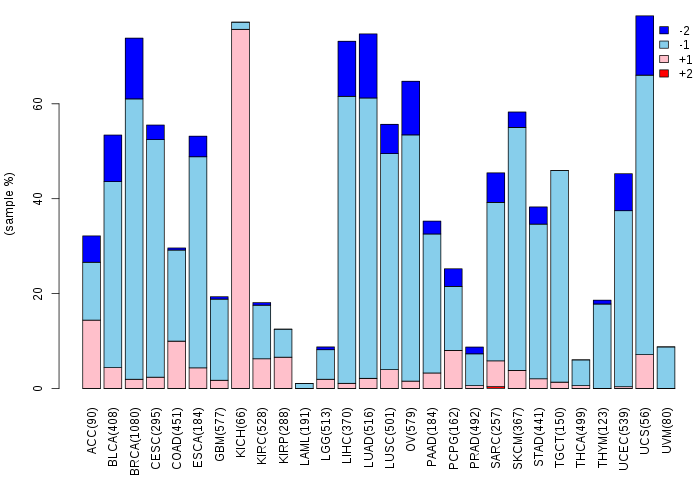
| nsSNV counts per each loci. Different colors of circles represent different cancer types. Circle size denotes number of samples. (TCGA somatic mutation (SNPs and small INDELs) data, version 2016-04-25) * Click on the image to enlarge it in a new window. |
 |
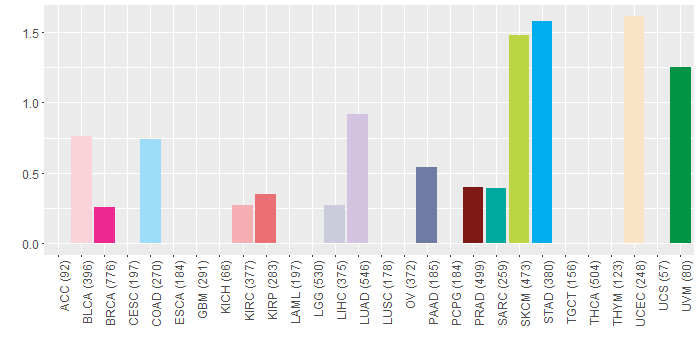
| Somatic nucleotide variants of TissGene across 28 cancer types (X-axis: cancer type and Y-axis: % of mutated samples) The numbers in parentheses are numbers of samples with mutation (nsSNVs). (TCGA somatic mutation (SNPs and small INDELs) data, version 2016-04-25) |
 |
| - nsSNVs sorted by frequency. |
| AAchange | Cancer type | # samples |
| p.S69L | SKCM | 2 |
| p.N110T | BLCA | 1 |
| p.K175E | LUAD | 1 |
| p.H227R | STAD | 1 |
| p.P44L | LUAD | 1 |
| p.W368X | SKCM | 1 |
| p.R349C | PAAD | 1 |
| p.A86D | STAD | 1 |
| p.T320M | READ | 1 |
| p.P346L | PRAD | 1 |
| p.A11T | STAD | 1 |
| p.R14Q | STAD | 1 |
| p.A139G | LUAD | 1 |
| p.F129S | BRCA | 1 |
| p.A192V | STAD | 1 |
| p.R165W | UVM | 1 |
| p.I283L | LIHC | 1 |
| p.V210I | UCEC | 1 |
| p.P77L | DLBC | 1 |
| p.G212A | COAD | 1 |
| p.L133P | SARC | 1 |
| p.E169K | SKCM | 1 |
| p.I264M | BLCA | 1 |
| p.G337S | LUAD | 1 |
| p.K330E | KIRP | 1 |
| p.A238V | PRAD | 1 |
| p.R22W | SKCM | 1 |
| p.P358L | SKCM | 1 |
| p.S55Y | UCEC | 1 |
| p.S276C | LUAD | 1 |
| p.N344S | COAD | 1 |
| p.T124M | UCEC | 1 |
| p.D302N | SKCM | 1 |
| p.N104K | KIRC | 1 |
| p.M289K | STAD | 1 |
| p.P45S | UCEC | 1 |
| p.S208C | BRCA | 1 |
| p.W368* | SKCM | 1 |
| p.S208C | BLCA | 1 |
| Top |
| TissGeneCNV for MLC1 |
| Copy number variations of TissGene across 28 cancer types (X-axis: cancer type and Y-axis: % of CNV samples) (TCGA Gistic2_CopyNumber_Gistic2_all_data_by_genes, Gistic2 copy number data, version 2016-08-16) |
 |
| Top |
| TissGeneFusions for MLC1 |
| Fusion genes including TissGene (ChimerDB 3.0, 2016-12-01 and TCGA fusion Portal 2015-12-01) |
| Database | Src | Cancer type | Sample | Fusion gene | ORF | 5'-gene BP | 3'-gene BP |
| Chimerdb3.0 | ChiTaRs | NA | DA297249 | PRDX5-MLC1 | chr11:64088235 | chr22:50521515 | |
| TCGAfusionPortal | PRADA | LUAD | TCGA-44-7660-01A | BRD1-MLC1 | CDS-5UTR | Chr22:50187682 | Chr22:50523390 |
| Top |
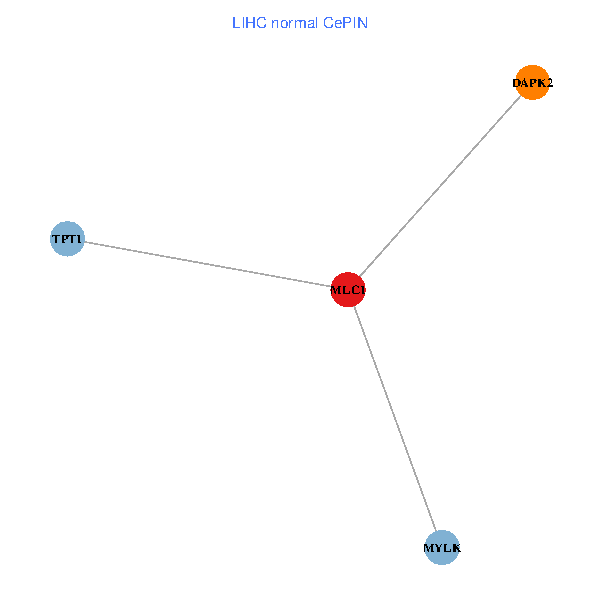
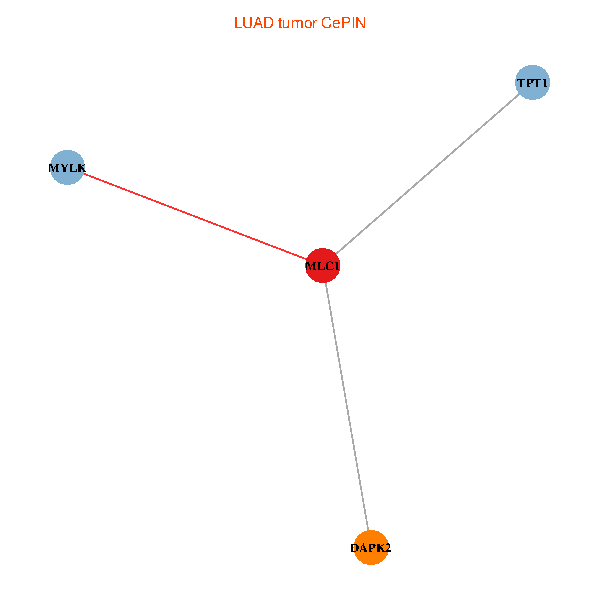
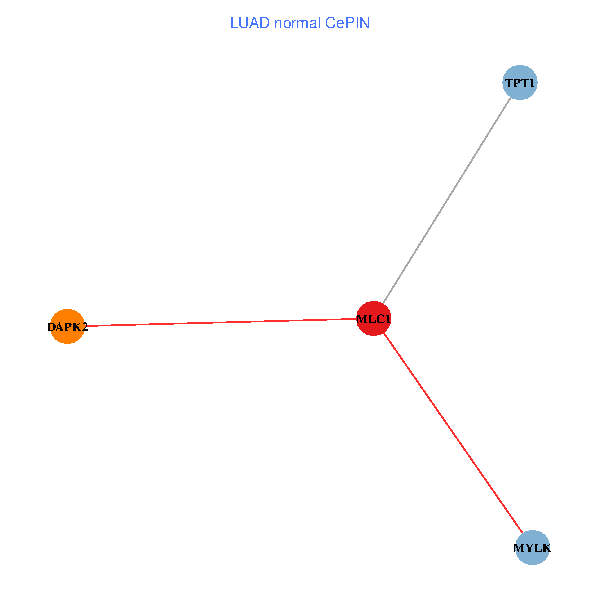
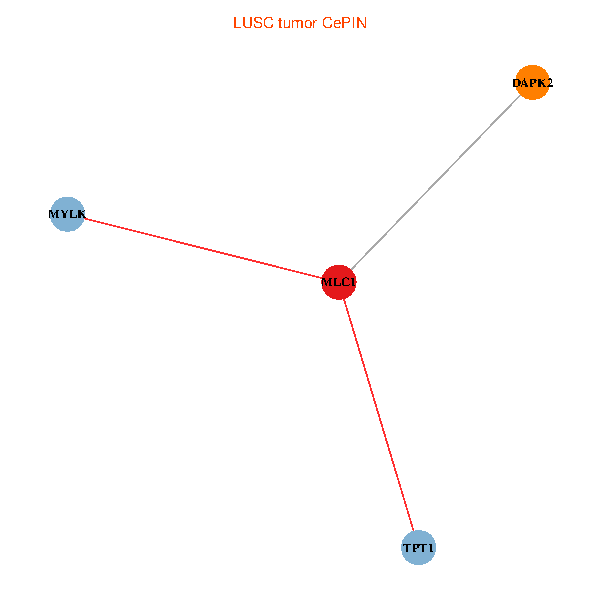
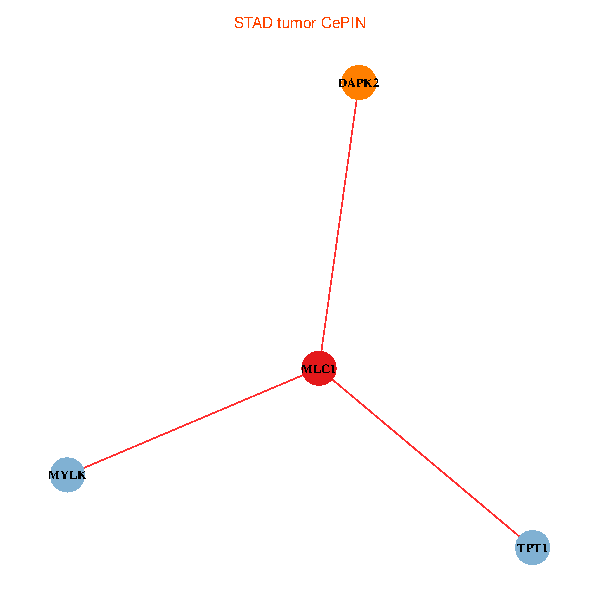
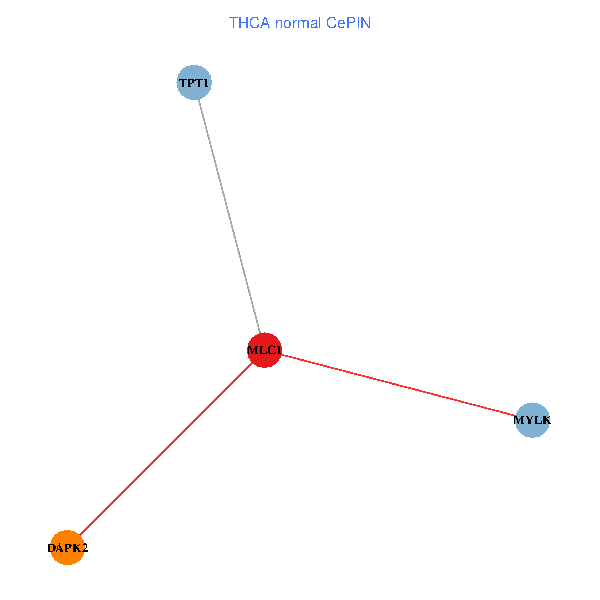
| TissGeneNet for MLC1 |
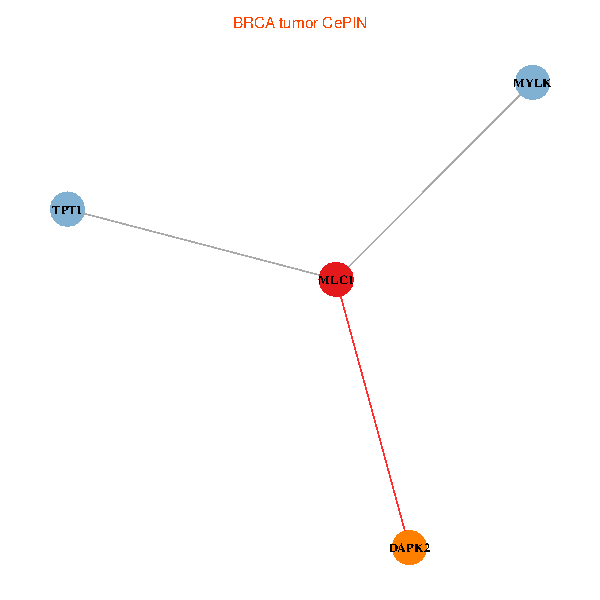
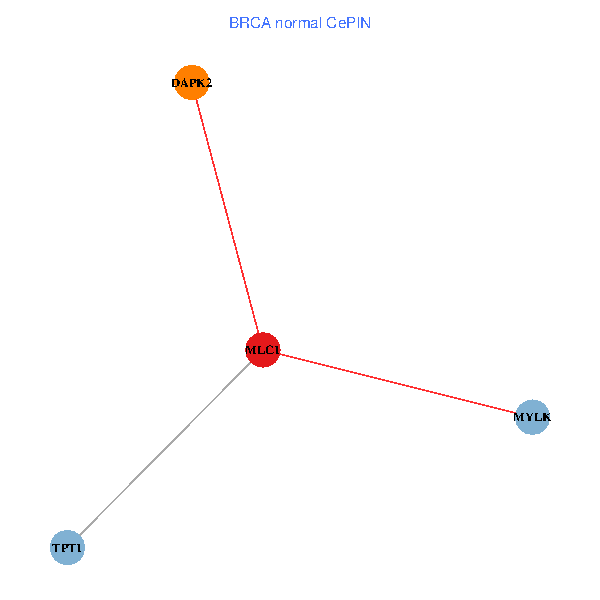
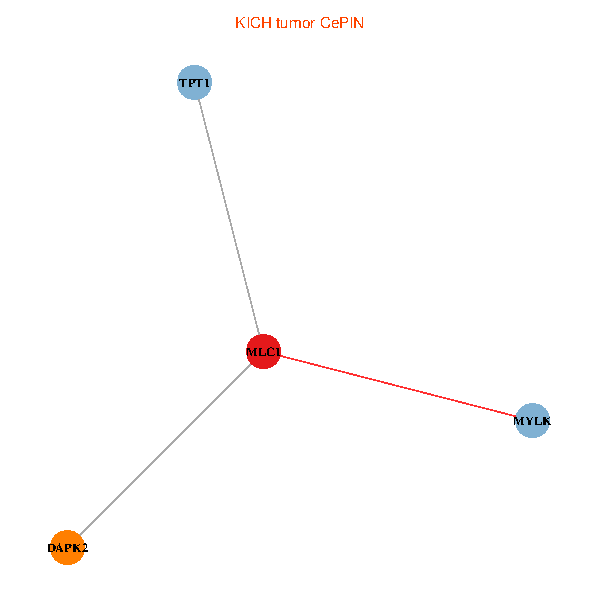
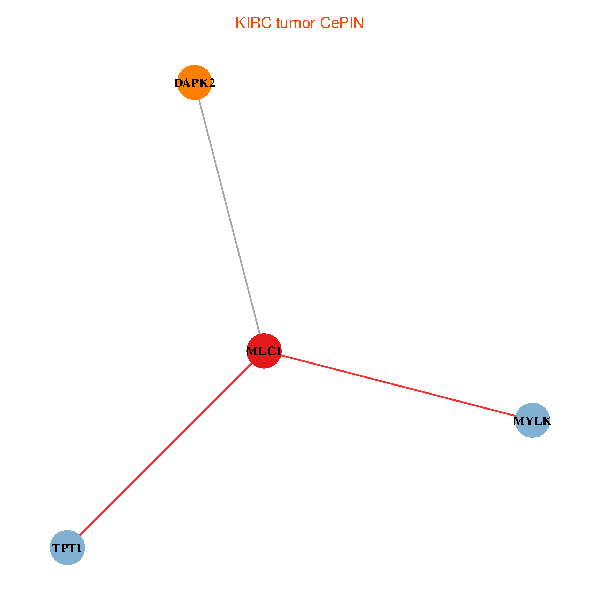
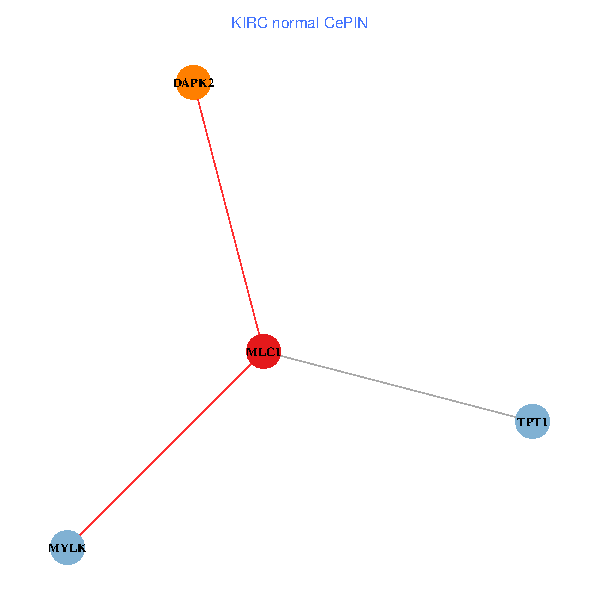
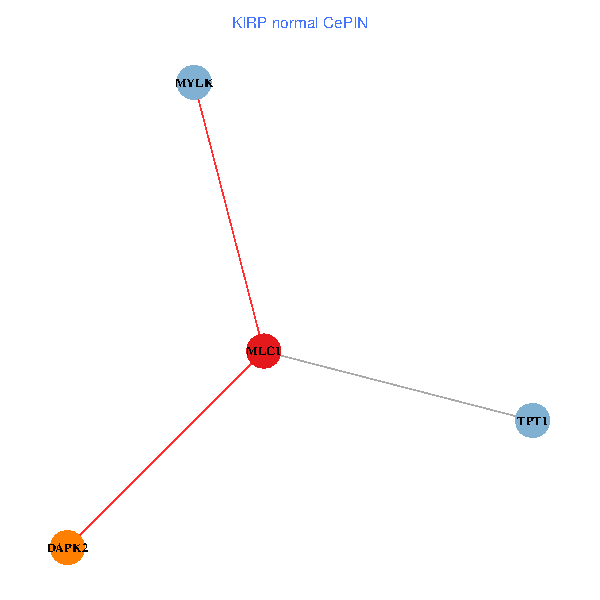
| Co-expressed gene networks based on protein-protein interaction data (CePIN) (TCGA IlluminaHiSeq_RNASeqV2, pan-cancer normalized log2(norm_counts+1) data, version 2016-08-16) (PINA2 ppi data) |
| BRCA (tumor) | BRCA (normal) |
| MLC1, TPT1, MYLK, DAPK2 (tumor) | MLC1, TPT1, MYLK, DAPK2 (normal) |
 |  |
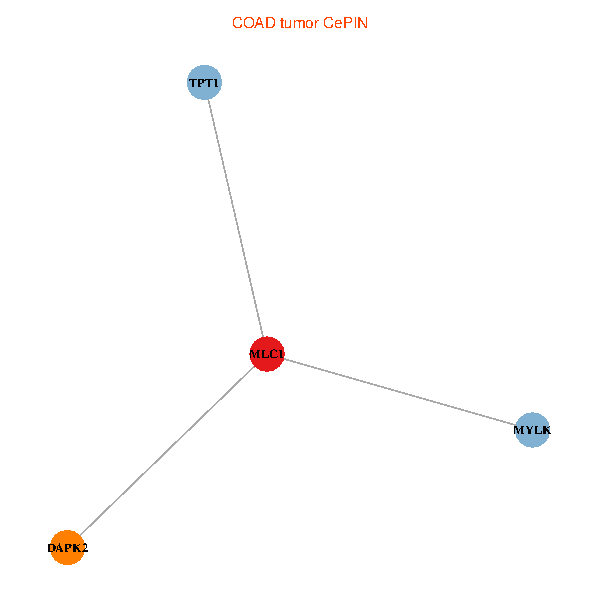
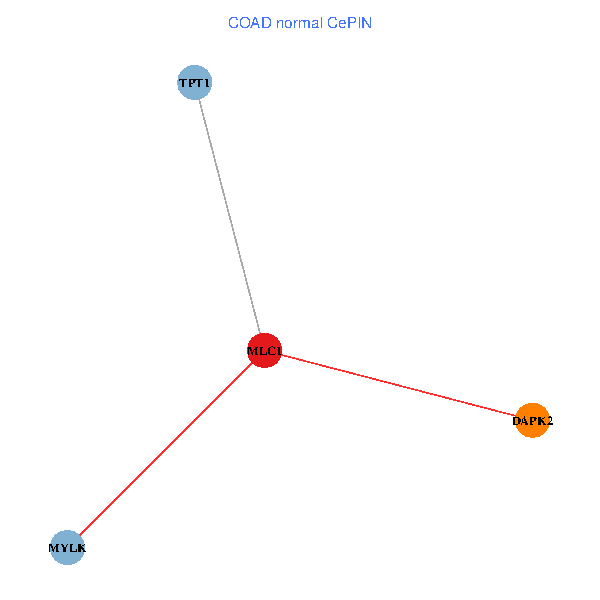
| COAD (tumor) | COAD (normal) |
| MLC1, TPT1, MYLK, DAPK2 (tumor) | MLC1, TPT1, MYLK, DAPK2 (normal) |
 |  |
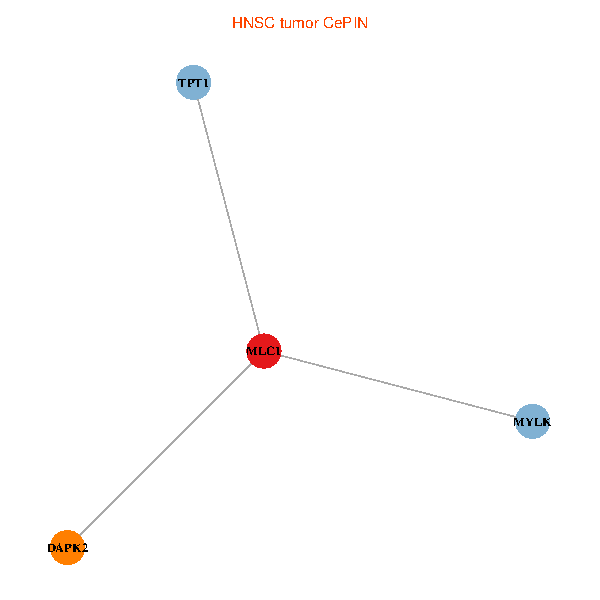
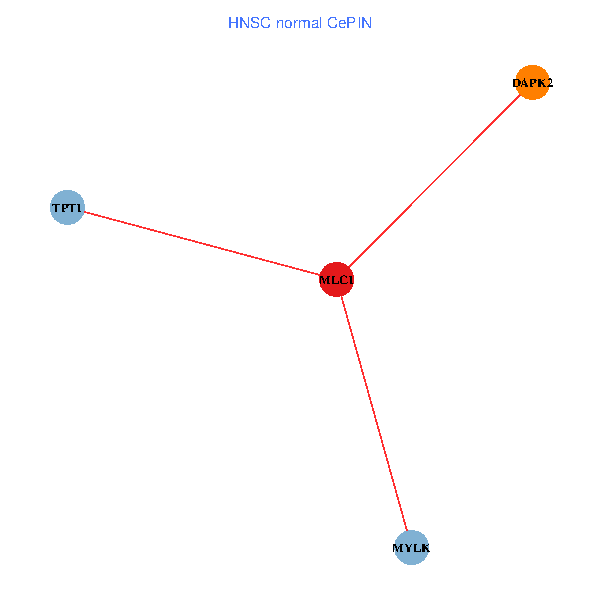
| HNSC (tumor) | HNSC (normal) |
| MLC1, TPT1, MYLK, DAPK2 (tumor) | MLC1, TPT1, MYLK, DAPK2 (normal) |
 |  |
| KICH (tumor) | KICH (normal) |
| MLC1, TPT1, MYLK, DAPK2 (tumor) | MLC1, TPT1, MYLK, DAPK2 (normal) |
 |  |
| KIRC (tumor) | KIRC (normal) |
| MLC1, TPT1, MYLK, DAPK2 (tumor) | MLC1, TPT1, MYLK, DAPK2 (normal) |
 |  |
| KIRP (tumor) | KIRP (normal) |
| MLC1, TPT1, MYLK, DAPK2 (tumor) | MLC1, TPT1, MYLK, DAPK2 (normal) |
 |  |
| LIHC (tumor) | LIHC (normal) |
| MLC1, TPT1, MYLK, DAPK2 (tumor) | MLC1, TPT1, MYLK, DAPK2 (normal) |
 |  |
| LUAD (tumor) | LUAD (normal) |
| MLC1, TPT1, MYLK, DAPK2 (tumor) | MLC1, TPT1, MYLK, DAPK2 (normal) |
 |  |
| LUSC (tumor) | LUSC (normal) |
| MLC1, TPT1, MYLK, DAPK2 (tumor) | MLC1, TPT1, MYLK, DAPK2 (normal) |
 |  |
| PRAD (tumor) | PRAD (normal) |
| MLC1, TPT1, MYLK, DAPK2 (tumor) | MLC1, TPT1, MYLK, DAPK2 (normal) |
 |  |
| STAD (tumor) | STAD (normal) |
| MLC1, TPT1, MYLK, DAPK2 (tumor) | MLC1, TPT1, MYLK, DAPK2 (normal) |
 |  |
| THCA (tumor) | THCA (normal) |
| MLC1, TPT1, MYLK, DAPK2 (tumor) | MLC1, TPT1, MYLK, DAPK2 (normal) |
 |  |
| Top |
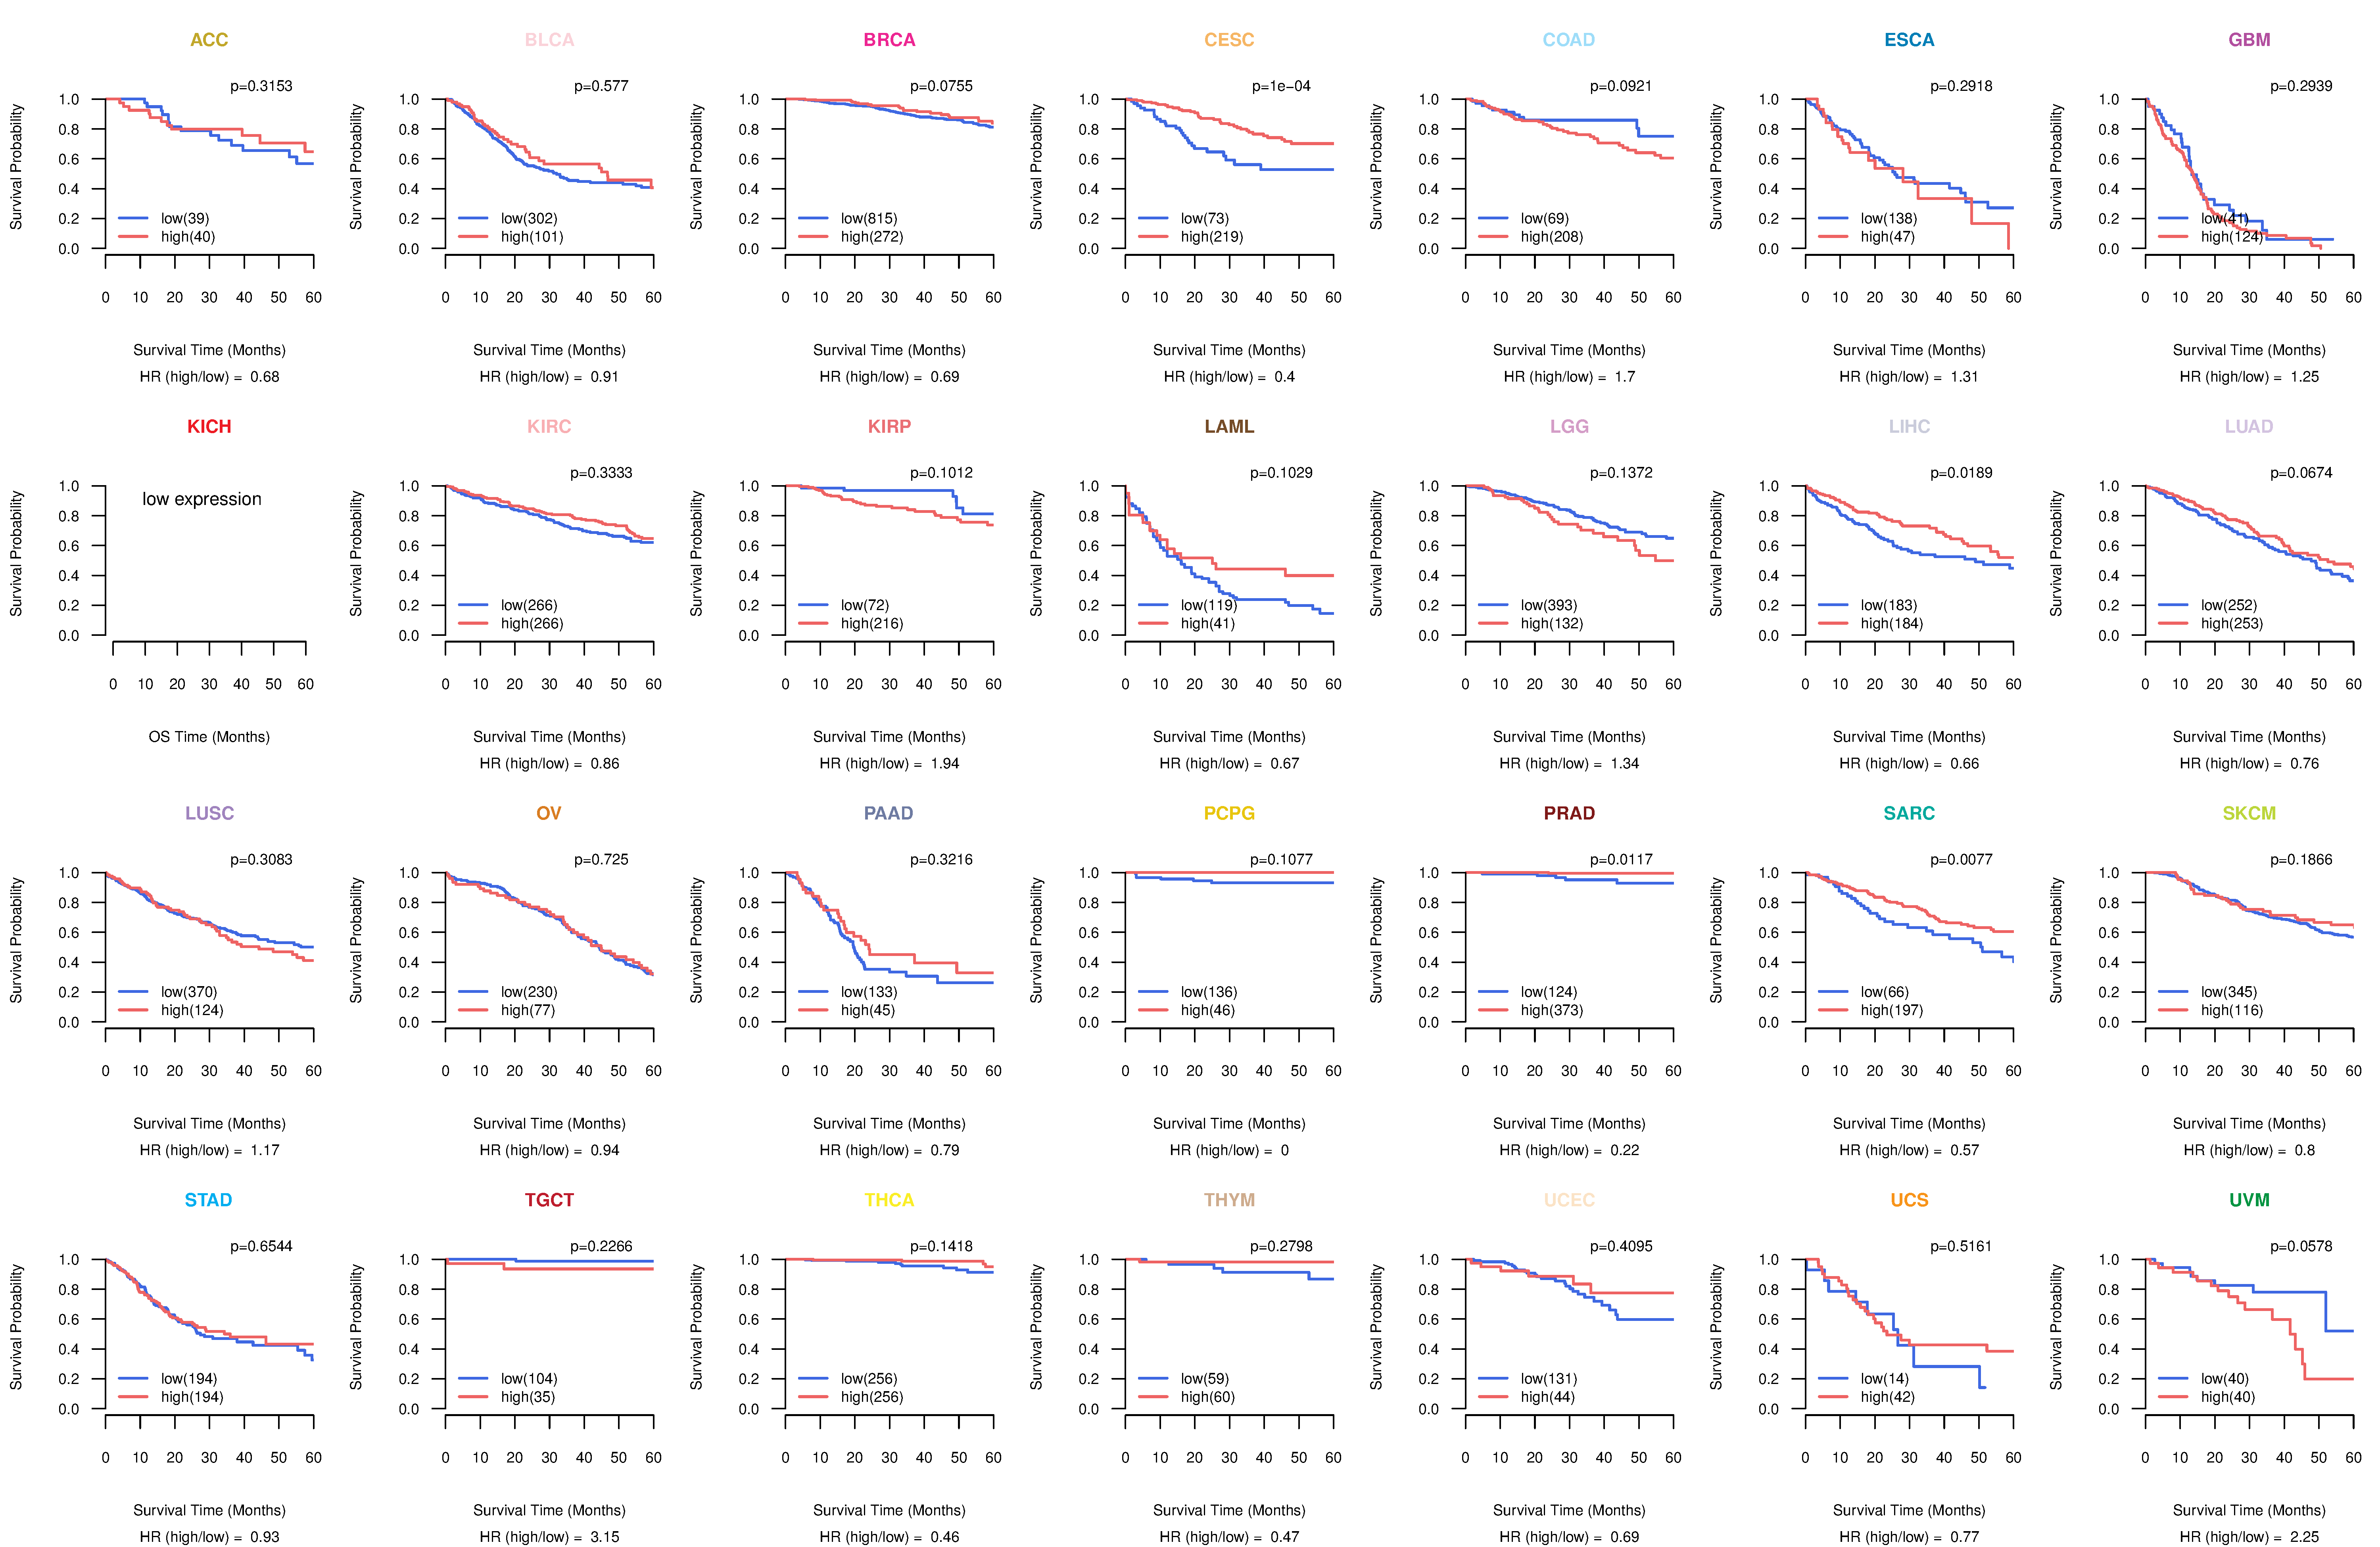
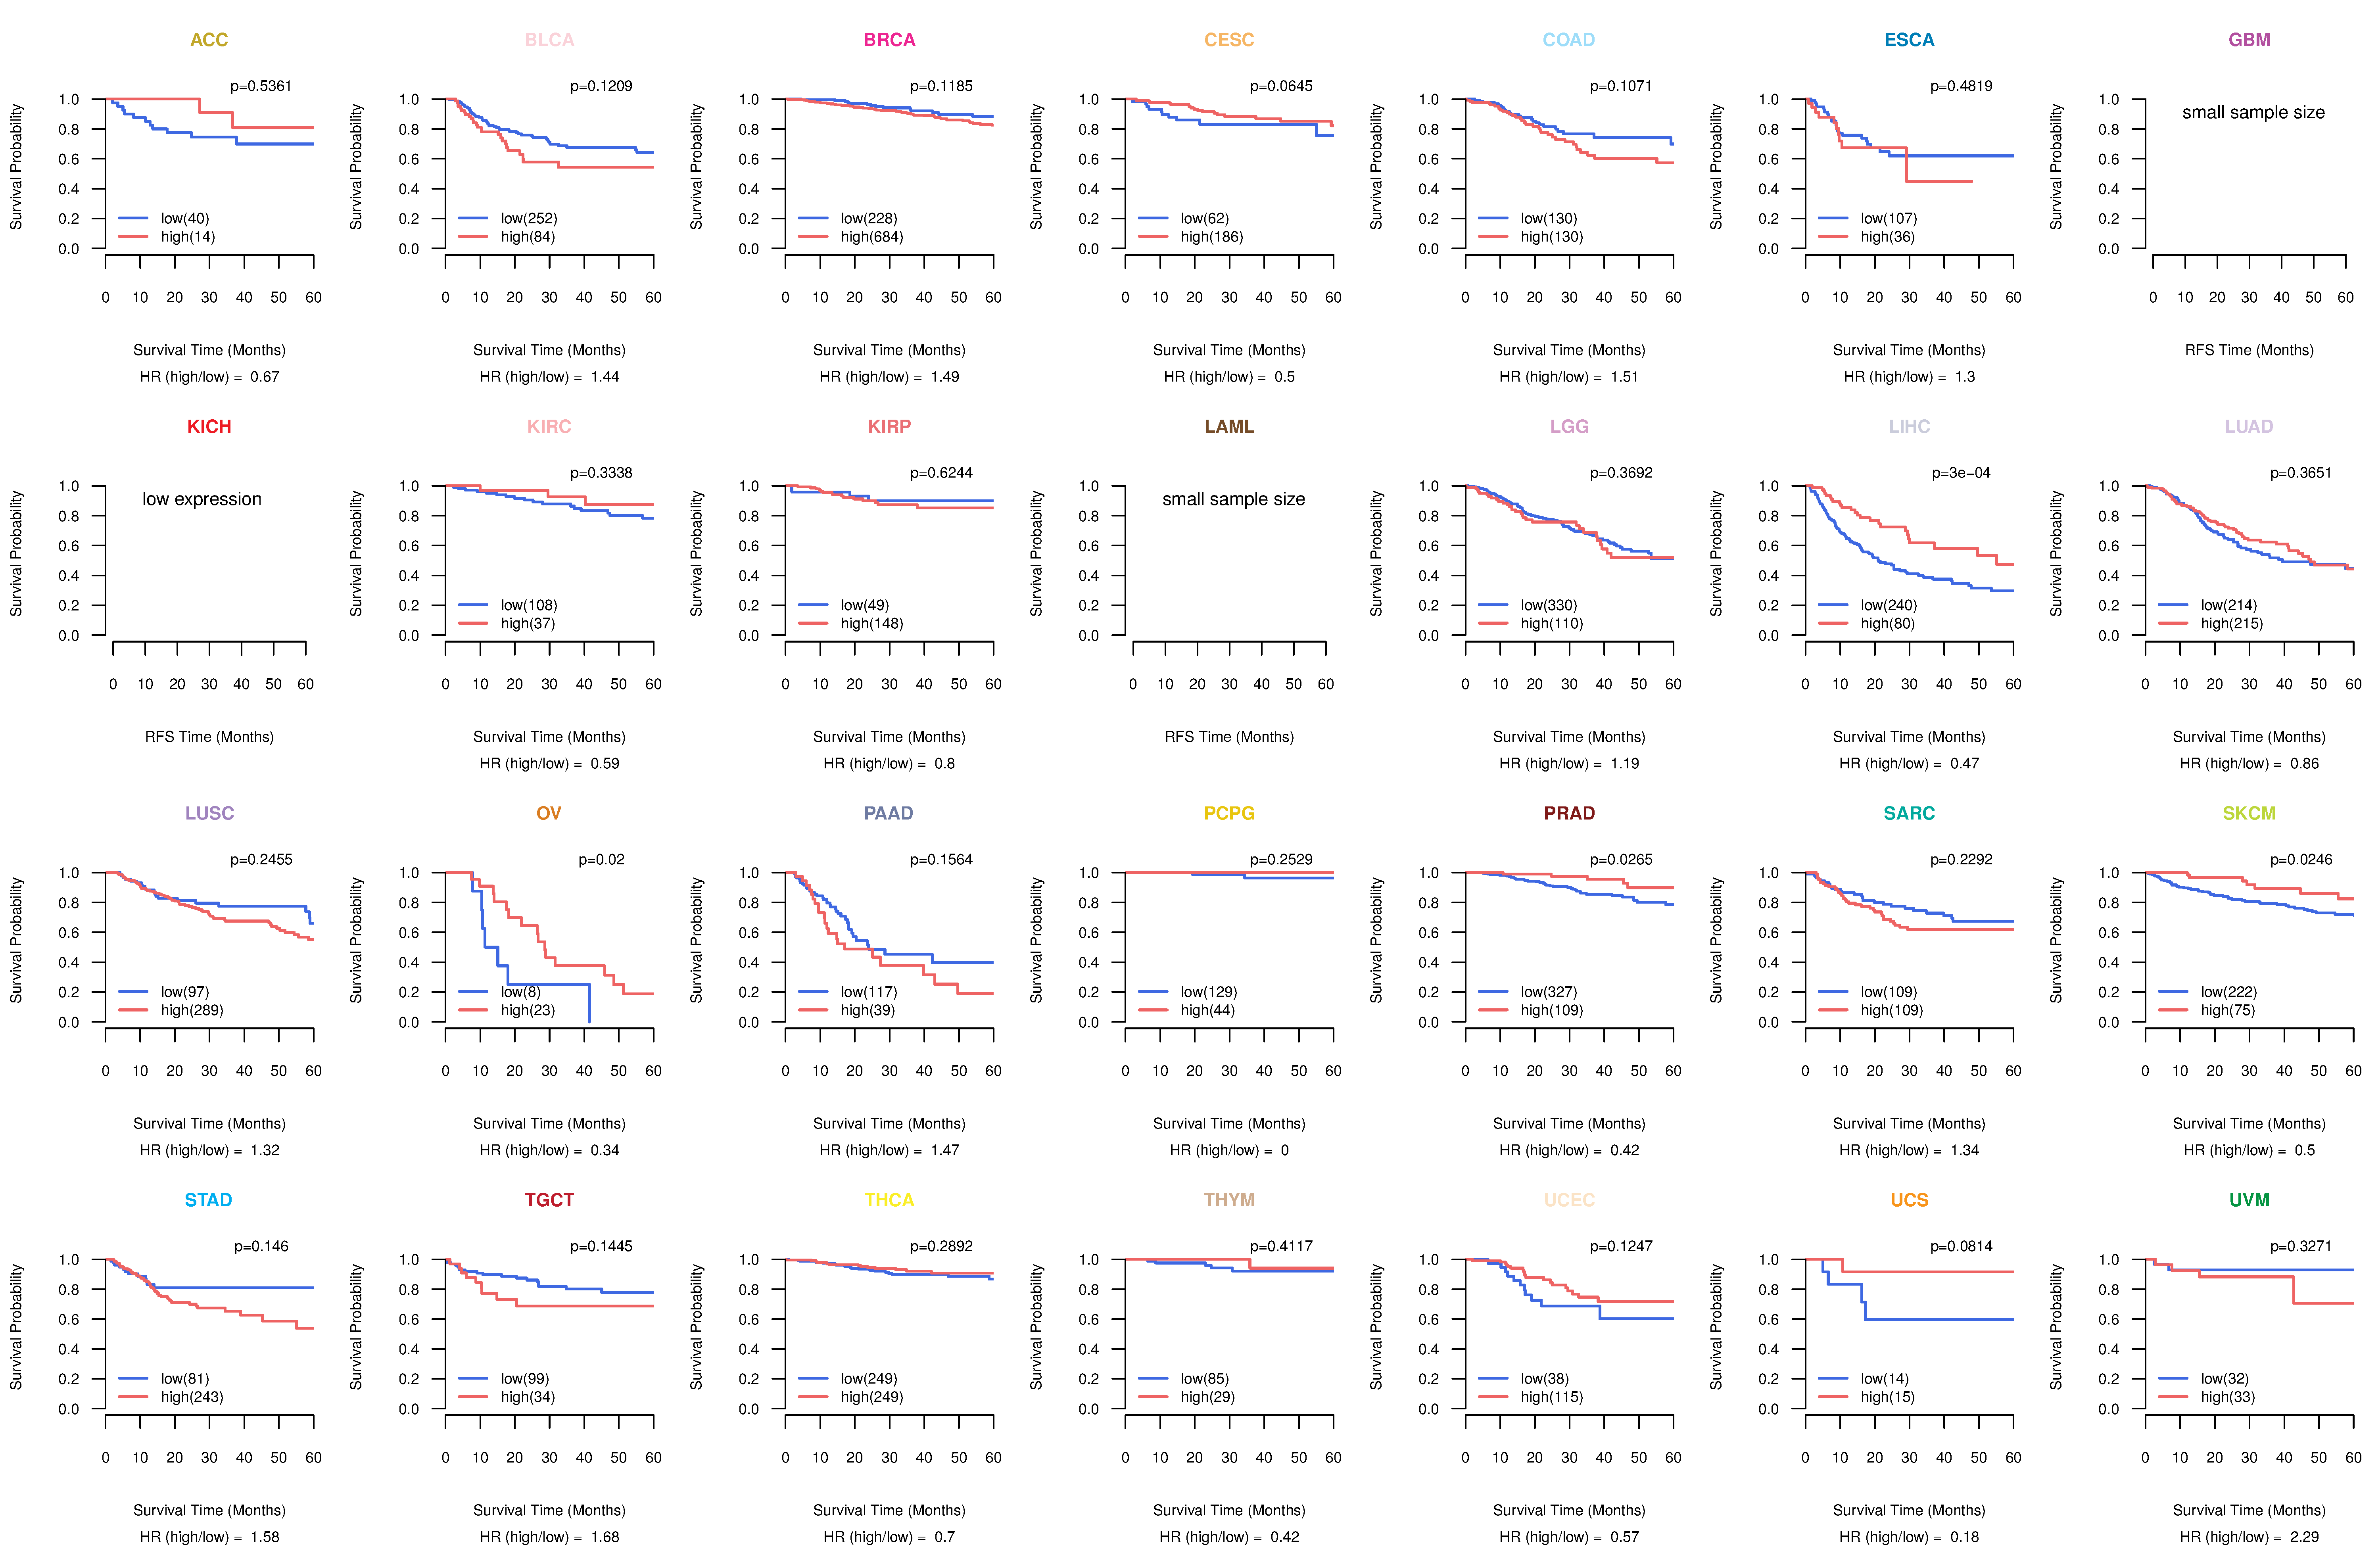
| TissGeneProg for MLC1 |
| Kaplan-Meier plots with logrank tests of overall survival (OS) using 28 cancer types (TCGA IlluminaHiSeq_RNASeqV2, pan-cancer normalized log2(norm_counts+1) data, version 2016-08-16) (TCGA clinicalMatrix, phenotype data, version 2016-04-27) * Click on the image to enlarge it in a new window. |
 |
| Kaplan-Meier plots with logrank test of relapse free survival (RFS) using 28 cancer types (TCGA IlluminaHiSeq_RNASeqV2, pan-cancer normalized log2(norm_counts+1) data, version 2016-08-16) (TCGA clinicalMatrix, phenotype data, version 2016-04-27) * Click on the image enlarge it in a new window. |
 |
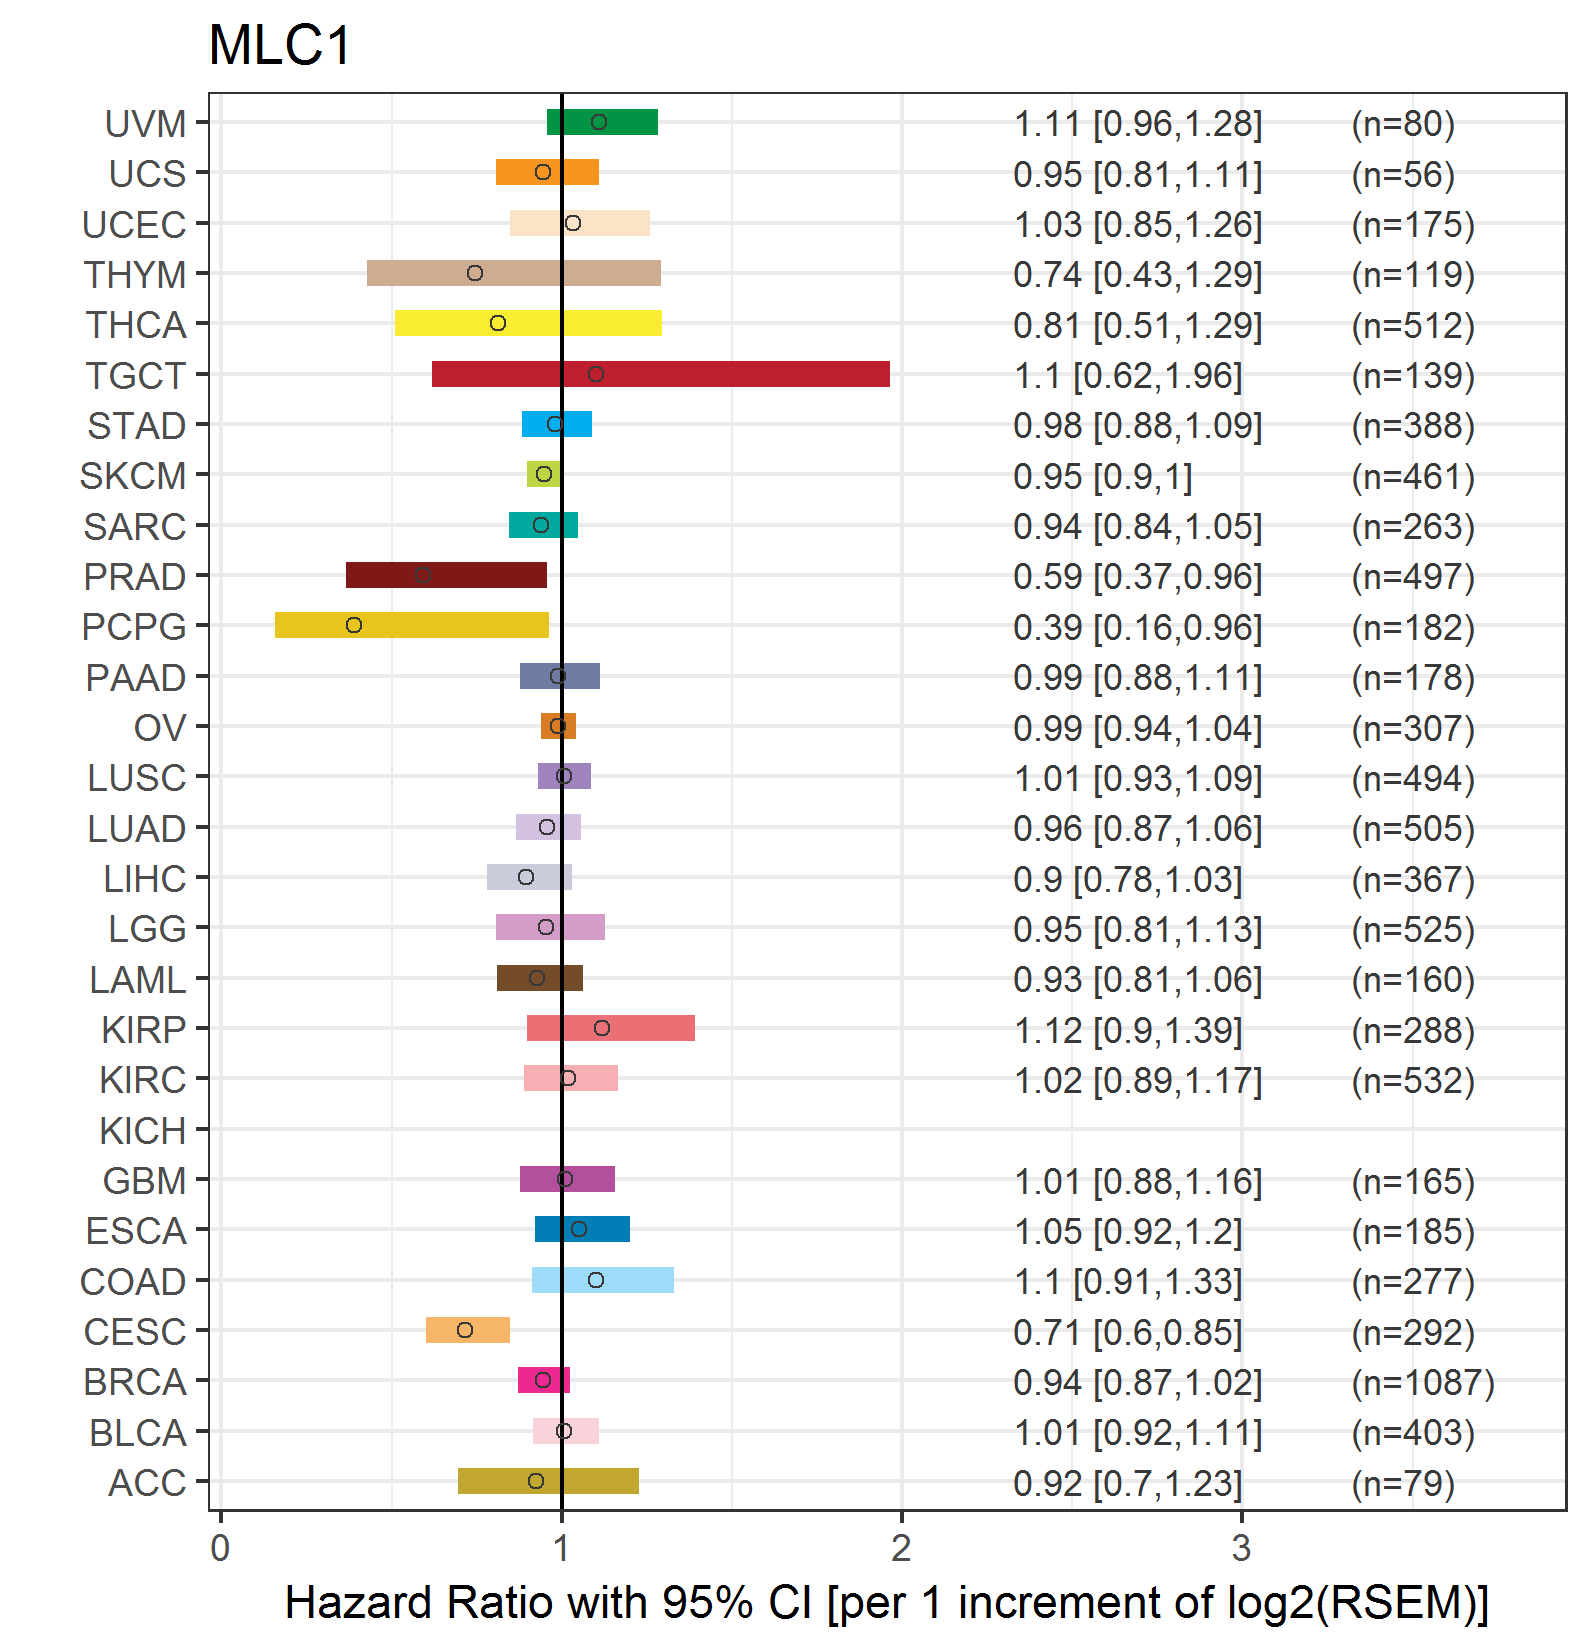
| Forest plot of Cox proportional hazard ratio (HR) and 95% CI of overall survival (OS) using 28 cancer types (TCGA IlluminaHiSeq_RNASeqV2, pan-cancer normalized log2(norm_counts+1) data, version 2016-08-16) (TCGA clinicalMatrix, phenotype data, version 2016-04-27) * Click on the image enlarge it in a new window. |
 |
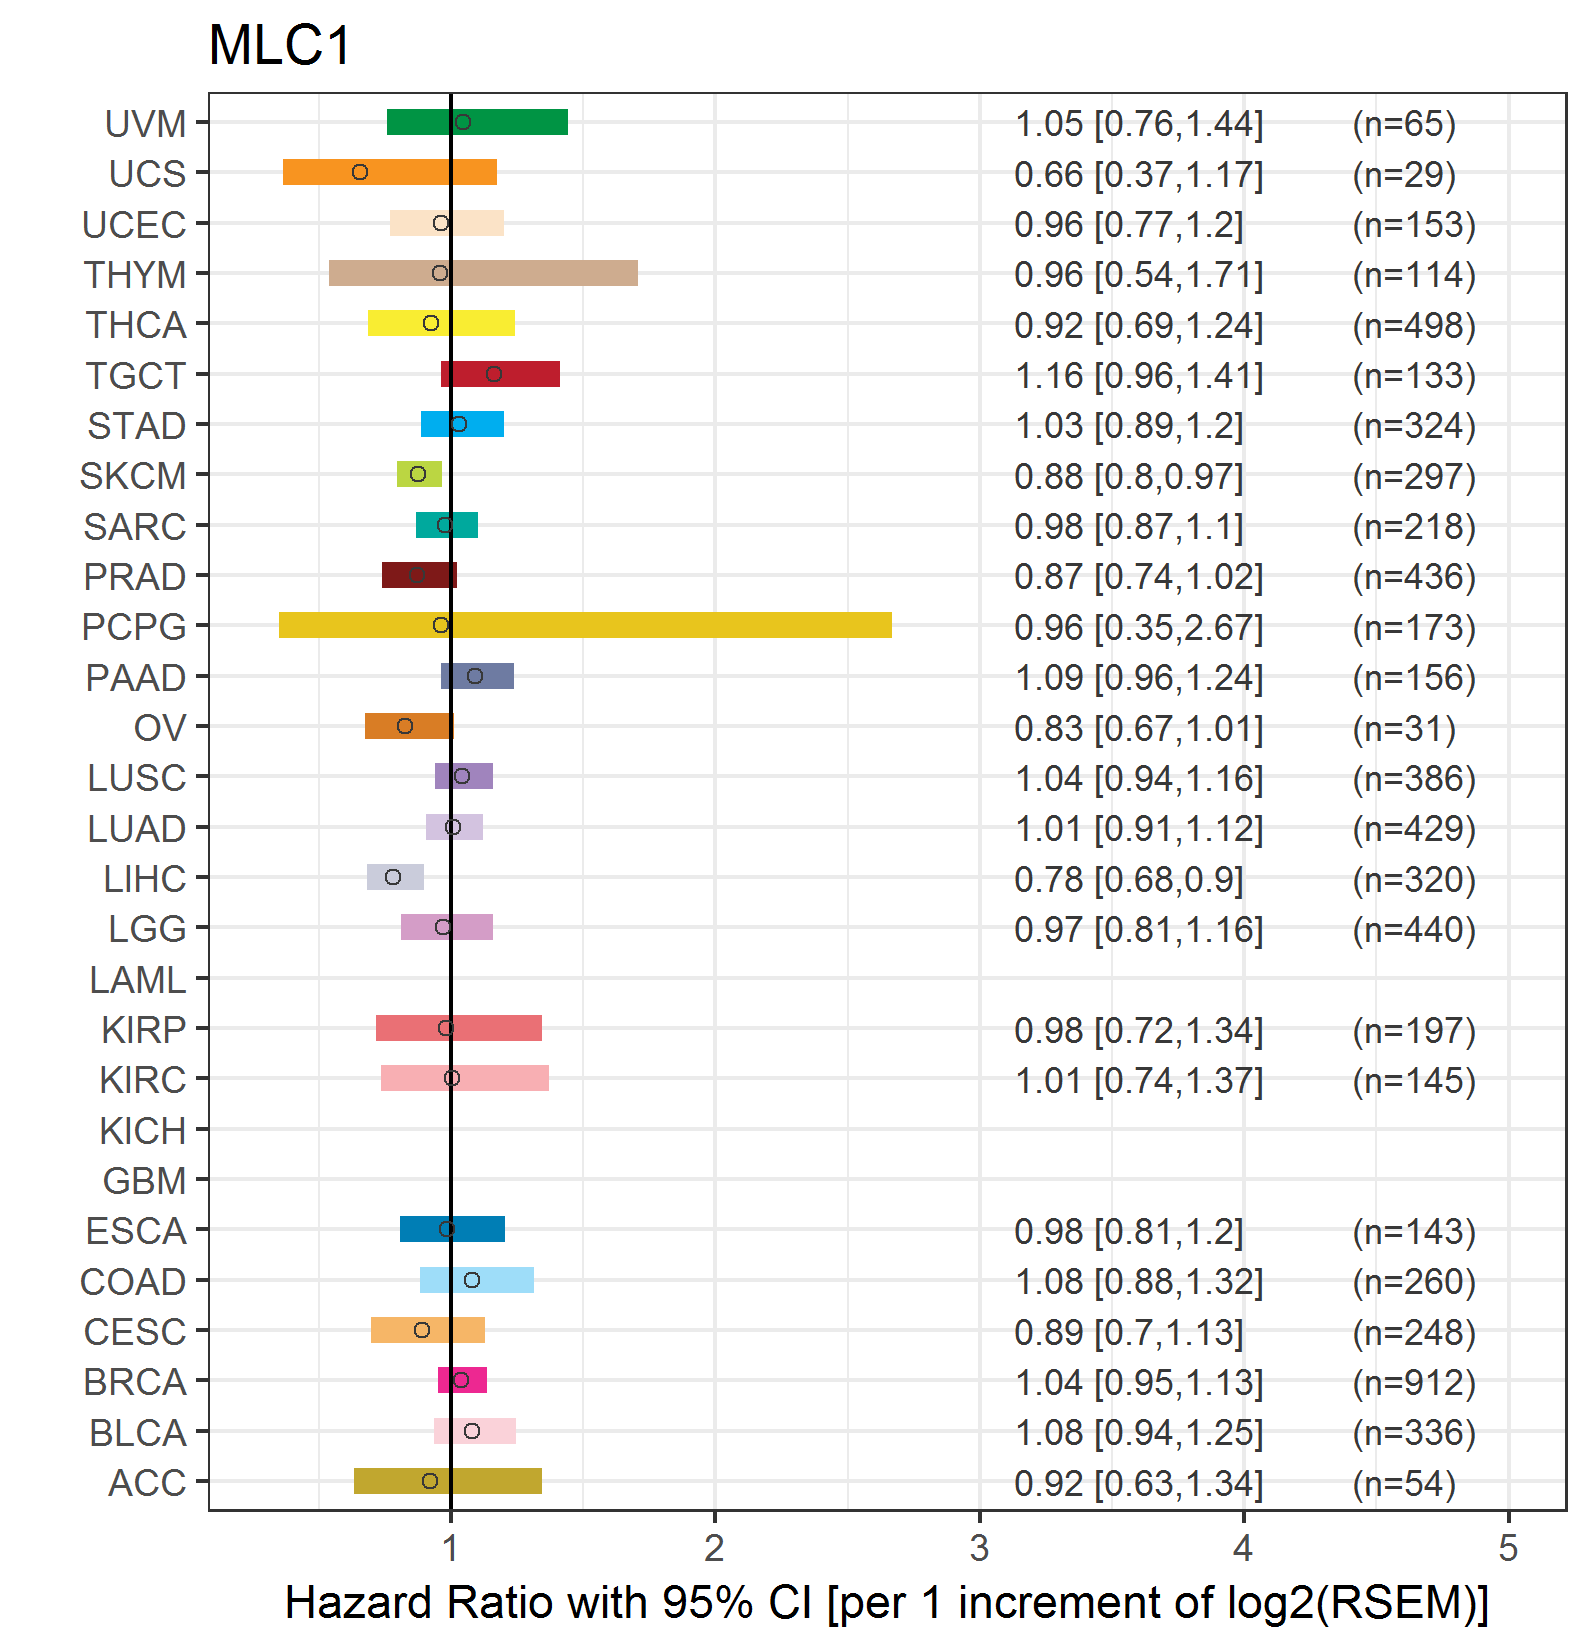
| Forest plot of Cox proportional hazard ratio (HR) and 95% CI of relapse free survival (RFS) using 28 cancer types (TCGA IlluminaHiSeq_RNASeqV2, pan-cancer normalized log2(norm_counts+1) data, version 2016-08-16) (TCGA clinicalMatrix, phenotype data, version 2016-04-27) * Click on the image enlarge it in a new window. |
 |
| Top |
| TissGeneClin for MLC1 |
| TissGeneDrug for MLC1 |
| Drug information targeting TissGene (DrugBank Version 5.0.6, 2017-04-01) |
| DrugBank ID | Drug name | Drug activity | Drug type | Drug status |
| Top |
| TissGeneDisease for MLC1 |
| Disease information associated with TissGene (DisGeNet, 2016-06-01) |
| Disease ID | Disease name | # pubmeds | Source |
| umls:C1858854 | MEGALENCEPHALIC LEUKOENCEPHALOPATHY WITH SUBCORTICAL CYSTS | 33 | BeFree,CLINVAR,CTD_human,ORPHANET,UNIPROT |
| umls:C0010709 | Cyst | 6 | BeFree,LHGDN |
| umls:C0036341 | Schizophrenia | 6 | BeFree,GAD,LHGDN |
| umls:C0007398 | Catatonia | 4 | BeFree |
| umls:C0036344 | Schizophrenia, Catatonic | 4 | BeFree |
| umls:C0221355 | Macrocephaly | 4 | BeFree |
| umls:C0270612 | Leukoencephalopathies | 4 | BeFree |
| umls:C0023520 | Leukodystrophy | 3 | BeFree |
| umls:C0005586 | Bipolar Disorder | 2 | BeFree,GAD |
| umls:C0020538 | Hypertensive disease | 2 | BeFree |
| umls:C0023467 | Leukemia, Myelocytic, Acute | 2 | BeFree |
| umls:C0149721 | Left Ventricular Hypertrophy | 2 | BeFree |
| umls:C2239176 | Liver carcinoma | 2 | BeFree,LHGDN |
| umls:C2720434 | Macroencephaly | 2 | BeFree |
| umls:C0003507 | Aortic Valve Stenosis | 1 | BeFree |
| umls:C0004114 | Astrocytoma | 1 | BeFree |
| umls:C0006142 | Malignant neoplasm of breast | 1 | BeFree |
| umls:C0010606 | Adenoid Cystic Carcinoma | 1 | CTD_human |
| umls:C0022116 | Ischemia | 1 | BeFree |
| umls:C0026946 | Mycoses | 1 | BeFree |
| umls:C0027022 | Myeloproliferative disease | 1 | BeFree |
| umls:C0036095 | Salivary Gland Neoplasms | 1 | CTD_human |
| umls:C0085669 | Acute leukemia | 1 | BeFree |
| umls:C0221765 | Chronic schizophrenia | 1 | BeFree |
| umls:C0376545 | Hematologic Neoplasms | 1 | BeFree |
| umls:C0596992 | myelinopathy | 1 | BeFree |
| umls:C0678222 | Breast Carcinoma | 1 | BeFree |
| umls:C1527311 | Brain Edema | 1 | BeFree |
| umls:C1654637 | androgen independent prostate cancer | 1 | BeFree |
| umls:C1883018 | Severe Aplastic Anemia | 1 | BeFree |
|
Copyright 2016-Present - The University of Texas Health Science Center at Houston (UTHealth) Web File Viewing | How to Report, Fraud, Waste and Abuse | State of Texas | Statewide Search | Texas Homeland Security | Site Policies |