 |
| |
| |
| |
| |
| |
| |
|

| TissGeneSummary for FMO1 |
 Gene summary Gene summary |
| Basic gene information | Gene symbol | FMO1 |
| Gene name | flavin containing monooxygenase 1 | |
| Synonyms | - | |
| Cytomap | UCSC genome browser: 1q24.3 | |
| Type of gene | protein-coding | |
| RefGenes | NM_001282692.1, NM_001282693.1,NM_001282694.1,NM_002021.2, | |
| Description | FMO 1Flavin-containing monooxygenase 1 (fetal liver)dimethylaniline monooxygenase [N-oxide-forming] 1dimethylaniline oxidase 1fetal hepatic flavin-containing monooxygenase 1 | |
| Modification date | 20141207 | |
| dbXrefs | MIM : 136130 | |
| HGNC : HGNC | ||
| Ensembl : ENSG00000010932 | ||
| HPRD : 00631 | ||
| Vega : OTTHUMG00000035502 | ||
| Protein | UniProt: go to UniProt's Cross Reference DB Table | |
| Expression | CleanEX: HS_FMO1 | |
| BioGPS: 2326 | ||
| Pathway | NCI Pathway Interaction Database: FMO1 | |
| KEGG: FMO1 | ||
| REACTOME: FMO1 | ||
| Pathway Commons: FMO1 | ||
| Context | iHOP: FMO1 | |
| ligand binding site mutation search in PubMed: FMO1 | ||
| UCL Cancer Institute: FMO1 | ||
| Assigned class in TissGDB* | A | |
| Included tissue-specific gene expression resources | HPA,TiGER,GTEx | |
| Specific-tissues in normal samples (assigned by TissGDB using HPA, TiGER, and GTEx) | Kidney | |
| Cancer types related to the specific-tissues in cancer samples (assigned by TissGDB using TCGA) | KIRC,KIRP,KICH | |
| Reference showing the relevant tissue of FMO1 | Hepatocyte nuclear factors 4α and 1α regulate kidney developmental expression of drug-metabolizing enzymes and drug transporters. Martovetsky G, Tee JB, Nigam SK. Mol Pharmacol. 2013 Dec;84(6):808-23. doi: 10.1124/mol.113.088229. Epub 2013 Sep 13. (pmid:24038112) go to article | |
| Description by TissGene annotations | ||
| * Class A consists of genes with literature evidence and is part of the cTissGenes. Class B consists of only cTissGenes without additional evidence. The remaining genes belong to Class C. |
| Gene ontology having evidence of Inferred from Direct Assay (IDA) from Entrez |
| GO ID | GO term | PubMed ID | GO:0006082 | organic acid metabolic process | 15144220 | GO:0009404 | toxin metabolic process | 15144220 | GO:0070995 | NADPH oxidation | 15144220 | GO:0006082 | organic acid metabolic process | 15144220 | GO:0009404 | toxin metabolic process | 15144220 | GO:0070995 | NADPH oxidation | 15144220 |
| Top |
| TissGeneExp for FMO1 |
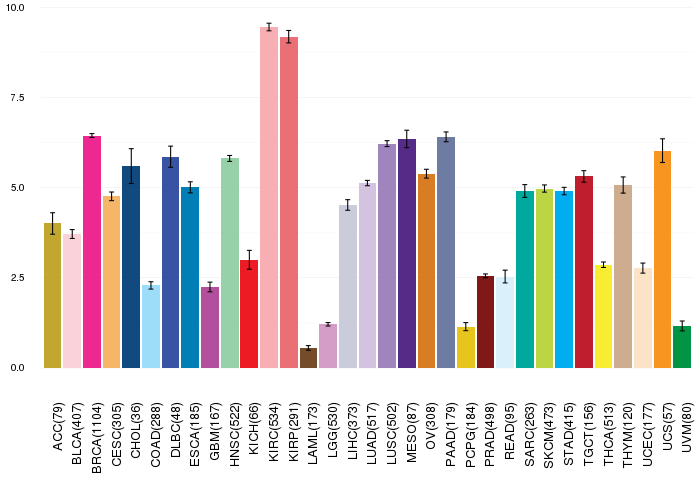
| Gene expressions across 28 cancer types (X-axis: cancer type and Y-axis: log2(norm_counts+1)) (TCGA IlluminaHiSeq_RNASeqV2, pan-cancer normalized log2(norm_counts+1) data, version 2016-08-16) |
 |
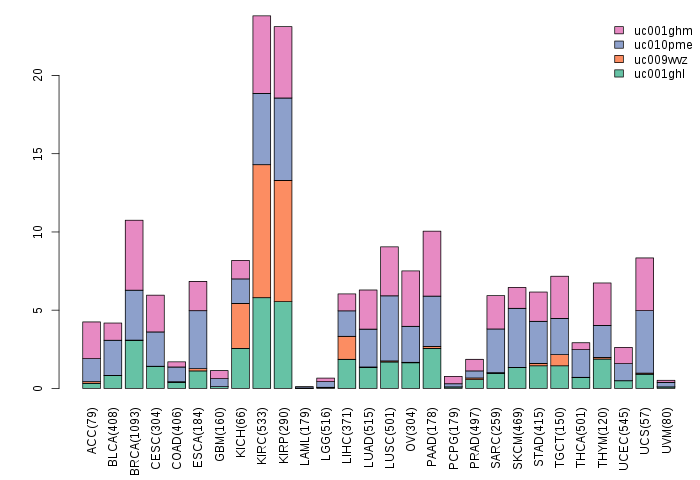
| Gene isoform expressions across 28 cancer types (X-axis: cancer type and Y-axis: log2(norm_counts+1)) (TCGA pan-cancer tcga_rsem_isoform_tpm, version 2016-09-01) |
 |
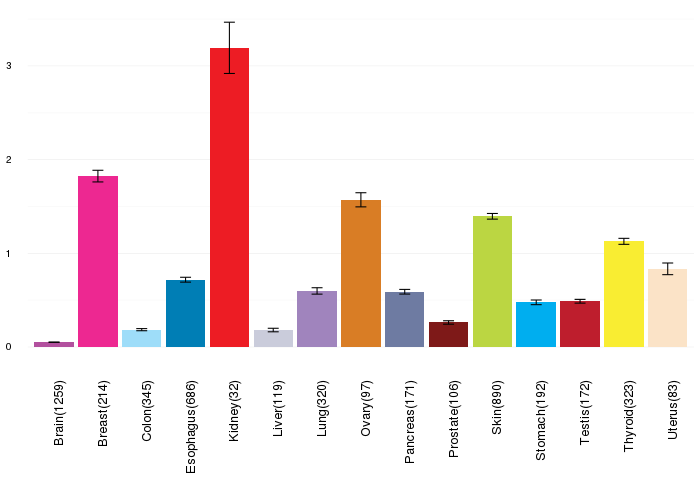
| Gene expressions across normal tissues of GTEx data (GTEx GTEx_Analysis_v6_RNA-seq_RNA-SeQCv1.1.8_gene_rpkm.gct) - Here, we shows the matched tissue types only among our 28 cancer types. |
 |
| Different expressions across 14 cancer types with more than 10 samples between matched tumors and normals (X-axis: cancer type and Y-axis: log2(norm_counts+1)) (TCGA IlluminaHiSeq_RNASeqV2, pan-cancer normalized log2(norm_counts+1) data, version 2016-08-16) |
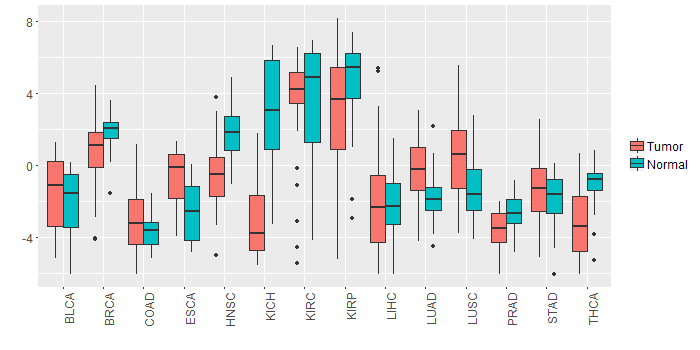 |
| - Significantly differentially expressed cancer types and information. (|Fold change|>1 and FDR<0.05) |
| Cancer type | Mean(exp) in tumor | Mean(exp) in matched normal | Log2FC | P-val. | FDR |
| LUAD | -0.329775972 | -1.897158731 | 1.567382759 | 2.12E-07 | 7.86E-07 |
| THCA | -3.344556656 | -0.976309198 | -2.368247458 | 5.87E-14 | 6.19E-13 |
| HNSC | -0.491052596 | 1.647838102 | -2.138890698 | 1.88E-08 | 2.13E-07 |
| LUSC | 0.413775448 | -1.325965729 | 1.739741176 | 8.08E-06 | 1.86E-05 |
| BRCA | 0.827562806 | 1.897284736 | -1.06972193 | 3.40E-09 | 1.17E-08 |
| KICH | -3.046836317 | 2.939619683 | -5.986456 | 1.49E-10 | 1.10E-09 |
| Top |
| TissGene-miRNA for FMO1 |
| Significantly anti-correlated miRNAs of TissGene across 28 cancer types (Gene-miRNA relations from TargetScanHuman Relsease 7.1, Conserved_Site_Context_Scores.txt.zip, 06.01.2016) (TCGA IlluminaHiSeq_miRNASeq, log2(RPM+1) data, version 2016-11-21) (TCGA IlluminaHiSeq_RNASeqV2, log2(normalized_count+1) data, version 2016-08-16) (Spearman’s Rank Correlation (p-value<0.05 and coefficient<-0.25)) |
| Cancer type | miRNA id | miRNA accession | P-val. | Coeff. | # samples |
| Top |
| TissGeneMut for FMO1 |
| TissGeneSNV for FMO1 |
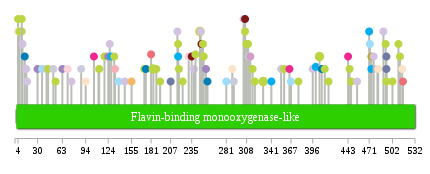
| nsSNV counts per each loci. Different colors of circles represent different cancer types. Circle size denotes number of samples. (TCGA somatic mutation (SNPs and small INDELs) data, version 2016-04-25) * Click on the image to enlarge it in a new window. |
 |
 |
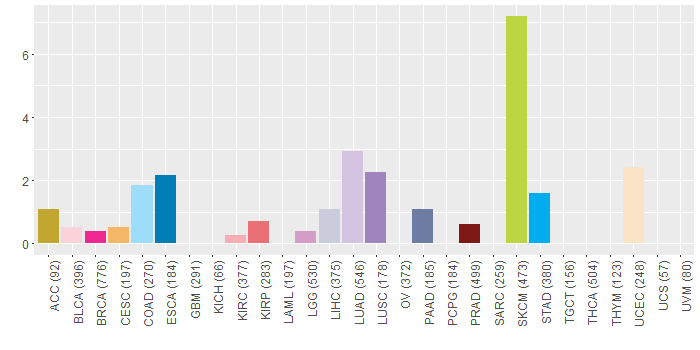
| Somatic nucleotide variants of TissGene across 28 cancer types (X-axis: cancer type and Y-axis: % of mutated samples) The numbers in parentheses are numbers of samples with mutation (nsSNVs). (TCGA somatic mutation (SNPs and small INDELs) data, version 2016-04-25) |
 |
| - nsSNVs sorted by frequency. |
| AAchange | Cancer type | # samples |
| p.D184N | SKCM | 2 |
| p.G330E | SKCM | 2 |
| p.S246F | SKCM | 2 |
| p.M405I | SKCM | 2 |
| p.E482K | LGG | 1 |
| p.R51K | LIHC | 1 |
| p.S70L | BLCA | 1 |
| p.G217R | STAD | 1 |
| p.M256I | ESCA | 1 |
| p.R494* | PAAD | 1 |
| p.L247I | LUAD | 1 |
| p.K354T | LUAD | 1 |
| p.A445G | SKCM | 1 |
| p.Q472R | COAD | 1 |
| p.Q240* | SKCM | 1 |
| p.A16D | LUAD | 1 |
| p.E512K | SKCM | 1 |
| p.G193E | SKCM | 1 |
| p.E281G | COAD | 1 |
| p.V396L | LUAD | 1 |
| p.T365N | BRCA | 1 |
| p.S119F | SKCM | 1 |
| p.R42* | LUAD | 1 |
| p.W254* | LUSC | 1 |
| p.R291C | LIHC | 1 |
| p.C63S | LUSC | 1 |
| p.G477D | LUAD | 1 |
| p.P250L | SKCM | 1 |
| p.P358S | SKCM | 1 |
| p.E132K | SKCM | 1 |
| p.R174L | ESCA | 1 |
| p.W231* | BLCA | 1 |
| p.L54F | SKCM | 1 |
| p.Q124E | LUSC | 1 |
| p.G217R | SKCM | 1 |
| p.I251T | SKCM | 1 |
| p.R4Q | UCEC | 1 |
| p.A6V | SKCM | 1 |
| p.K516R | KIRP | 1 |
| p.G9R | SKCM | 1 |
| p.Y94H | UCEC | 1 |
| p.P447L | SKCM | 1 |
| p.R238P | LUAD | 1 |
| p.L515I | UCEC | 1 |
| p.L88Q | LIHC | 1 |
| p.P248L | PRAD | 1 |
| p.A10D | LUAD | 1 |
| p.I181L | KIRP | 1 |
| p.L155F | CESC | 1 |
| p.A207V | PAAD | 1 |
| p.R474H | ACC | 1 |
| p.P289S | UCEC | 1 |
| p.C30Y | LUSC | 1 |
| p.E126D | LUAD | 1 |
| p.A367T | COAD | 1 |
| p.E319K | SKCM | 1 |
| p.E408X | ESCA | 1 |
| p.I443M | BRCA | 1 |
| p.C111Y | UCEC | 1 |
| p.T44P | SKCM | 1 |
| p.E305Q | HNSC | 1 |
| p.Y471C | STAD | 1 |
| p.R502Q | SKCM | 1 |
| p.G218R | SKCM | 1 |
| p.V128A | STAD | 1 |
| p.T455M | LUAD | 1 |
| p.S341P | STAD | 1 |
| p.V311F | LIHC | 1 |
| p.L188F | SKCM | 1 |
| p.S377F | SKCM | 1 |
| p.R494Q | SKCM | 1 |
| p.K304R | LUAD | 1 |
| p.E308K | SKCM | 1 |
| p.G483R | UCEC | 1 |
| p.P75Q | LUAD | 1 |
| p.E133A | KIRC | 1 |
| p.A138V | COAD | 1 |
| p.S13I | ESCA | 1 |
| p.D36Y | COAD | 1 |
| p.R4Q | SKCM | 1 |
| p.V234G | HNSC | 1 |
| p.D493N | SKCM | 1 |
| p.R494X | PAAD | 1 |
| p.S310F | SKCM | 1 |
| p.S13R | HNSC | 1 |
| p.V306I | SKCM | 1 |
| p.Q105K | BRCA | 1 |
| p.R502Q | HNSC | 1 |
| p.C146S | LUAD | 1 |
| p.G216A | LUAD | 1 |
| p.F313V | LGG | 1 |
| p.R223* | HNSC | 1 |
| p.S317* | HNSC | 1 |
| p.F235L | PRAD | 1 |
| p.Q240E | HNSC | 1 |
| p.T316P | SKCM | 1 |
| p.P510S | SKCM | 1 |
| p.P417S | SKCM | 1 |
| p.P400S | STAD | 1 |
| p.R223Q | SKCM | 1 |
| p.R412K | SKCM | 1 |
| p.V306I | PRAD | 1 |
| p.L15Q | LUAD | 1 |
| p.G9E | SKCM | 1 |
| p.S112I | SKCM | 1 |
| p.T490N | LUAD | 1 |
| p.H172Y | SKCM | 1 |
| p.R474H | STAD | 1 |
| Top |
| TissGeneCNV for FMO1 |
| Copy number variations of TissGene across 28 cancer types (X-axis: cancer type and Y-axis: % of CNV samples) (TCGA Gistic2_CopyNumber_Gistic2_all_data_by_genes, Gistic2 copy number data, version 2016-08-16) |
 |
| Top |
| TissGeneFusions for FMO1 |
| Fusion genes including TissGene (ChimerDB 3.0, 2016-12-01 and TCGA fusion Portal 2015-12-01) |
| Database | Src | Cancer type | Sample | Fusion gene | ORF | 5'-gene BP | 3'-gene BP |
| Chimerdb3.0 | FusionScan | LUSC | TCGA-96-8169-01A | PRRC2C-FMO1 | 5'UTR-CDS | chr1:171454874 | chr1:171236681 |
| Top |
| TissGeneNet for FMO1 |
| Co-expressed gene networks based on protein-protein interaction data (CePIN) (TCGA IlluminaHiSeq_RNASeqV2, pan-cancer normalized log2(norm_counts+1) data, version 2016-08-16) (PINA2 ppi data) |
| Top |
| TissGeneProg for FMO1 |
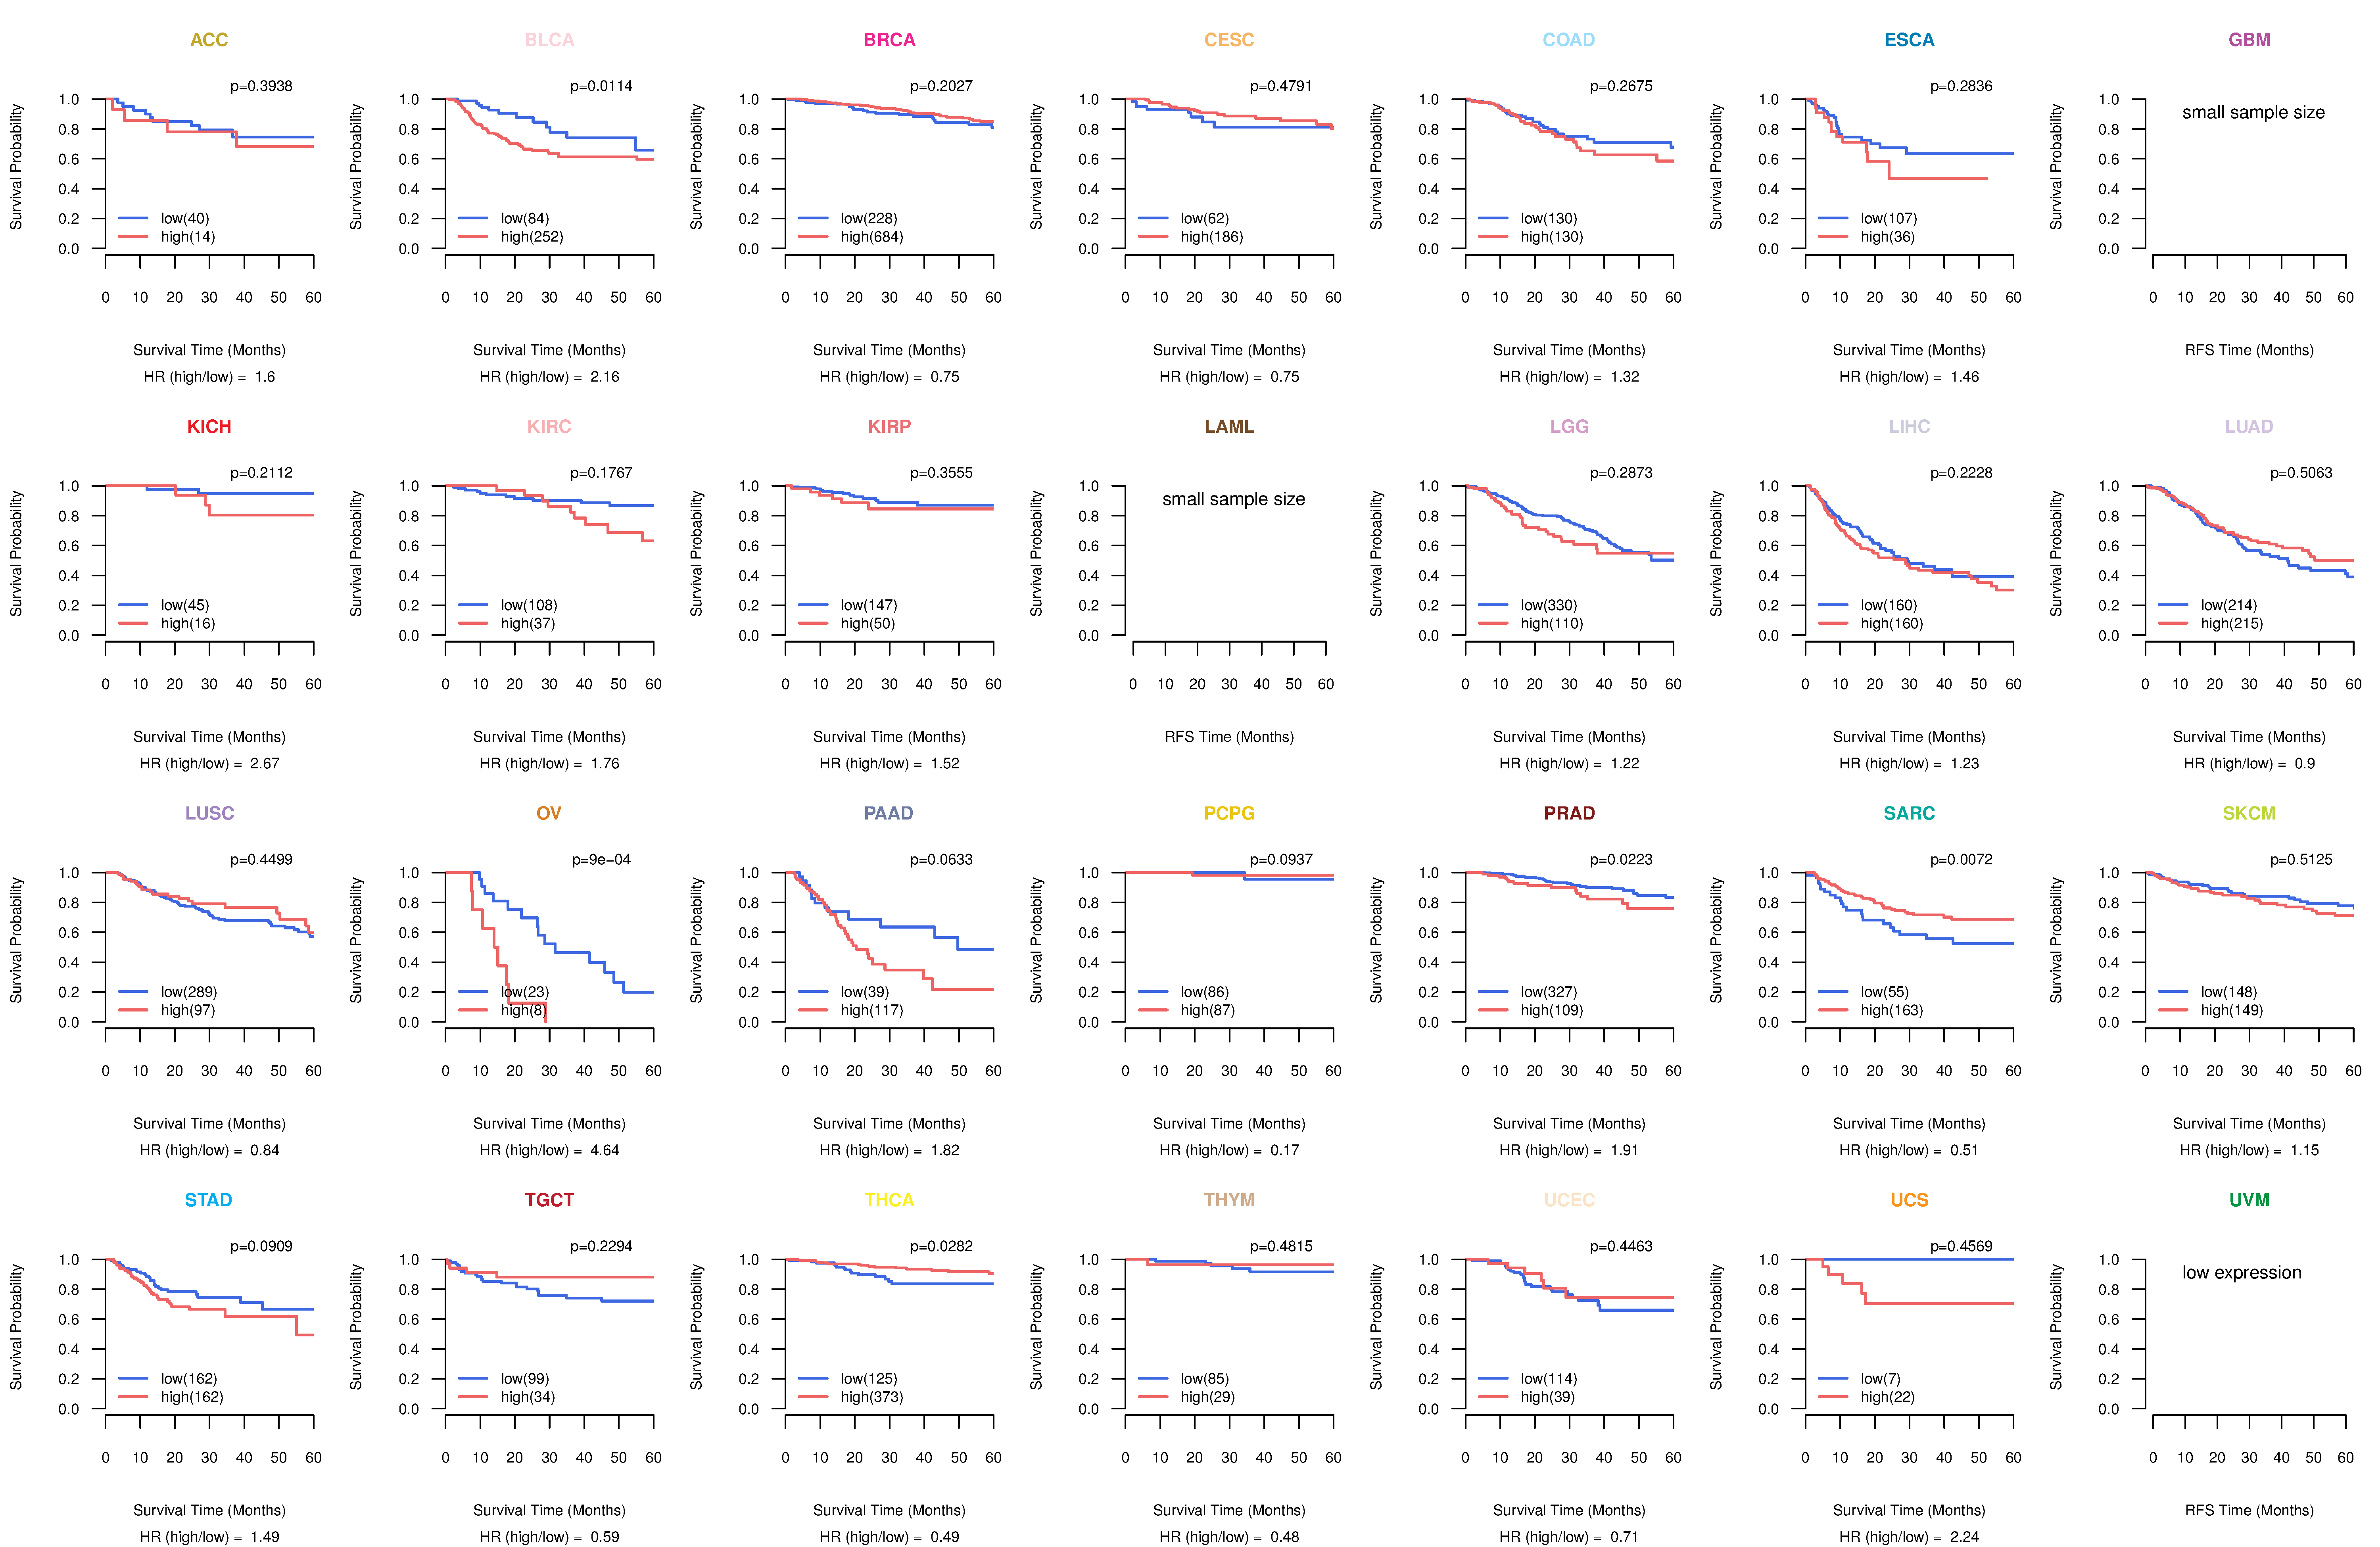
| Kaplan-Meier plots with logrank tests of overall survival (OS) using 28 cancer types (TCGA IlluminaHiSeq_RNASeqV2, pan-cancer normalized log2(norm_counts+1) data, version 2016-08-16) (TCGA clinicalMatrix, phenotype data, version 2016-04-27) * Click on the image to enlarge it in a new window. |
 |
| Kaplan-Meier plots with logrank test of relapse free survival (RFS) using 28 cancer types (TCGA IlluminaHiSeq_RNASeqV2, pan-cancer normalized log2(norm_counts+1) data, version 2016-08-16) (TCGA clinicalMatrix, phenotype data, version 2016-04-27) * Click on the image enlarge it in a new window. |
 |
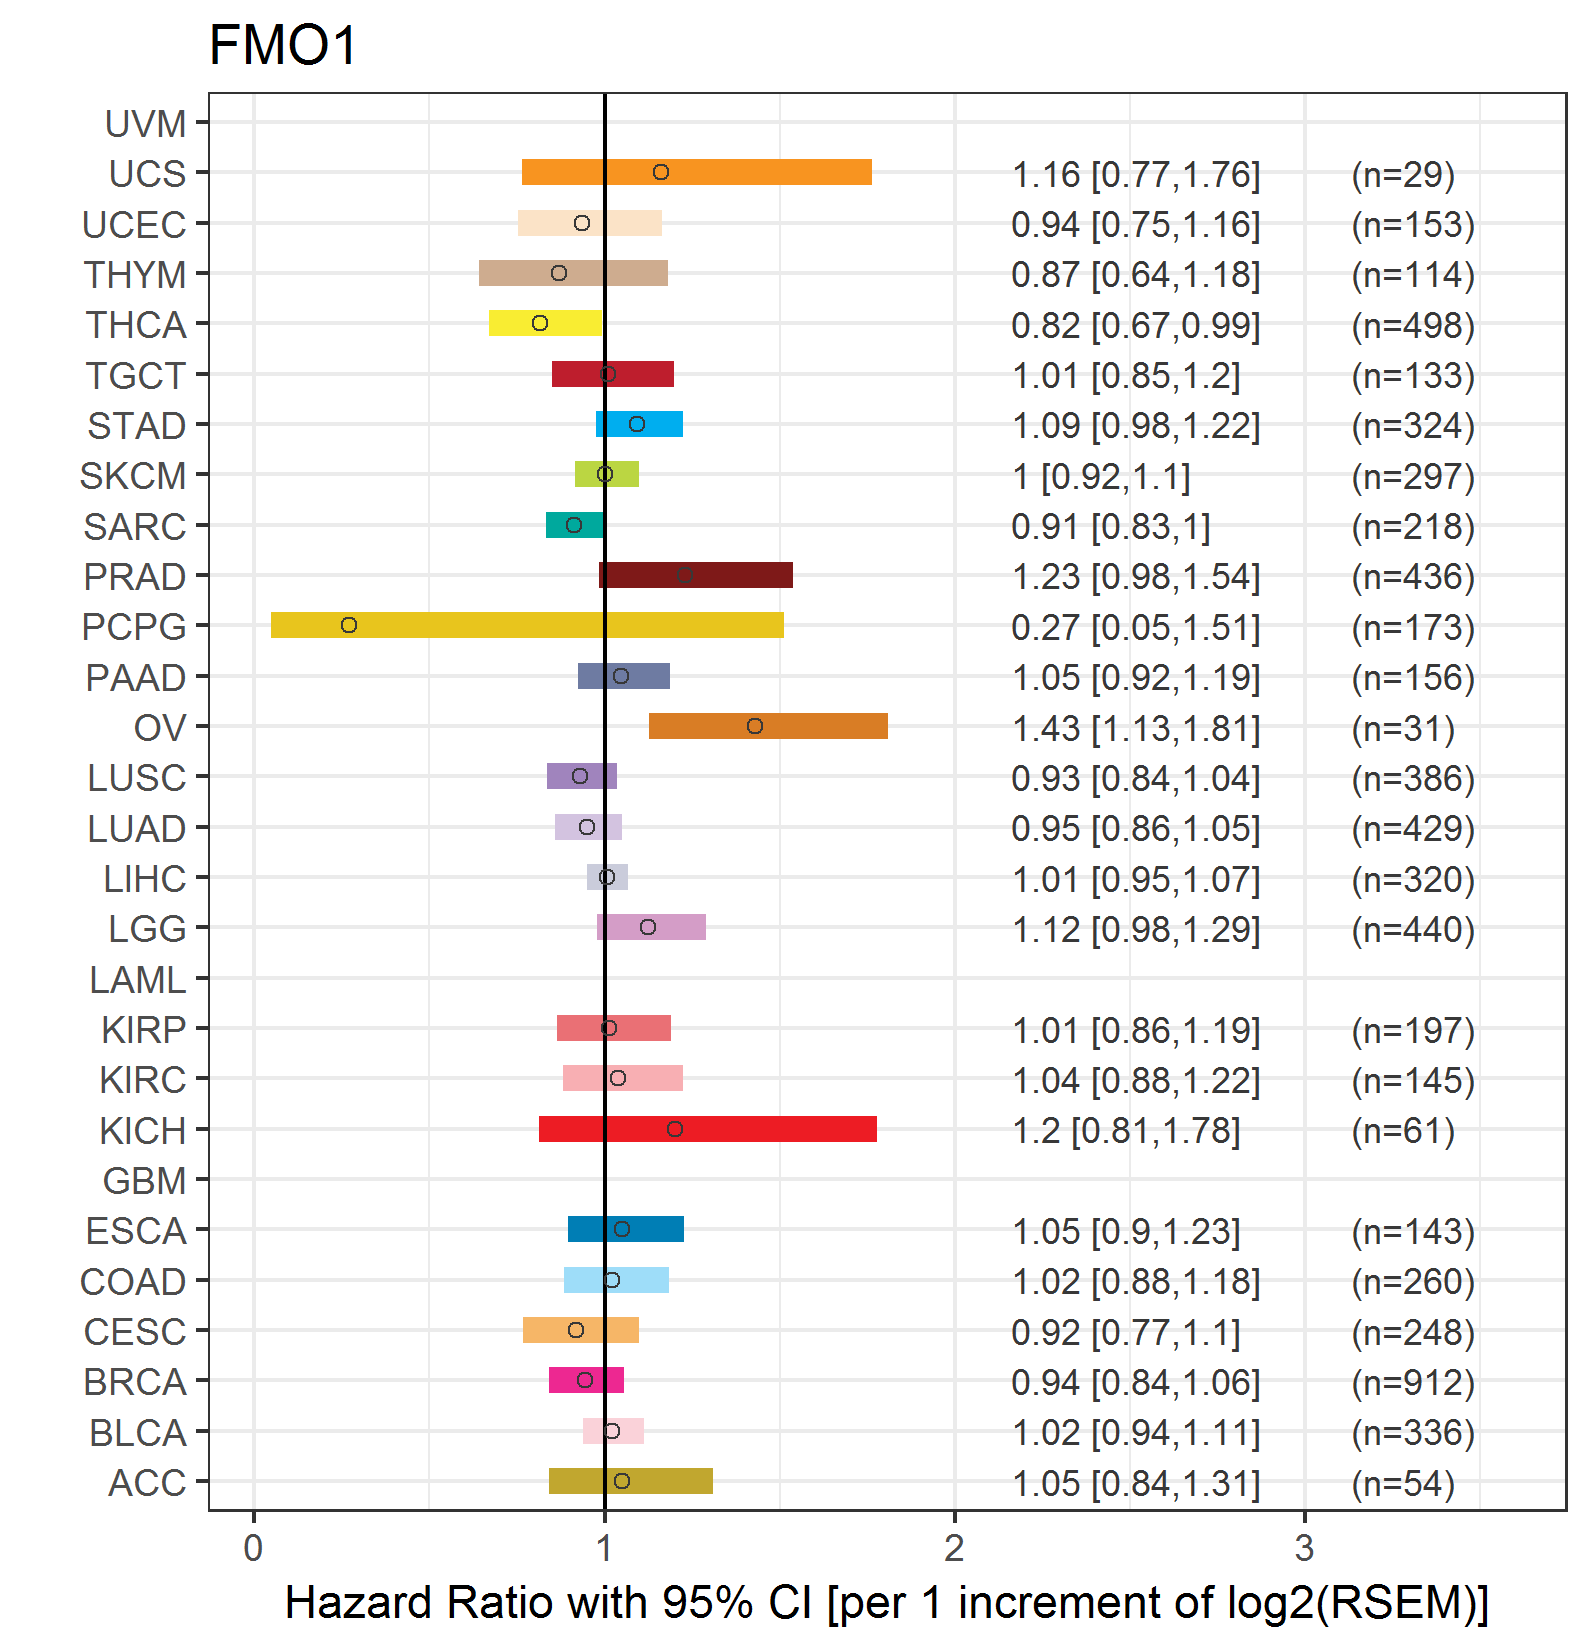
| Forest plot of Cox proportional hazard ratio (HR) and 95% CI of overall survival (OS) using 28 cancer types (TCGA IlluminaHiSeq_RNASeqV2, pan-cancer normalized log2(norm_counts+1) data, version 2016-08-16) (TCGA clinicalMatrix, phenotype data, version 2016-04-27) * Click on the image enlarge it in a new window. |
 |
| Forest plot of Cox proportional hazard ratio (HR) and 95% CI of relapse free survival (RFS) using 28 cancer types (TCGA IlluminaHiSeq_RNASeqV2, pan-cancer normalized log2(norm_counts+1) data, version 2016-08-16) (TCGA clinicalMatrix, phenotype data, version 2016-04-27) * Click on the image enlarge it in a new window. |
 |
| Top |
| TissGeneClin for FMO1 |
| TissGeneDrug for FMO1 |
| Drug information targeting TissGene (DrugBank Version 5.0.6, 2017-04-01) |
| DrugBank ID | Drug name | Drug activity | Drug type | Drug status |
| Top |
| TissGeneDisease for FMO1 |
| Disease information associated with TissGene (DisGeNet, 2016-06-01) |
| Disease ID | Disease name | # pubmeds | Source |
| umls:C0002736 | Amyotrophic Lateral Sclerosis | 1 | BeFree |
| umls:C0011053 | Deafness | 1 | GAD |
| umls:C0018772 | Hearing Loss, Partial | 1 | GAD |
| umls:C0023893 | Liver Cirrhosis, Experimental | 1 | CTD_human |
| umls:C0085298 | Sudden Cardiac Death | 1 | GAD |
| umls:C0220603 | childhood brain tumor | 1 | GAD |
| umls:C1384666 | hearing impairment | 1 | GAD |
| umls:C1862939 | AMYOTROPHIC LATERAL SCLEROSIS 1 | 1 | CTD_human |
| umls:C1862941 | Amyotrophic Lateral Sclerosis, Sporadic | 1 | BeFree |
| umls:C3887873 | Hearing Loss | 1 | GAD |
|
Copyright 2016-Present - The University of Texas Health Science Center at Houston (UTHealth) Web File Viewing | How to Report, Fraud, Waste and Abuse | State of Texas | Statewide Search | Texas Homeland Security | Site Policies |