 |
| |
| |
| |
| |
| |
| |
|

| TissGeneSummary for FMO3 |
 Gene summary Gene summary |
| Basic gene information | Gene symbol | FMO3 |
| Gene name | flavin containing monooxygenase 3 | |
| Synonyms | FMOII|TMAU|dJ127D3.1 | |
| Cytomap | UCSC genome browser: 1q24.3 | |
| Type of gene | protein-coding | |
| RefGenes | NM_001002294.2, NM_006894.5, | |
| Description | FMO 3FMO IIFMO form 2dimethylaniline monooxygenase [N-oxide-forming] 3dimethylaniline oxidase 3hepatic flavin-containing monooxygenase 3hepatic flavin-containing monooxygenase-3trimethylamine monooxygenase | |
| Modification date | 20141219 | |
| dbXrefs | MIM : 136132 | |
| HGNC : HGNC | ||
| Ensembl : ENSG00000007933 | ||
| HPRD : 00633 | ||
| Vega : OTTHUMG00000035505 | ||
| Protein | UniProt: go to UniProt's Cross Reference DB Table | |
| Expression | CleanEX: HS_FMO3 | |
| BioGPS: 2328 | ||
| Pathway | NCI Pathway Interaction Database: FMO3 | |
| KEGG: FMO3 | ||
| REACTOME: FMO3 | ||
| Pathway Commons: FMO3 | ||
| Context | iHOP: FMO3 | |
| ligand binding site mutation search in PubMed: FMO3 | ||
| UCL Cancer Institute: FMO3 | ||
| Assigned class in TissGDB* | A | |
| Included tissue-specific gene expression resources | HPA,TiGER,GTEx | |
| Specific-tissues in normal samples (assigned by TissGDB using HPA, TiGER, and GTEx) | Liver | |
| Cancer types related to the specific-tissues in cancer samples (assigned by TissGDB using TCGA) | LIHC | |
| Reference showing the relevant tissue of FMO3 | Developmental and tissue-specific expression of human flavin-containing monooxygenases 1 and 3. Hines RN. Expert Opin Drug Metab Toxicol. 2006 Feb;2(1):41-9. Review. (pmid:16863467) go to article | |
| Description by TissGene annotations | Have significant anti-correlated miRNA | |
| * Class A consists of genes with literature evidence and is part of the cTissGenes. Class B consists of only cTissGenes without additional evidence. The remaining genes belong to Class C. |
| Gene ontology having evidence of Inferred from Direct Assay (IDA) from Entrez |
| GO ID | GO term | PubMed ID |
| Top |
| TissGeneExp for FMO3 |
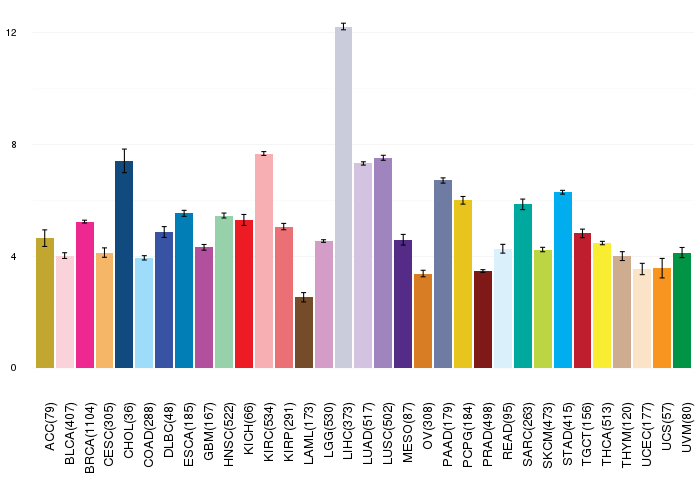
| Gene expressions across 28 cancer types (X-axis: cancer type and Y-axis: log2(norm_counts+1)) (TCGA IlluminaHiSeq_RNASeqV2, pan-cancer normalized log2(norm_counts+1) data, version 2016-08-16) |
 |
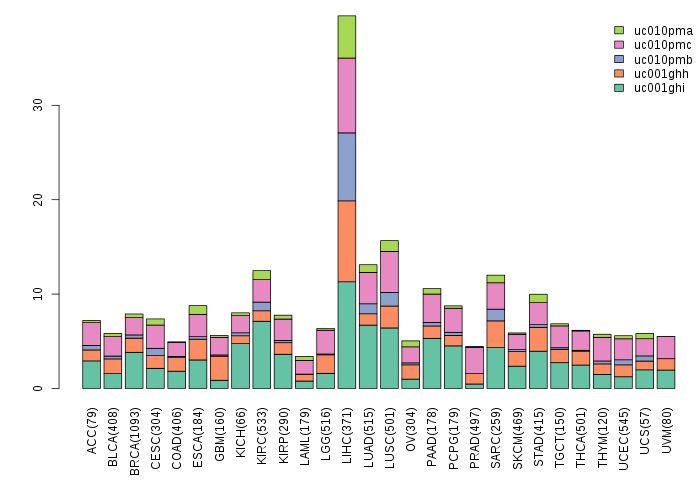
| Gene isoform expressions across 28 cancer types (X-axis: cancer type and Y-axis: log2(norm_counts+1)) (TCGA pan-cancer tcga_rsem_isoform_tpm, version 2016-09-01) |
 |
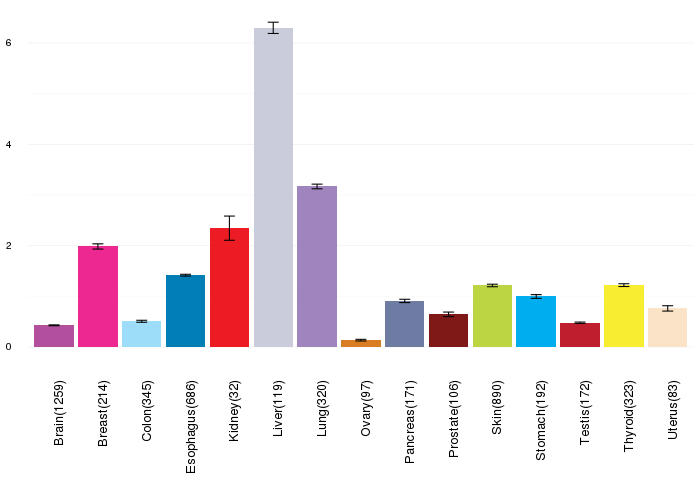
| Gene expressions across normal tissues of GTEx data (GTEx GTEx_Analysis_v6_RNA-seq_RNA-SeQCv1.1.8_gene_rpkm.gct) - Here, we shows the matched tissue types only among our 28 cancer types. |
 |
| Different expressions across 14 cancer types with more than 10 samples between matched tumors and normals (X-axis: cancer type and Y-axis: log2(norm_counts+1)) (TCGA IlluminaHiSeq_RNASeqV2, pan-cancer normalized log2(norm_counts+1) data, version 2016-08-16) |
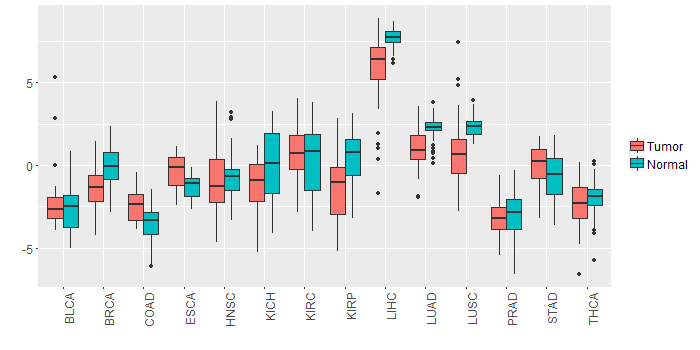 |
| - Significantly differentially expressed cancer types and information. (|Fold change|>1 and FDR<0.05) |
| Cancer type | Mean(exp) in tumor | Mean(exp) in matched normal | Log2FC | P-val. | FDR |
| BRCA | -1.355560656 | -0.105416797 | -1.25014386 | 5.89E-14 | 2.84E-13 |
| LIHC | 5.869056115 | 7.694196115 | -1.82514 | 4.10E-07 | 2.44E-06 |
| LUSC | 0.769748115 | 2.339491253 | -1.569743137 | 6.80E-07 | 1.74E-06 |
| LUAD | 1.067892943 | 2.278480874 | -1.210587931 | 2.38E-09 | 1.20E-08 |
| COAD | -2.326290346 | -3.580917269 | 1.254626923 | 0.000225 | 0.000754939 |
| KIRP | -1.370433135 | 0.47275124 | -1.843184375 | 0.000154 | 0.000503306 |
| Top |
| TissGene-miRNA for FMO3 |
| Significantly anti-correlated miRNAs of TissGene across 28 cancer types (Gene-miRNA relations from TargetScanHuman Relsease 7.1, Conserved_Site_Context_Scores.txt.zip, 06.01.2016) (TCGA IlluminaHiSeq_miRNASeq, log2(RPM+1) data, version 2016-11-21) (TCGA IlluminaHiSeq_RNASeqV2, log2(normalized_count+1) data, version 2016-08-16) (Spearman’s Rank Correlation (p-value<0.05 and coefficient<-0.25)) |
| Cancer type | miRNA id | miRNA accession | P-val. | Coeff. | # samples |
| UCS | hsa-miR-543 | MIMAT0004954 | 0.02 | -0.35 | 56 |
| Top |
| TissGeneMut for FMO3 |
| TissGeneSNV for FMO3 |
| nsSNV counts per each loci. Different colors of circles represent different cancer types. Circle size denotes number of samples. (TCGA somatic mutation (SNPs and small INDELs) data, version 2016-04-25) * Click on the image to enlarge it in a new window. |
 |
 |
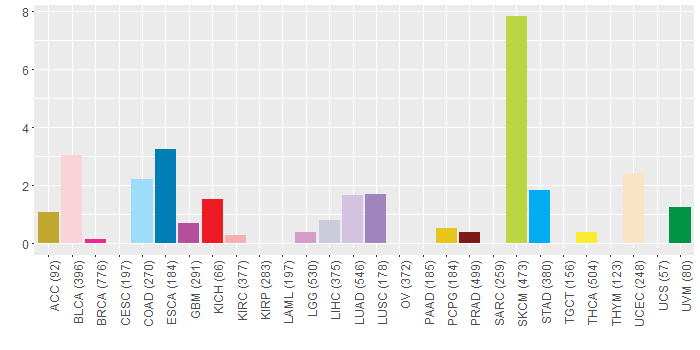
| Somatic nucleotide variants of TissGene across 28 cancer types (X-axis: cancer type and Y-axis: % of mutated samples) The numbers in parentheses are numbers of samples with mutation (nsSNVs). (TCGA somatic mutation (SNPs and small INDELs) data, version 2016-04-25) |
 |
| - nsSNVs sorted by frequency. |
| AAchange | Cancer type | # samples |
| p.E267K | SKCM | 4 |
| p.P455S | SKCM | 3 |
| p.P230S | SKCM | 3 |
| p.S493L | SKCM | 2 |
| p.W125* | SKCM | 2 |
| p.P75S | SKCM | 2 |
| p.D286N | SKCM | 2 |
| p.R417C | UCEC | 2 |
| p.F78L | KICH | 1 |
| p.S111F | BLCA | 1 |
| p.G193V | BRCA | 1 |
| p.E308G | COAD | 1 |
| p.A290V | BLCA | 1 |
| p.K495T | STAD | 1 |
| p.G196D | SKCM | 1 |
| p.P465T | COAD | 1 |
| p.A443T | STAD | 1 |
| p.G355A | BLCA | 1 |
| p.I343F | LUAD | 1 |
| p.Q88* | SKCM | 1 |
| p.E320* | THCA | 1 |
| p.S173I | HNSC | 1 |
| p.V303L | ACC | 1 |
| p.A458T | UCEC | 1 |
| p.G168D | GBM | 1 |
| p.D132H | DLBC | 1 |
| p.E424K | SKCM | 1 |
| p.P273S | LGG | 1 |
| p.V145L | STAD | 1 |
| p.A207S | UCEC | 1 |
| p.F319L | LIHC | 1 |
| p.S423N | SKCM | 1 |
| p.K354N | LUAD | 1 |
| p.E411K | BLCA | 1 |
| p.M66I | COAD | 1 |
| p.T206R | LUAD | 1 |
| p.L523P | LUSC | 1 |
| p.G442V | ESCA | 1 |
| p.E411Q | LUSC | 1 |
| p.R483I | ESCA | 1 |
| p.I318T | LIHC | 1 |
| p.S195L | SKCM | 1 |
| p.G240E | SKCM | 1 |
| p.E178V | UCEC | 1 |
| p.F471V | ESCA | 1 |
| p.F510L | READ | 1 |
| p.E130K | SKCM | 1 |
| p.N347D | COAD | 1 |
| p.F357I | SKCM | 1 |
| p.F319S | UCEC | 1 |
| p.G240E | LUSC | 1 |
| p.M260I | SKCM | 1 |
| p.P468S | SKCM | 1 |
| p.K3R | LIHC | 1 |
| p.G148R | SKCM | 1 |
| p.G503W | KIRC | 1 |
| p.D175Y | LUAD | 1 |
| p.P445S | BLCA | 1 |
| p.S195L | COAD | 1 |
| p.G370S | SKCM | 1 |
| p.M211I | GBM | 1 |
| p.V382A | HNSC | 1 |
| p.T317I | SKCM | 1 |
| p.W514C | BLCA | 1 |
| p.A389T | HNSC | 1 |
| p.K456T | LGG | 1 |
| p.S401F | SKCM | 1 |
| p.G148V | LUAD | 1 |
| p.M405I | HNSC | 1 |
| p.L517R | STAD | 1 |
| p.S493* | LUSC | 1 |
| p.W490X | SKCM | 1 |
| p.W125X | SKCM | 1 |
| p.W490* | SKCM | 1 |
| p.I37F | LUAD | 1 |
| p.P380S | SKCM | 1 |
| p.T108A | LIHC | 1 |
| p.E349K | BLCA | 1 |
| p.K258N | LGG | 1 |
| p.G123S | BLCA | 1 |
| p.K300T | SKCM | 1 |
| p.H513N | HNSC | 1 |
| p.E287K | SKCM | 1 |
| p.T329A | LUAD | 1 |
| p.V502I | UCEC | 1 |
| p.K456E | LGG | 1 |
| p.I199T | LUAD | 1 |
| p.V181A | UCEC | 1 |
| p.V236F | ESCA | 1 |
| p.E460K | ESCA | 1 |
| p.E32D | COAD | 1 |
| p.D118N | SKCM | 1 |
| p.D198N | SKCM | 1 |
| p.S222N | THCA | 1 |
| p.E208Q | BLCA | 1 |
| p.H513Y | BLCA | 1 |
| p.T128A | HNSC | 1 |
| p.D76N | UCEC | 1 |
| p.D408N | SKCM | 1 |
| p.A377D | STAD | 1 |
| p.G123A | PCPG | 1 |
| p.G316E | SKCM | 1 |
| p.R417C | PRAD | 1 |
| p.D491E | READ | 1 |
| p.W41L | STAD | 1 |
| p.M434I | SKCM | 1 |
| p.G464R | PRAD | 1 |
| p.P230L | SKCM | 1 |
| p.E32K | LUAD | 1 |
| p.P336L | SKCM | 1 |
| p.V368M | STAD | 1 |
| p.G503R | UCEC | 1 |
| p.D76N | BLCA | 1 |
| p.E424K | UVM | 1 |
| p.E89K | SKCM | 1 |
| p.M211L | BLCA | 1 |
| p.L352S | ESCA | 1 |
| Top |
| TissGeneCNV for FMO3 |
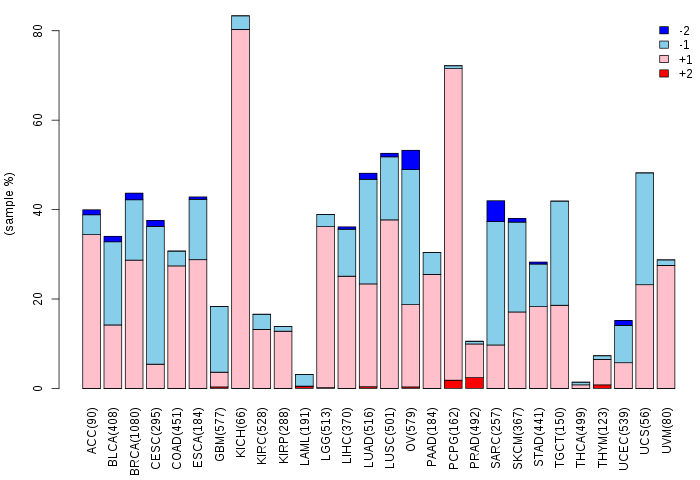
| Copy number variations of TissGene across 28 cancer types (X-axis: cancer type and Y-axis: % of CNV samples) (TCGA Gistic2_CopyNumber_Gistic2_all_data_by_genes, Gistic2 copy number data, version 2016-08-16) |
 |
| Top |
| TissGeneFusions for FMO3 |
| Fusion genes including TissGene (ChimerDB 3.0, 2016-12-01 and TCGA fusion Portal 2015-12-01) |
| Database | Src | Cancer type | Sample | Fusion gene | ORF | 5'-gene BP | 3'-gene BP |
| Chimerdb3.0 | FusionScan | SARC | TCGA-DX-A1L2-01A | FLJ43663-FMO3 | 3'UTR-5'UTR | chr7:130737183 | chr1:171061793 |
| Chimerdb3.0 | TopHat-Fusion | UCEC | TCGA-BK-A139-02A | PRRC2C-FMO3 | 5'UTR-CDS | chr1:171454873 | chr1:171070220 |
| Top |
| TissGeneNet for FMO3 |
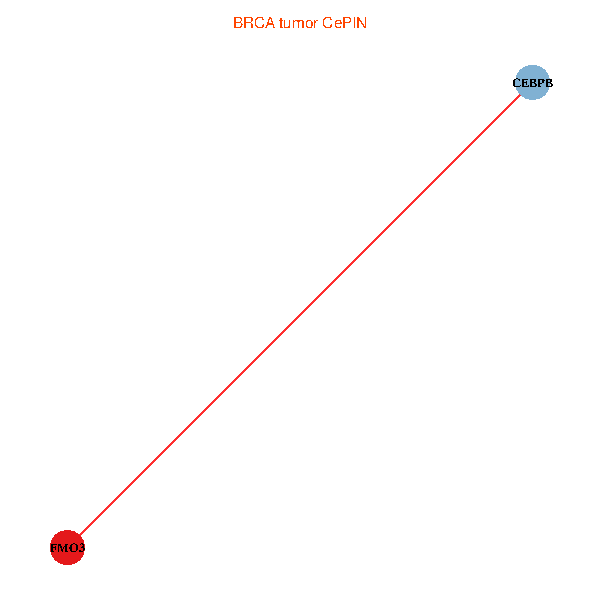
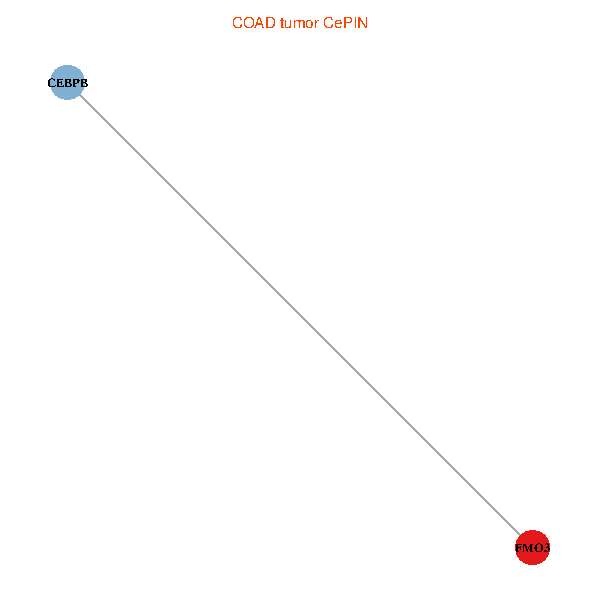
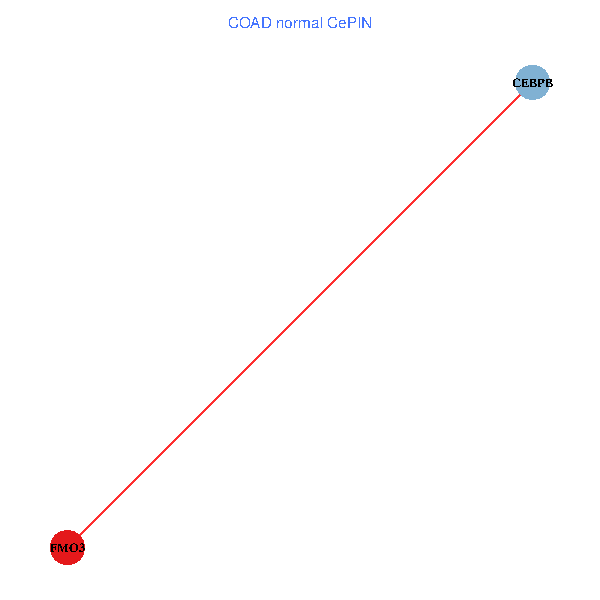
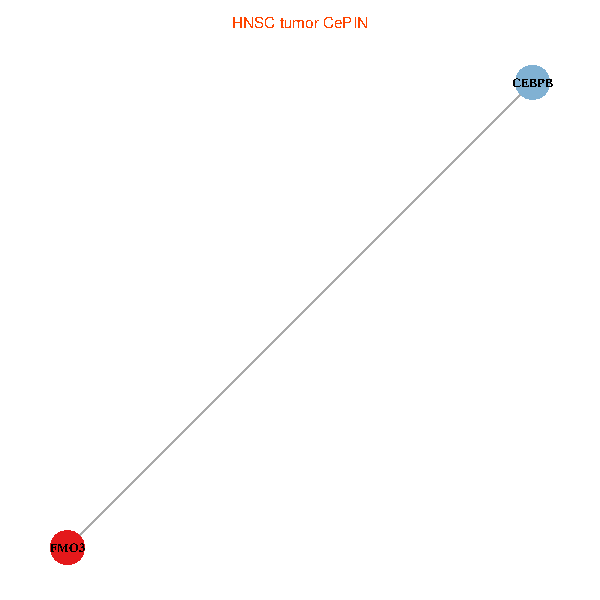
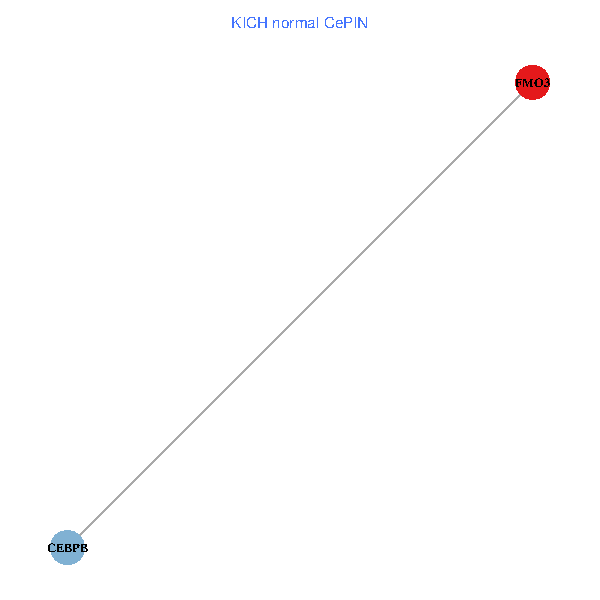
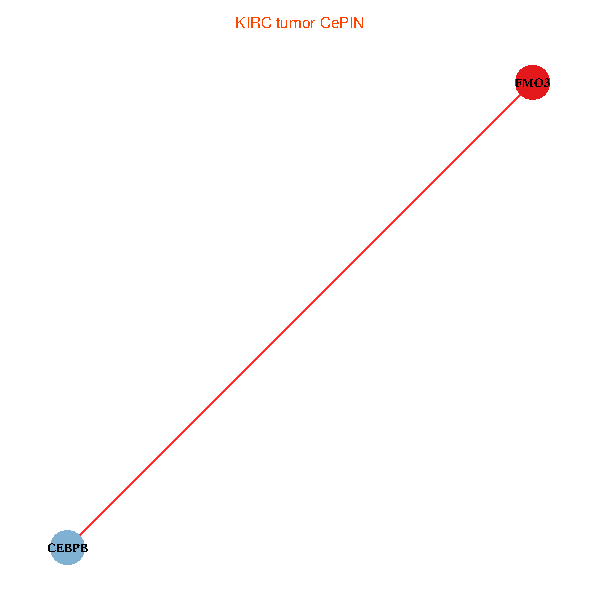
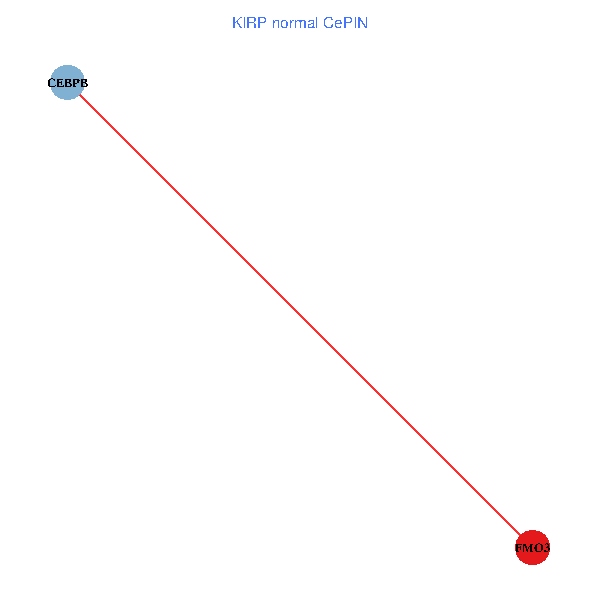
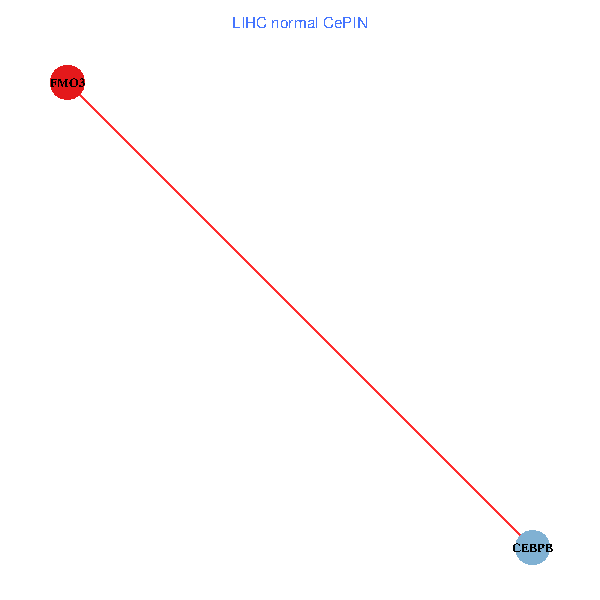
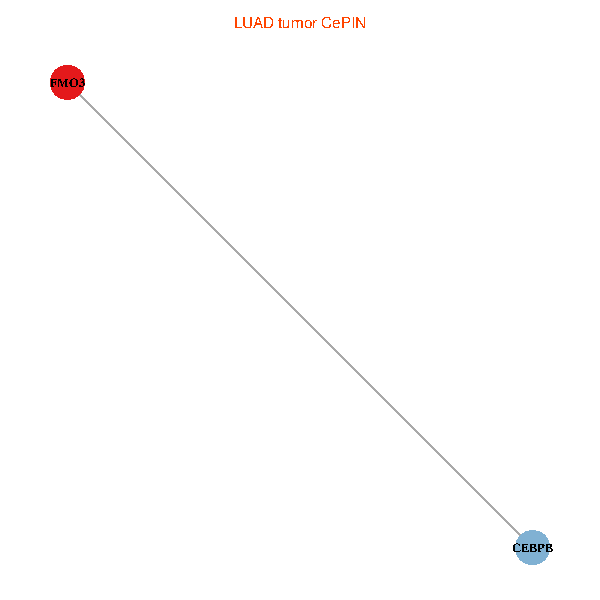
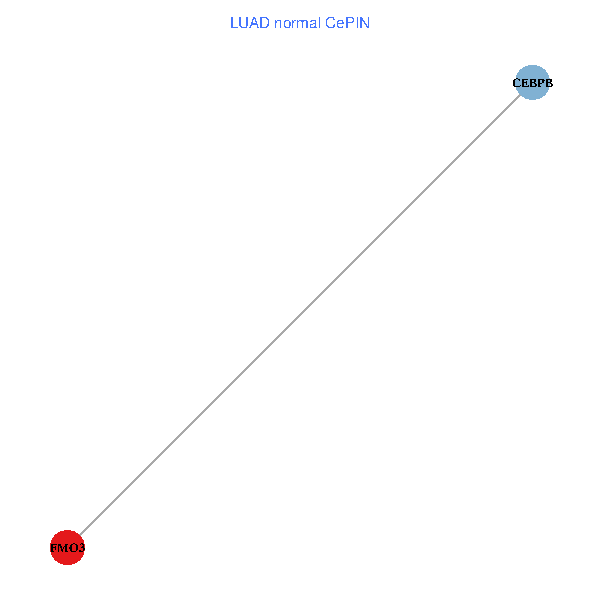
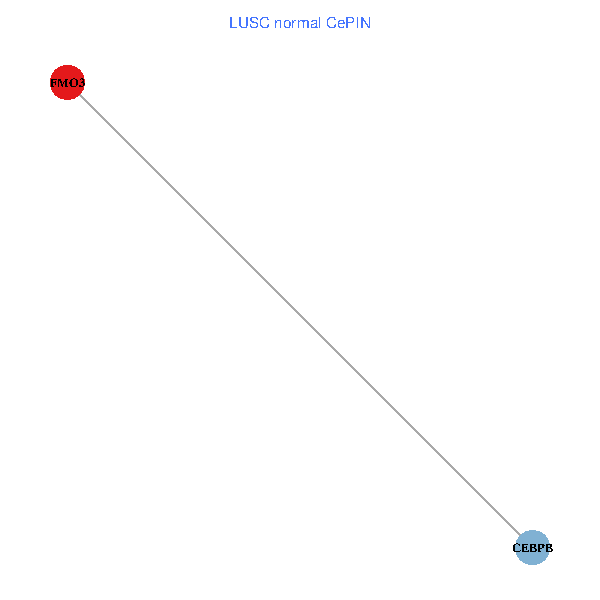
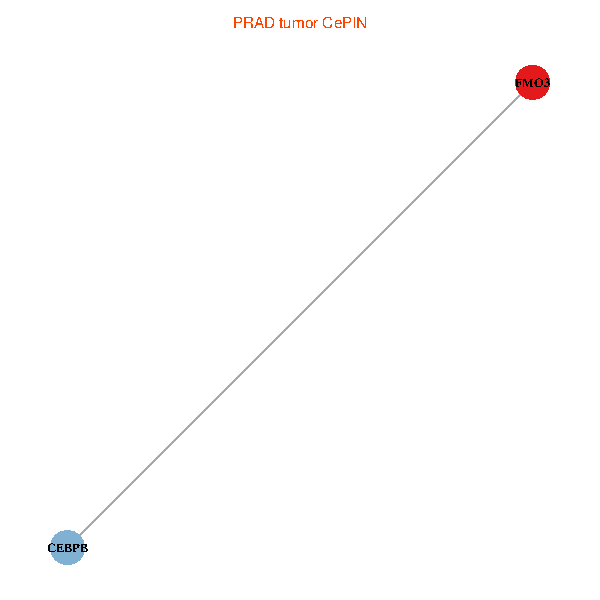
| Co-expressed gene networks based on protein-protein interaction data (CePIN) (TCGA IlluminaHiSeq_RNASeqV2, pan-cancer normalized log2(norm_counts+1) data, version 2016-08-16) (PINA2 ppi data) |
| BRCA (tumor) | BRCA (normal) |
| FMO3, CEBPB (tumor) | FMO3, CEBPB (normal) |
 |  |
| COAD (tumor) | COAD (normal) |
| FMO3, CEBPB (tumor) | FMO3, CEBPB (normal) |
 |  |
| HNSC (tumor) | HNSC (normal) |
| FMO3, CEBPB (tumor) | FMO3, CEBPB (normal) |
 |  |
| KICH (tumor) | KICH (normal) |
| FMO3, CEBPB (tumor) | FMO3, CEBPB (normal) |
 |  |
| KIRC (tumor) | KIRC (normal) |
| FMO3, CEBPB (tumor) | FMO3, CEBPB (normal) |
 |  |
| KIRP (tumor) | KIRP (normal) |
| FMO3, CEBPB (tumor) | FMO3, CEBPB (normal) |
 |  |
| LIHC (tumor) | LIHC (normal) |
| FMO3, CEBPB (tumor) | FMO3, CEBPB (normal) |
 |  |
| LUAD (tumor) | LUAD (normal) |
| FMO3, CEBPB (tumor) | FMO3, CEBPB (normal) |
 |  |
| LUSC (tumor) | LUSC (normal) |
| FMO3, CEBPB (tumor) | FMO3, CEBPB (normal) |
 |  |
| PRAD (tumor) | PRAD (normal) |
| FMO3, CEBPB (tumor) | FMO3, CEBPB (normal) |
 |  |
| STAD (tumor) | STAD (normal) |
| FMO3, CEBPB (tumor) | FMO3, CEBPB (normal) |
 |  |
| THCA (tumor) | THCA (normal) |
| FMO3, CEBPB (tumor) | FMO3, CEBPB (normal) |
 |  |
| Top |
| TissGeneProg for FMO3 |
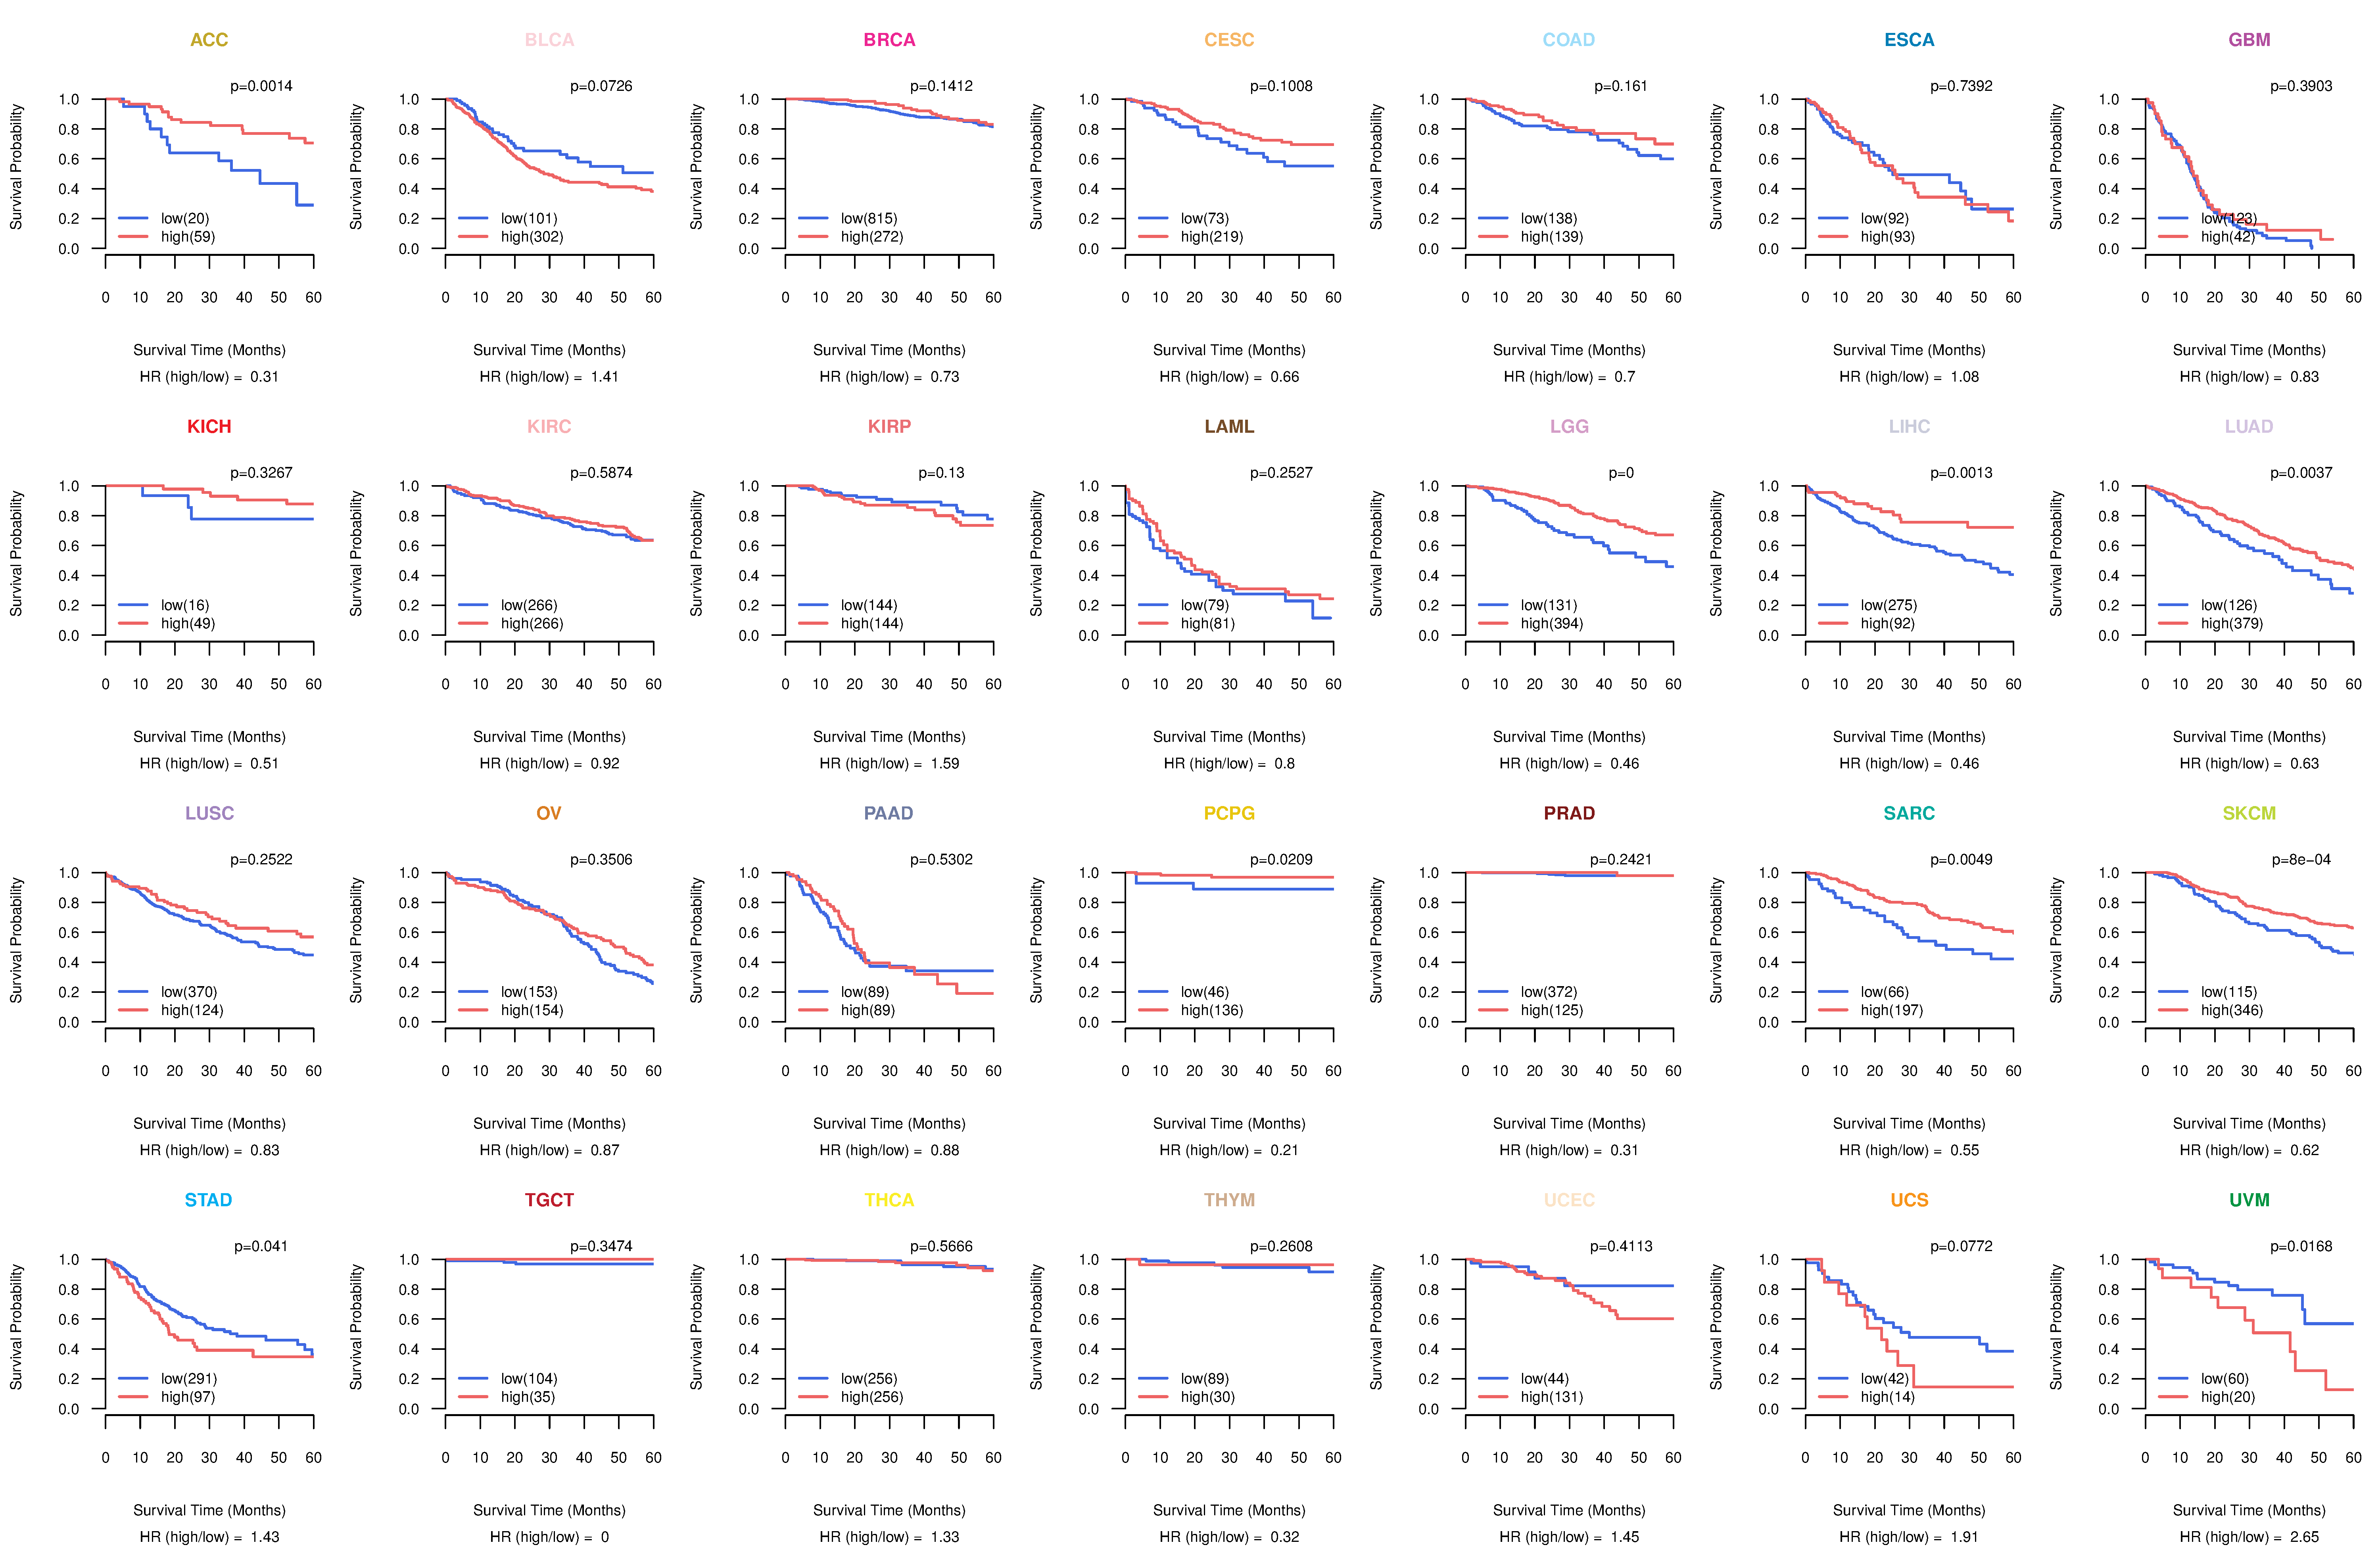
| Kaplan-Meier plots with logrank tests of overall survival (OS) using 28 cancer types (TCGA IlluminaHiSeq_RNASeqV2, pan-cancer normalized log2(norm_counts+1) data, version 2016-08-16) (TCGA clinicalMatrix, phenotype data, version 2016-04-27) * Click on the image to enlarge it in a new window. |
 |
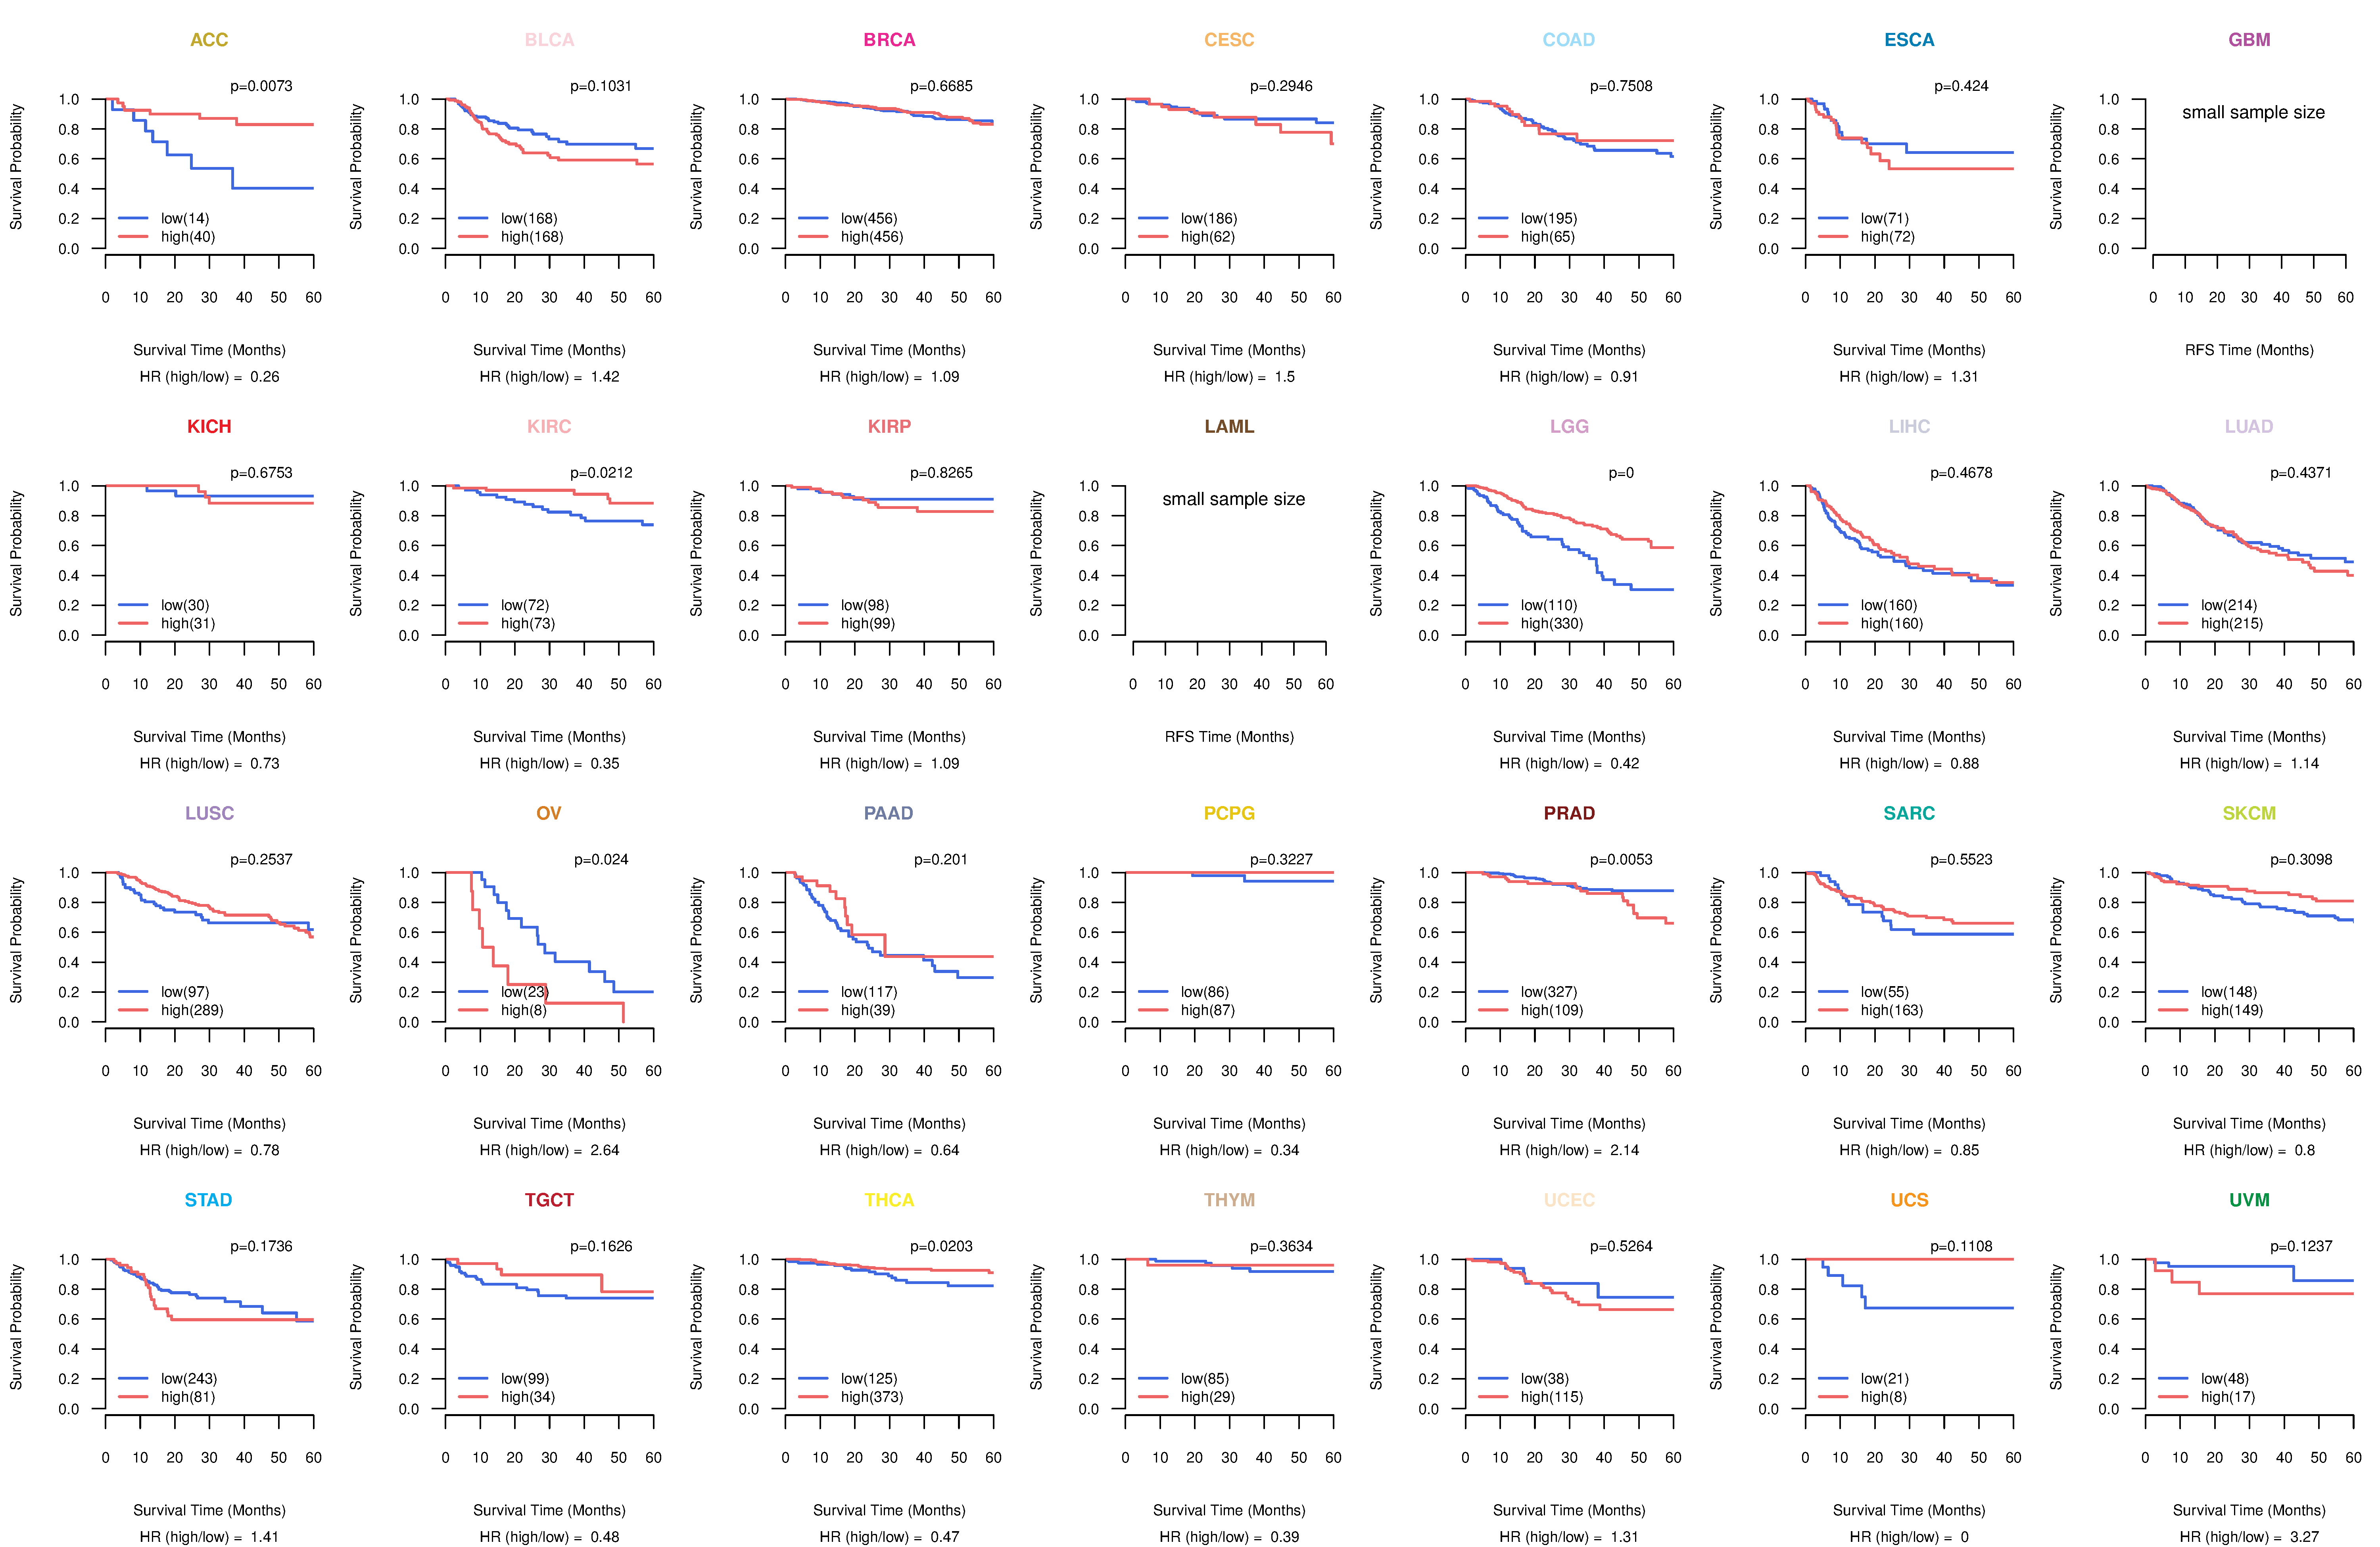
| Kaplan-Meier plots with logrank test of relapse free survival (RFS) using 28 cancer types (TCGA IlluminaHiSeq_RNASeqV2, pan-cancer normalized log2(norm_counts+1) data, version 2016-08-16) (TCGA clinicalMatrix, phenotype data, version 2016-04-27) * Click on the image enlarge it in a new window. |
 |
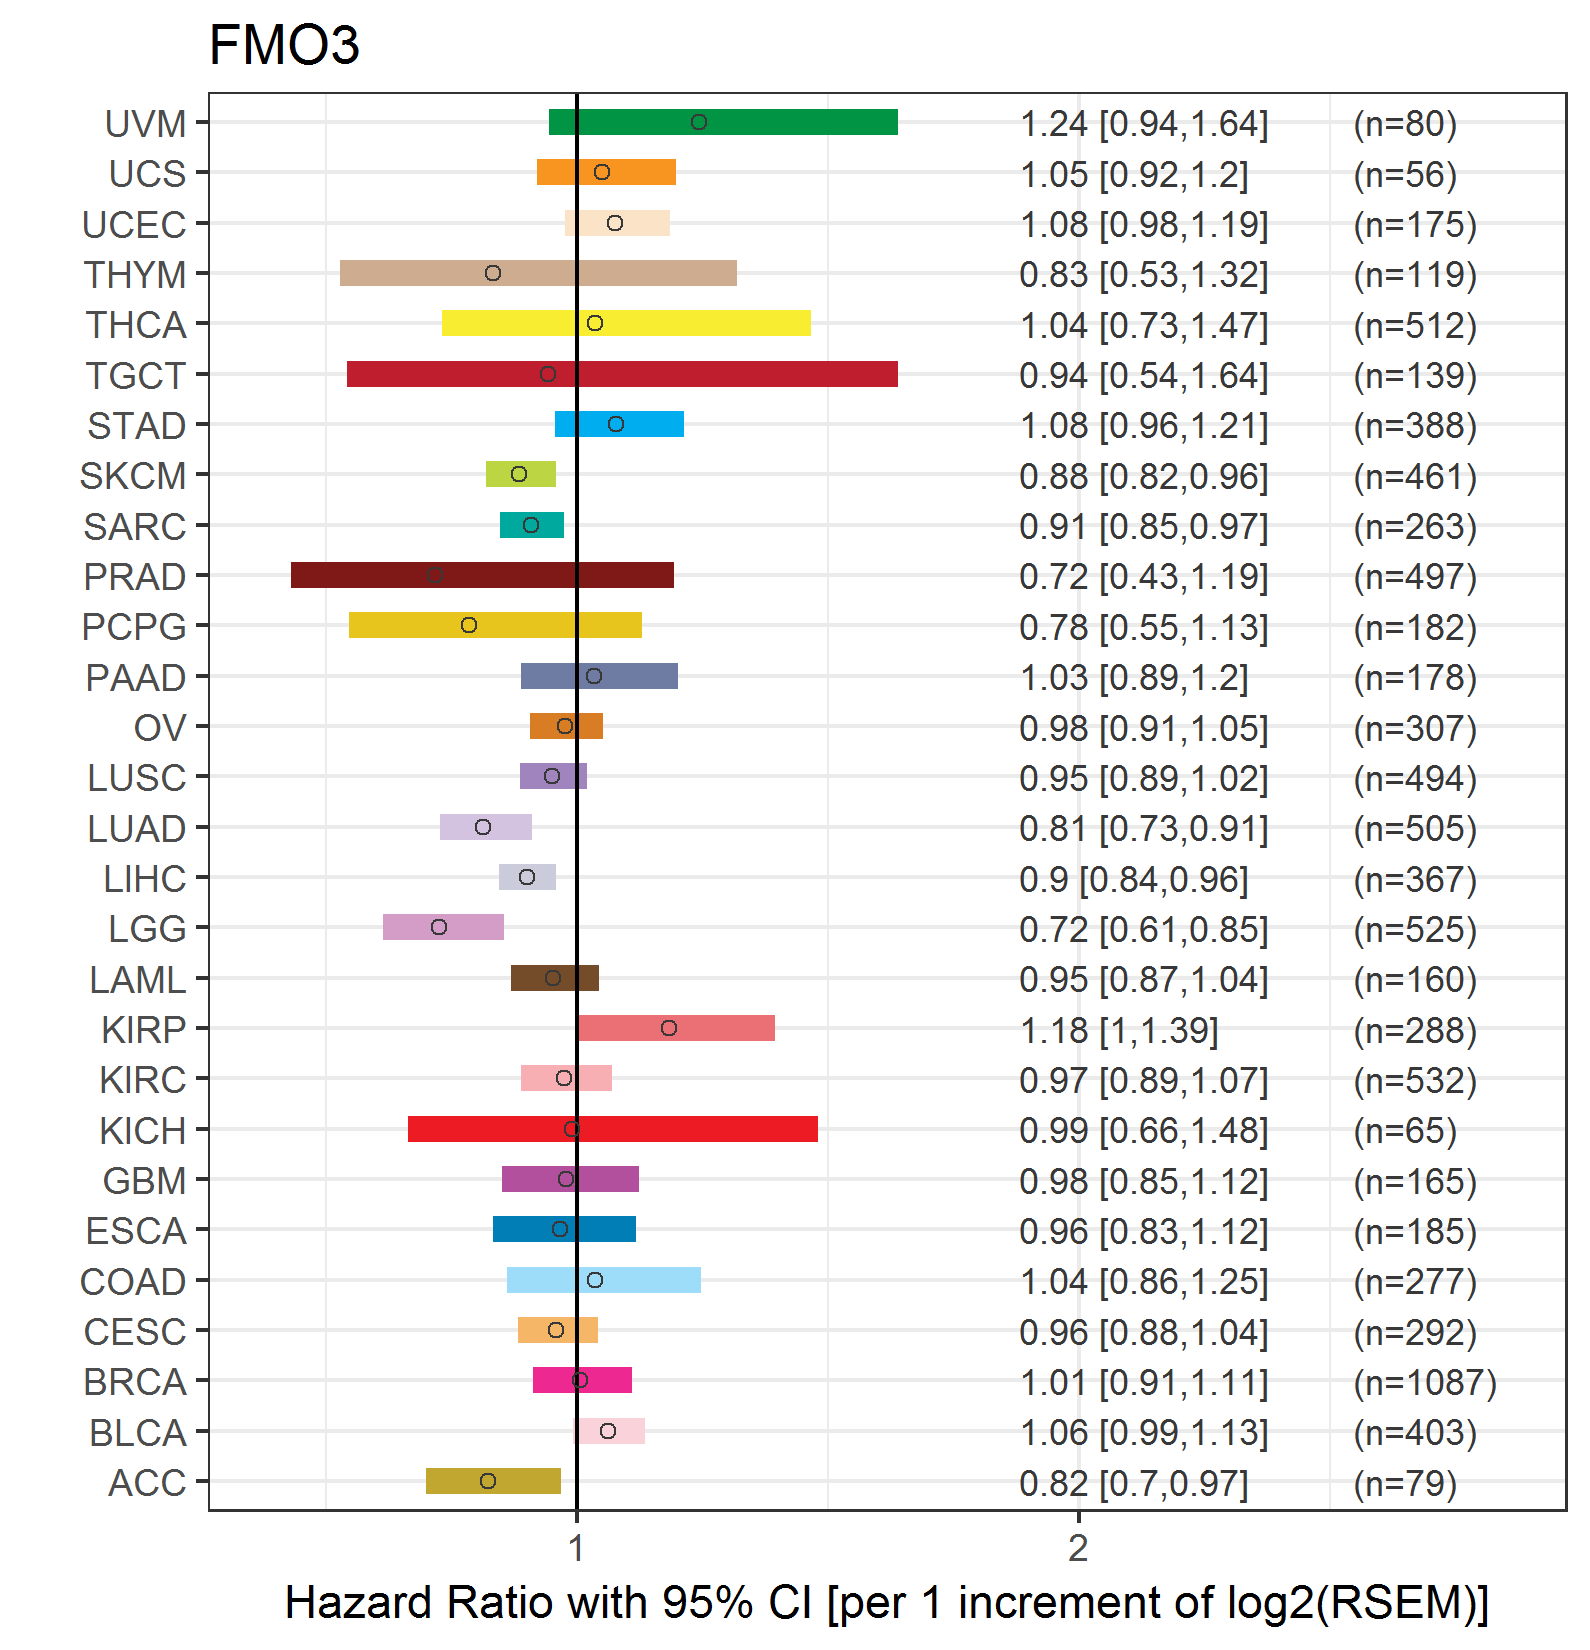
| Forest plot of Cox proportional hazard ratio (HR) and 95% CI of overall survival (OS) using 28 cancer types (TCGA IlluminaHiSeq_RNASeqV2, pan-cancer normalized log2(norm_counts+1) data, version 2016-08-16) (TCGA clinicalMatrix, phenotype data, version 2016-04-27) * Click on the image enlarge it in a new window. |
 |
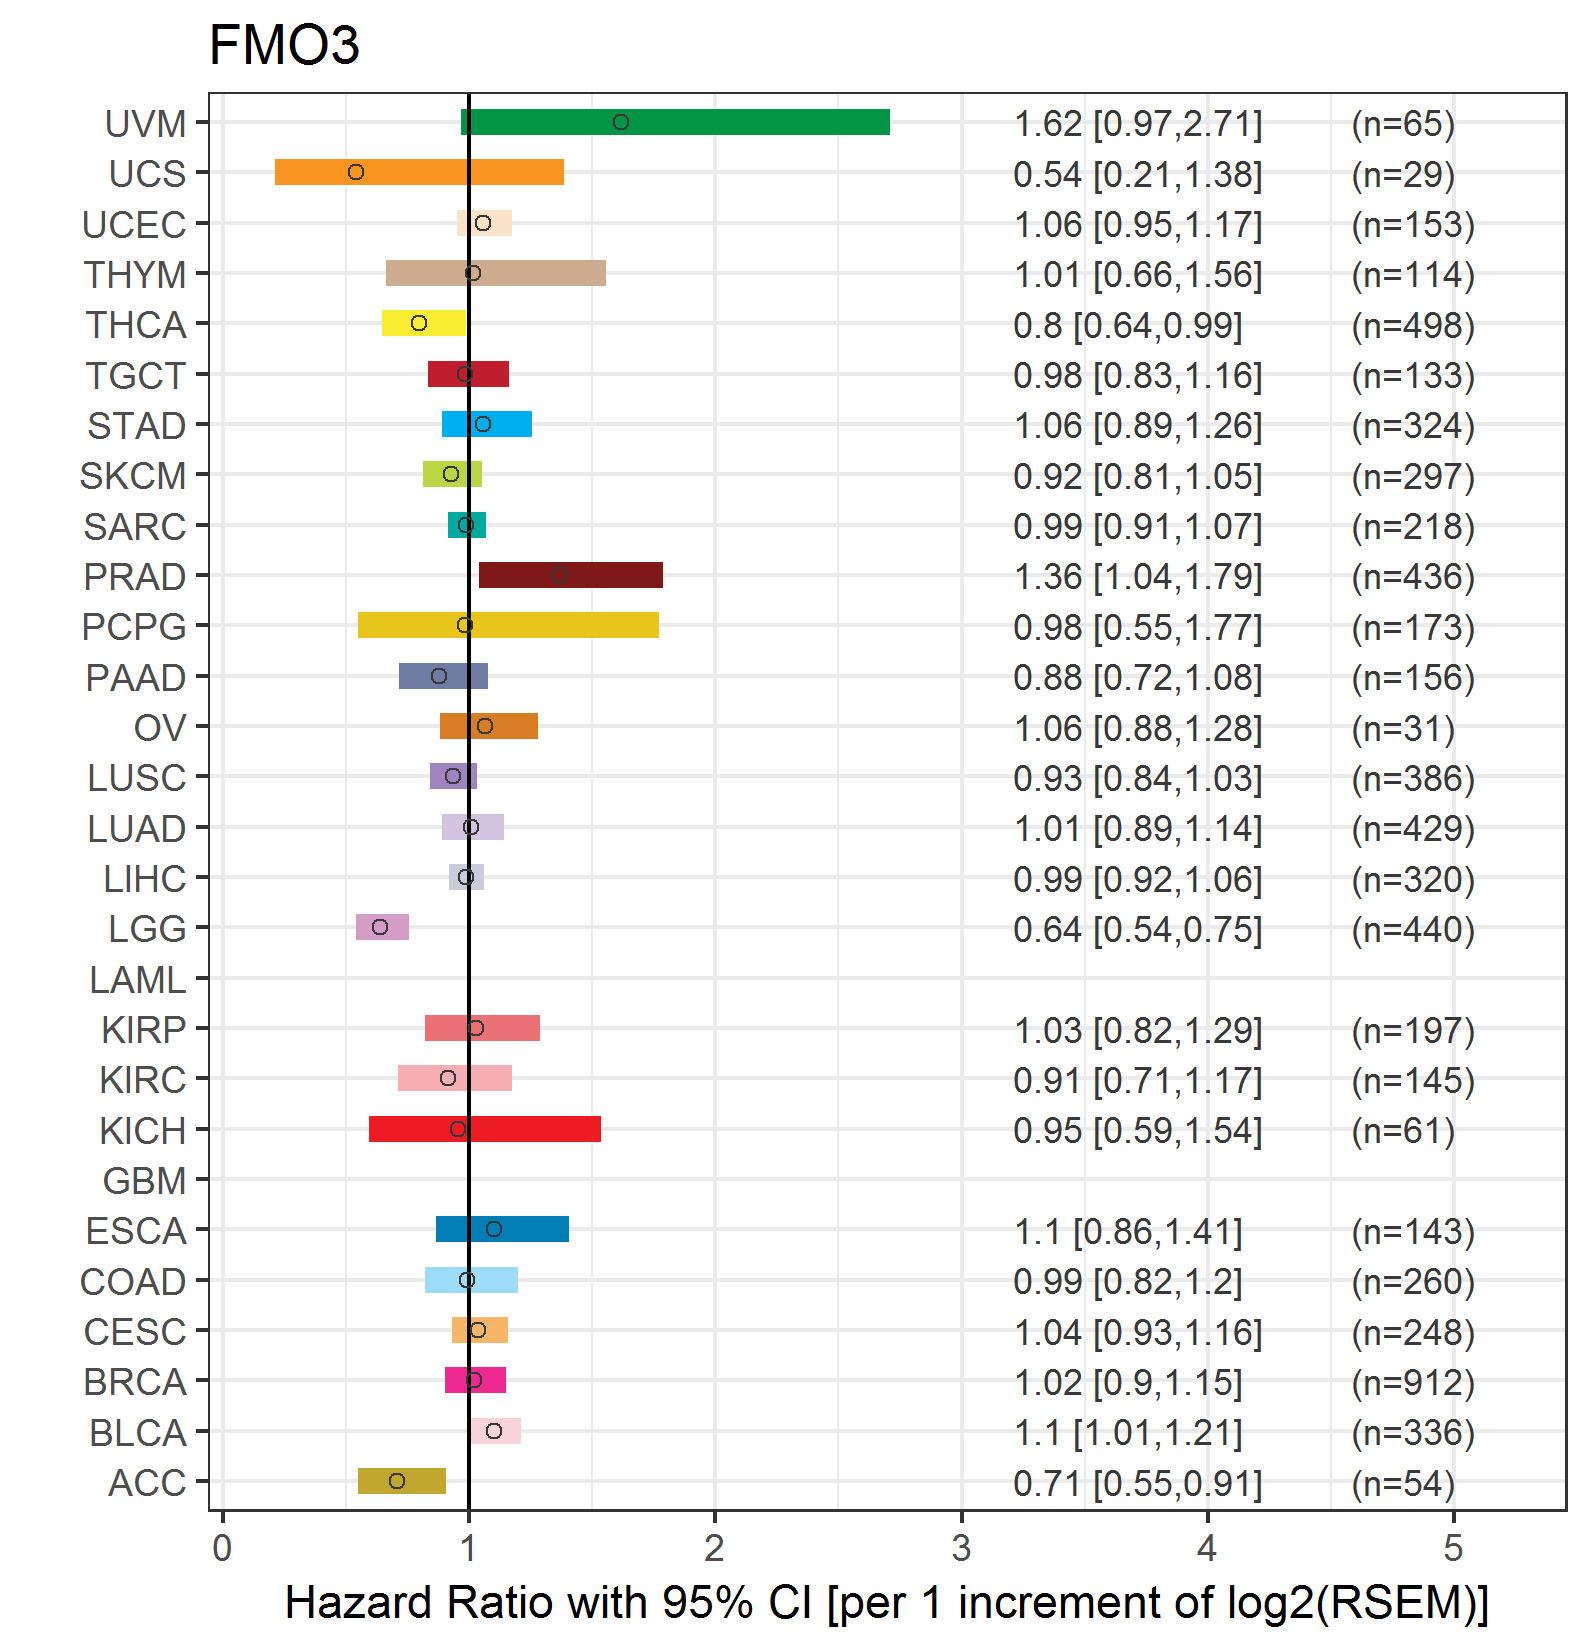
| Forest plot of Cox proportional hazard ratio (HR) and 95% CI of relapse free survival (RFS) using 28 cancer types (TCGA IlluminaHiSeq_RNASeqV2, pan-cancer normalized log2(norm_counts+1) data, version 2016-08-16) (TCGA clinicalMatrix, phenotype data, version 2016-04-27) * Click on the image enlarge it in a new window. |
 |
| Top |
| TissGeneClin for FMO3 |
| TissGeneDrug for FMO3 |
| Drug information targeting TissGene (DrugBank Version 5.0.6, 2017-04-01) |
| DrugBank ID | Drug name | Drug activity | Drug type | Drug status |
| Top |
| TissGeneDisease for FMO3 |
| Disease information associated with TissGene (DisGeNet, 2016-06-01) |
| Disease ID | Disease name | # pubmeds | Source |
| umls:C0342739 | Trimethylaminuria | 28 | BeFree,CLINVAR,CTD_human,UNIPROT |
| umls:C0020538 | Hypertensive disease | 4 | BeFree,GAD,LHGDN |
| umls:C0025517 | Metabolic Diseases | 3 | BeFree |
| umls:C0032580 | Adenomatous Polyposis Coli | 3 | BeFree,CTD_human |
| umls:C0003850 | Arteriosclerosis | 2 | BeFree |
| umls:C0004153 | Atherosclerosis | 2 | BeFree |
| umls:C0032584 | polyps | 2 | BeFree |
| umls:C0334108 | Multiple polyps | 2 | BeFree |
| umls:C1527249 | Colorectal Cancer | 2 | BeFree,GAD |
| umls:C0001430 | Adenoma | 1 | BeFree |
| umls:C0002736 | Amyotrophic Lateral Sclerosis | 1 | BeFree |
| umls:C0009376 | Colonic Polyps | 1 | GAD |
| umls:C0009402 | Colorectal Carcinoma | 1 | BeFree |
| umls:C0011053 | Deafness | 1 | GAD |
| umls:C0017178 | Gastrointestinal Diseases | 1 | BeFree,LHGDN |
| umls:C0018772 | Hearing Loss, Partial | 1 | GAD |
| umls:C0023470 | Myeloid Leukemia | 1 | GAD |
| umls:C0023903 | Liver neoplasms | 1 | BeFree |
| umls:C0031117 | Peripheral Neuropathy | 1 | CTD_human |
| umls:C0036341 | Schizophrenia | 1 | BeFree,GAD |
| umls:C0038644 | Sudden infant death syndrome | 1 | BeFree,GAD |
| umls:C0220603 | childhood brain tumor | 1 | GAD |
| umls:C0242379 | Malignant neoplasm of lung | 1 | BeFree |
| umls:C0684249 | Carcinoma of lung | 1 | BeFree |
| umls:C0746883 | Febrile Neutropenia | 1 | BeFree |
| umls:C0860207 | Drug-Induced Liver Injury | 1 | CTD_human |
| umls:C1384666 | hearing impairment | 1 | GAD |
| umls:C1561549 | Glomerular filtration rate finding | 1 | GAD |
| umls:C2239176 | Liver carcinoma | 1 | BeFree |
| umls:C3887873 | Hearing Loss | 1 | GAD |
|
Copyright 2016-Present - The University of Texas Health Science Center at Houston (UTHealth) Web File Viewing | How to Report, Fraud, Waste and Abuse | State of Texas | Statewide Search | Texas Homeland Security | Site Policies |