 |
| |
| |
| |
| |
| |
| |
|

| TissGeneSummary for SATB2 |
 Gene summary Gene summary |
| Basic gene information | Gene symbol | SATB2 |
| Gene name | SATB homeobox 2 | |
| Synonyms | GLSS | |
| Cytomap | UCSC genome browser: 2q33 | |
| Type of gene | protein-coding | |
| RefGenes | NM_001172509.1, NM_001172517.1,NM_015265.3, | |
| Description | DNA-binding protein SATB2SATB family member 2special AT-rich sequence-binding protein 2 | |
| Modification date | 20141207 | |
| dbXrefs | MIM : 608148 | |
| HGNC : HGNC | ||
| Ensembl : ENSG00000119042 | ||
| HPRD : 12178 | ||
| Vega : OTTHUMG00000132767 | ||
| Protein | UniProt: go to UniProt's Cross Reference DB Table | |
| Expression | CleanEX: HS_SATB2 | |
| BioGPS: 23314 | ||
| Pathway | NCI Pathway Interaction Database: SATB2 | |
| KEGG: SATB2 | ||
| REACTOME: SATB2 | ||
| Pathway Commons: SATB2 | ||
| Context | iHOP: SATB2 | |
| ligand binding site mutation search in PubMed: SATB2 | ||
| UCL Cancer Institute: SATB2 | ||
| Assigned class in TissGDB* | C | |
| Included tissue-specific gene expression resources | TiGER,GTEx | |
| Specific-tissues in normal samples (assigned by TissGDB using HPA, TiGER, and GTEx) | Colon | |
| Cancer types related to the specific-tissues in cancer samples (assigned by TissGDB using TCGA) | COAD | |
| Reference showing the relevant tissue of SATB2 | ||
| Description by TissGene annotations | Have significant anti-correlated miRNA | |
| * Class A consists of genes with literature evidence and is part of the cTissGenes. Class B consists of only cTissGenes without additional evidence. The remaining genes belong to Class C. |
| Gene ontology having evidence of Inferred from Direct Assay (IDA) from Entrez |
| GO ID | GO term | PubMed ID |
| Top |
| TissGeneExp for SATB2 |
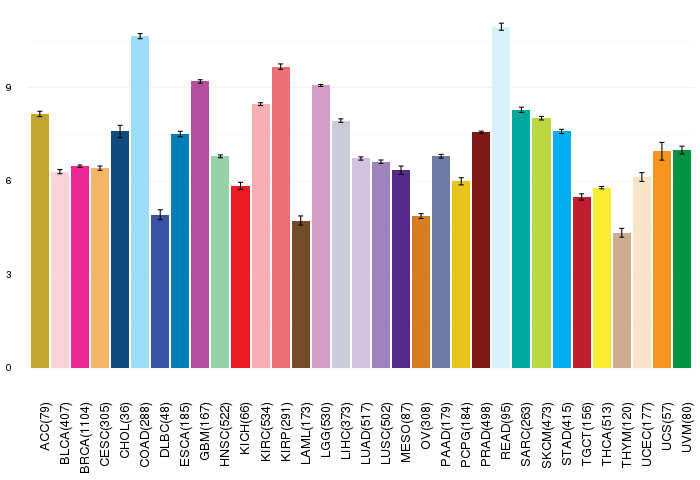
| Gene expressions across 28 cancer types (X-axis: cancer type and Y-axis: log2(norm_counts+1)) (TCGA IlluminaHiSeq_RNASeqV2, pan-cancer normalized log2(norm_counts+1) data, version 2016-08-16) |
 |
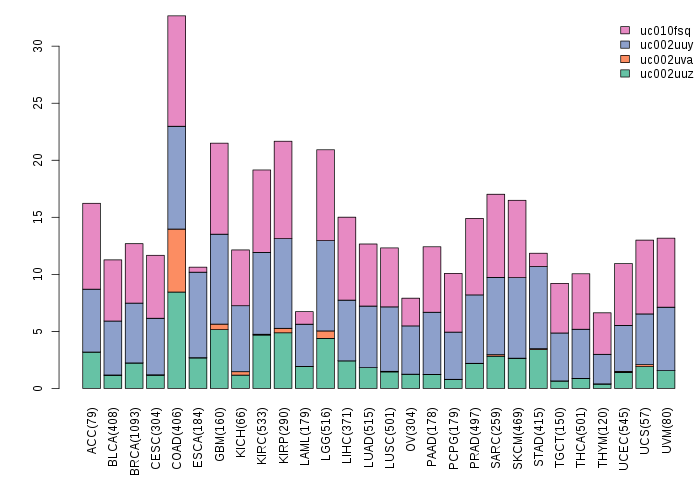
| Gene isoform expressions across 28 cancer types (X-axis: cancer type and Y-axis: log2(norm_counts+1)) (TCGA pan-cancer tcga_rsem_isoform_tpm, version 2016-09-01) |
 |
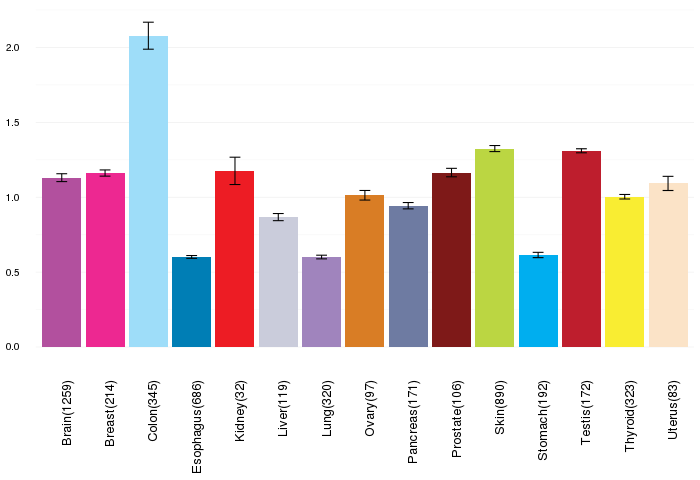
| Gene expressions across normal tissues of GTEx data (GTEx GTEx_Analysis_v6_RNA-seq_RNA-SeQCv1.1.8_gene_rpkm.gct) - Here, we shows the matched tissue types only among our 28 cancer types. |
 |
| Different expressions across 14 cancer types with more than 10 samples between matched tumors and normals (X-axis: cancer type and Y-axis: log2(norm_counts+1)) (TCGA IlluminaHiSeq_RNASeqV2, pan-cancer normalized log2(norm_counts+1) data, version 2016-08-16) |
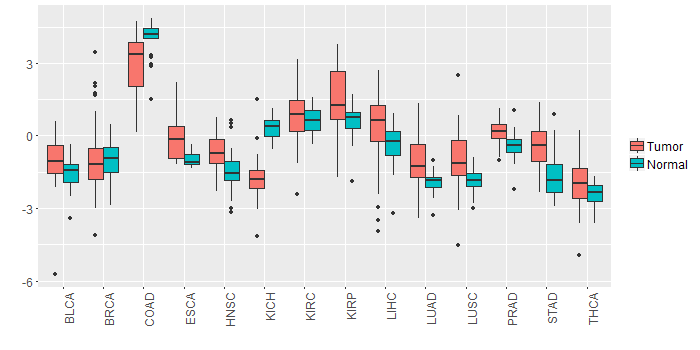 |
| - Significantly differentially expressed cancer types and information. (|Fold change|>1 and FDR<0.05) |
| Cancer type | Mean(exp) in tumor | Mean(exp) in matched normal | Log2FC | P-val. | FDR |
| KICH | -1.762388715 | 0.330967285 | -2.093356 | 1.08E-10 | 8.29E-10 |
| STAD | -0.370611715 | -1.65131484 | 1.280703125 | 7.51E-07 | 1.28E-05 |
| COAD | 2.945020978 | 4.052413285 | -1.107392308 | 0.000888 | 0.002576454 |
| Top |
| TissGene-miRNA for SATB2 |
| Significantly anti-correlated miRNAs of TissGene across 28 cancer types (Gene-miRNA relations from TargetScanHuman Relsease 7.1, Conserved_Site_Context_Scores.txt.zip, 06.01.2016) (TCGA IlluminaHiSeq_miRNASeq, log2(RPM+1) data, version 2016-11-21) (TCGA IlluminaHiSeq_RNASeqV2, log2(normalized_count+1) data, version 2016-08-16) (Spearman’s Rank Correlation (p-value<0.05 and coefficient<-0.25)) |
| Cancer type | miRNA id | miRNA accession | P-val. | Coeff. | # samples |
| ACC | hsa-miR-128-3p | MIMAT0000424 | 0.019 | -0.27 | 78 |
| ACC | hsa-miR-128-3p | MIMAT0000424 | 0.019 | -0.27 | 78 |
| UCS | hsa-miR-34a-5p | MIMAT0000255 | 0.0083 | -0.35 | 56 |
| Top |
| TissGeneMut for SATB2 |
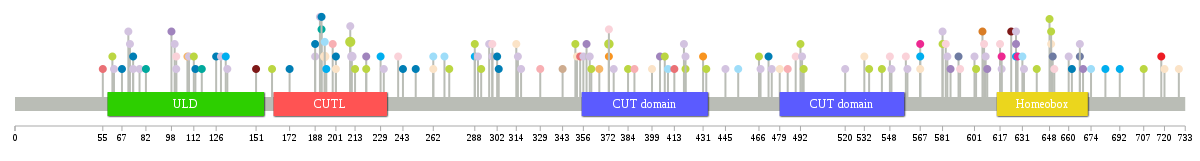
| TissGeneSNV for SATB2 |
| nsSNV counts per each loci. Different colors of circles represent different cancer types. Circle size denotes number of samples. (TCGA somatic mutation (SNPs and small INDELs) data, version 2016-04-25) * Click on the image to enlarge it in a new window. |
 |
 |
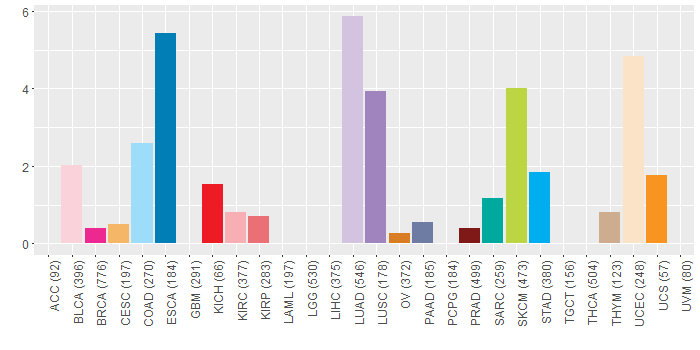
| Somatic nucleotide variants of TissGene across 28 cancer types (X-axis: cancer type and Y-axis: % of mutated samples) The numbers in parentheses are numbers of samples with mutation (nsSNVs). (TCGA somatic mutation (SNPs and small INDELs) data, version 2016-04-25) |
 |
| - nsSNVs sorted by frequency. |
| AAchange | Cancer type | # samples |
| p.E210K | SKCM | 3 |
| p.E194* | UCEC | 2 |
| p.Q211H | LUAD | 2 |
| p.R372C | SKCM | 2 |
| p.R618H | BRCA | 1 |
| p.R567C | BRCA | 1 |
| p.Q592* | HNSC | 1 |
| p.E729K | UCEC | 1 |
| p.R559L | LUAD | 1 |
| p.S101* | LUAD | 1 |
| p.T132P | STAD | 1 |
| p.R117C | SARC | 1 |
| p.E210K | LUAD | 1 |
| p.D609G | LUSC | 1 |
| p.E692D | STAD | 1 |
| p.A650V | PAAD | 1 |
| p.R431H | READ | 1 |
| p.S453N | COAD | 1 |
| p.C100F | LUAD | 1 |
| p.Q651* | BLCA | 1 |
| p.H172Q | ESCA | 1 |
| p.S707F | SKCM | 1 |
| p.Q220H | LUSC | 1 |
| p.E584* | LUAD | 1 |
| p.H113Q | ESCA | 1 |
| p.V520L | LUAD | 1 |
| p.R431C | UCS | 1 |
| p.Q188H | ESCA | 1 |
| p.V358M | LUSC | 1 |
| p.V495A | HNSC | 1 |
| p.S356Y | LUAD | 1 |
| p.G627W | STAD | 1 |
| p.S558F | BLCA | 1 |
| p.Q201H | ESCA | 1 |
| p.E74Q | ESCA | 1 |
| p.P543S | SKCM | 1 |
| p.C195Y | STAD | 1 |
| p.R484C | KIRC | 1 |
| p.Q592* | BLCA | 1 |
| p.V354L | KIRP | 1 |
| p.P640S | SKCM | 1 |
| p.I660M | LUAD | 1 |
| p.D632E | LUAD | 1 |
| p.R532C | UCEC | 1 |
| p.D74Y | LUAD | 1 |
| p.R667W | PAAD | 1 |
| p.G62* | LUAD | 1 |
| p.L243H | ESCA | 1 |
| p.D494N | SKCM | 1 |
| p.P272L | SKCM | 1 |
| p.S648F | SKCM | 1 |
| p.Q583H | BLCA | 1 |
| p.P548L | BLCA | 1 |
| p.V636L | HNSC | 1 |
| p.S101P | BLCA | 1 |
| p.Q433E | SKCM | 1 |
| p.Q191H | LUAD | 1 |
| p.V577L | HNSC | 1 |
| p.P351L | SKCM | 1 |
| p.A479T | UCEC | 1 |
| p.Q375L | LUAD | 1 |
| p.S109T | LUAD | 1 |
| p.A420S | LUAD | 1 |
| p.Q607* | BLCA | 1 |
| p.R543H | HNSC | 1 |
| p.D662H | ESCA | 1 |
| p.R618L | LUAD | 1 |
| p.G71V | LUAD | 1 |
| p.P292L | SKCM | 1 |
| p.R88Q | HNSC | 1 |
| p.E649K | SKCM | 1 |
| p.N361K | SKCM | 1 |
| p.N420K | SKCM | 1 |
| p.S407L | SKCM | 1 |
| p.N472T | ESCA | 1 |
| p.D133Y | LUAD | 1 |
| p.R567C | HNSC | 1 |
| p.M201I | UCEC | 1 |
| p.P602S | SKCM | 1 |
| p.R508C | HNSC | 1 |
| p.P581L | LUAD | 1 |
| p.A82T | READ | 1 |
| p.I628F | BRCA | 1 |
| p.R484H | HNSC | 1 |
| p.L445M | LUAD | 1 |
| p.Q409R | COAD | 1 |
| p.R667L | LUAD | 1 |
| p.Q231L | LUAD | 1 |
| p.A314T | UCEC | 1 |
| p.S72F | LUAD | 1 |
| p.Q220P | SKCM | 1 |
| p.Q129H | LUAD | 1 |
| p.P581S | SKCM | 1 |
| p.Q360H | LUAD | 1 |
| p.R493G | LUAD | 1 |
| p.Q586L | LUSC | 1 |
| p.R567C | UCEC | 1 |
| p.V554A | HNSC | 1 |
| p.E549K | LUAD | 1 |
| p.A229T | STAD | 1 |
| p.S631C | COAD | 1 |
| p.Q290L | LUAD | 1 |
| p.S466L | SKCM | 1 |
| p.Q161P | SKCM | 1 |
| p.R192H | SARC | 1 |
| p.E269K | COAD | 1 |
| p.Q492E | SKCM | 1 |
| p.I601M | LUAD | 1 |
| p.I154M | HNSC | 1 |
| p.N388S | KIRC | 1 |
| p.E98D | LUSC | 1 |
| p.A288T | STAD | 1 |
| p.L67V | ESCA | 1 |
| p.R372H | BLCA | 1 |
| p.R78T | LUAD | 1 |
| p.R372C | UCS | 1 |
| p.S617F | BLCA | 1 |
| p.P404T | LUSC | 1 |
| p.Y151* | PRAD | 1 |
| p.Q366* | CESC | 1 |
| p.S240C | BLCA | 1 |
| p.V413L | KIRP | 1 |
| p.S297Y | LUAD | 1 |
| p.Q419H | LUAD | 1 |
| p.E194K | COAD | 1 |
| p.V627L | LUAD | 1 |
| p.S299C | BLCA | 1 |
| p.P489L | BLCA | 1 |
| p.A591V | PAAD | 1 |
| p.A720T | UCEC | 1 |
| p.F421S | DLBC | 1 |
| p.S317I | LUAD | 1 |
| p.Q188H | LUAD | 1 |
| p.R608L | LUAD | 1 |
| p.R288K | SKCM | 1 |
| p.E352D | UCEC | 1 |
| p.E269K | READ | 1 |
| p.A112V | SKCM | 1 |
| p.R567H | STAD | 1 |
| p.L302H | ESCA | 1 |
| p.P343T | THYM | 1 |
| p.P61S | SKCM | 1 |
| p.S535F | SKCM | 1 |
| p.A683V | STAD | 1 |
| p.V55L | KIRP | 1 |
| p.P606L | OV | 1 |
| p.G674V | COAD | 1 |
| p.A262V | COAD | 1 |
| p.R315M | LUAD | 1 |
| p.N329S | KIRC | 1 |
| p.R399H | UCEC | 1 |
| p.R192H | ESCA | 1 |
| p.D82N | SARC | 1 |
| p.E718K | KICH | 1 |
| p.P303S | ESCA | 1 |
| p.P213L | SKCM | 1 |
| p.L126V | ESCA | 1 |
| p.T474N | LUAD | 1 |
| p.N467I | LUAD | 1 |
| p.R251H | ESCA | 1 |
| p.Q199X | KIRC | 1 |
| p.S649L | UCEC | 1 |
| p.V299A | LUAD | 1 |
| p.A262T | UCEC | 1 |
| p.Q651* | HNSC | 1 |
| p.L538P | DLBC | 1 |
| p.H669Y | LUSC | 1 |
| p.G627A | LUSC | 1 |
| p.A624T | PRAD | 1 |
| p.H108D | CESC | 1 |
| p.P384S | SKCM | 1 |
| Top |
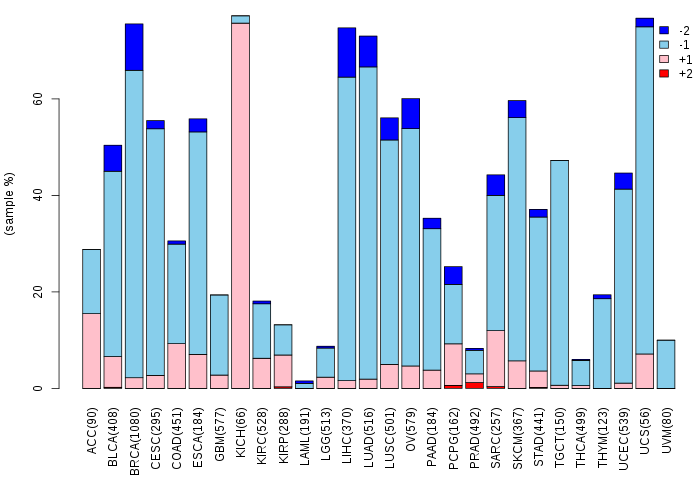
| TissGeneCNV for SATB2 |
| Copy number variations of TissGene across 28 cancer types (X-axis: cancer type and Y-axis: % of CNV samples) (TCGA Gistic2_CopyNumber_Gistic2_all_data_by_genes, Gistic2 copy number data, version 2016-08-16) |
 |
| Top |
| TissGeneFusions for SATB2 |
| Fusion genes including TissGene (ChimerDB 3.0, 2016-12-01 and TCGA fusion Portal 2015-12-01) |
| Database | Src | Cancer type | Sample | Fusion gene | ORF | 5'-gene BP | 3'-gene BP |
| Chimerdb3.0 | ChiTaRs | NA | BF756278 | SATB2-SATB2 | chr2:200298239 | chr2:200233326 | |
| Chimerdb3.0 | ChiTaRs | NA | BE700169 | SATB2-SATB2 | chr2:200173664 | chr2:200213550 | |
| Chimerdb3.0 | ChiTaRs | NA | BF363056 | SATB2-PIK3C2B | chr2:200173657 | chr1:204393709 | |
| TCGAfusionPortal | PRADA | BLCA | TCGA-BL-A13J-01A | HDAC4-SATB2 | CDS-5UTR | Chr2:240158289 | Chr2:200325255 |
| Top |
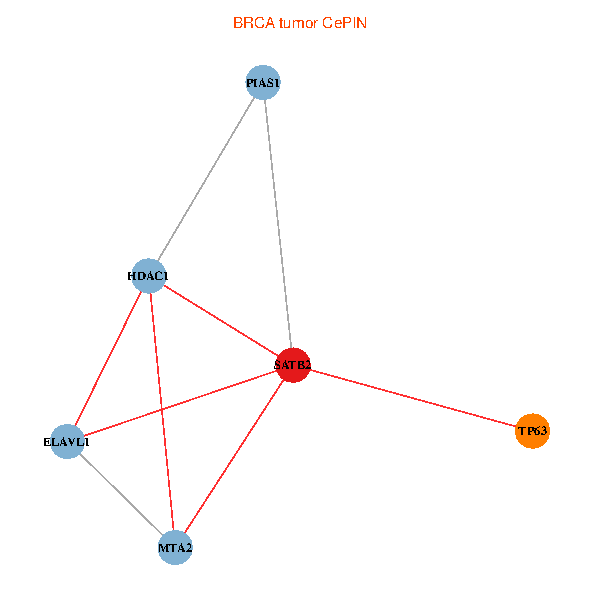
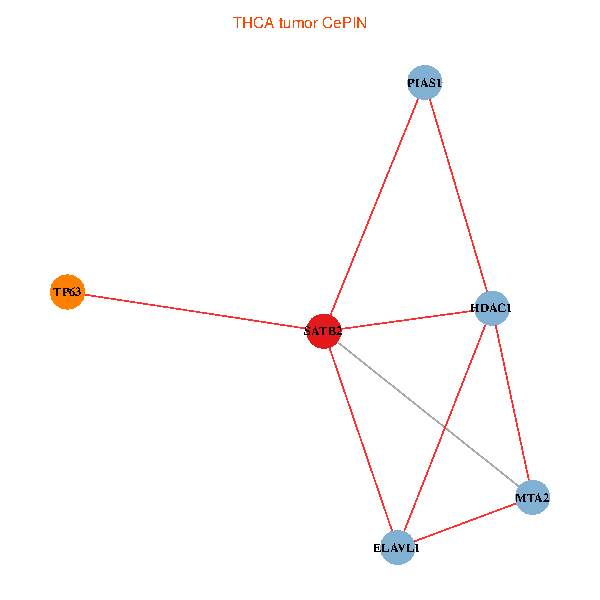
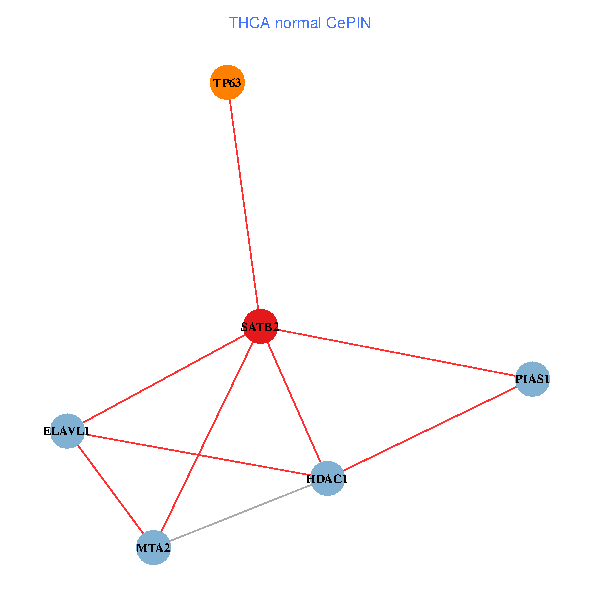
| TissGeneNet for SATB2 |
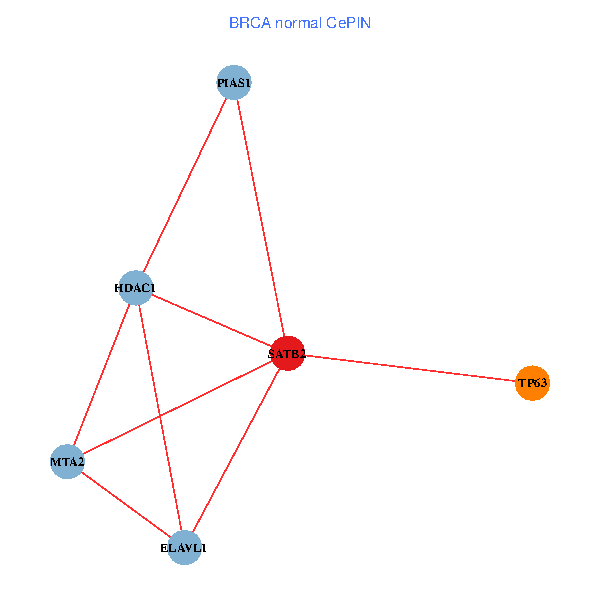
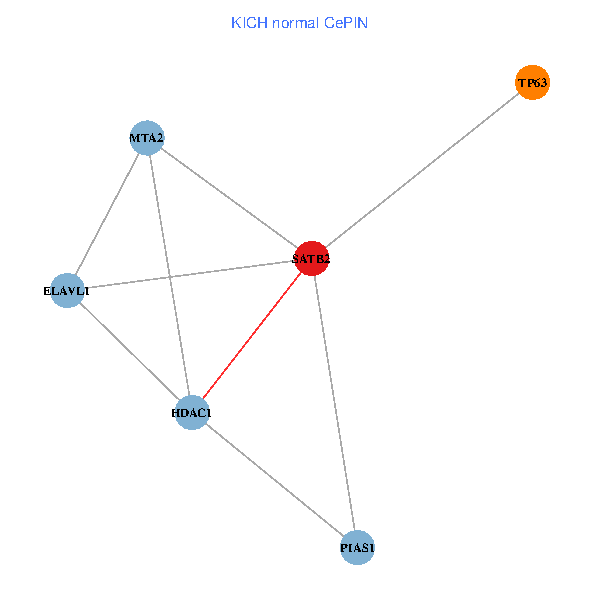
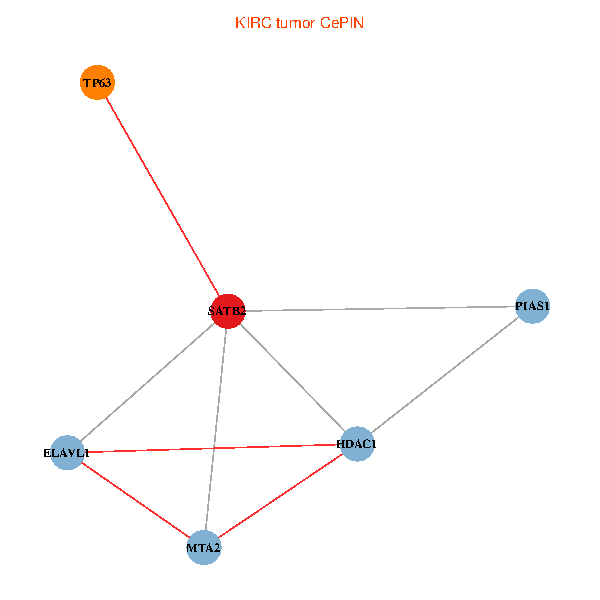
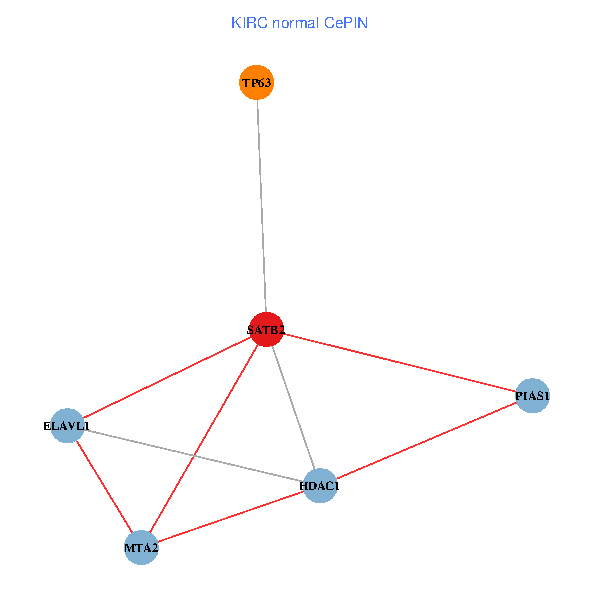
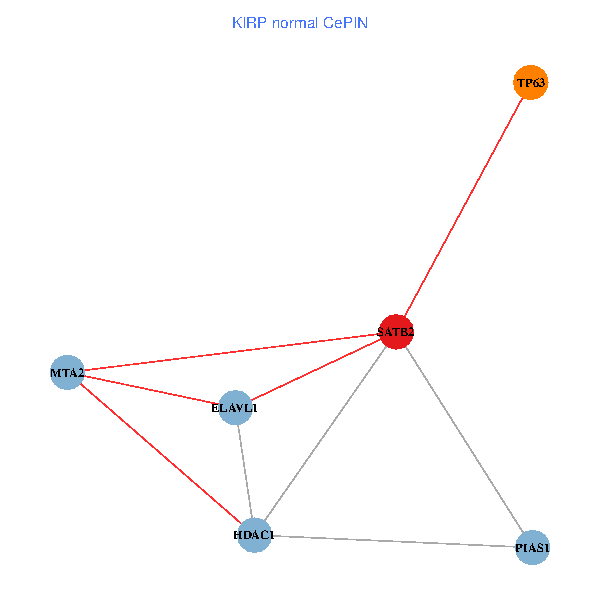
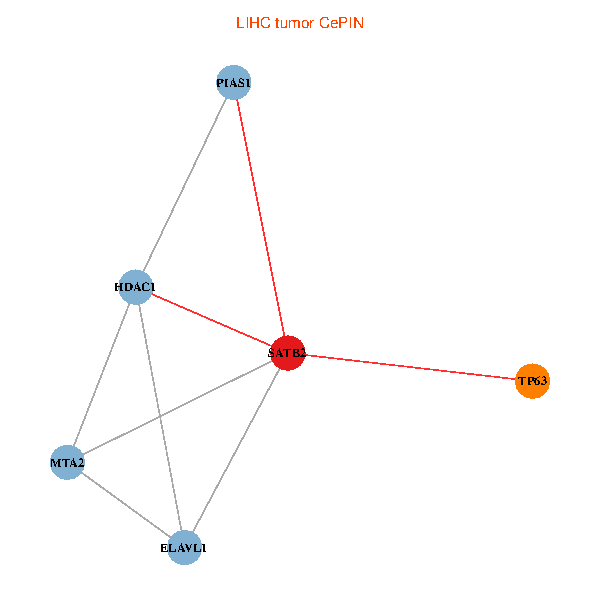
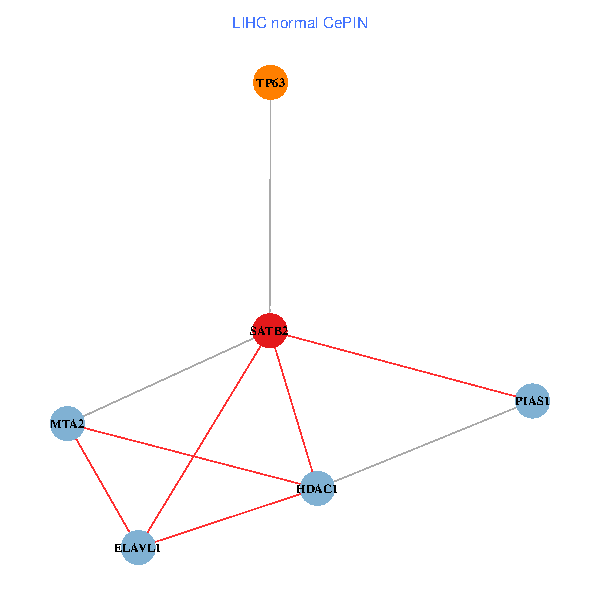
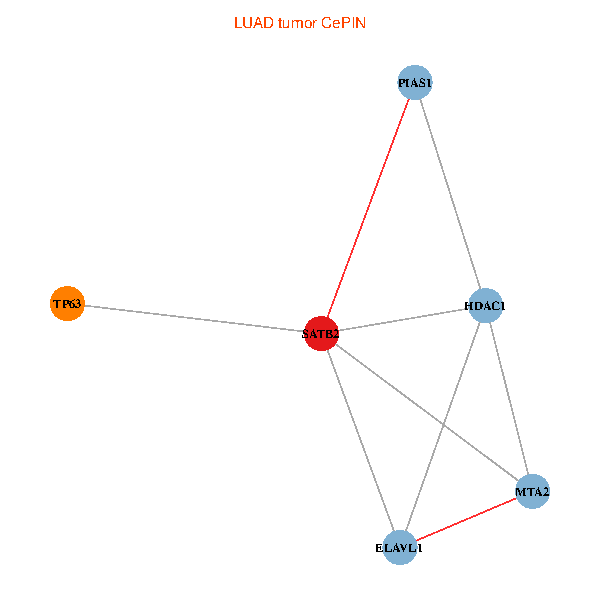
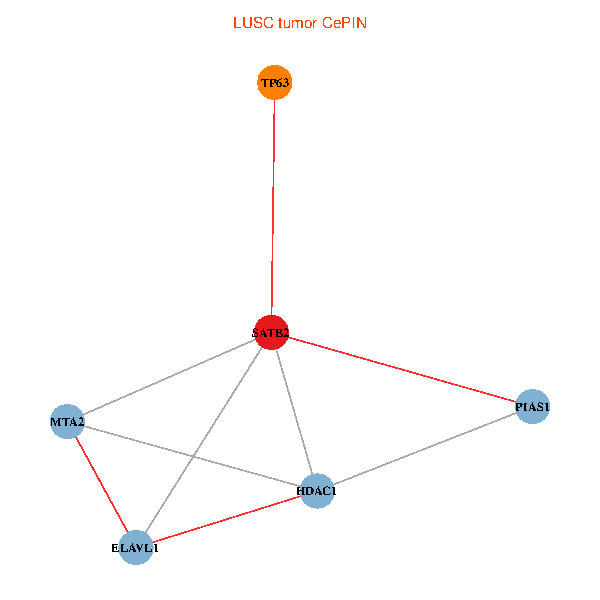
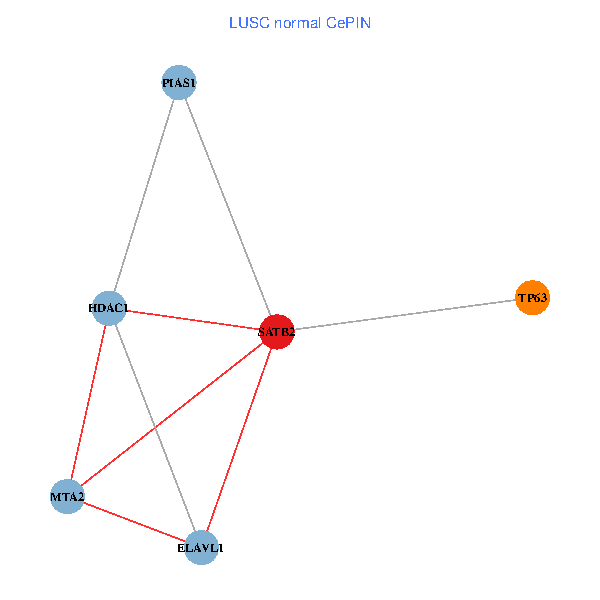
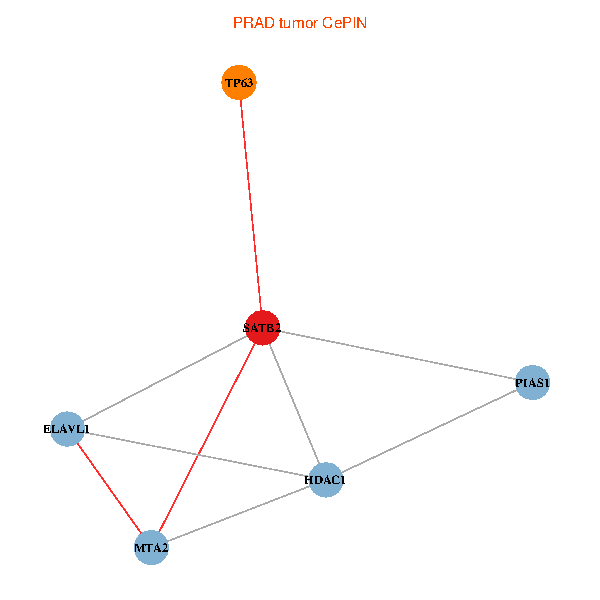
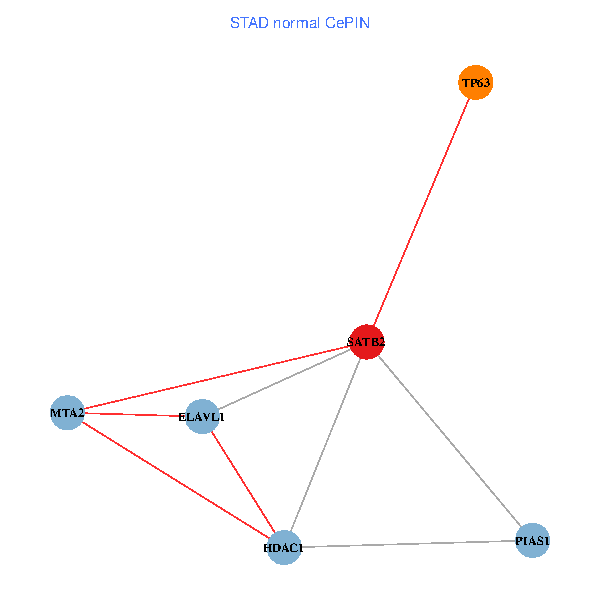
| Co-expressed gene networks based on protein-protein interaction data (CePIN) (TCGA IlluminaHiSeq_RNASeqV2, pan-cancer normalized log2(norm_counts+1) data, version 2016-08-16) (PINA2 ppi data) |
| BRCA (tumor) | BRCA (normal) |
| SATB2, TP63, ELAVL1, HDAC1, MTA2, PIAS1 (tumor) | SATB2, TP63, ELAVL1, HDAC1, MTA2, PIAS1 (normal) |
 |  |
| COAD (tumor) | COAD (normal) |
| SATB2, TP63, ELAVL1, HDAC1, MTA2, PIAS1 (tumor) | SATB2, TP63, ELAVL1, HDAC1, MTA2, PIAS1 (normal) |
 |  |
| HNSC (tumor) | HNSC (normal) |
| SATB2, TP63, ELAVL1, HDAC1, MTA2, PIAS1 (tumor) | SATB2, TP63, ELAVL1, HDAC1, MTA2, PIAS1 (normal) |
 |  |
| KICH (tumor) | KICH (normal) |
| SATB2, TP63, ELAVL1, HDAC1, MTA2, PIAS1 (tumor) | SATB2, TP63, ELAVL1, HDAC1, MTA2, PIAS1 (normal) |
 |  |
| KIRC (tumor) | KIRC (normal) |
| SATB2, TP63, ELAVL1, HDAC1, MTA2, PIAS1 (tumor) | SATB2, TP63, ELAVL1, HDAC1, MTA2, PIAS1 (normal) |
 |  |
| KIRP (tumor) | KIRP (normal) |
| SATB2, TP63, ELAVL1, HDAC1, MTA2, PIAS1 (tumor) | SATB2, TP63, ELAVL1, HDAC1, MTA2, PIAS1 (normal) |
 |  |
| LIHC (tumor) | LIHC (normal) |
| SATB2, TP63, ELAVL1, HDAC1, MTA2, PIAS1 (tumor) | SATB2, TP63, ELAVL1, HDAC1, MTA2, PIAS1 (normal) |
 |  |
| LUAD (tumor) | LUAD (normal) |
| SATB2, TP63, ELAVL1, HDAC1, MTA2, PIAS1 (tumor) | SATB2, TP63, ELAVL1, HDAC1, MTA2, PIAS1 (normal) |
 |  |
| LUSC (tumor) | LUSC (normal) |
| SATB2, TP63, ELAVL1, HDAC1, MTA2, PIAS1 (tumor) | SATB2, TP63, ELAVL1, HDAC1, MTA2, PIAS1 (normal) |
 |  |
| PRAD (tumor) | PRAD (normal) |
| SATB2, TP63, ELAVL1, HDAC1, MTA2, PIAS1 (tumor) | SATB2, TP63, ELAVL1, HDAC1, MTA2, PIAS1 (normal) |
 |  |
| STAD (tumor) | STAD (normal) |
| SATB2, TP63, ELAVL1, HDAC1, MTA2, PIAS1 (tumor) | SATB2, TP63, ELAVL1, HDAC1, MTA2, PIAS1 (normal) |
 |  |
| THCA (tumor) | THCA (normal) |
| SATB2, TP63, ELAVL1, HDAC1, MTA2, PIAS1 (tumor) | SATB2, TP63, ELAVL1, HDAC1, MTA2, PIAS1 (normal) |
 |  |
| Top |
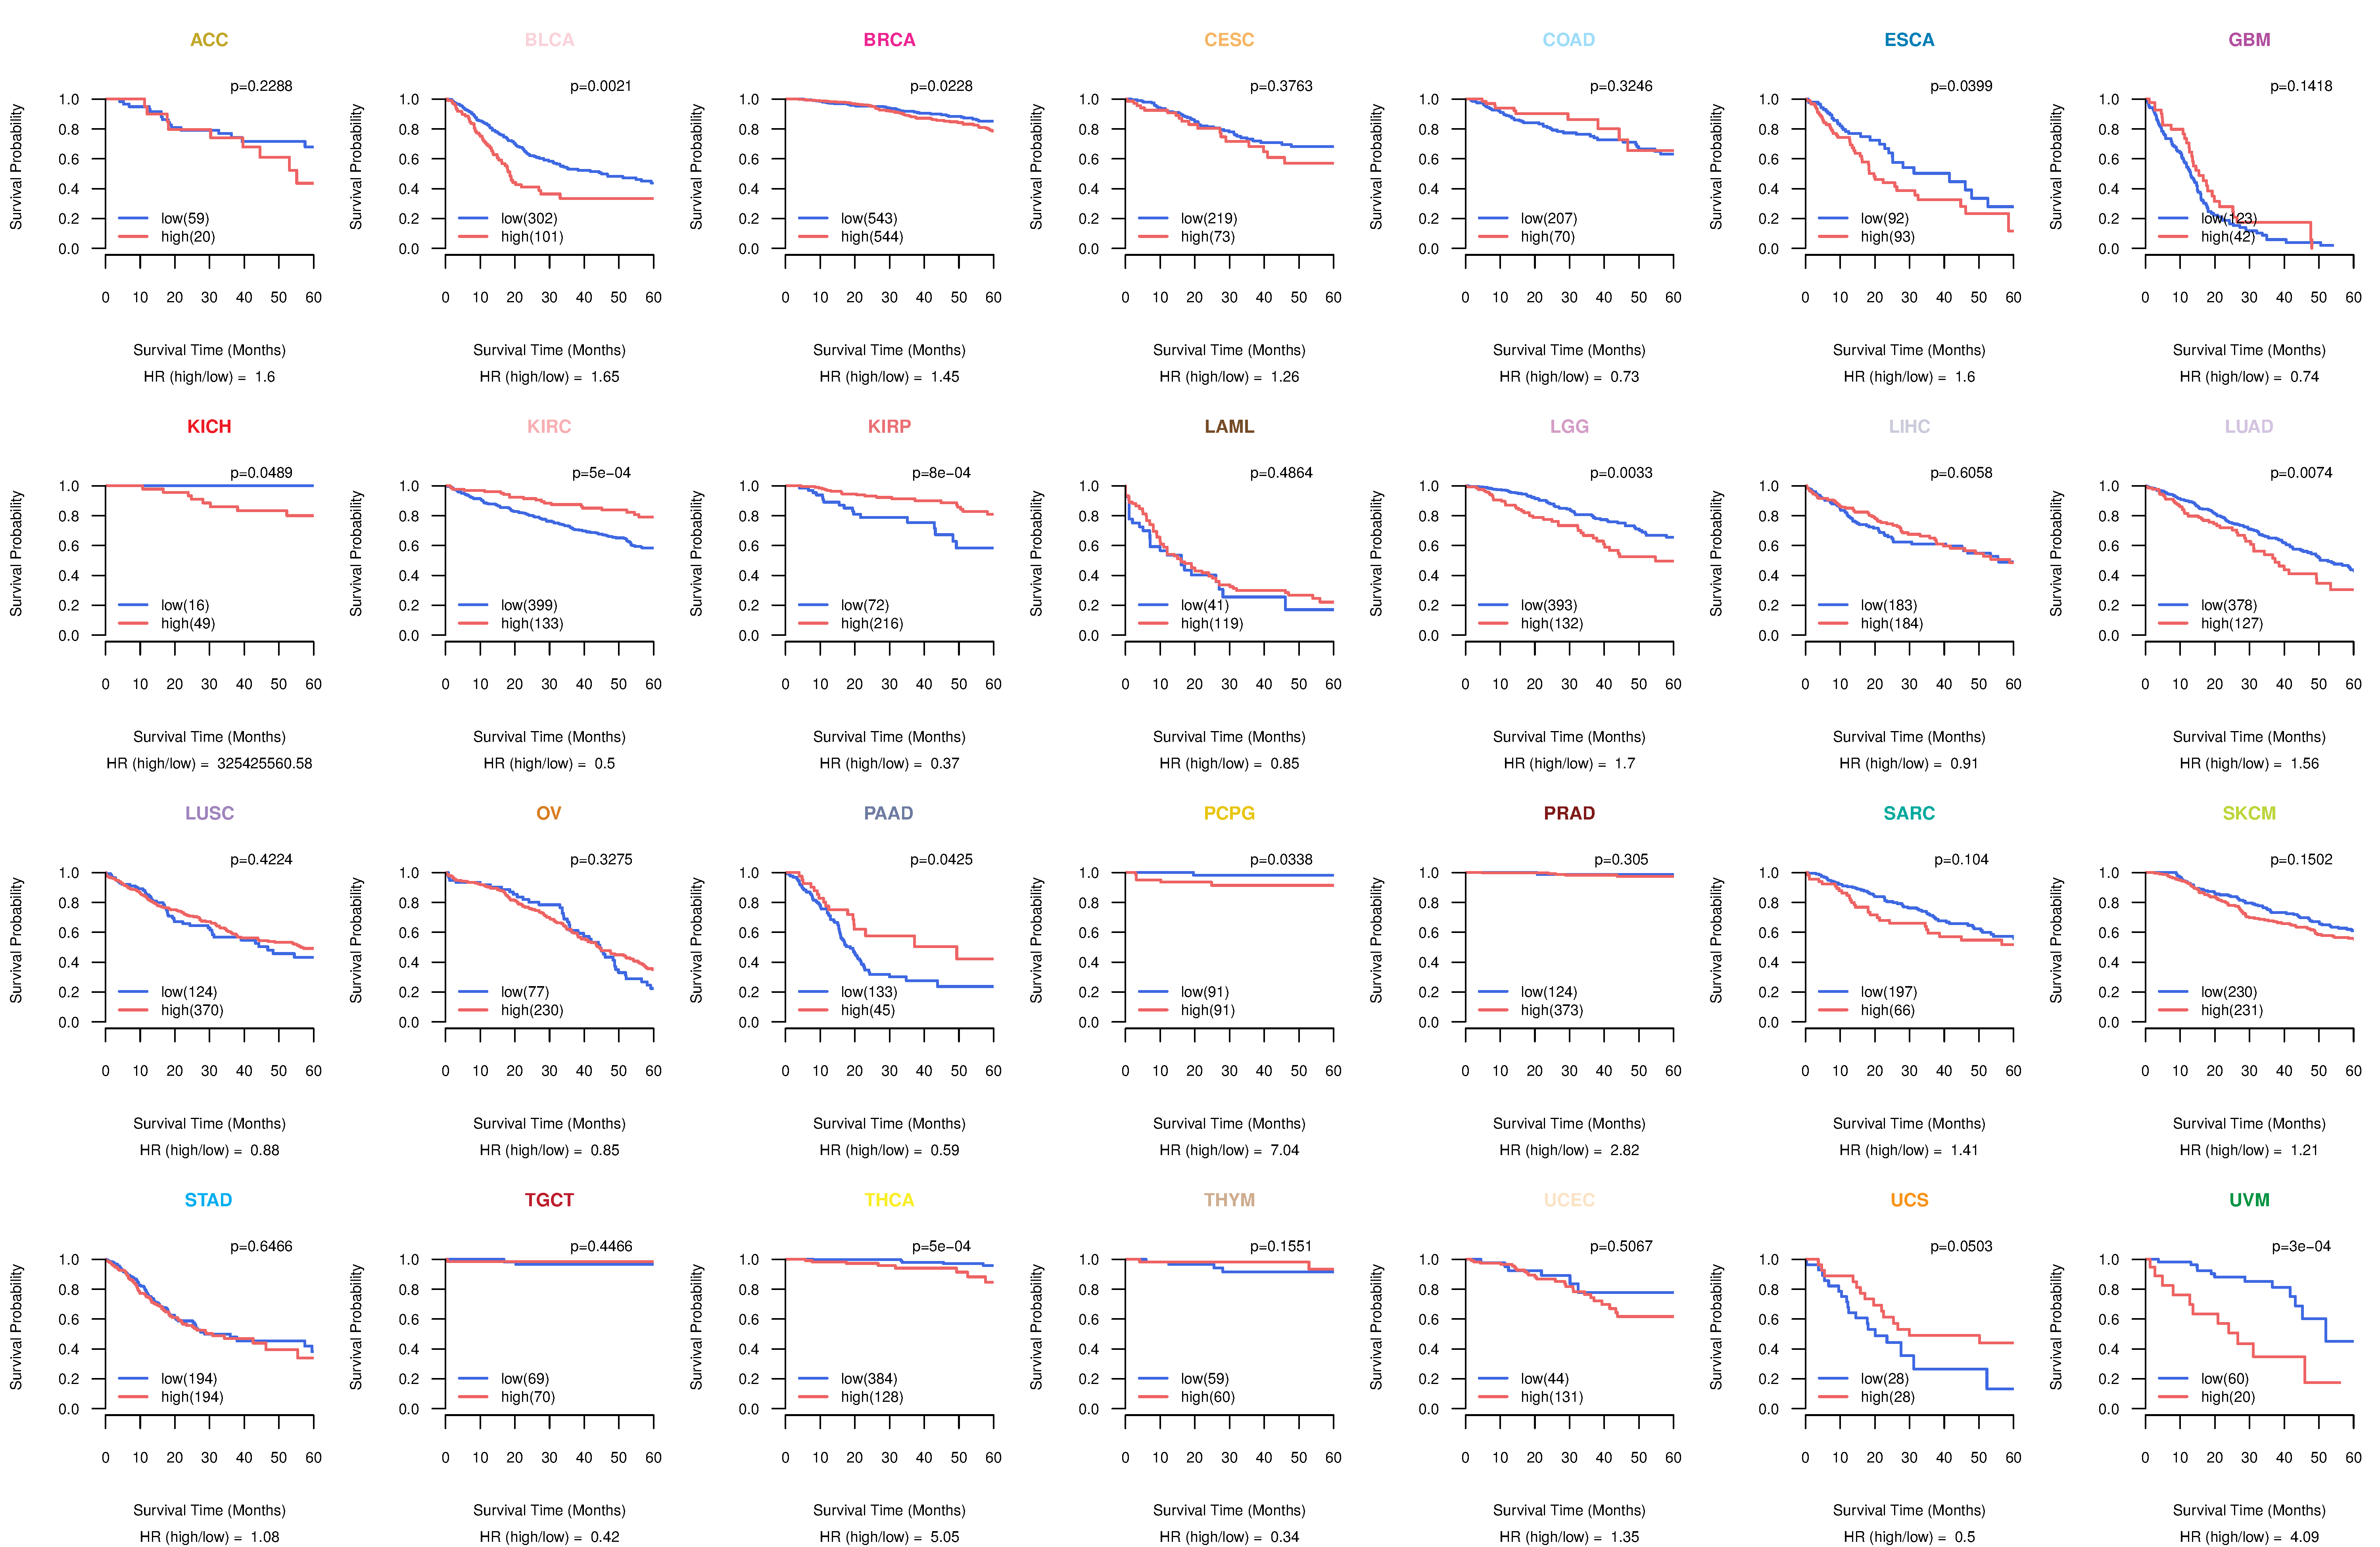
| TissGeneProg for SATB2 |
| Kaplan-Meier plots with logrank tests of overall survival (OS) using 28 cancer types (TCGA IlluminaHiSeq_RNASeqV2, pan-cancer normalized log2(norm_counts+1) data, version 2016-08-16) (TCGA clinicalMatrix, phenotype data, version 2016-04-27) * Click on the image to enlarge it in a new window. |
 |
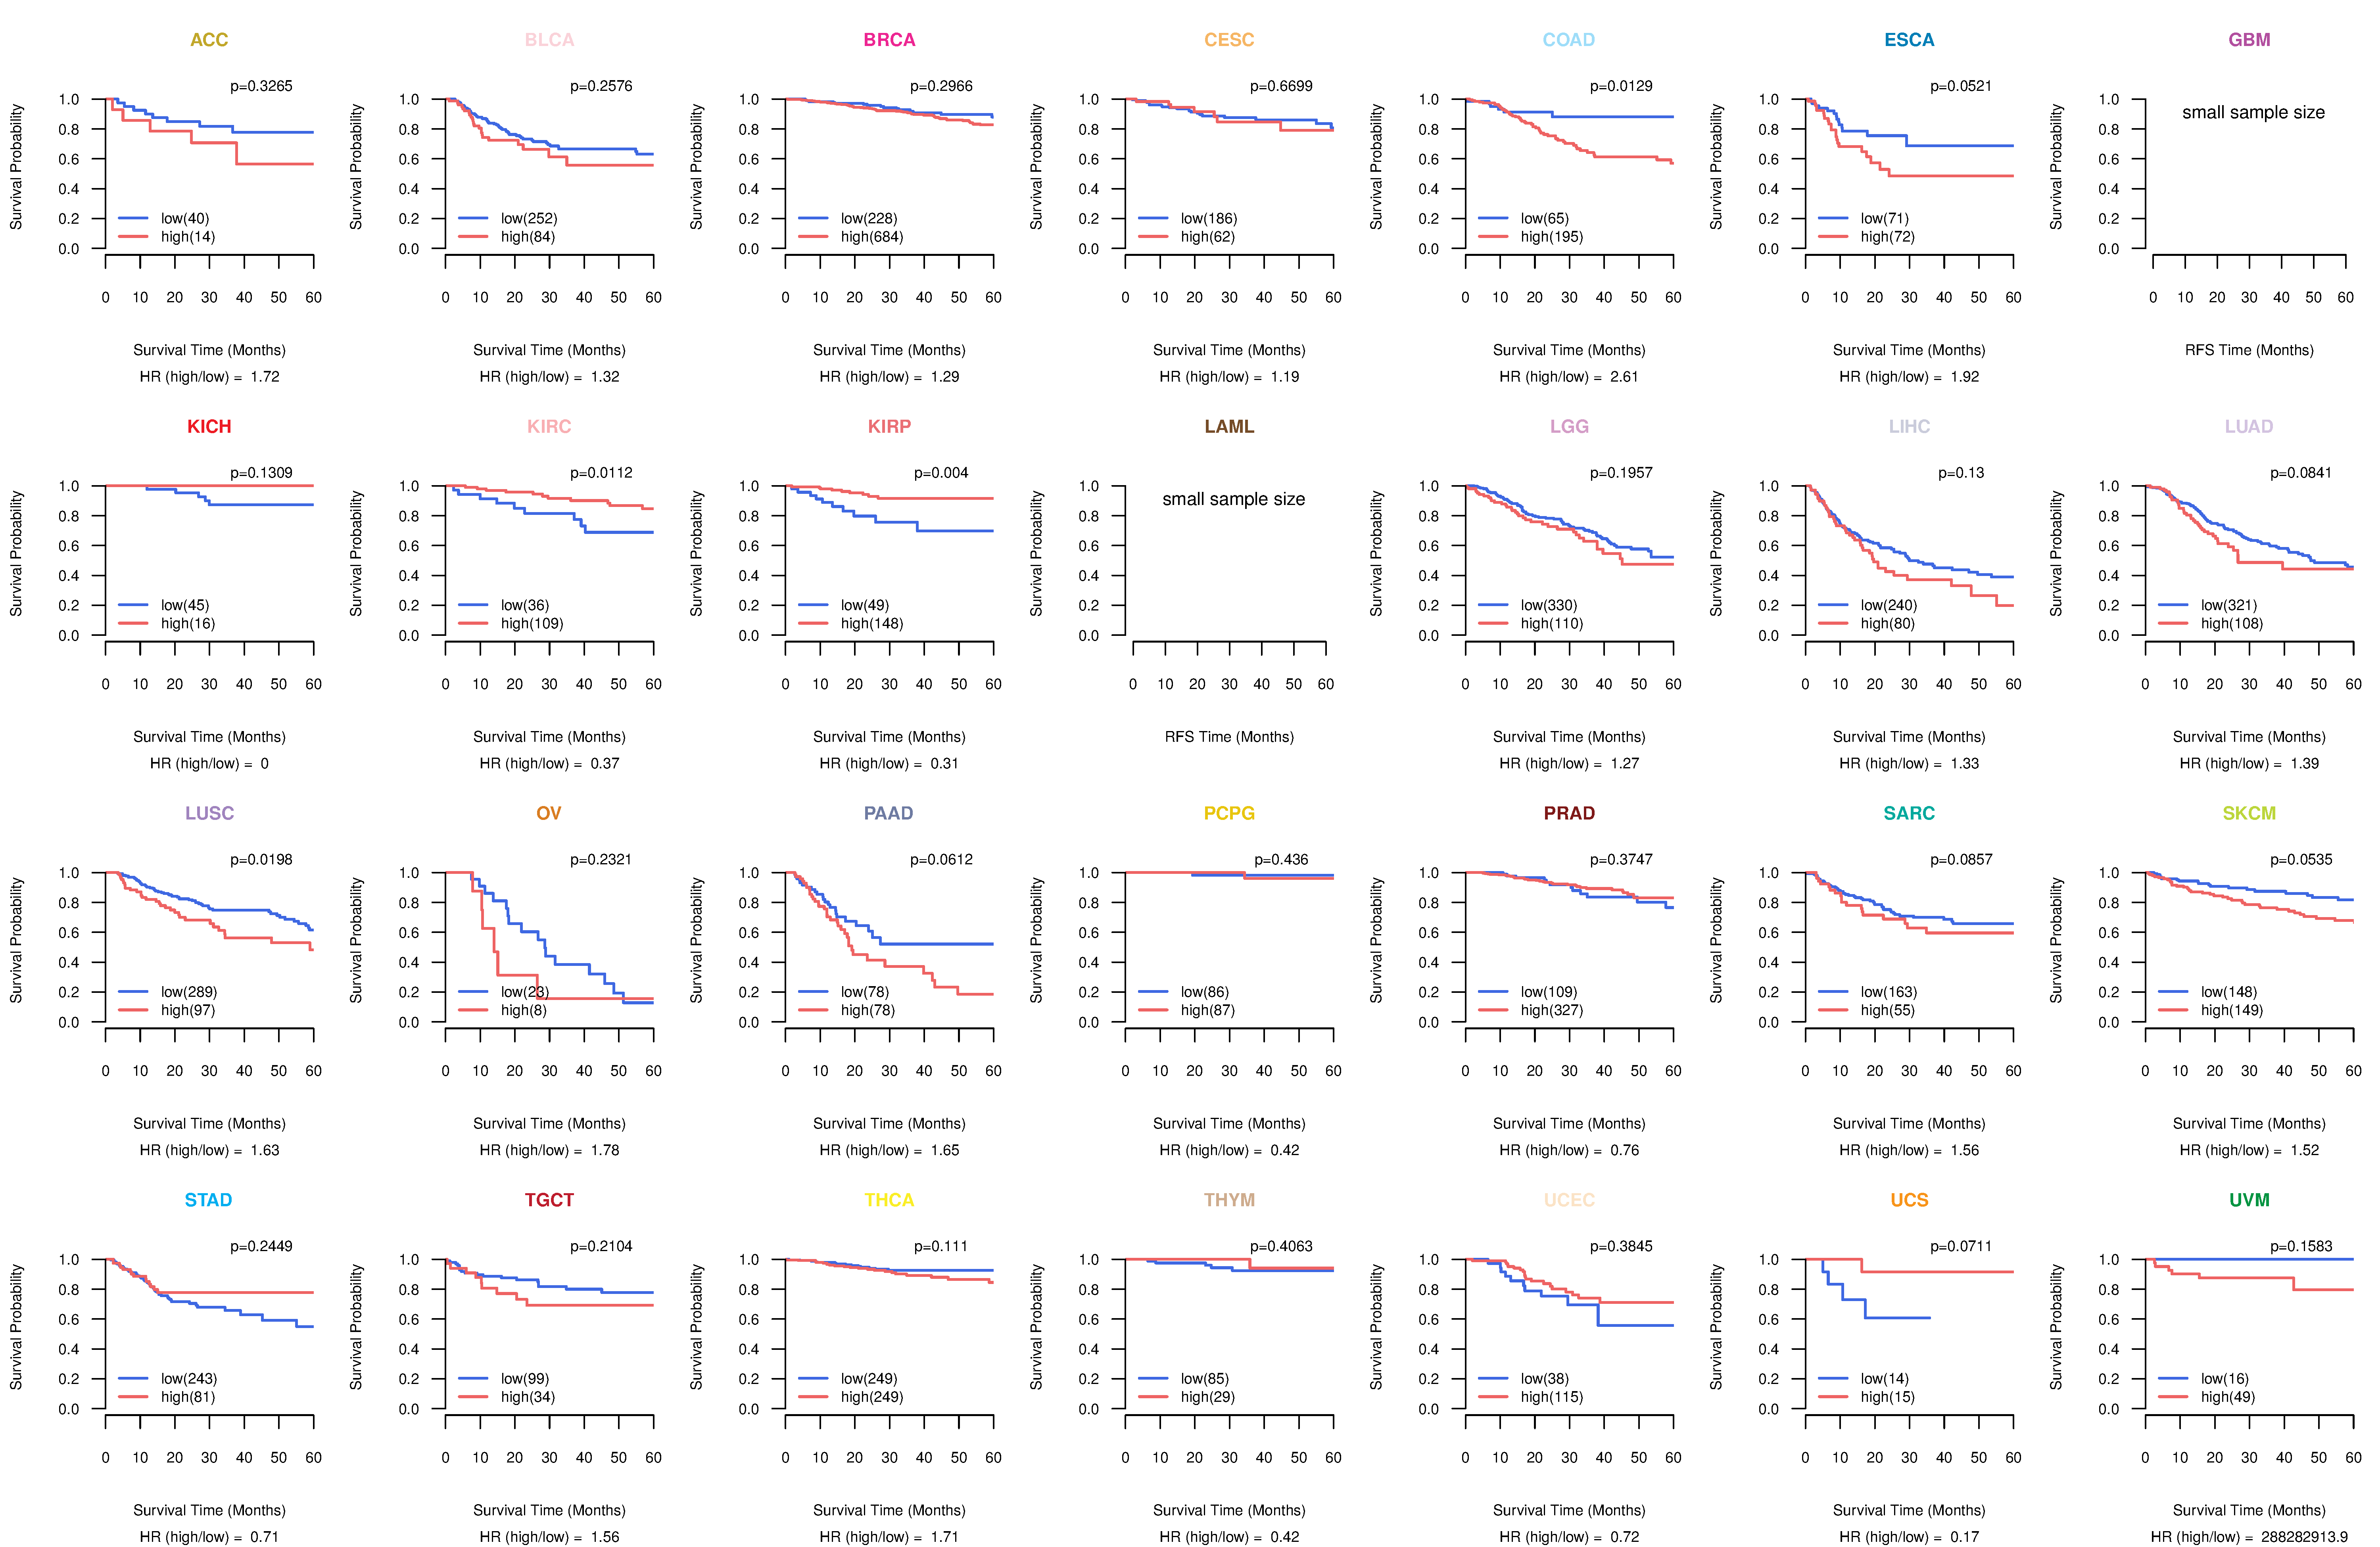
| Kaplan-Meier plots with logrank test of relapse free survival (RFS) using 28 cancer types (TCGA IlluminaHiSeq_RNASeqV2, pan-cancer normalized log2(norm_counts+1) data, version 2016-08-16) (TCGA clinicalMatrix, phenotype data, version 2016-04-27) * Click on the image enlarge it in a new window. |
 |
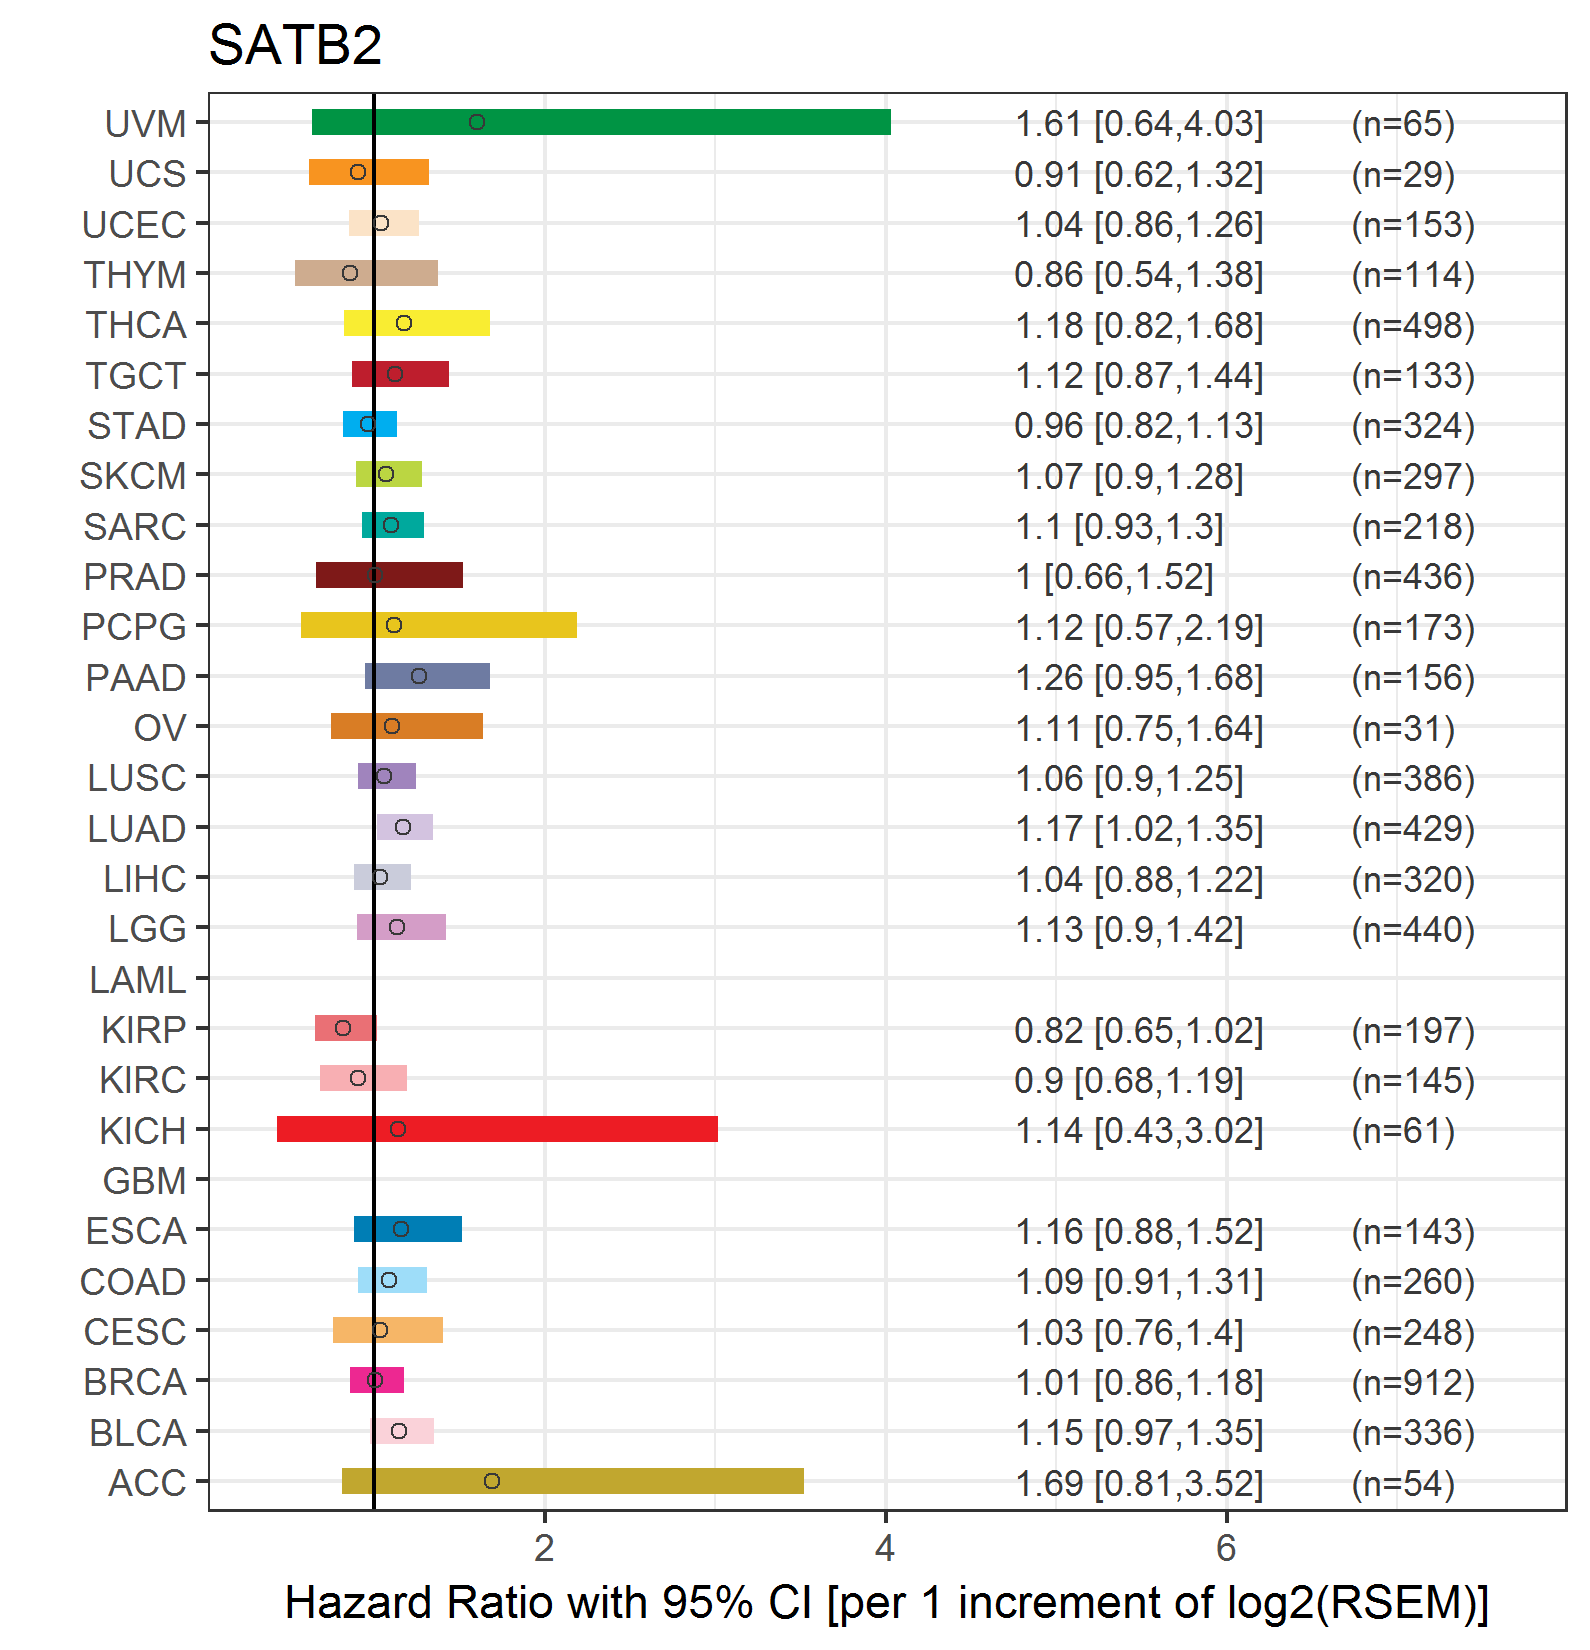
| Forest plot of Cox proportional hazard ratio (HR) and 95% CI of overall survival (OS) using 28 cancer types (TCGA IlluminaHiSeq_RNASeqV2, pan-cancer normalized log2(norm_counts+1) data, version 2016-08-16) (TCGA clinicalMatrix, phenotype data, version 2016-04-27) * Click on the image enlarge it in a new window. |
 |
| Forest plot of Cox proportional hazard ratio (HR) and 95% CI of relapse free survival (RFS) using 28 cancer types (TCGA IlluminaHiSeq_RNASeqV2, pan-cancer normalized log2(norm_counts+1) data, version 2016-08-16) (TCGA clinicalMatrix, phenotype data, version 2016-04-27) * Click on the image enlarge it in a new window. |
 |
| Top |
| TissGeneClin for SATB2 |
| TissGeneDrug for SATB2 |
| Drug information targeting TissGene (DrugBank Version 5.0.6, 2017-04-01) |
| DrugBank ID | Drug name | Drug activity | Drug type | Drug status |
| Top |
| TissGeneDisease for SATB2 |
| Disease information associated with TissGene (DisGeNet, 2016-06-01) |
| Disease ID | Disease name | # pubmeds | Source |
| umls:C0008925 | Cleft Palate | 9 | BeFree,CTD_human |
| umls:C0009402 | Colorectal Carcinoma | 7 | BeFree |
| umls:C1527249 | Colorectal Cancer | 7 | BeFree |
| umls:C3714756 | Intellectual Disability | 5 | BeFree |
| umls:C0027627 | Neoplasm Metastasis | 3 | BeFree |
| umls:C0029463 | Osteosarcoma | 3 | BeFree |
| umls:C0585442 | Osteosarcoma of bone | 3 | BeFree |
| umls:C0233715 | Speech impairment | 2 | BeFree |
| umls:C0240635 | Byzanthine arch palate | 2 | BeFree |
| umls:C0595989 | Carcinoma of larynx | 2 | BeFree |
| umls:C0596263 | Carcinogenesis | 2 | BeFree |
| umls:C1535926 | Neurodevelopmental Disorders | 2 | BeFree |
| umls:C0000768 | Congenital Abnormality | 1 | BeFree |
| umls:C0007103 | Malignant neoplasm of endometrium | 1 | BeFree |
| umls:C0007107 | Malignant neoplasm of larynx | 1 | BeFree |
| umls:C0008626 | Congenital chromosomal disease | 1 | BeFree |
| umls:C0009324 | Ulcerative Colitis | 1 | GAD |
| umls:C0015230 | Exanthema | 1 | BeFree |
| umls:C0016045 | fibroma | 1 | BeFree |
| umls:C0017525 | Giant Cell Tumors | 1 | BeFree |
| umls:C0018817 | Atrial Septal Defects | 1 | BeFree |
| umls:C0020608 | Hypodontia | 1 | BeFree |
| umls:C0036341 | Schizophrenia | 1 | GWASCAT |
| umls:C0037579 | Soft Tissue Neoplasms | 1 | BeFree |
| umls:C0149925 | Small cell carcinoma of lung | 1 | CTD_human |
| umls:C0178874 | Tumor Progression | 1 | BeFree |
| umls:C0266617 | Congenital anomaly of face | 1 | BeFree |
| umls:C0279622 | Small cell osteosarcoma | 1 | BeFree |
| umls:C0279626 | Squamous cell carcinoma of esophagus | 1 | BeFree |
| umls:C0280324 | Laryngeal Squamous Cell Carcinoma | 1 | BeFree |
| umls:C0376634 | Craniofacial Abnormalities | 1 | CTD_human |
| umls:C0476089 | Endometrial Carcinoma | 1 | BeFree |
| umls:C0521158 | Recurrent tumor | 1 | BeFree |
| umls:C0553580 | Ewings sarcoma | 1 | BeFree |
| umls:C0796184 | Corpus Callosum, Agenesis of, with Facial Anomalies and Robin Sequence | 1 | BeFree |
| umls:C1168401 | Squamous cell carcinoma of the head and neck | 1 | BeFree |
| umls:C1710026 | Sclerosing epithelioid fibrosarcoma | 1 | BeFree |
| umls:C1883486 | Uterine Corpus Cancer | 1 | BeFree |
| umls:C2239176 | Liver carcinoma | 1 | BeFree |
| umls:C2945759 | aggressive cancer | 1 | BeFree |
| umls:C1837218 | Cleft palate, isolated | 0 | MGD |
| umls:C1970095 | Cleft Palate, Isolated, And Mental Retardation | 0 | CTD_human |
| umls:C2676739 | Chromosome 2q32-Q33 Deletion Syndrome | 0 | CLINVAR,ORPHANET |
|
Copyright 2016-Present - The University of Texas Health Science Center at Houston (UTHealth) Web File Viewing | How to Report, Fraud, Waste and Abuse | State of Texas | Statewide Search | Texas Homeland Security | Site Policies |