 |
| |
| |
| |
| |
| |
| |
|

| TissGeneSummary for BHMT2 |
 Gene summary Gene summary |
| Basic gene information | Gene symbol | BHMT2 |
| Gene name | betaine--homocysteine S-methyltransferase 2 | |
| Synonyms | - | |
| Cytomap | UCSC genome browser: 5q13 | |
| Type of gene | protein-coding | |
| RefGenes | NM_001178005.1, NM_017614.4, | |
| Description | S-methylmethionine--homocysteine S-methyltransferase BHMT2SMM-hcy methyltransferasebetaine-homocysteine methyltransferase 2 | |
| Modification date | 20141207 | |
| dbXrefs | MIM : 605932 | |
| HGNC : HGNC | ||
| HPRD : 12069 | ||
| Protein | UniProt: go to UniProt's Cross Reference DB Table | |
| Expression | CleanEX: HS_BHMT2 | |
| BioGPS: 23743 | ||
| Pathway | NCI Pathway Interaction Database: BHMT2 | |
| KEGG: BHMT2 | ||
| REACTOME: BHMT2 | ||
| Pathway Commons: BHMT2 | ||
| Context | iHOP: BHMT2 | |
| ligand binding site mutation search in PubMed: BHMT2 | ||
| UCL Cancer Institute: BHMT2 | ||
| Assigned class in TissGDB* | C | |
| Included tissue-specific gene expression resources | TiGER,GTEx | |
| Specific-tissues in normal samples (assigned by TissGDB using HPA, TiGER, and GTEx) | KidneyLiver | |
| Cancer types related to the specific-tissues in cancer samples (assigned by TissGDB using TCGA) | KIRC,KIRP,KICHLIHC | |
| Reference showing the relevant tissue of BHMT2 | ||
| Description by TissGene annotations | ||
| * Class A consists of genes with literature evidence and is part of the cTissGenes. Class B consists of only cTissGenes without additional evidence. The remaining genes belong to Class C. |
| Gene ontology having evidence of Inferred from Direct Assay (IDA) from Entrez |
| GO ID | GO term | PubMed ID | GO:0006577 | amino-acid betaine metabolic process | 18230605 | GO:0033477 | S-methylmethionine metabolic process | 18230605 | GO:0046500 | S-adenosylmethionine metabolic process | 18230605 | GO:0071267 | L-methionine salvage | 18230605 | GO:0006577 | amino-acid betaine metabolic process | 18230605 | GO:0033477 | S-methylmethionine metabolic process | 18230605 | GO:0046500 | S-adenosylmethionine metabolic process | 18230605 | GO:0071267 | L-methionine salvage | 18230605 |
| Top |
| TissGeneExp for BHMT2 |
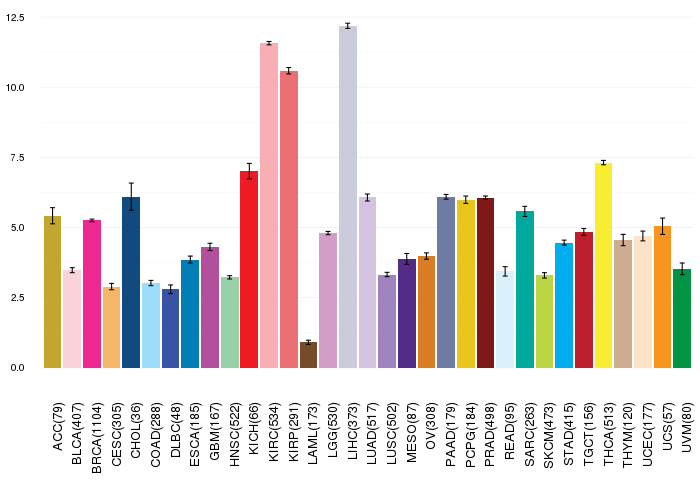
| Gene expressions across 28 cancer types (X-axis: cancer type and Y-axis: log2(norm_counts+1)) (TCGA IlluminaHiSeq_RNASeqV2, pan-cancer normalized log2(norm_counts+1) data, version 2016-08-16) |
 |
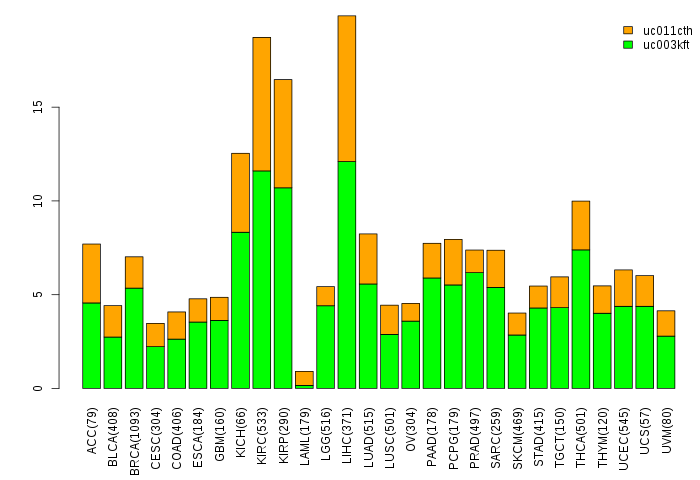
| Gene isoform expressions across 28 cancer types (X-axis: cancer type and Y-axis: log2(norm_counts+1)) (TCGA pan-cancer tcga_rsem_isoform_tpm, version 2016-09-01) |
 |
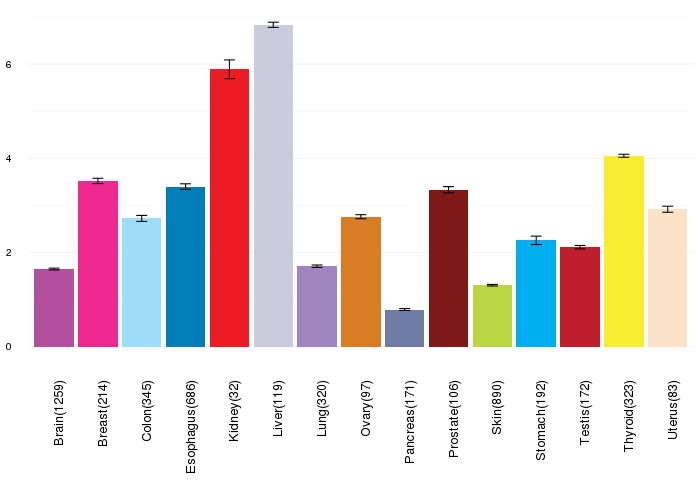
| Gene expressions across normal tissues of GTEx data (GTEx GTEx_Analysis_v6_RNA-seq_RNA-SeQCv1.1.8_gene_rpkm.gct) - Here, we shows the matched tissue types only among our 28 cancer types. |
 |
| Different expressions across 14 cancer types with more than 10 samples between matched tumors and normals (X-axis: cancer type and Y-axis: log2(norm_counts+1)) (TCGA IlluminaHiSeq_RNASeqV2, pan-cancer normalized log2(norm_counts+1) data, version 2016-08-16) |
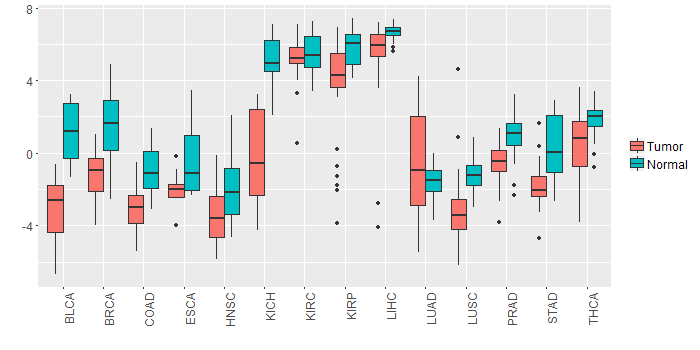 |
| - Significantly differentially expressed cancer types and information. (|Fold change|>1 and FDR<0.05) |
| Cancer type | Mean(exp) in tumor | Mean(exp) in matched normal | Log2FC | P-val. | FDR |
| THCA | 0.424730158 | 1.889948802 | -1.465218644 | 1.33E-07 | 5.70E-07 |
| LUSC | -3.227797558 | -1.200609323 | -2.027188235 | 8.68E-11 | 3.31E-10 |
| BRCA | -1.150769901 | 1.58179852 | -2.732568421 | 2.35E-30 | 3.27E-29 |
| COAD | -3.046256608 | -0.963502762 | -2.082753846 | 5.30E-07 | 3.16E-06 |
| BLCA | -3.018168147 | 1.087610801 | -4.105778947 | 2.16E-09 | 3.07E-07 |
| KICH | -0.317660147 | 5.157839853 | -5.4755 | 1.80E-11 | 1.63E-10 |
| STAD | -1.826974397 | 0.186781853 | -2.01375625 | 9.84E-07 | 1.60E-05 |
| PRAD | -0.509143147 | 0.999712623 | -1.508855769 | 4.52E-11 | 1.12E-09 |
| LUAD | -0.47488194 | -1.549447457 | 1.074565517 | 0.0061 | 0.011420952 |
| LIHC | 5.574375853 | 6.681651853 | -1.107276 | 0.000395 | 0.00117916 |
| KIRP | 3.629950603 | 5.868238103 | -2.2382875 | 0.000109 | 0.000367486 |
| HNSC | -3.420591403 | -1.905872798 | -1.514718605 | 2.07E-05 | 0.00010882 |
| Top |
| TissGene-miRNA for BHMT2 |
| Significantly anti-correlated miRNAs of TissGene across 28 cancer types (Gene-miRNA relations from TargetScanHuman Relsease 7.1, Conserved_Site_Context_Scores.txt.zip, 06.01.2016) (TCGA IlluminaHiSeq_miRNASeq, log2(RPM+1) data, version 2016-11-21) (TCGA IlluminaHiSeq_RNASeqV2, log2(normalized_count+1) data, version 2016-08-16) (Spearman’s Rank Correlation (p-value<0.05 and coefficient<-0.25)) |
| Cancer type | miRNA id | miRNA accession | P-val. | Coeff. | # samples |
| Top |
| TissGeneMut for BHMT2 |
| TissGeneSNV for BHMT2 |
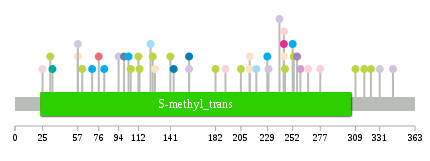
| nsSNV counts per each loci. Different colors of circles represent different cancer types. Circle size denotes number of samples. (TCGA somatic mutation (SNPs and small INDELs) data, version 2016-04-25) * Click on the image to enlarge it in a new window. |
 |
 |
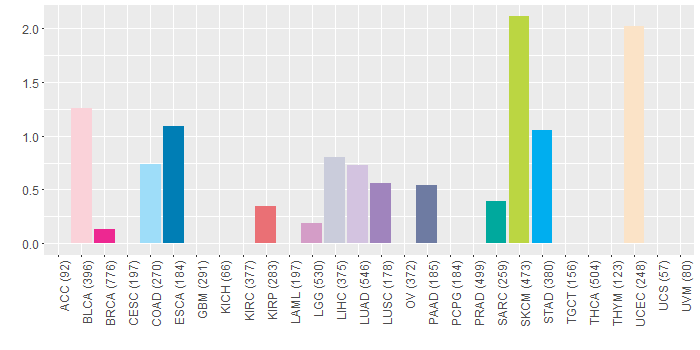
| Somatic nucleotide variants of TissGene across 28 cancer types (X-axis: cancer type and Y-axis: % of mutated samples) The numbers in parentheses are numbers of samples with mutation (nsSNVs). (TCGA somatic mutation (SNPs and small INDELs) data, version 2016-04-25) |
 |
| - nsSNVs sorted by frequency. |
| AAchange | Cancer type | # samples |
| p.R309K | SKCM | 1 |
| p.A158V | LUAD | 1 |
| p.I123M | COAD | 1 |
| p.R6S | READ | 1 |
| p.G105S | SKCM | 1 |
| p.F252S | STAD | 1 |
| p.G25A | BLCA | 1 |
| p.E127X | READ | 1 |
| p.R265T | HNSC | 1 |
| p.G219E | COAD | 1 |
| p.I113M | SKCM | 1 |
| p.E253K | SKCM | 1 |
| p.G182E | SKCM | 1 |
| p.V266A | BLCA | 1 |
| p.K331T | LIHC | 1 |
| p.W343C | LUAD | 1 |
| p.G112E | SKCM | 1 |
| p.D213G | UCEC | 1 |
| p.R99S | PAAD | 1 |
| p.R245K | SKCM | 1 |
| p.F76L | KIRP | 1 |
| p.W141* | SKCM | 1 |
| p.R57C | LIHC | 1 |
| p.M61I | SKCM | 1 |
| p.A244V | UCEC | 1 |
| p.A244V | BRCA | 1 |
| p.A244V | BLCA | 1 |
| p.A229T | STAD | 1 |
| p.G25* | HNSC | 1 |
| p.R57C | UCEC | 1 |
| p.A94V | LIHC | 1 |
| p.R309G | HNSC | 1 |
| p.R195K | HNSC | 1 |
| p.T32I | SKCM | 1 |
| p.G103D | STAD | 1 |
| p.R127I | UCEC | 1 |
| p.G230V | LUAD | 1 |
| p.P256T | LUSC | 1 |
| p.E125K | SKCM | 1 |
| p.V144A | ESCA | 1 |
| p.D213N | UCEC | 1 |
| p.D81V | STAD | 1 |
| p.E34K | SARC | 1 |
| p.G323E | SKCM | 1 |
| p.E191K | BLCA | 1 |
| p.L240V | LUAD | 1 |
| p.W141L | CHOL | 1 |
| p.E317K | SKCM | 1 |
| p.R277T | BLCA | 1 |
| p.V70A | STAD | 1 |
| p.P259T | LGG | 1 |
| p.A158D | ESCA | 1 |
| p.R205K | SKCM | 1 |
| Top |
| TissGeneCNV for BHMT2 |
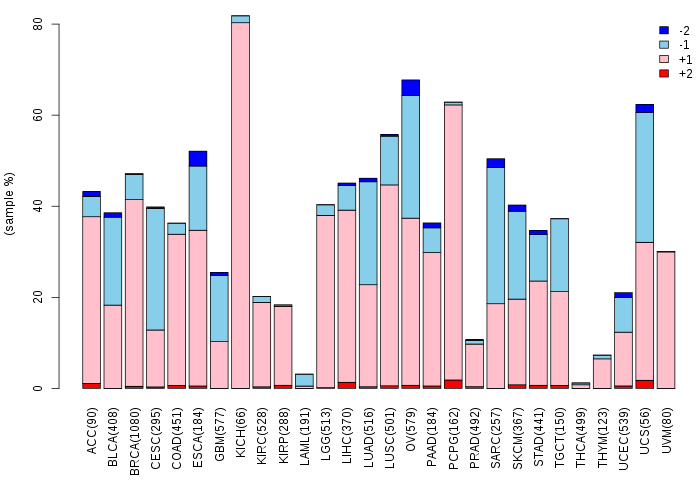
| Copy number variations of TissGene across 28 cancer types (X-axis: cancer type and Y-axis: % of CNV samples) (TCGA Gistic2_CopyNumber_Gistic2_all_data_by_genes, Gistic2 copy number data, version 2016-08-16) |
 |
| Top |
| TissGeneFusions for BHMT2 |
| Fusion genes including TissGene (ChimerDB 3.0, 2016-12-01 and TCGA fusion Portal 2015-12-01) |
| Database | Src | Cancer type | Sample | Fusion gene | ORF | 5'-gene BP | 3'-gene BP |
| Chimerdb3.0 | ChiTaRs | NA | AA703201 | BHMT2-SPTLC3 | chr5:78374089 | chr20:13145632 |
| Top |
| TissGeneNet for BHMT2 |
| Co-expressed gene networks based on protein-protein interaction data (CePIN) (TCGA IlluminaHiSeq_RNASeqV2, pan-cancer normalized log2(norm_counts+1) data, version 2016-08-16) (PINA2 ppi data) |
| Top |
| TissGeneProg for BHMT2 |
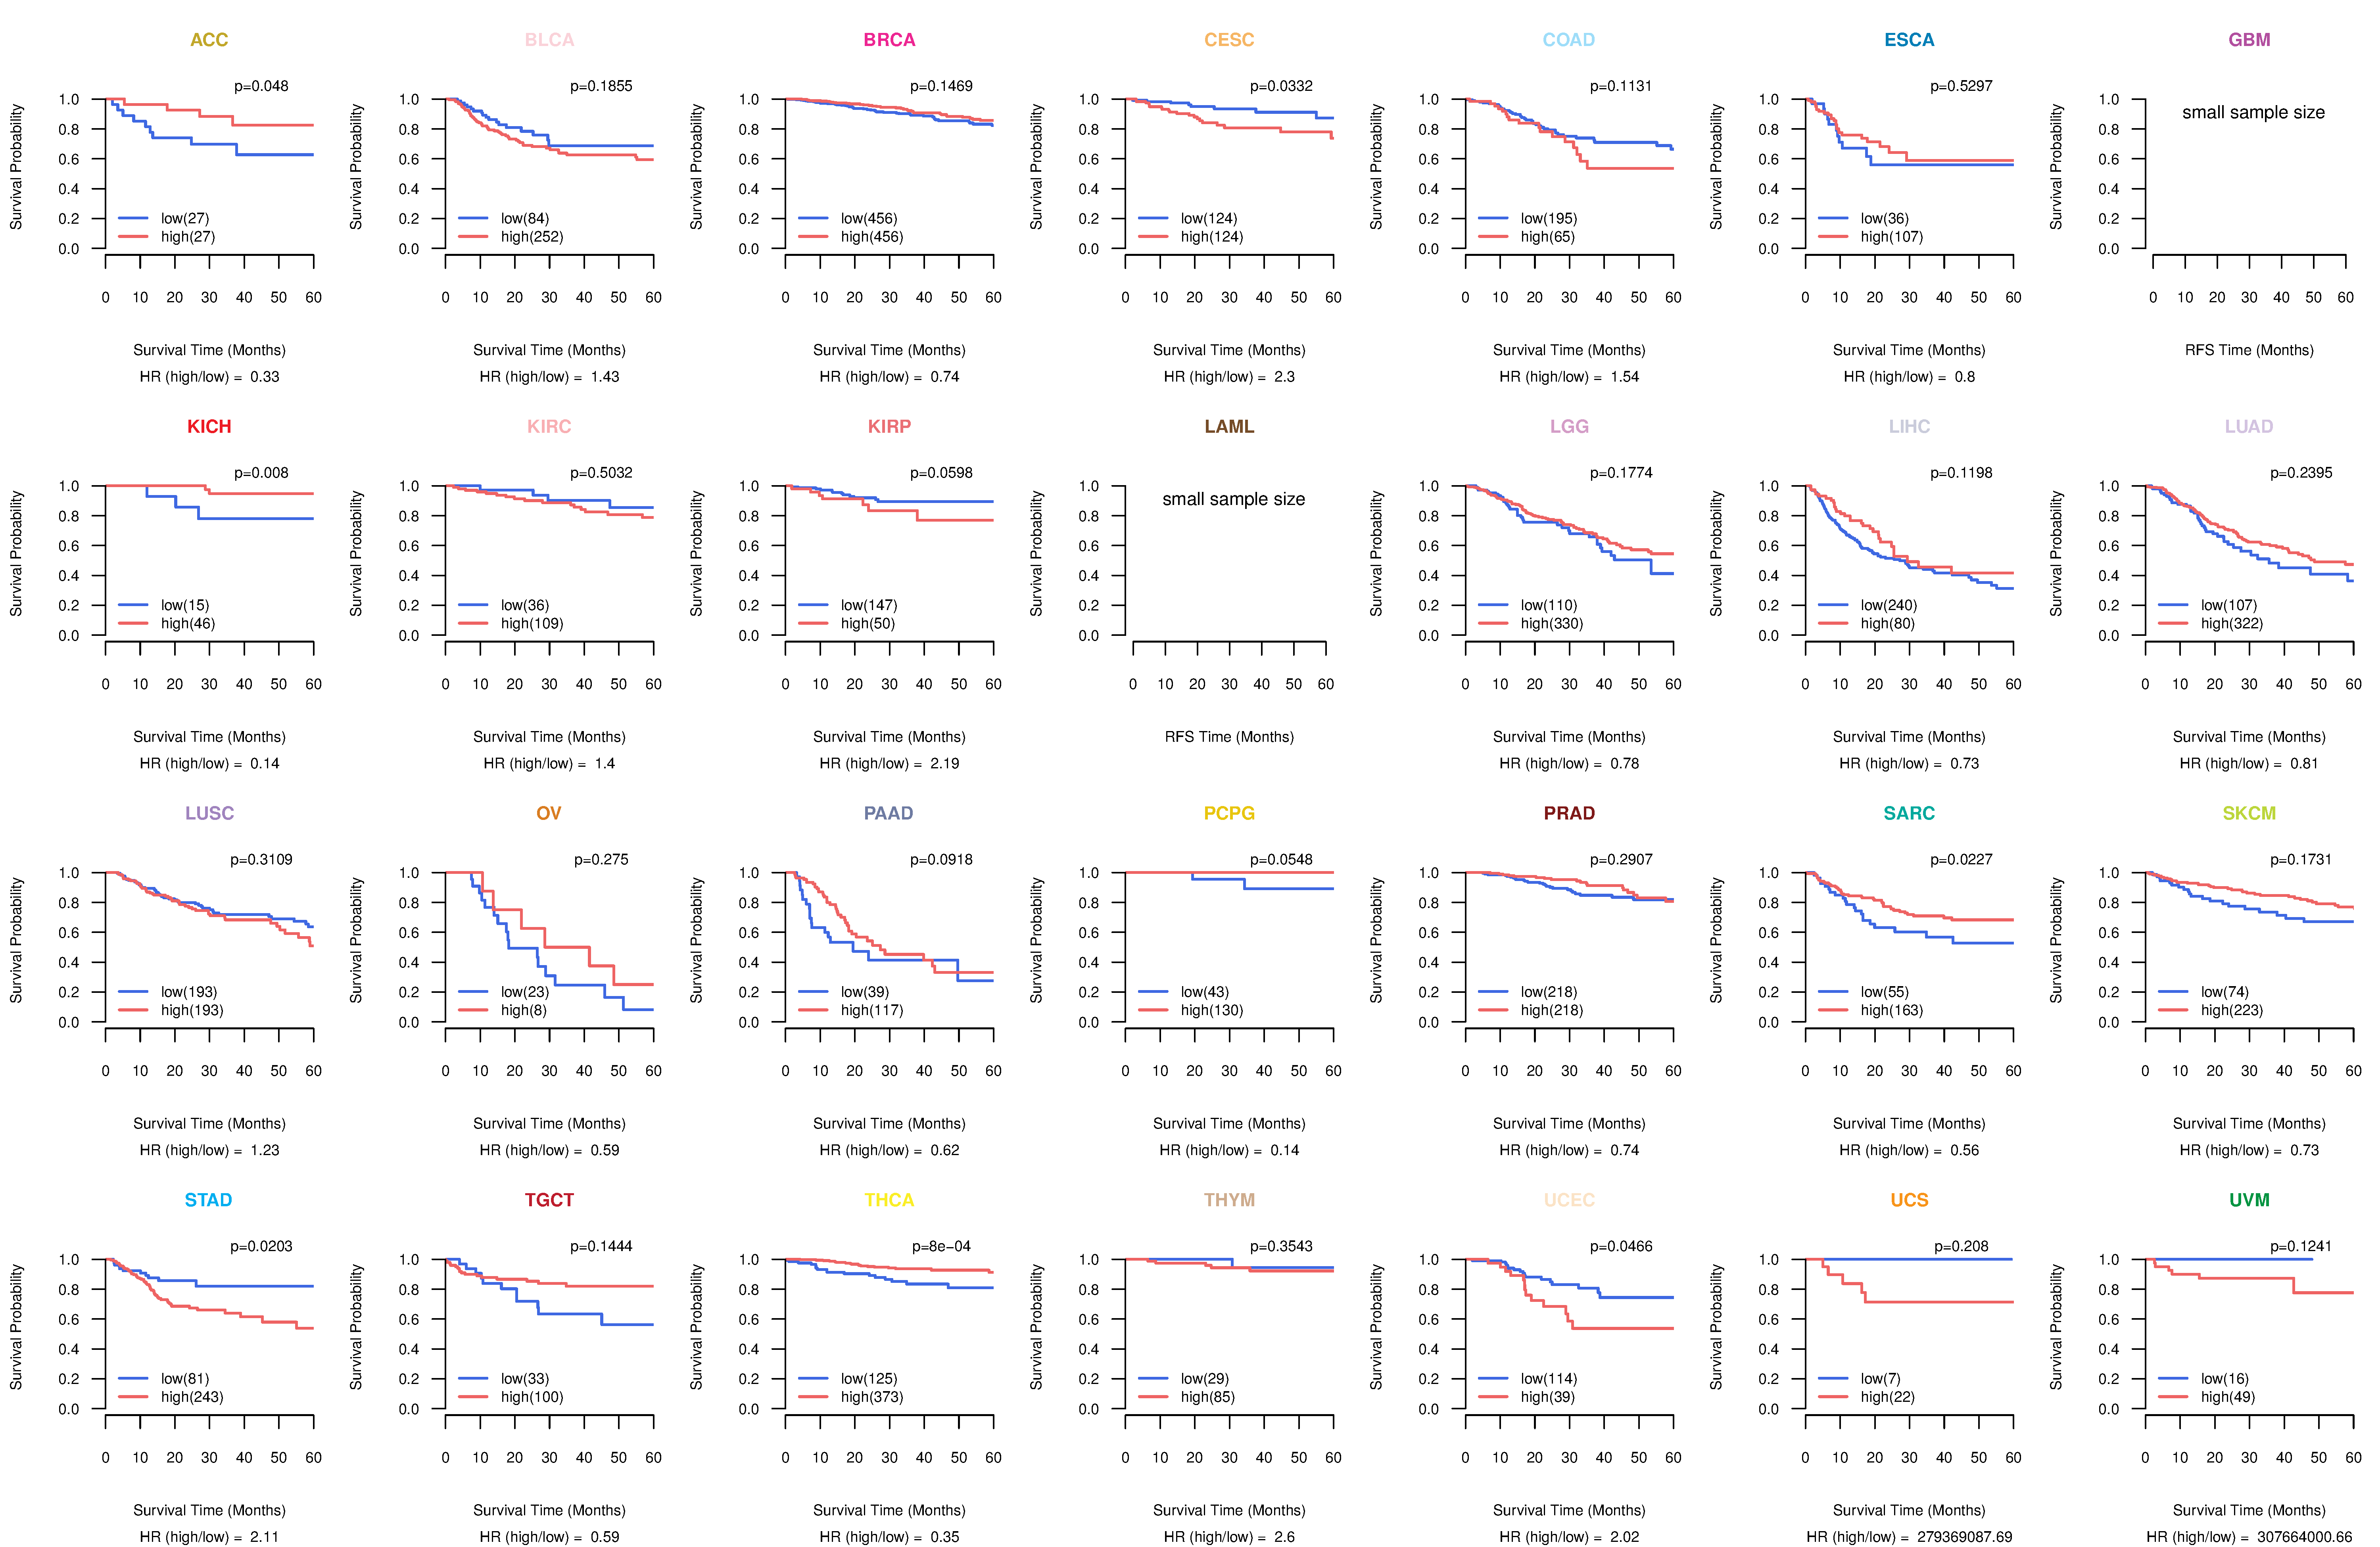
| Kaplan-Meier plots with logrank tests of overall survival (OS) using 28 cancer types (TCGA IlluminaHiSeq_RNASeqV2, pan-cancer normalized log2(norm_counts+1) data, version 2016-08-16) (TCGA clinicalMatrix, phenotype data, version 2016-04-27) * Click on the image to enlarge it in a new window. |
 |
| Kaplan-Meier plots with logrank test of relapse free survival (RFS) using 28 cancer types (TCGA IlluminaHiSeq_RNASeqV2, pan-cancer normalized log2(norm_counts+1) data, version 2016-08-16) (TCGA clinicalMatrix, phenotype data, version 2016-04-27) * Click on the image enlarge it in a new window. |
 |
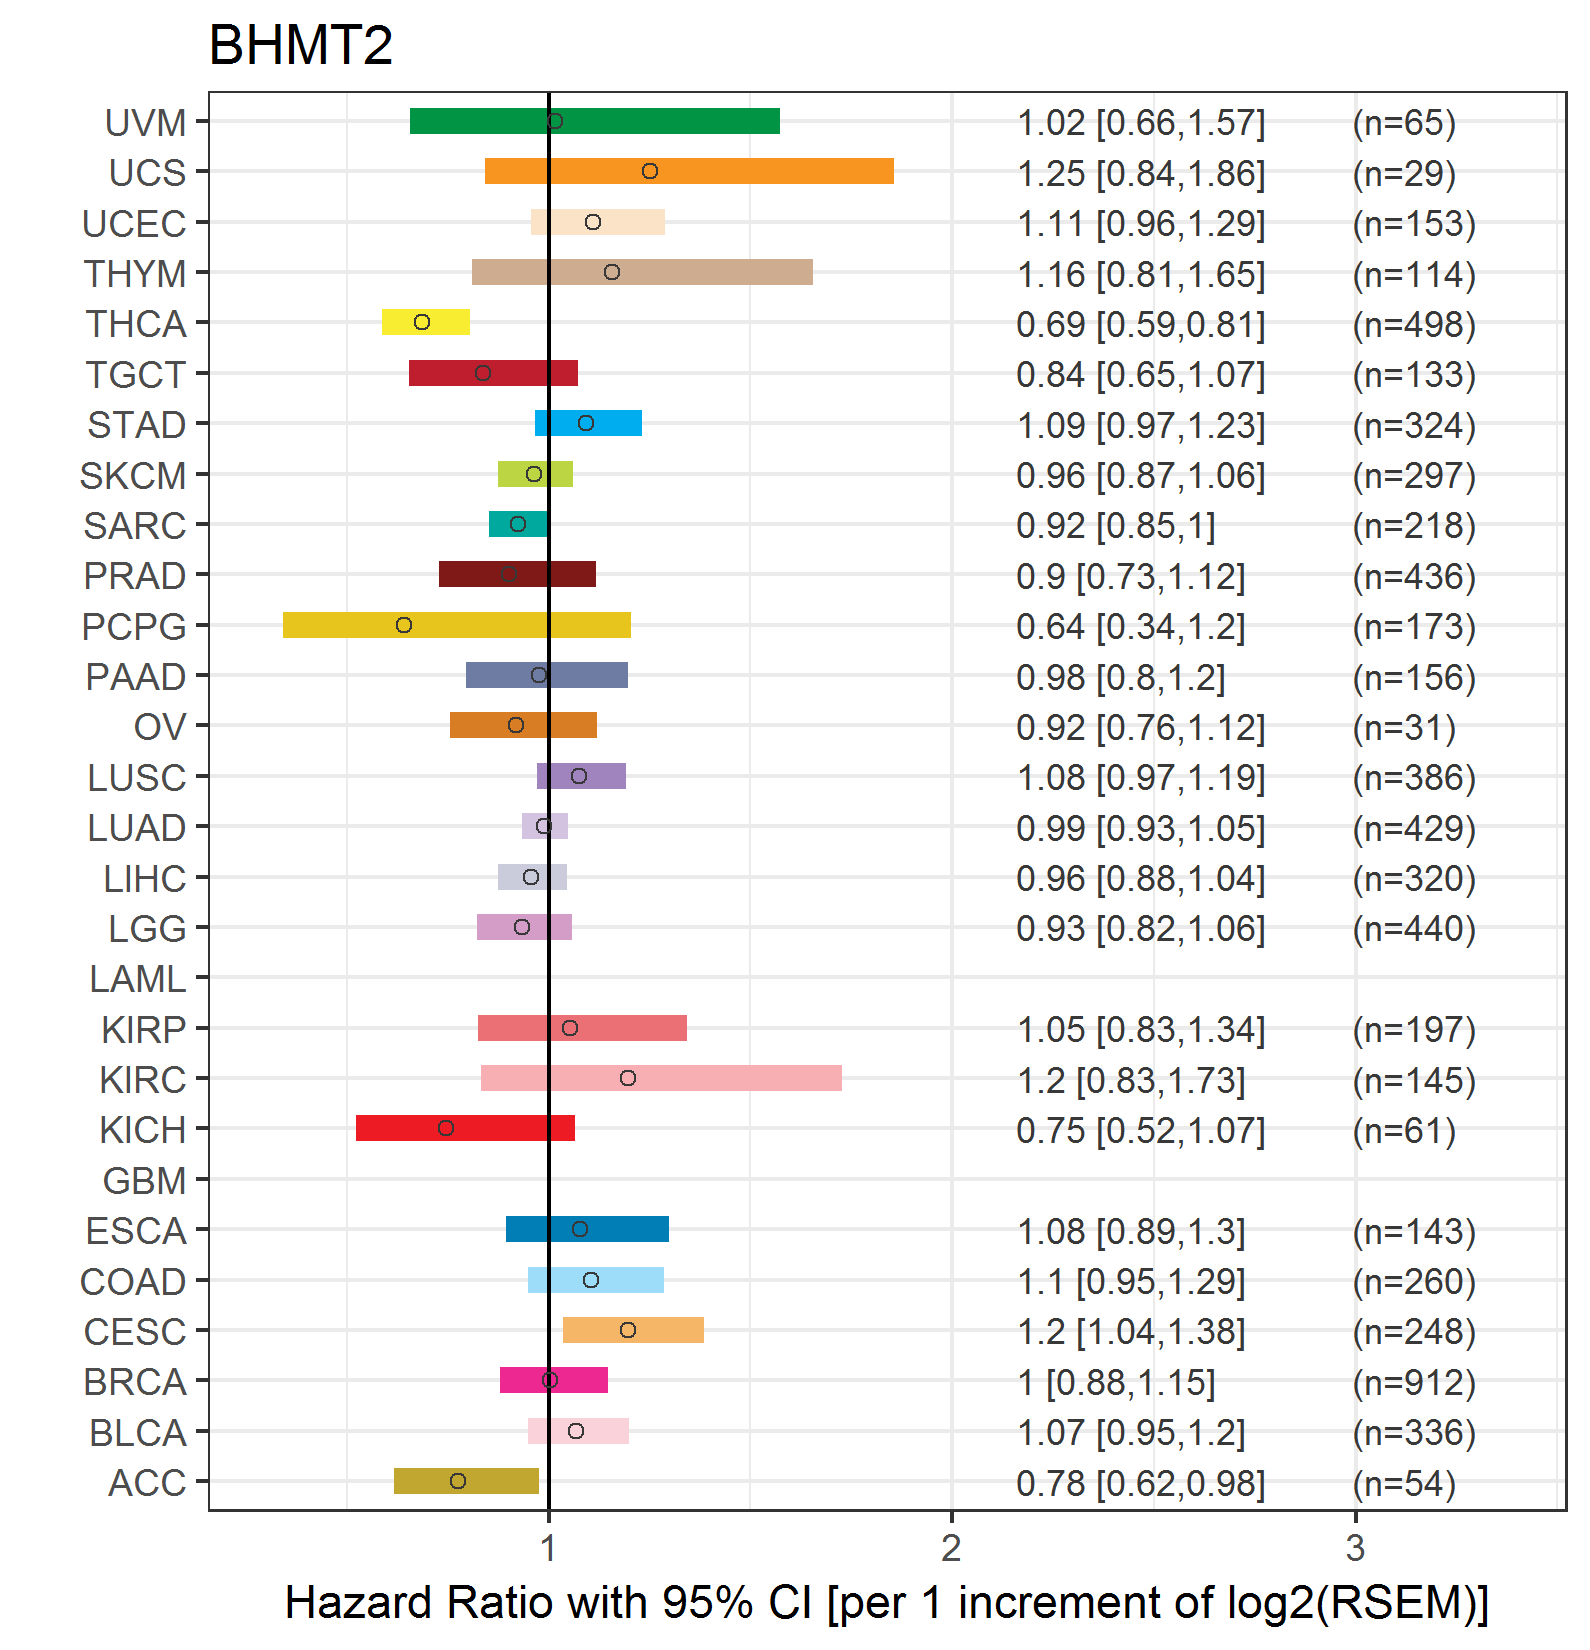
| Forest plot of Cox proportional hazard ratio (HR) and 95% CI of overall survival (OS) using 28 cancer types (TCGA IlluminaHiSeq_RNASeqV2, pan-cancer normalized log2(norm_counts+1) data, version 2016-08-16) (TCGA clinicalMatrix, phenotype data, version 2016-04-27) * Click on the image enlarge it in a new window. |
 |
| Forest plot of Cox proportional hazard ratio (HR) and 95% CI of relapse free survival (RFS) using 28 cancer types (TCGA IlluminaHiSeq_RNASeqV2, pan-cancer normalized log2(norm_counts+1) data, version 2016-08-16) (TCGA clinicalMatrix, phenotype data, version 2016-04-27) * Click on the image enlarge it in a new window. |
 |
| Top |
| TissGeneClin for BHMT2 |
| TissGeneDrug for BHMT2 |
| Drug information targeting TissGene (DrugBank Version 5.0.6, 2017-04-01) |
| DrugBank ID | Drug name | Drug activity | Drug type | Drug status |
| DB00134 | L-Methionine | Product of | Small molecule | Approved|Nutraceutical |
| Top |
| TissGeneDisease for BHMT2 |
| Disease information associated with TissGene (DisGeNet, 2016-06-01) |
| Disease ID | Disease name | # pubmeds | Source |
| umls:C0008924 | Cleft Lip | 3 | CTD_human,GAD |
| umls:C0008925 | Cleft Palate | 3 | CTD_human,GAD |
| umls:C0080178 | Spina Bifida | 3 | BeFree,GAD |
| umls:C0598608 | Hyperhomocysteinemia | 2 | GAD,LHGDN |
| umls:C0004153 | Atherosclerosis | 1 | GAD |
| umls:C0007786 | Brain Ischemia | 1 | GAD |
| umls:C0010068 | Coronary heart disease | 1 | LHGDN |
| umls:C0018798 | Congenital Heart Defects | 1 | GAD |
| umls:C0038454 | Cerebrovascular accident | 1 | BeFree,GAD |
| umls:C0162871 | Aortic Aneurysm, Abdominal | 1 | GAD |
|
Copyright 2016-Present - The University of Texas Health Science Center at Houston (UTHealth) Web File Viewing | How to Report, Fraud, Waste and Abuse | State of Texas | Statewide Search | Texas Homeland Security | Site Policies |