 |
| |
| |
| |
| |
| |
| |
|

| TissGeneSummary for SPDYA |
 Gene summary Gene summary |
| Basic gene information | Gene symbol | SPDYA |
| Gene name | speedy/RINGO cell cycle regulator family member A | |
| Synonyms | RINGO3|RINGOA|SPDY1|SPY1 | |
| Cytomap | UCSC genome browser: 2p23.2 | |
| Type of gene | protein-coding | |
| RefGenes | NM_001008779.1, NM_001142634.1,NM_182756.3, | |
| Description | RINGO AhSpy/Ringo Arapid inducer of G2/M progression in oocytes Aspeedy homolog Aspeedy protein Aspeedy-1 | |
| Modification date | 20141207 | |
| dbXrefs | MIM : 614029 | |
| HGNC : HGNC | ||
| Ensembl : ENSG00000163806 | ||
| HPRD : 18095 | ||
| Vega : OTTHUMG00000074041 | ||
| Protein | UniProt: go to UniProt's Cross Reference DB Table | |
| Expression | CleanEX: HS_SPDYA | |
| BioGPS: 245711 | ||
| Pathway | NCI Pathway Interaction Database: SPDYA | |
| KEGG: SPDYA | ||
| REACTOME: SPDYA | ||
| Pathway Commons: SPDYA | ||
| Context | iHOP: SPDYA | |
| ligand binding site mutation search in PubMed: SPDYA | ||
| UCL Cancer Institute: SPDYA | ||
| Assigned class in TissGDB* | B | |
| Included tissue-specific gene expression resources | HPA,TiGER,GTEx | |
| Specific-tissues in normal samples (assigned by TissGDB using HPA, TiGER, and GTEx) | Testis | |
| Cancer types related to the specific-tissues in cancer samples (assigned by TissGDB using TCGA) | TGCT | |
| Reference showing the relevant tissue of SPDYA | ||
| Description by TissGene annotations | Cancer gene | |
| * Class A consists of genes with literature evidence and is part of the cTissGenes. Class B consists of only cTissGenes without additional evidence. The remaining genes belong to Class C. |
| Gene ontology having evidence of Inferred from Direct Assay (IDA) from Entrez |
| GO ID | GO term | PubMed ID | GO:0000082 | G1/S transition of mitotic cell cycle | 11980914 | GO:0006974 | cellular response to DNA damage stimulus | 12839962 | GO:0008284 | positive regulation of cell proliferation | 11980914 | GO:0000082 | G1/S transition of mitotic cell cycle | 11980914 | GO:0006974 | cellular response to DNA damage stimulus | 12839962 | GO:0008284 | positive regulation of cell proliferation | 11980914 |
| Top |
| TissGeneExp for SPDYA |
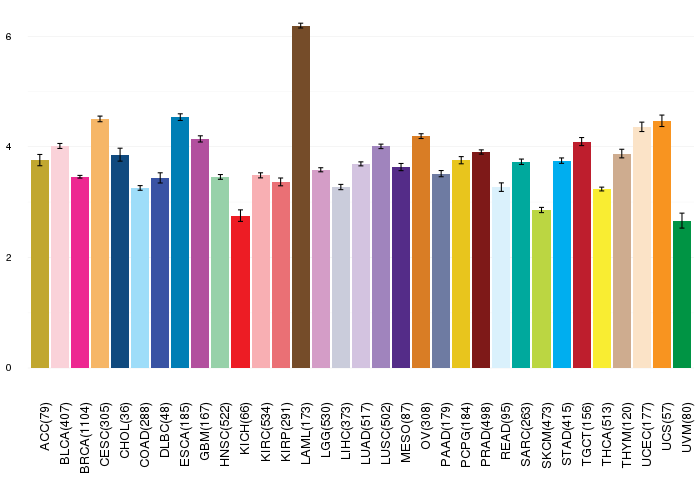
| Gene expressions across 28 cancer types (X-axis: cancer type and Y-axis: log2(norm_counts+1)) (TCGA IlluminaHiSeq_RNASeqV2, pan-cancer normalized log2(norm_counts+1) data, version 2016-08-16) |
 |
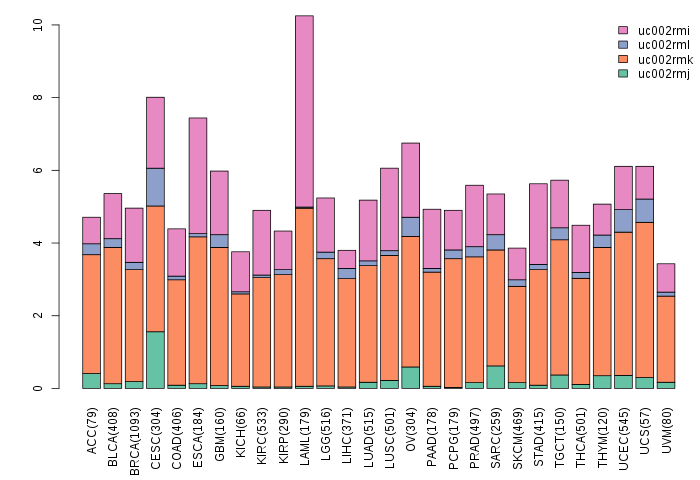
| Gene isoform expressions across 28 cancer types (X-axis: cancer type and Y-axis: log2(norm_counts+1)) (TCGA pan-cancer tcga_rsem_isoform_tpm, version 2016-09-01) |
 |
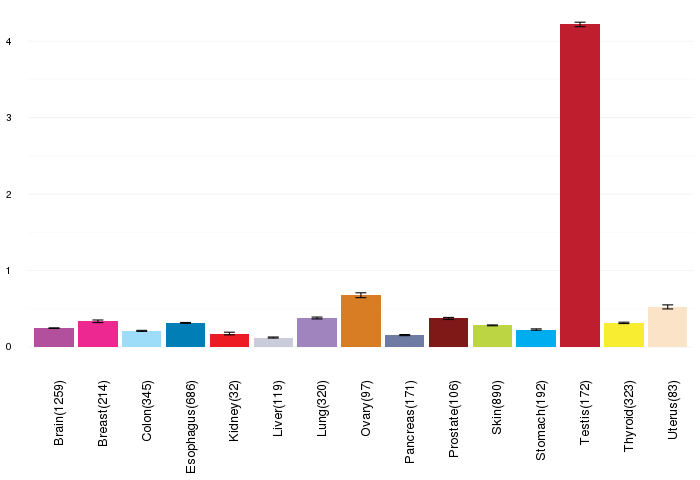
| Gene expressions across normal tissues of GTEx data (GTEx GTEx_Analysis_v6_RNA-seq_RNA-SeQCv1.1.8_gene_rpkm.gct) - Here, we shows the matched tissue types only among our 28 cancer types. |
 |
| Different expressions across 14 cancer types with more than 10 samples between matched tumors and normals (X-axis: cancer type and Y-axis: log2(norm_counts+1)) (TCGA IlluminaHiSeq_RNASeqV2, pan-cancer normalized log2(norm_counts+1) data, version 2016-08-16) |
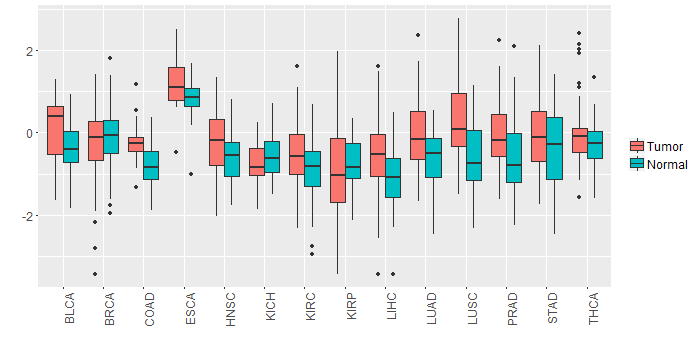 |
| - Significantly differentially expressed cancer types and information. (|Fold change|>1 and FDR<0.05) |
| Cancer type | Mean(exp) in tumor | Mean(exp) in matched normal | Log2FC | P-val. | FDR |
| Top |
| TissGene-miRNA for SPDYA |
| Significantly anti-correlated miRNAs of TissGene across 28 cancer types (Gene-miRNA relations from TargetScanHuman Relsease 7.1, Conserved_Site_Context_Scores.txt.zip, 06.01.2016) (TCGA IlluminaHiSeq_miRNASeq, log2(RPM+1) data, version 2016-11-21) (TCGA IlluminaHiSeq_RNASeqV2, log2(normalized_count+1) data, version 2016-08-16) (Spearman’s Rank Correlation (p-value<0.05 and coefficient<-0.25)) |
| Cancer type | miRNA id | miRNA accession | P-val. | Coeff. | # samples |
| Top |
| TissGeneMut for SPDYA |
| TissGeneSNV for SPDYA |
| nsSNV counts per each loci. Different colors of circles represent different cancer types. Circle size denotes number of samples. (TCGA somatic mutation (SNPs and small INDELs) data, version 2016-04-25) * Click on the image to enlarge it in a new window. |
 |
 |
| Somatic nucleotide variants of TissGene across 28 cancer types (X-axis: cancer type and Y-axis: % of mutated samples) The numbers in parentheses are numbers of samples with mutation (nsSNVs). (TCGA somatic mutation (SNPs and small INDELs) data, version 2016-04-25) |
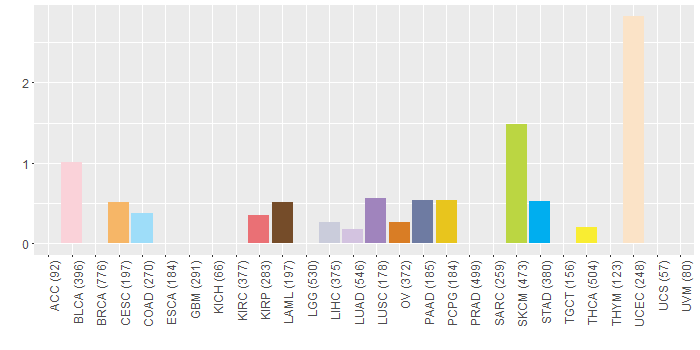 |
| - nsSNVs sorted by frequency. |
| AAchange | Cancer type | # samples |
| p.G293E | SKCM | 2 |
| p.R180Q | UCEC | 2 |
| p.W153* | LUAD | 1 |
| p.E143K | SKCM | 1 |
| p.R36H | UCEC | 1 |
| p.N122H | UCEC | 1 |
| p.P31L | SKCM | 1 |
| p.K112T | READ | 1 |
| p.E143K | BLCA | 1 |
| p.D81N | STAD | 1 |
| p.R199H | STAD | 1 |
| p.S116I | LUSC | 1 |
| p.D81N | UCEC | 1 |
| p.H203Y | THCA | 1 |
| p.F123L | UCEC | 1 |
| p.K30Q | READ | 1 |
| p.L167F | PAAD | 1 |
| p.E143K | COAD | 1 |
| p.N42K | OV | 1 |
| p.A126V | BLCA | 1 |
| p.G61R | SKCM | 1 |
| p.S20L | BLCA | 1 |
| p.S311R | PCPG | 1 |
| p.I286T | DLBC | 1 |
| p.S229L | BLCA | 1 |
| p.E143D | UCEC | 1 |
| p.D262N | SKCM | 1 |
| p.M6L | LAML | 1 |
| p.S268* | CESC | 1 |
| p.M89V | LIHC | 1 |
| p.E139K | SKCM | 1 |
| p.K301R | KIRP | 1 |
| Top |
| TissGeneCNV for SPDYA |
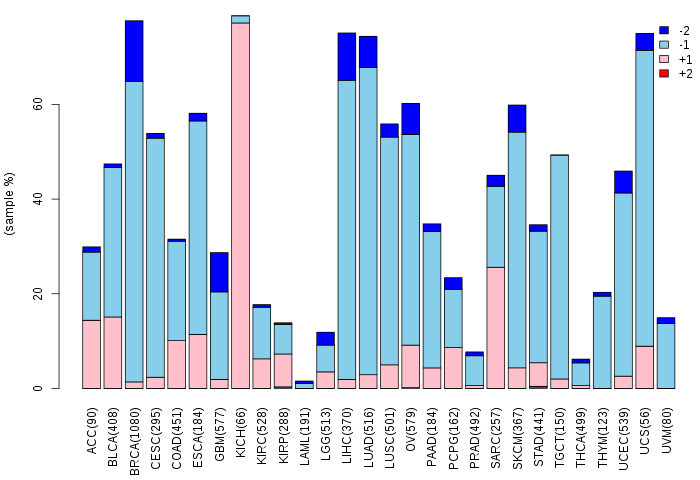
| Copy number variations of TissGene across 28 cancer types (X-axis: cancer type and Y-axis: % of CNV samples) (TCGA Gistic2_CopyNumber_Gistic2_all_data_by_genes, Gistic2 copy number data, version 2016-08-16) |
 |
| Top |
| TissGeneFusions for SPDYA |
| Fusion genes including TissGene (ChimerDB 3.0, 2016-12-01 and TCGA fusion Portal 2015-12-01) |
| Database | Src | Cancer type | Sample | Fusion gene | ORF | 5'-gene BP | 3'-gene BP |
| Chimerdb3.0 | ChiTaRs | NA | AA412102 | SPDYA-NUB1 | chr2:29066623 | chr7:151052851 | |
| Chimerdb3.0 | ChiTaRs | NA | CV358747 | SPDYA-SPDYA | chr2:29026797 | chr2:29027868 | |
| Chimerdb3.0 | ChiTaRs | NA | AA393076 | NUB1-SPDYA | chr7:151053000 | chr2:29066604 |
| Top |
| TissGeneNet for SPDYA |
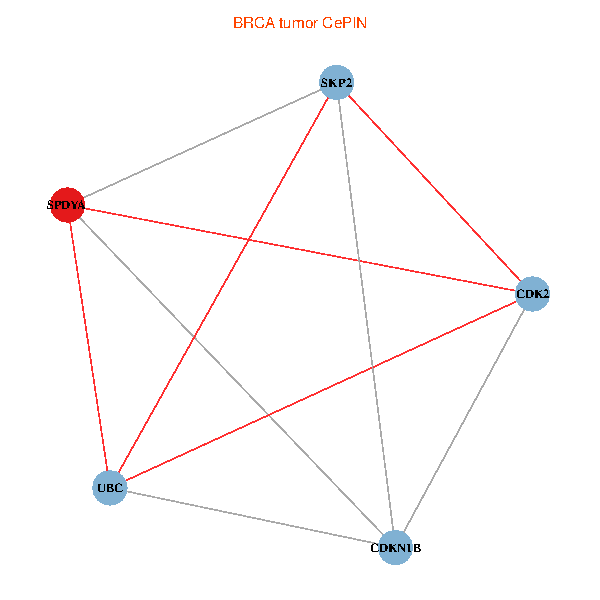
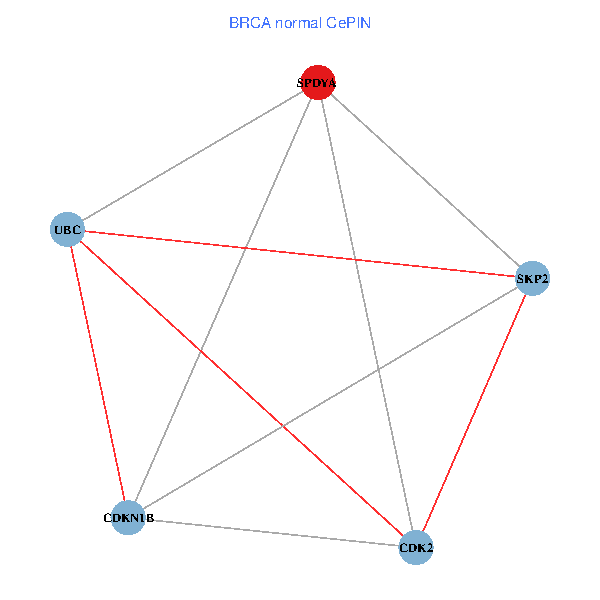
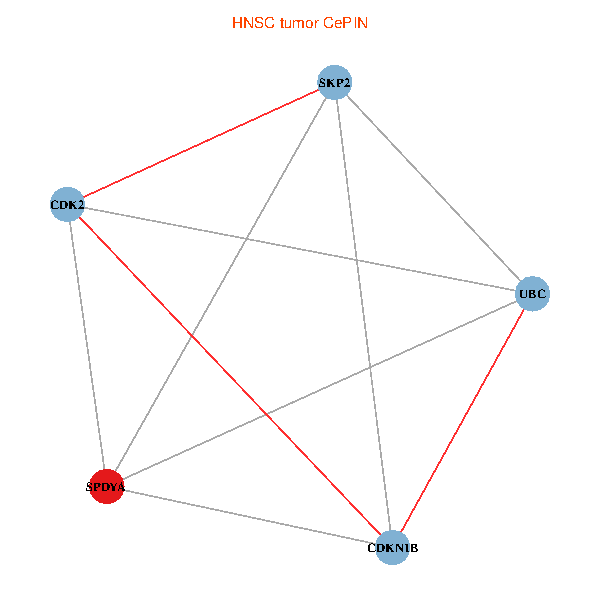
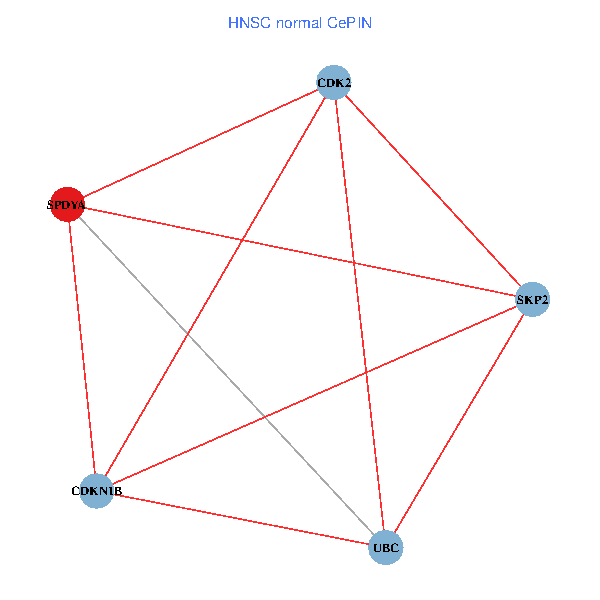
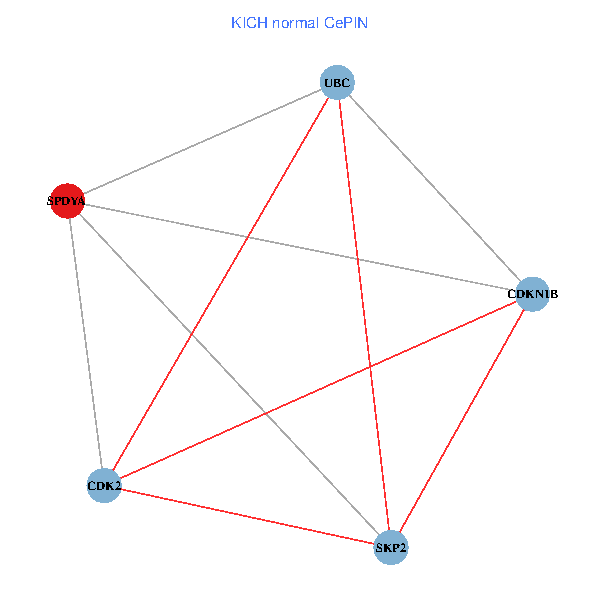
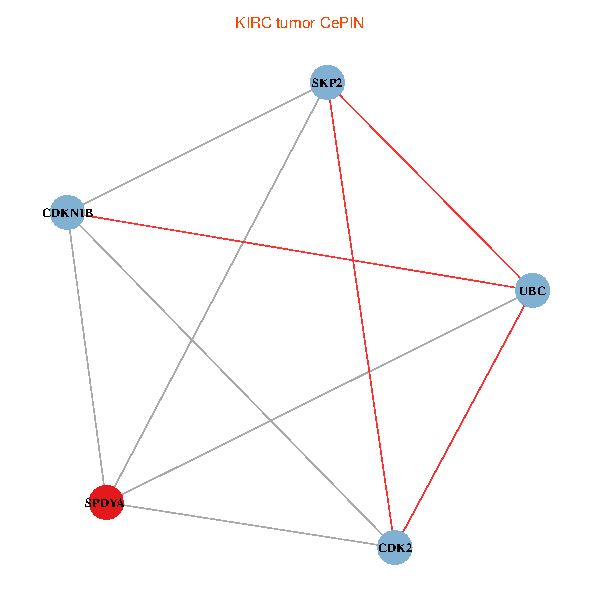
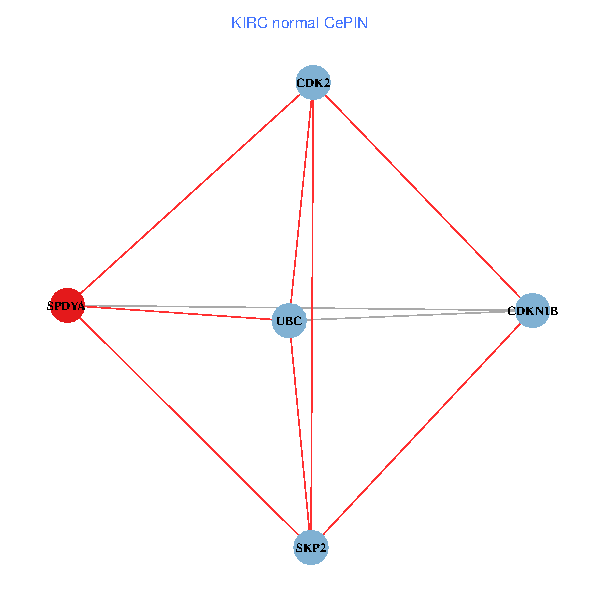
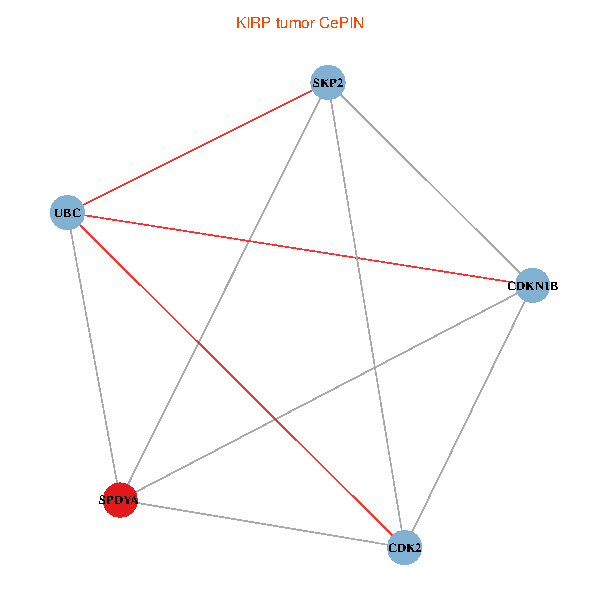
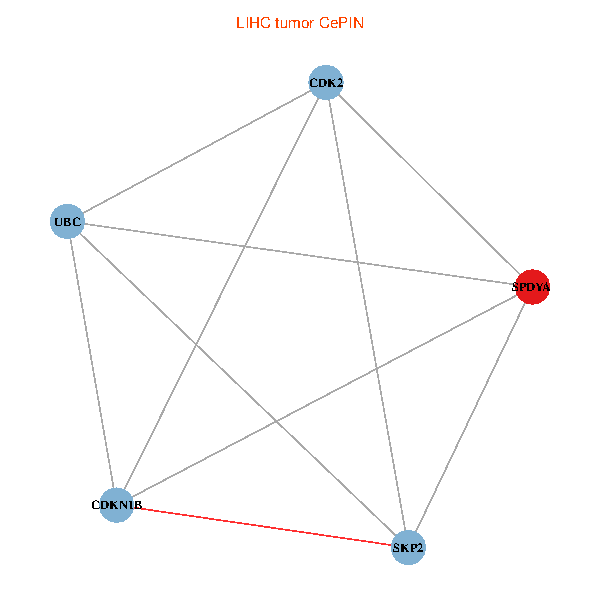
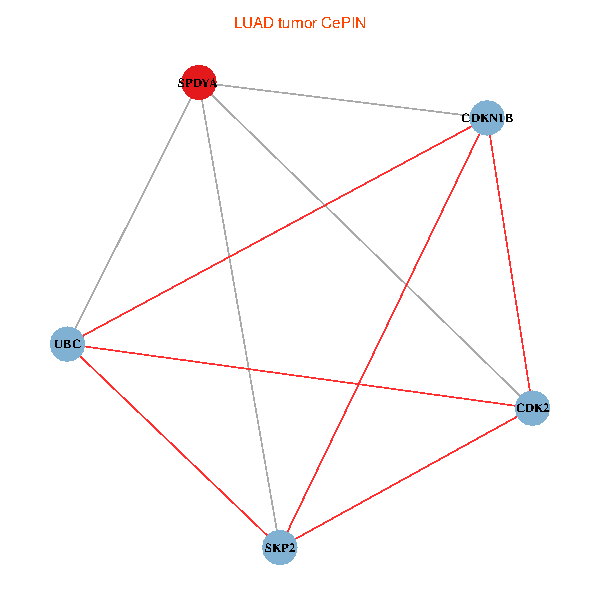
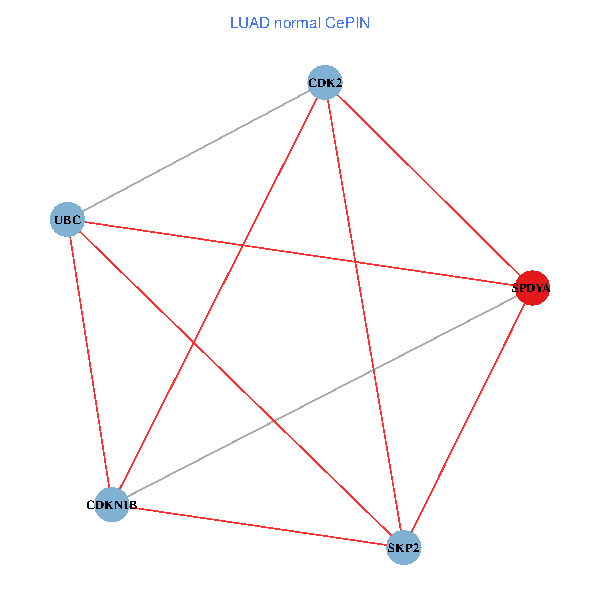
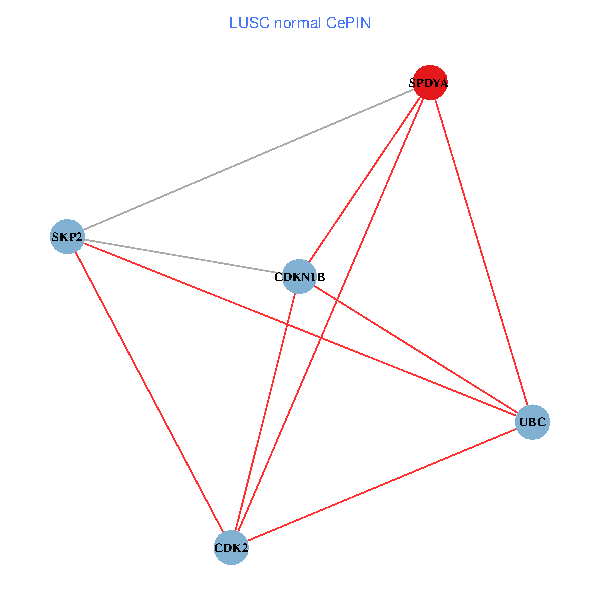
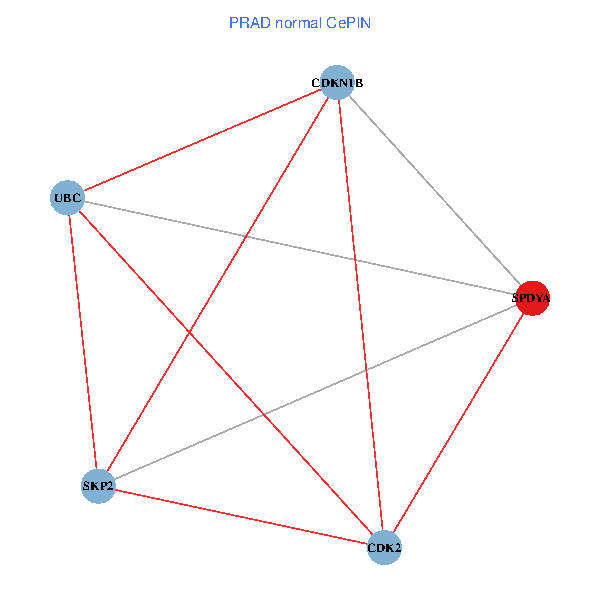
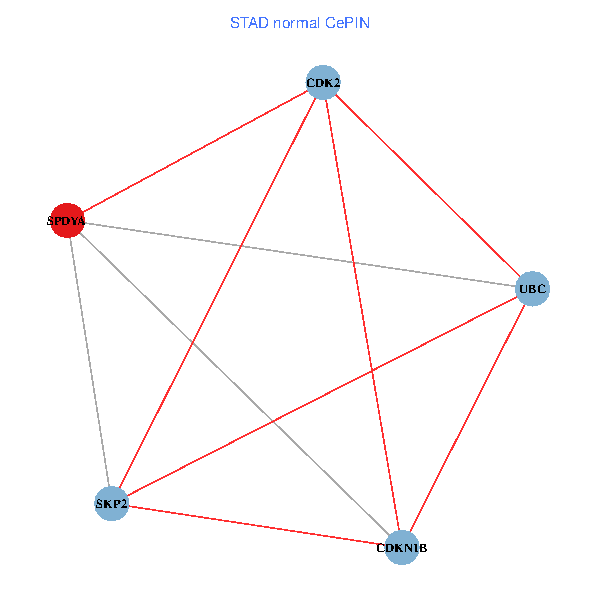
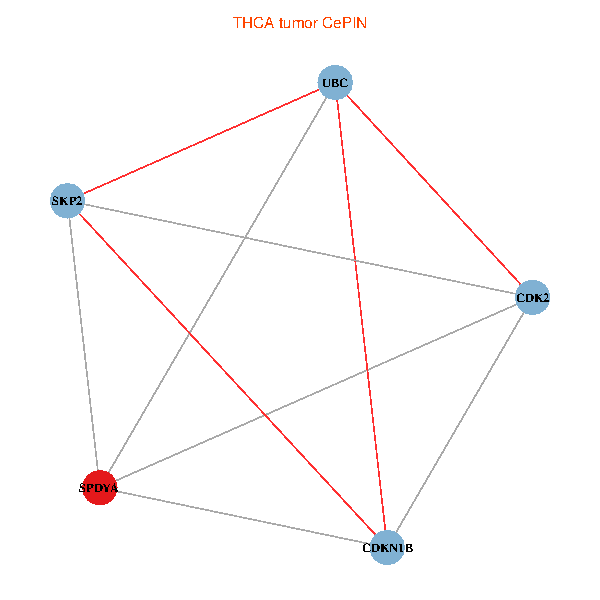
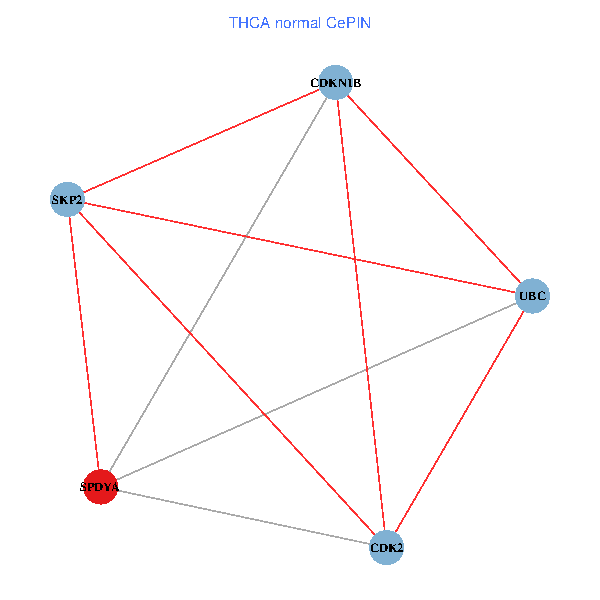
| Co-expressed gene networks based on protein-protein interaction data (CePIN) (TCGA IlluminaHiSeq_RNASeqV2, pan-cancer normalized log2(norm_counts+1) data, version 2016-08-16) (PINA2 ppi data) |
| BRCA (tumor) | BRCA (normal) |
| SPDYA, UBC, CDK2, SKP2, CDKN1B (tumor) | SPDYA, UBC, CDK2, SKP2, CDKN1B (normal) |
 |  |
| COAD (tumor) | COAD (normal) |
| SPDYA, UBC, CDK2, SKP2, CDKN1B (tumor) | SPDYA, UBC, CDK2, SKP2, CDKN1B (normal) |
 |  |
| HNSC (tumor) | HNSC (normal) |
| SPDYA, UBC, CDK2, SKP2, CDKN1B (tumor) | SPDYA, UBC, CDK2, SKP2, CDKN1B (normal) |
 |  |
| KICH (tumor) | KICH (normal) |
| SPDYA, UBC, CDK2, SKP2, CDKN1B (tumor) | SPDYA, UBC, CDK2, SKP2, CDKN1B (normal) |
 |  |
| KIRC (tumor) | KIRC (normal) |
| SPDYA, UBC, CDK2, SKP2, CDKN1B (tumor) | SPDYA, UBC, CDK2, SKP2, CDKN1B (normal) |
 |  |
| KIRP (tumor) | KIRP (normal) |
| SPDYA, UBC, CDK2, SKP2, CDKN1B (tumor) | SPDYA, UBC, CDK2, SKP2, CDKN1B (normal) |
 |  |
| LIHC (tumor) | LIHC (normal) |
| SPDYA, UBC, CDK2, SKP2, CDKN1B (tumor) | SPDYA, UBC, CDK2, SKP2, CDKN1B (normal) |
 |  |
| LUAD (tumor) | LUAD (normal) |
| SPDYA, UBC, CDK2, SKP2, CDKN1B (tumor) | SPDYA, UBC, CDK2, SKP2, CDKN1B (normal) |
 |  |
| LUSC (tumor) | LUSC (normal) |
| SPDYA, UBC, CDK2, SKP2, CDKN1B (tumor) | SPDYA, UBC, CDK2, SKP2, CDKN1B (normal) |
 |  |
| PRAD (tumor) | PRAD (normal) |
| SPDYA, UBC, CDK2, SKP2, CDKN1B (tumor) | SPDYA, UBC, CDK2, SKP2, CDKN1B (normal) |
 |  |
| STAD (tumor) | STAD (normal) |
| SPDYA, UBC, CDK2, SKP2, CDKN1B (tumor) | SPDYA, UBC, CDK2, SKP2, CDKN1B (normal) |
 |  |
| THCA (tumor) | THCA (normal) |
| SPDYA, UBC, CDK2, SKP2, CDKN1B (tumor) | SPDYA, UBC, CDK2, SKP2, CDKN1B (normal) |
 |  |
| Top |
| TissGeneProg for SPDYA |
| Kaplan-Meier plots with logrank tests of overall survival (OS) using 28 cancer types (TCGA IlluminaHiSeq_RNASeqV2, pan-cancer normalized log2(norm_counts+1) data, version 2016-08-16) (TCGA clinicalMatrix, phenotype data, version 2016-04-27) * Click on the image to enlarge it in a new window. |
 |
| Kaplan-Meier plots with logrank test of relapse free survival (RFS) using 28 cancer types (TCGA IlluminaHiSeq_RNASeqV2, pan-cancer normalized log2(norm_counts+1) data, version 2016-08-16) (TCGA clinicalMatrix, phenotype data, version 2016-04-27) * Click on the image enlarge it in a new window. |
 |
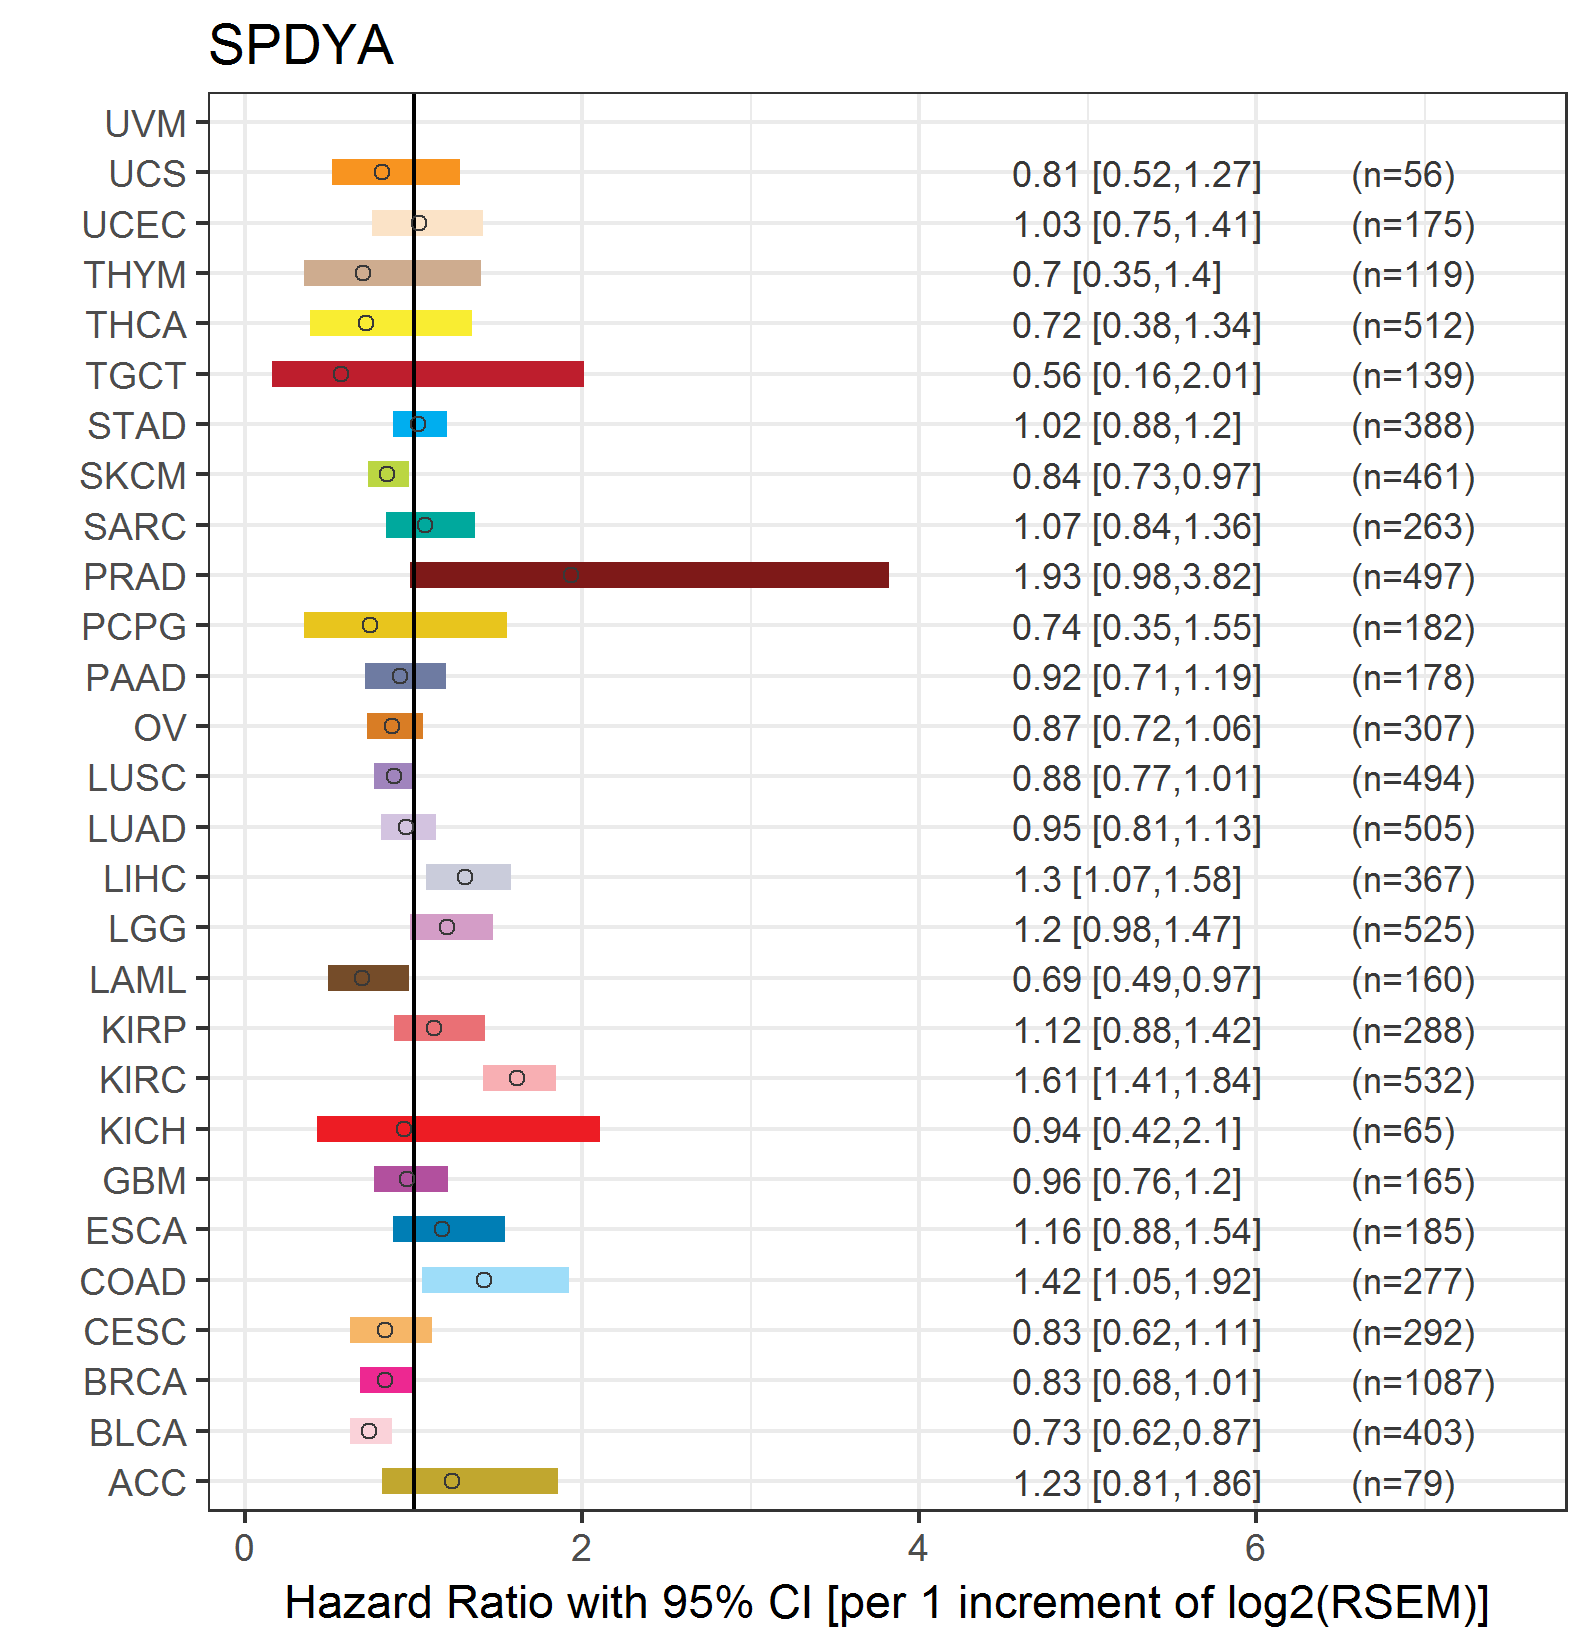
| Forest plot of Cox proportional hazard ratio (HR) and 95% CI of overall survival (OS) using 28 cancer types (TCGA IlluminaHiSeq_RNASeqV2, pan-cancer normalized log2(norm_counts+1) data, version 2016-08-16) (TCGA clinicalMatrix, phenotype data, version 2016-04-27) * Click on the image enlarge it in a new window. |
 |
| Forest plot of Cox proportional hazard ratio (HR) and 95% CI of relapse free survival (RFS) using 28 cancer types (TCGA IlluminaHiSeq_RNASeqV2, pan-cancer normalized log2(norm_counts+1) data, version 2016-08-16) (TCGA clinicalMatrix, phenotype data, version 2016-04-27) * Click on the image enlarge it in a new window. |
 |
| Top |
| TissGeneClin for SPDYA |
| TissGeneDrug for SPDYA |
| Drug information targeting TissGene (DrugBank Version 5.0.6, 2017-04-01) |
| DrugBank ID | Drug name | Drug activity | Drug type | Drug status |
| Top |
| TissGeneDisease for SPDYA |
| Disease information associated with TissGene (DisGeNet, 2016-06-01) |
| Disease ID | Disease name | # pubmeds | Source |
| umls:C0017638 | Glioma | 2 | BeFree |
| umls:C0006142 | Malignant neoplasm of breast | 1 | BeFree |
| umls:C0019158 | Hepatitis | 1 | BeFree |
| umls:C0019159 | Hepatitis A | 1 | BeFree |
| umls:C0555198 | Malignant Glioma | 1 | BeFree |
| umls:C0596263 | Carcinogenesis | 1 | BeFree |
| umls:C0678222 | Breast Carcinoma | 1 | BeFree |
| umls:C2239176 | Liver carcinoma | 1 | BeFree |
|
Copyright 2016-Present - The University of Texas Health Science Center at Houston (UTHealth) Web File Viewing | How to Report, Fraud, Waste and Abuse | State of Texas | Statewide Search | Texas Homeland Security | Site Policies |