 |
| |
| |
| |
| |
| |
| |
|

| TissGeneSummary for PLA2G4F |
 Gene summary Gene summary |
| Basic gene information | Gene symbol | PLA2G4F |
| Gene name | phospholipase A2, group IVF | |
| Synonyms | PLA2G4FZ | |
| Cytomap | UCSC genome browser: 15q15.1 | |
| Type of gene | protein-coding | |
| RefGenes | NM_213600.3, NR_033151.1, | |
| Description | cPLA2-zetacytosolic phospholipase A2 zeta | |
| Modification date | 20141207 | |
| dbXrefs | HGNC : HGNC | |
| HPRD : 17326 | ||
| Protein | UniProt: go to UniProt's Cross Reference DB Table | |
| Expression | CleanEX: HS_PLA2G4F | |
| BioGPS: 255189 | ||
| Pathway | NCI Pathway Interaction Database: PLA2G4F | |
| KEGG: PLA2G4F | ||
| REACTOME: PLA2G4F | ||
| Pathway Commons: PLA2G4F | ||
| Context | iHOP: PLA2G4F | |
| ligand binding site mutation search in PubMed: PLA2G4F | ||
| UCL Cancer Institute: PLA2G4F | ||
| Assigned class in TissGDB* | B | |
| Included tissue-specific gene expression resources | HPA,TiGER,GTEx | |
| Specific-tissues in normal samples (assigned by TissGDB using HPA, TiGER, and GTEx) | ProstateSkin | |
| Cancer types related to the specific-tissues in cancer samples (assigned by TissGDB using TCGA) | PRADSKCM | |
| Reference showing the relevant tissue of PLA2G4F | ||
| Description by TissGene annotations | Protective TissGene in RFS | |
| * Class A consists of genes with literature evidence and is part of the cTissGenes. Class B consists of only cTissGenes without additional evidence. The remaining genes belong to Class C. |
| Gene ontology having evidence of Inferred from Direct Assay (IDA) from Entrez |
| GO ID | GO term | PubMed ID |
| Top |
| TissGeneExp for PLA2G4F |
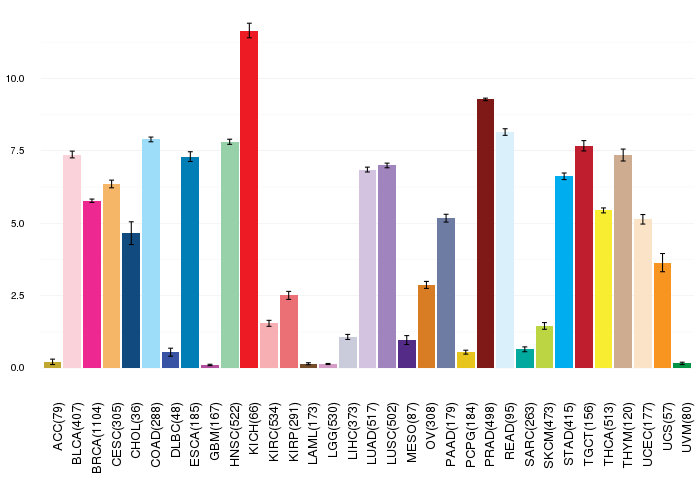
| Gene expressions across 28 cancer types (X-axis: cancer type and Y-axis: log2(norm_counts+1)) (TCGA IlluminaHiSeq_RNASeqV2, pan-cancer normalized log2(norm_counts+1) data, version 2016-08-16) |
 |
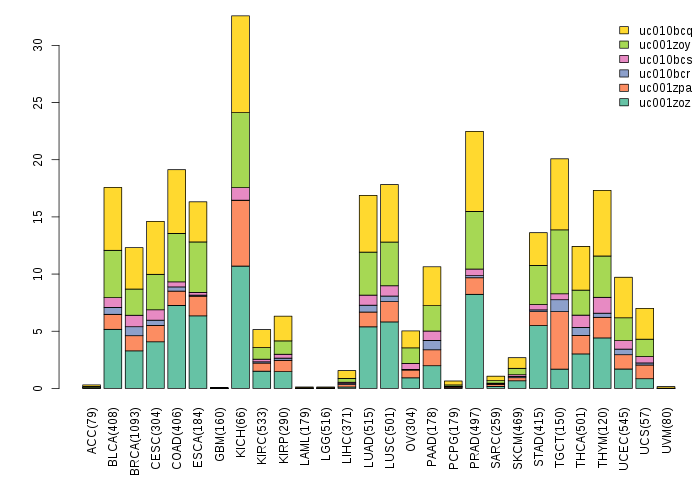
| Gene isoform expressions across 28 cancer types (X-axis: cancer type and Y-axis: log2(norm_counts+1)) (TCGA pan-cancer tcga_rsem_isoform_tpm, version 2016-09-01) |
 |
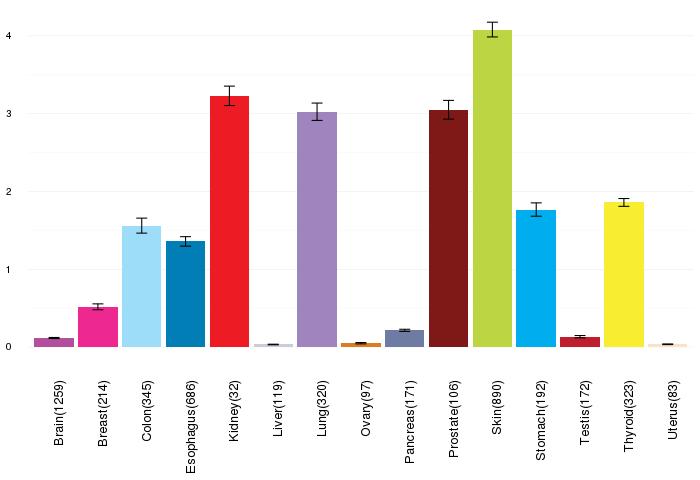
| Gene expressions across normal tissues of GTEx data (GTEx GTEx_Analysis_v6_RNA-seq_RNA-SeQCv1.1.8_gene_rpkm.gct) - Here, we shows the matched tissue types only among our 28 cancer types. |
 |
| Different expressions across 14 cancer types with more than 10 samples between matched tumors and normals (X-axis: cancer type and Y-axis: log2(norm_counts+1)) (TCGA IlluminaHiSeq_RNASeqV2, pan-cancer normalized log2(norm_counts+1) data, version 2016-08-16) |
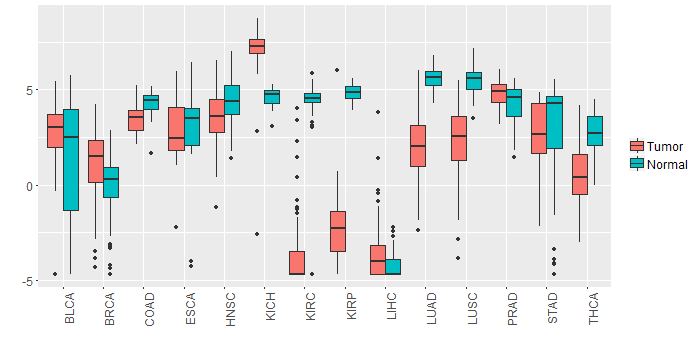 |
| - Significantly differentially expressed cancer types and information. (|Fold change|>1 and FDR<0.05) |
| Cancer type | Mean(exp) in tumor | Mean(exp) in matched normal | Log2FC | P-val. | FDR |
| KIRC | -3.559153299 | 4.39956059 | -7.958713889 | 1.26E-55 | 3.14E-53 |
| BRCA | 1.085039245 | -0.218239702 | 1.303278947 | 9.60E-08 | 2.89E-07 |
| KIRP | -2.104912674 | 4.857999826 | -6.9629125 | 5.26E-19 | 2.81E-17 |
| LUSC | 2.275909936 | 5.533215819 | -3.257305882 | 3.22E-17 | 2.63E-16 |
| THCA | 0.555653905 | 2.795411532 | -2.239757627 | 1.27E-15 | 1.80E-14 |
| LUAD | 1.882101011 | 5.594059632 | -3.711958621 | 6.28E-22 | 1.58E-20 |
| KICH | 6.716869701 | 4.607613701 | 2.109256 | 9.36E-05 | 0.000245881 |
| Top |
| TissGene-miRNA for PLA2G4F |
| Significantly anti-correlated miRNAs of TissGene across 28 cancer types (Gene-miRNA relations from TargetScanHuman Relsease 7.1, Conserved_Site_Context_Scores.txt.zip, 06.01.2016) (TCGA IlluminaHiSeq_miRNASeq, log2(RPM+1) data, version 2016-11-21) (TCGA IlluminaHiSeq_RNASeqV2, log2(normalized_count+1) data, version 2016-08-16) (Spearman’s Rank Correlation (p-value<0.05 and coefficient<-0.25)) |
| Cancer type | miRNA id | miRNA accession | P-val. | Coeff. | # samples |
| Top |
| TissGeneMut for PLA2G4F |
| TissGeneSNV for PLA2G4F |
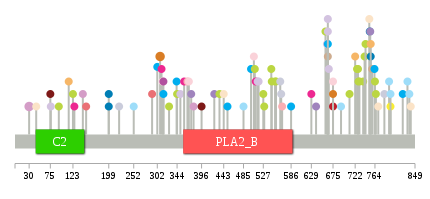
| nsSNV counts per each loci. Different colors of circles represent different cancer types. Circle size denotes number of samples. (TCGA somatic mutation (SNPs and small INDELs) data, version 2016-04-25) * Click on the image to enlarge it in a new window. |
 |
 |
| Somatic nucleotide variants of TissGene across 28 cancer types (X-axis: cancer type and Y-axis: % of mutated samples) The numbers in parentheses are numbers of samples with mutation (nsSNVs). (TCGA somatic mutation (SNPs and small INDELs) data, version 2016-04-25) |
 |
| - nsSNVs sorted by frequency. |
| AAchange | Cancer type | # samples |
| p.G30V | LGG | 2 |
| p.S308_splice | OV | 2 |
| p.V823I | STAD | 1 |
| p.T75M | PRAD | 1 |
| p.R315H | GBM | 1 |
| p.P758H | THYM | 1 |
| p.Y586C | STAD | 1 |
| p.A379T | LGG | 1 |
| p.A666T | LUAD | 1 |
| p.R675W | BLCA | 1 |
| p.S302I | STAD | 1 |
| p.D311N | BRCA | 1 |
| p.E199* | ESCA | 1 |
| p.P729L | SKCM | 1 |
| p.F763V | STAD | 1 |
| p.V501I | STAD | 1 |
| p.G544R | SKCM | 1 |
| p.G344E | SKCM | 1 |
| p.L507F | BLCA | 1 |
| p.S591N | HNSC | 1 |
| p.G374C | LUSC | 1 |
| p.A563T | LIHC | 1 |
| p.Q423H | LUSC | 1 |
| p.L252V | COAD | 1 |
| p.R768H | HNSC | 1 |
| p.G378E | HNSC | 1 |
| p.L221Q | LIHC | 1 |
| p.R545Q | SKCM | 1 |
| p.G380E | HNSC | 1 |
| p.P766L | SKCM | 1 |
| p.T144I | LGG | 1 |
| p.K717R | DLBC | 1 |
| p.R675Q | TGCT | 1 |
| p.R728* | SKCM | 1 |
| p.A692P | COAD | 1 |
| p.R552Q | SKCM | 1 |
| p.E753D | ESCA | 1 |
| p.S351R | LUAD | 1 |
| p.E742K | SKCM | 1 |
| p.D754N | LUSC | 1 |
| p.R840W | UCEC | 1 |
| p.T366I | KIRC | 1 |
| p.E515K | LUAD | 1 |
| p.E755K | CESC | 1 |
| p.E286A | HNSC | 1 |
| p.L343M | STAD | 1 |
| p.A833T | COAD | 1 |
| p.R629C | BRCA | 1 |
| p.S710F | SKCM | 1 |
| p.A664T | THYM | 1 |
| p.G509E | SKCM | 1 |
| p.E722K | CESC | 1 |
| p.A664T | STAD | 1 |
| p.P739S | SKCM | 1 |
| p.D45A | UCEC | 1 |
| p.A511S | BRCA | 1 |
| p.E784K | LIHC | 1 |
| p.G529R | SKCM | 1 |
| p.A752D | UCEC | 1 |
| p.A563T | READ | 1 |
| p.F327Y | SKCM | 1 |
| p.A567G | KIRC | 1 |
| p.N794S | COAD | 1 |
| p.V396I | PRAD | 1 |
| p.D659N | SKCM | 1 |
| p.R554Q | SKCM | 1 |
| p.P764L | SKCM | 1 |
| p.R770H | HNSC | 1 |
| p.E517K | LUAD | 1 |
| p.E744K | SKCM | 1 |
| p.P662Q | LUAD | 1 |
| p.A76E | CHOL | 1 |
| p.T639I | LUSC | 1 |
| p.E199X | ESCA | 1 |
| p.A485V | COAD | 1 |
| p.V291A | KIRP | 1 |
| p.R726X | SKCM | 1 |
| p.E93K | SKCM | 1 |
| p.R423H | HNSC | 1 |
| p.A565T | LIHC | 1 |
| p.D797E | COAD | 1 |
| p.R797S | THCA | 1 |
| p.A76V | LUAD | 1 |
| p.R315C | STAD | 1 |
| p.C675S | OV | 1 |
| p.A837D | COAD | 1 |
| p.S126C | BRCA | 1 |
| p.E755D | ESCA | 1 |
| p.D313H | BLCA | 1 |
| p.R451C | STAD | 1 |
| p.E298Q | HNSC | 1 |
| p.V359G | BRCA | 1 |
| p.R771H | UCEC | 1 |
| p.R369Q | BLCA | 1 |
| p.A664T | LUAD | 1 |
| p.R758H | HNSC | 1 |
| p.G527R | SKCM | 1 |
| p.D151N | KIRP | 1 |
| p.G527R | READ | 1 |
| p.L114F | CESC | 1 |
| p.P731L | SKCM | 1 |
| p.P664Q | LUAD | 1 |
| p.G434E | SKCM | 1 |
| p.T443S | UCEC | 1 |
| p.D123N | SKCM | 1 |
| Top |
| TissGeneCNV for PLA2G4F |
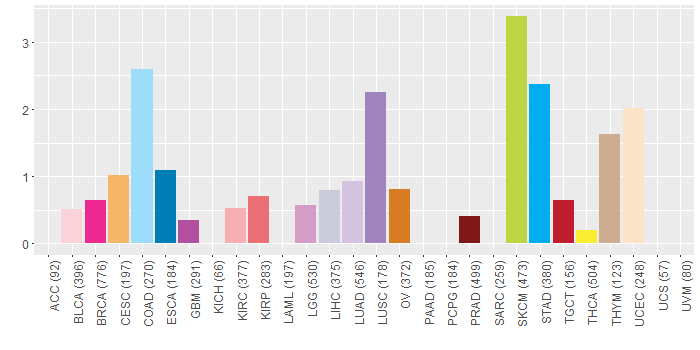
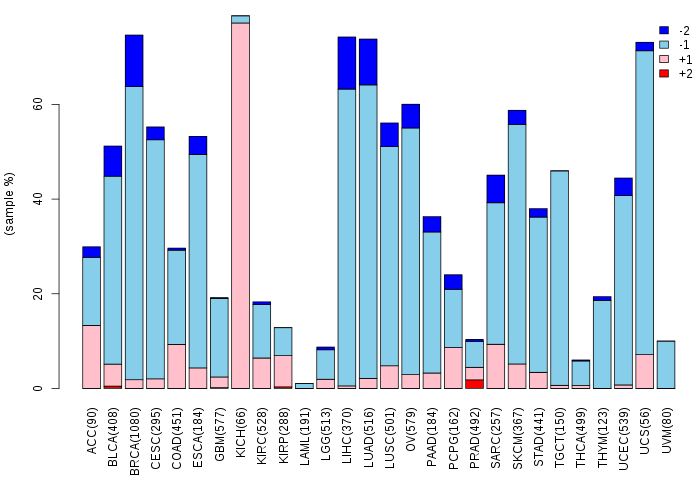
| Copy number variations of TissGene across 28 cancer types (X-axis: cancer type and Y-axis: % of CNV samples) (TCGA Gistic2_CopyNumber_Gistic2_all_data_by_genes, Gistic2 copy number data, version 2016-08-16) |
 |
| Top |
| TissGeneFusions for PLA2G4F |
| Fusion genes including TissGene (ChimerDB 3.0, 2016-12-01 and TCGA fusion Portal 2015-12-01) |
| Database | Src | Cancer type | Sample | Fusion gene | ORF | 5'-gene BP | 3'-gene BP |
| Top |
| TissGeneNet for PLA2G4F |
| Co-expressed gene networks based on protein-protein interaction data (CePIN) (TCGA IlluminaHiSeq_RNASeqV2, pan-cancer normalized log2(norm_counts+1) data, version 2016-08-16) (PINA2 ppi data) |
| Top |
| TissGeneProg for PLA2G4F |
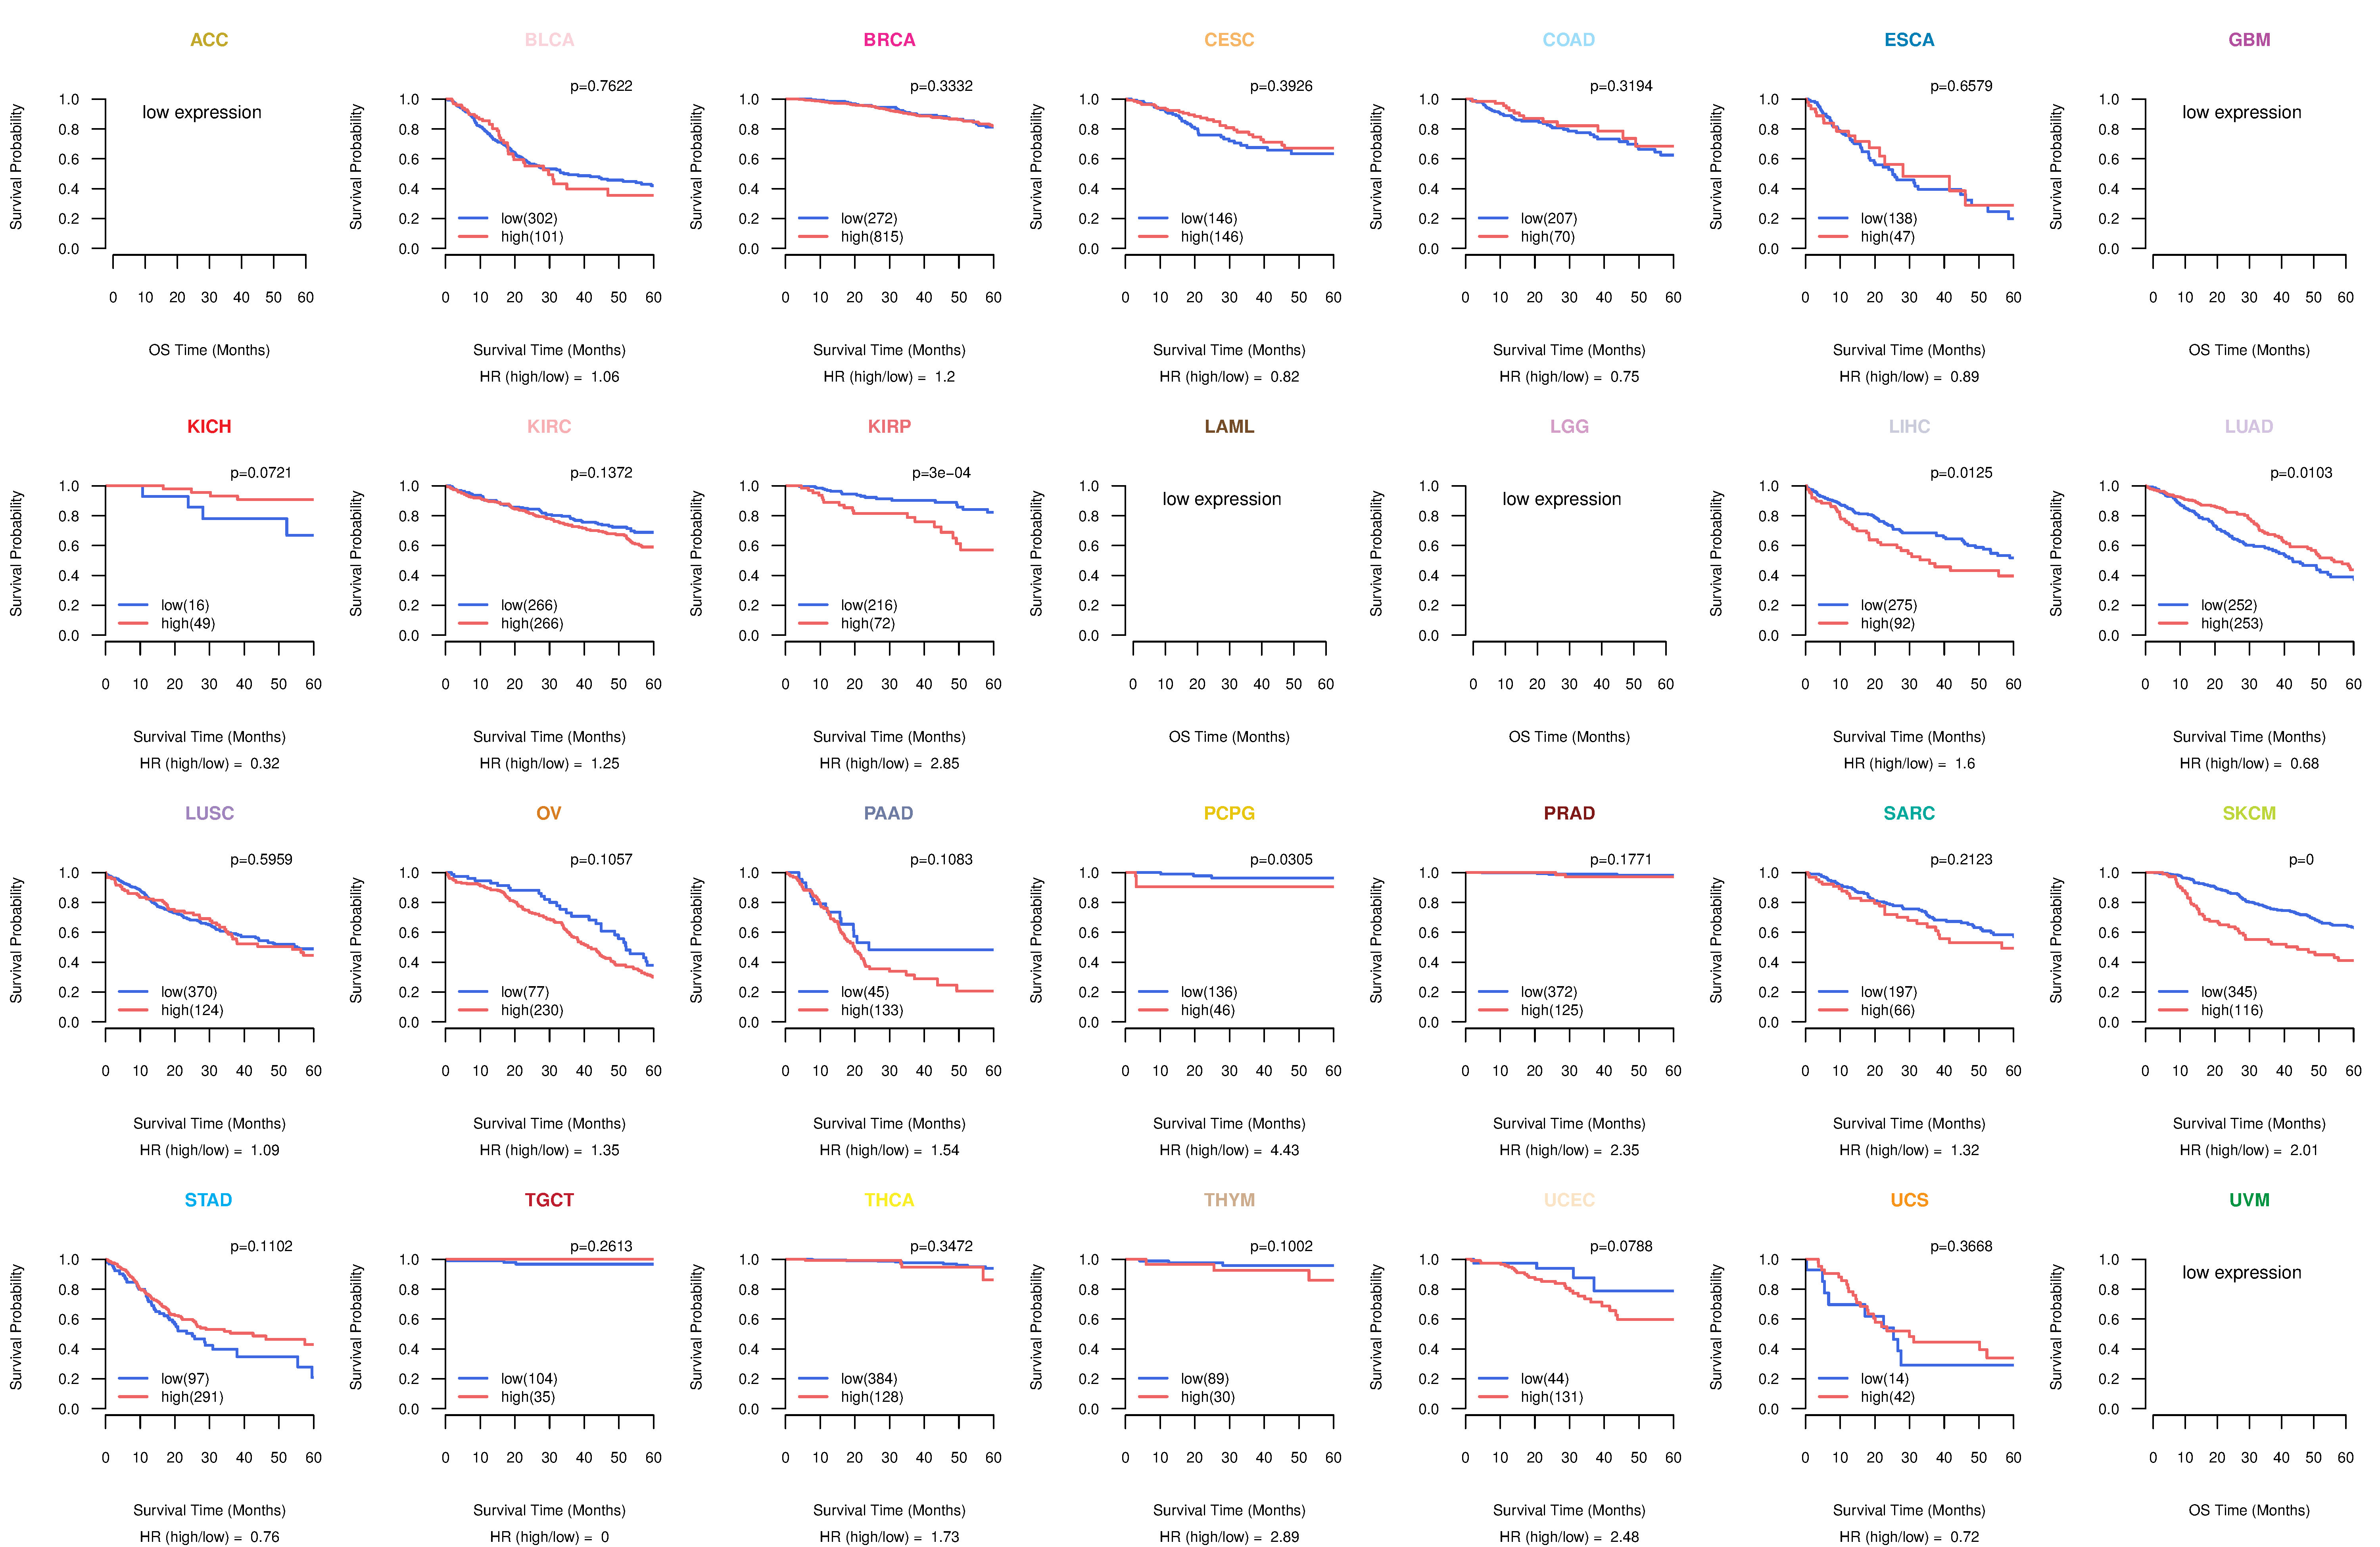
| Kaplan-Meier plots with logrank tests of overall survival (OS) using 28 cancer types (TCGA IlluminaHiSeq_RNASeqV2, pan-cancer normalized log2(norm_counts+1) data, version 2016-08-16) (TCGA clinicalMatrix, phenotype data, version 2016-04-27) * Click on the image to enlarge it in a new window. |
 |
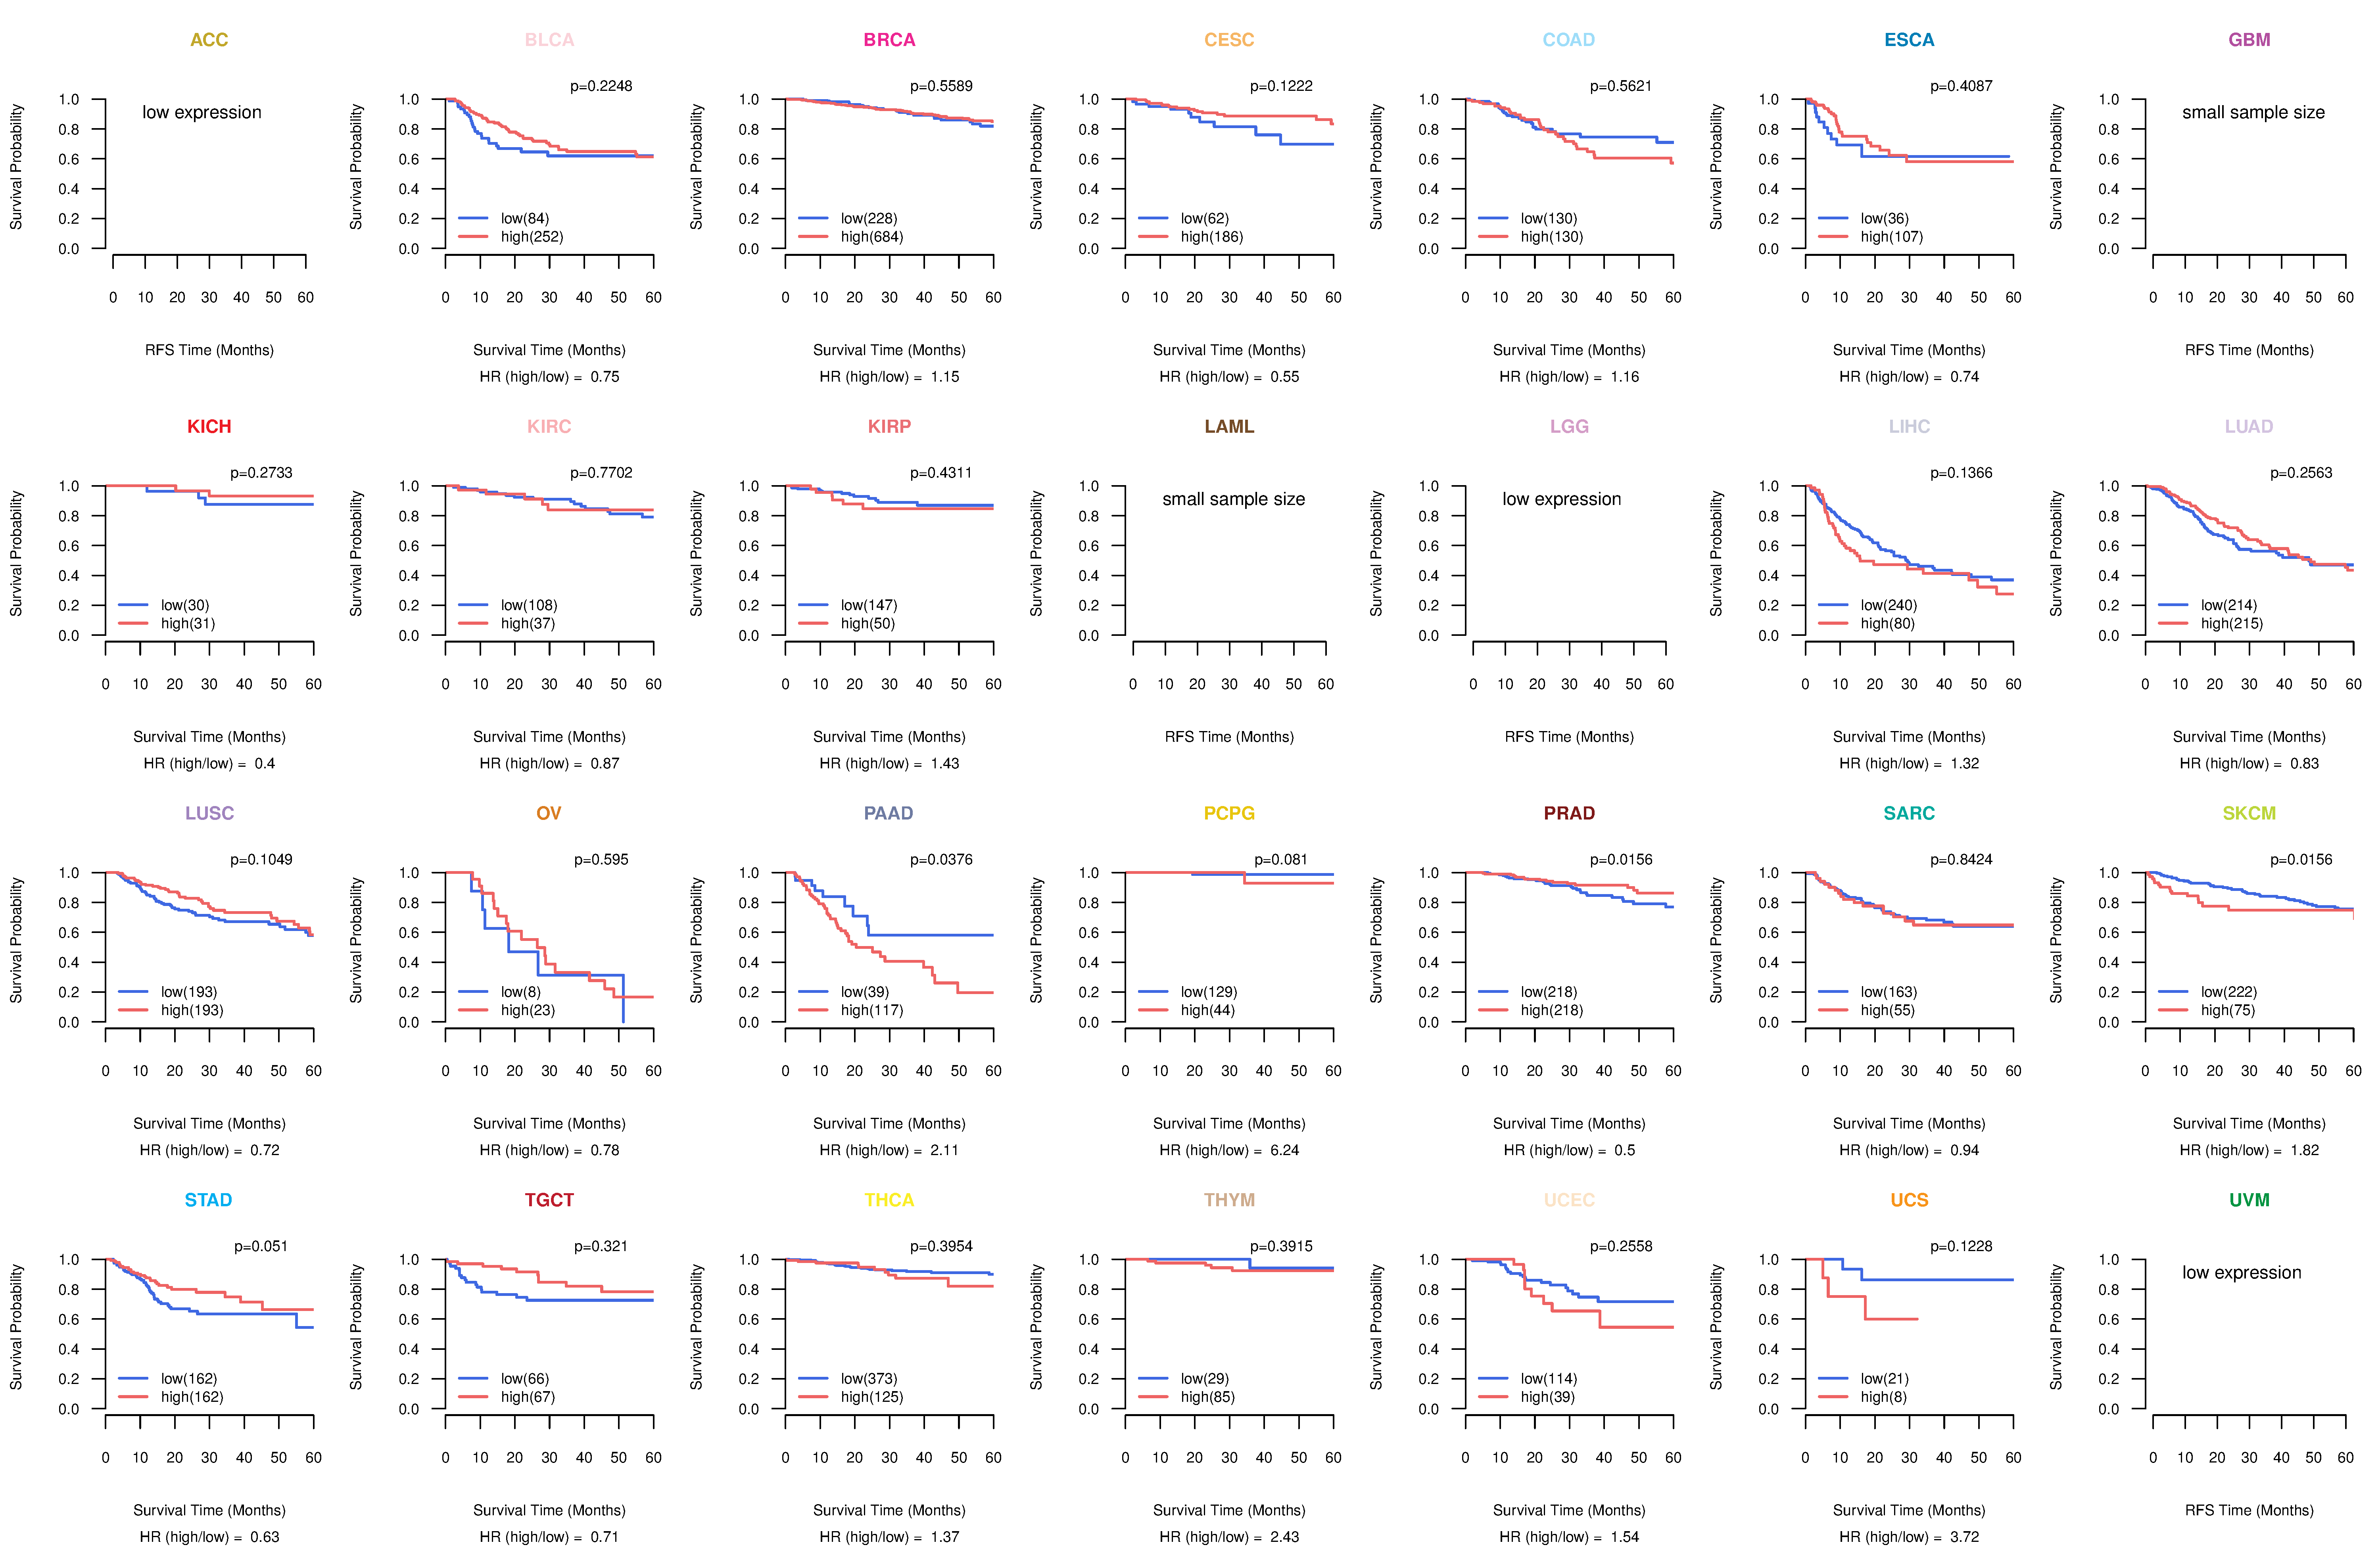
| Kaplan-Meier plots with logrank test of relapse free survival (RFS) using 28 cancer types (TCGA IlluminaHiSeq_RNASeqV2, pan-cancer normalized log2(norm_counts+1) data, version 2016-08-16) (TCGA clinicalMatrix, phenotype data, version 2016-04-27) * Click on the image enlarge it in a new window. |
 |
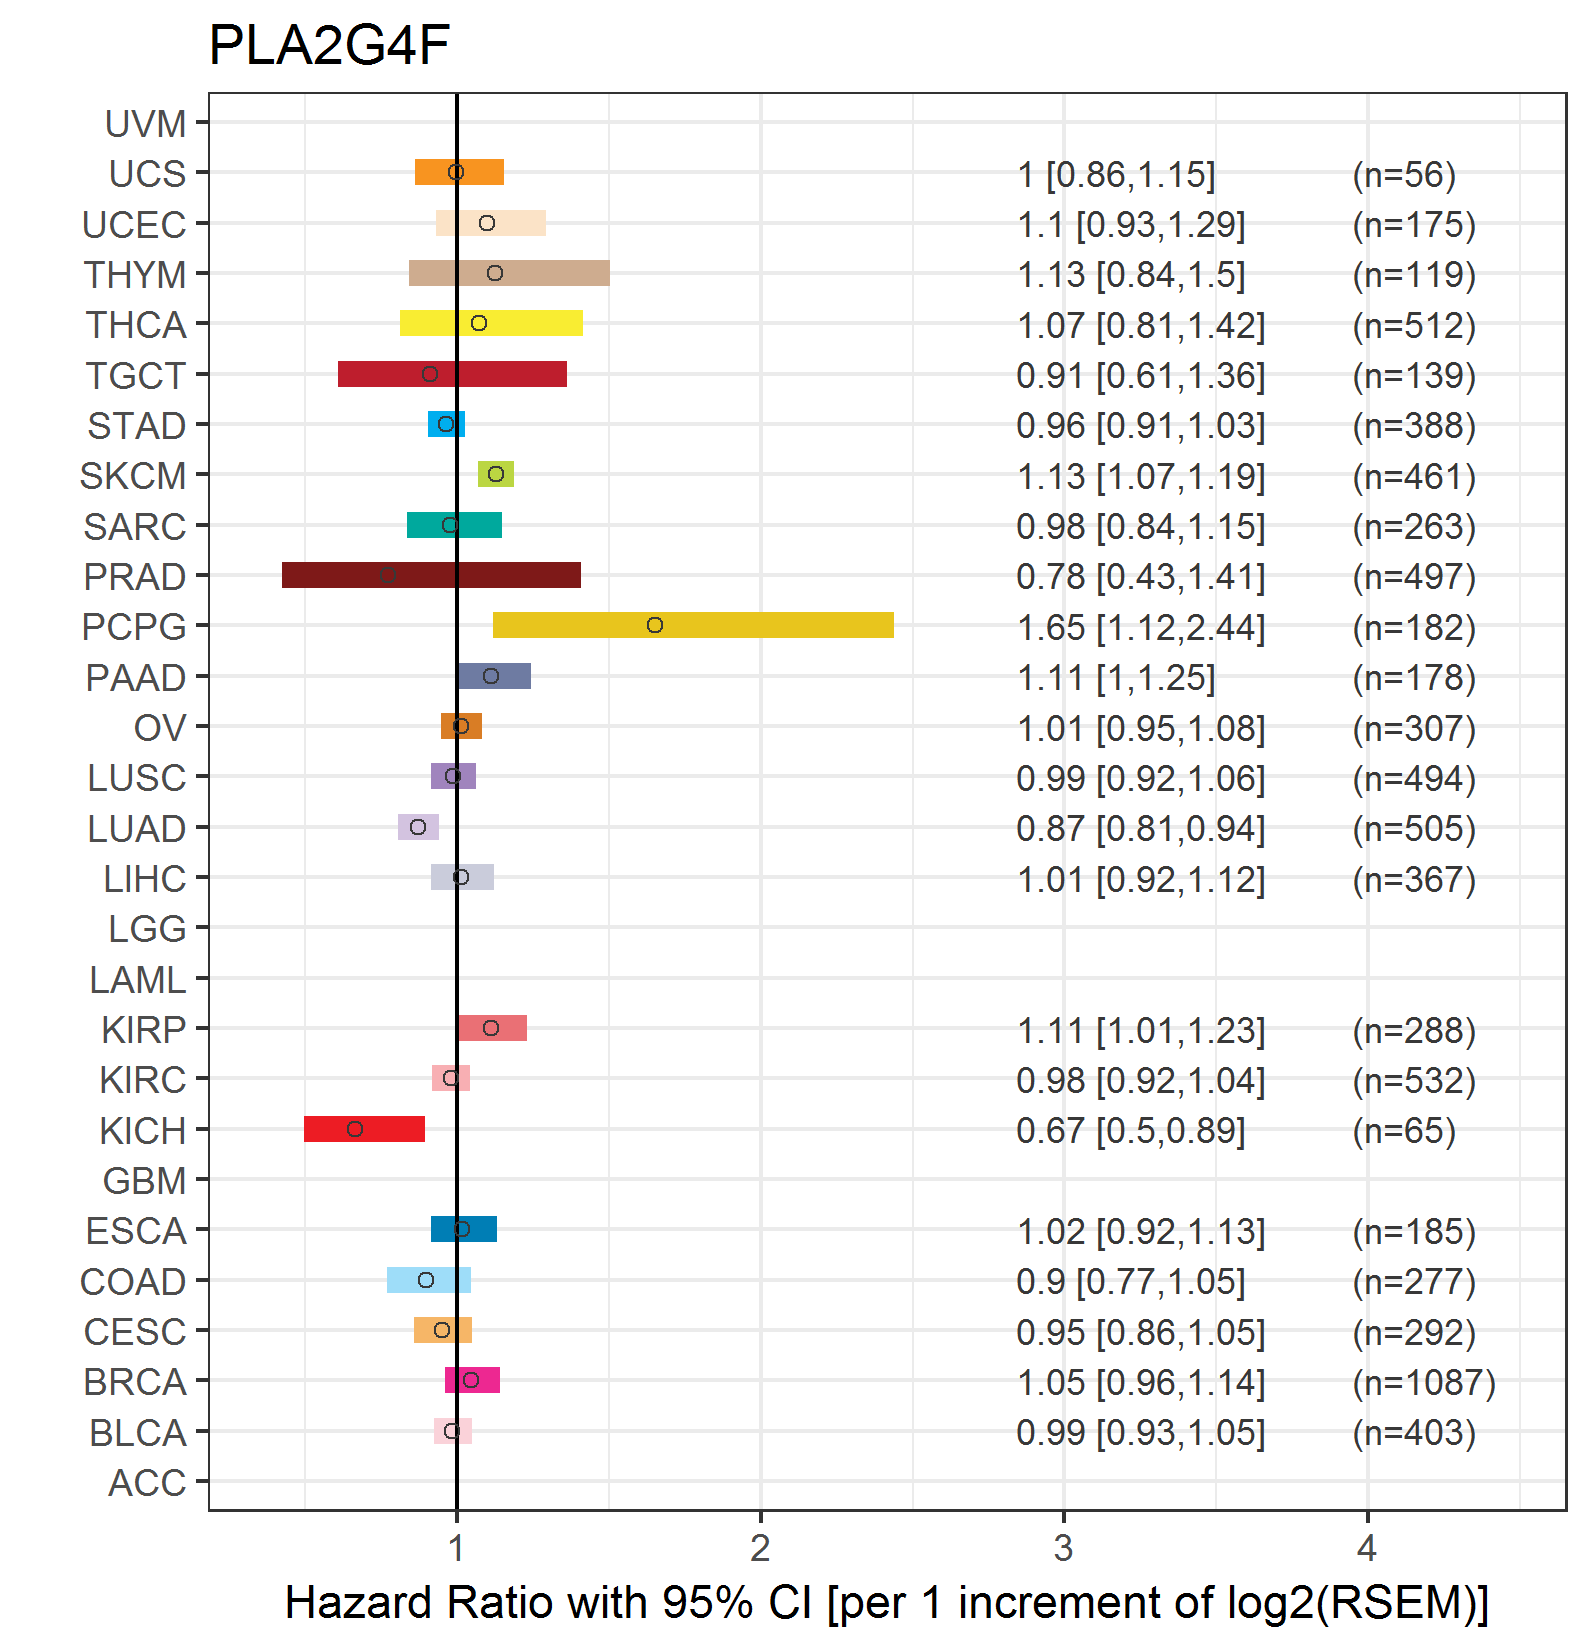
| Forest plot of Cox proportional hazard ratio (HR) and 95% CI of overall survival (OS) using 28 cancer types (TCGA IlluminaHiSeq_RNASeqV2, pan-cancer normalized log2(norm_counts+1) data, version 2016-08-16) (TCGA clinicalMatrix, phenotype data, version 2016-04-27) * Click on the image enlarge it in a new window. |
 |
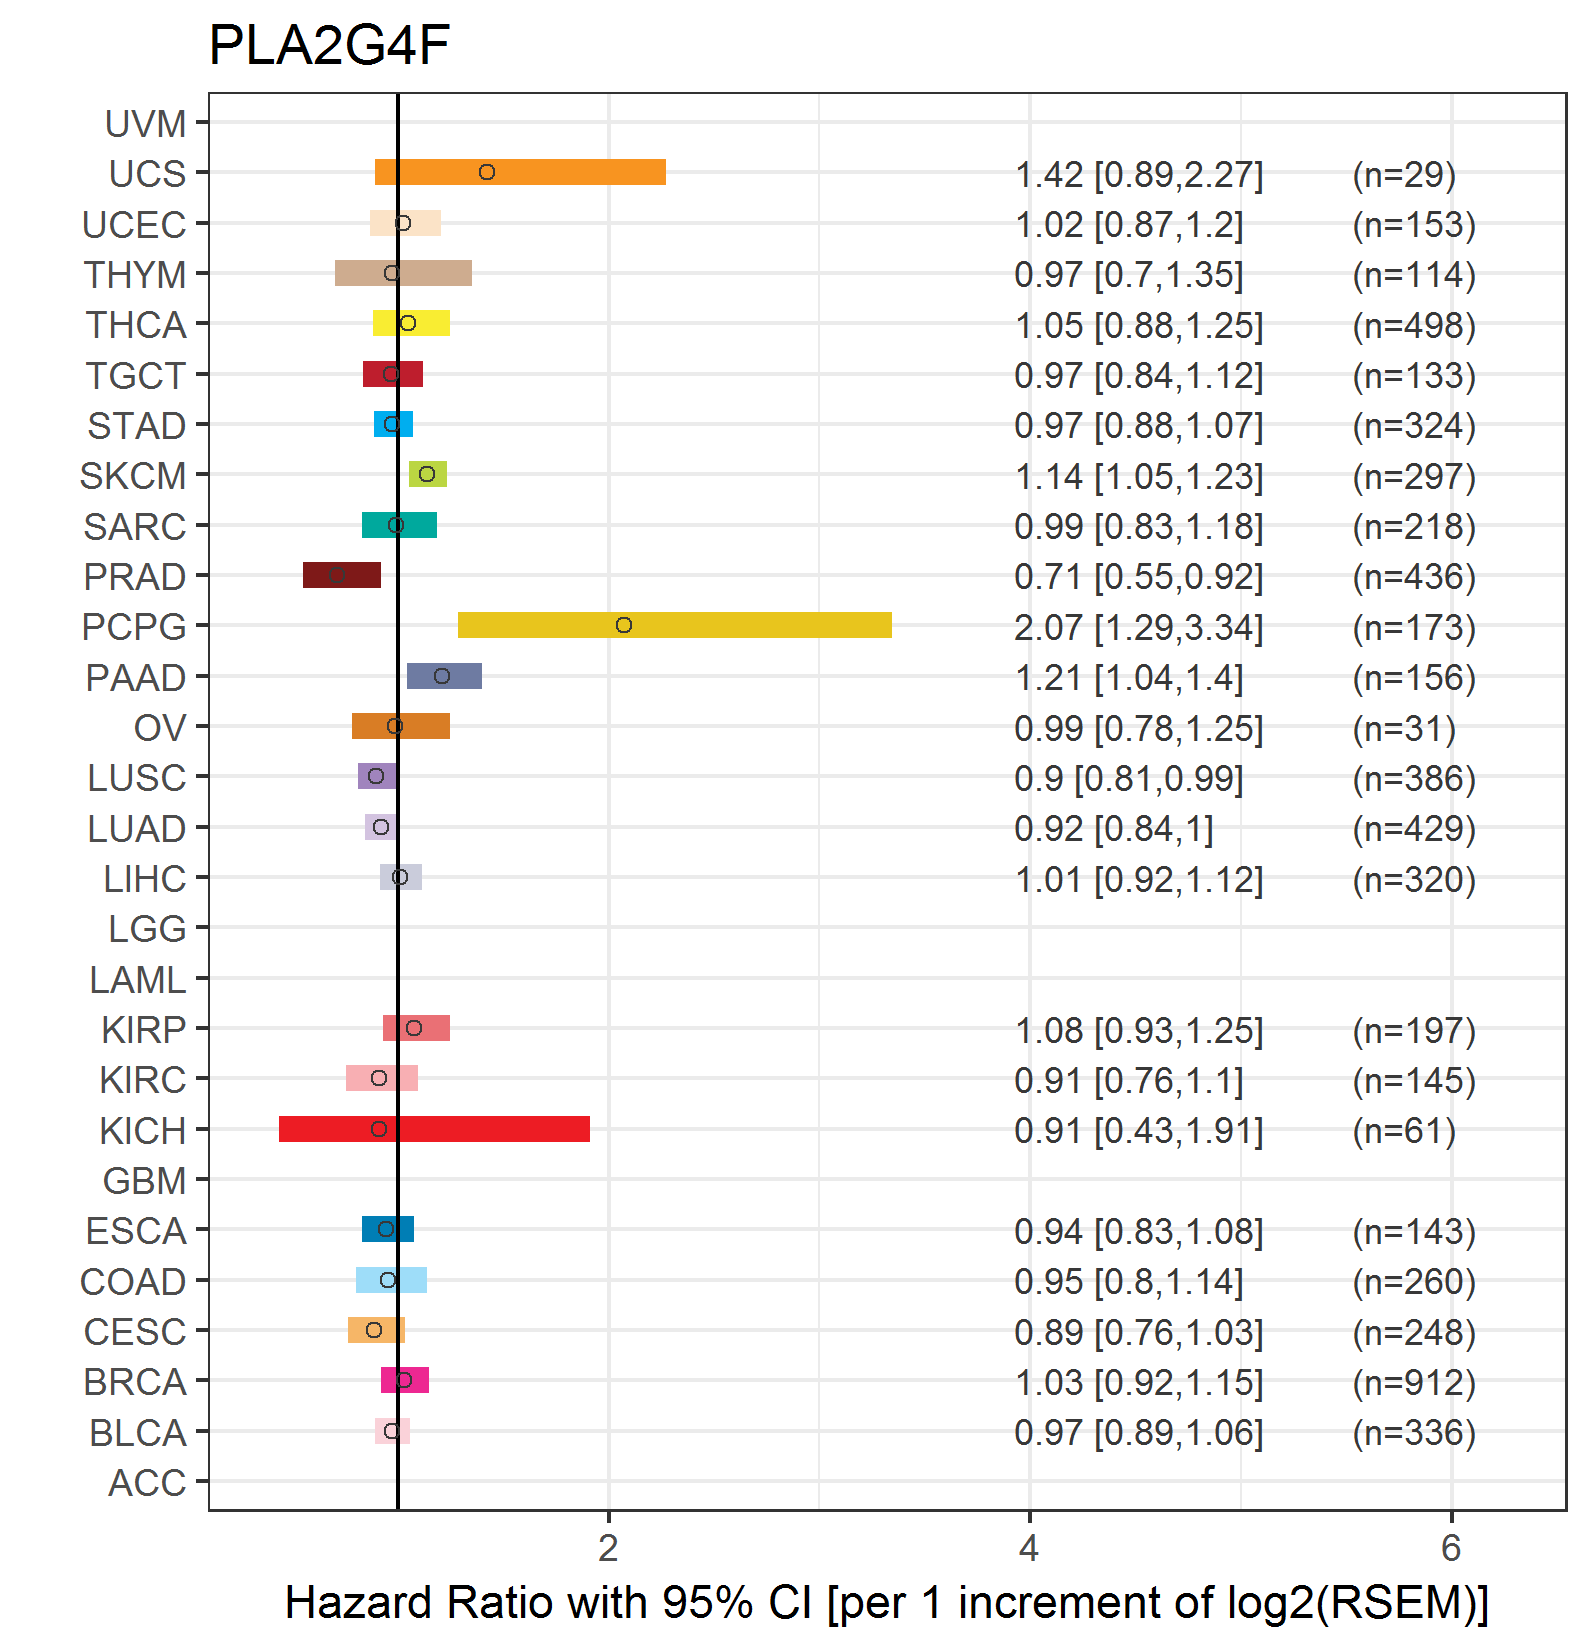
| Forest plot of Cox proportional hazard ratio (HR) and 95% CI of relapse free survival (RFS) using 28 cancer types (TCGA IlluminaHiSeq_RNASeqV2, pan-cancer normalized log2(norm_counts+1) data, version 2016-08-16) (TCGA clinicalMatrix, phenotype data, version 2016-04-27) * Click on the image enlarge it in a new window. |
 |
| Top |
| TissGeneClin for PLA2G4F |
| TissGeneDrug for PLA2G4F |
| Drug information targeting TissGene (DrugBank Version 5.0.6, 2017-04-01) |
| DrugBank ID | Drug name | Drug activity | Drug type | Drug status |
| Top |
| TissGeneDisease for PLA2G4F |
| Disease information associated with TissGene (DisGeNet, 2016-06-01) |
| Disease ID | Disease name | # pubmeds | Source |
|
Copyright 2016-Present - The University of Texas Health Science Center at Houston (UTHealth) Web File Viewing | How to Report, Fraud, Waste and Abuse | State of Texas | Statewide Search | Texas Homeland Security | Site Policies |