 |
| |
| |
| |
| |
| |
| |
|

| TissGeneSummary for GAMT |
 Gene summary Gene summary |
| Basic gene information | Gene symbol | GAMT |
| Gene name | guanidinoacetate N-methyltransferase | |
| Synonyms | CCDS2|HEL-S-20|PIG2|TP53I2 | |
| Cytomap | UCSC genome browser: 19p13.3 | |
| Type of gene | protein-coding | |
| RefGenes | NM_000156.5, NM_138924.2, | |
| Description | epididymis secretory protein Li 20 | |
| Modification date | 20141219 | |
| dbXrefs | MIM : 601240 | |
| HGNC : HGNC | ||
| Ensembl : ENSG00000130005 | ||
| HPRD : 03142 | ||
| Vega : OTTHUMG00000180095 | ||
| Protein | UniProt: go to UniProt's Cross Reference DB Table | |
| Expression | CleanEX: HS_GAMT | |
| BioGPS: 2593 | ||
| Pathway | NCI Pathway Interaction Database: GAMT | |
| KEGG: GAMT | ||
| REACTOME: GAMT | ||
| Pathway Commons: GAMT | ||
| Context | iHOP: GAMT | |
| ligand binding site mutation search in PubMed: GAMT | ||
| UCL Cancer Institute: GAMT | ||
| Assigned class in TissGDB* | C | |
| Included tissue-specific gene expression resources | TiGER,GTEx | |
| Specific-tissues in normal samples (assigned by TissGDB using HPA, TiGER, and GTEx) | Liver | |
| Cancer types related to the specific-tissues in cancer samples (assigned by TissGDB using TCGA) | LIHC | |
| Reference showing the relevant tissue of GAMT | ||
| Description by TissGene annotations | ||
| * Class A consists of genes with literature evidence and is part of the cTissGenes. Class B consists of only cTissGenes without additional evidence. The remaining genes belong to Class C. |
| Gene ontology having evidence of Inferred from Direct Assay (IDA) from Entrez |
| GO ID | GO term | PubMed ID | GO:0006601 | creatine biosynthetic process | 8651275 | GO:0006601 | creatine biosynthetic process | 8651275 |
| Top |
| TissGeneExp for GAMT |
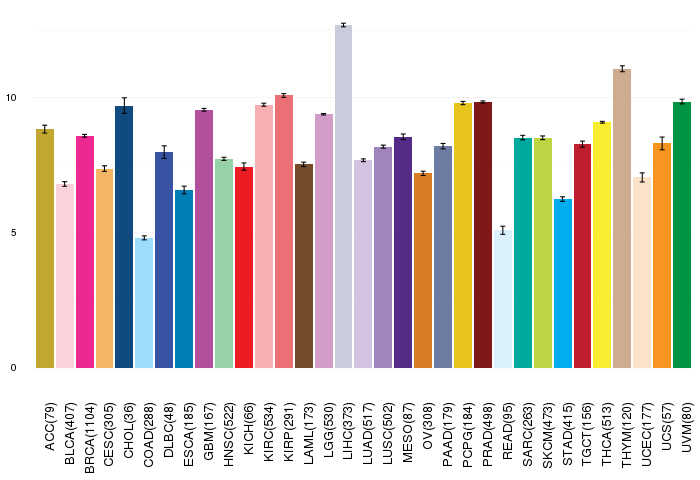
| Gene expressions across 28 cancer types (X-axis: cancer type and Y-axis: log2(norm_counts+1)) (TCGA IlluminaHiSeq_RNASeqV2, pan-cancer normalized log2(norm_counts+1) data, version 2016-08-16) |
 |
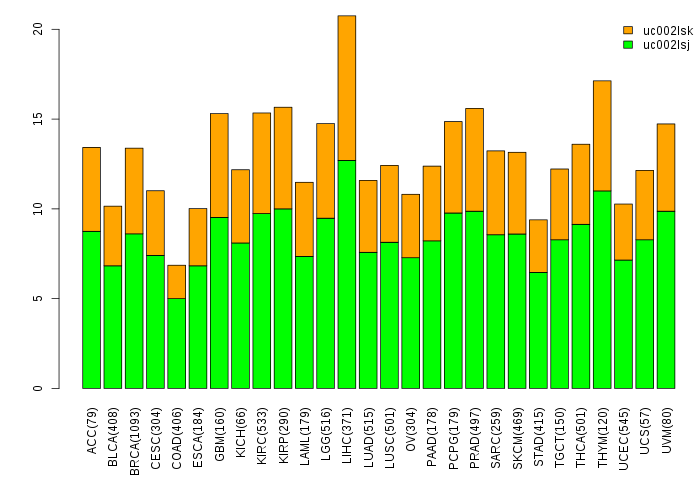
| Gene isoform expressions across 28 cancer types (X-axis: cancer type and Y-axis: log2(norm_counts+1)) (TCGA pan-cancer tcga_rsem_isoform_tpm, version 2016-09-01) |
 |
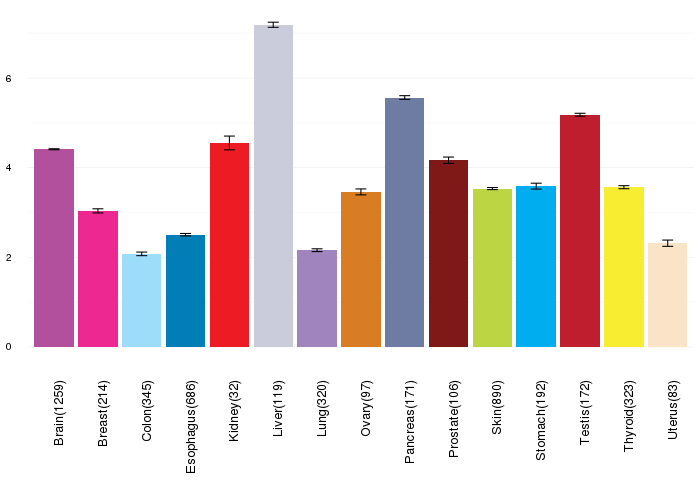
| Gene expressions across normal tissues of GTEx data (GTEx GTEx_Analysis_v6_RNA-seq_RNA-SeQCv1.1.8_gene_rpkm.gct) - Here, we shows the matched tissue types only among our 28 cancer types. |
 |
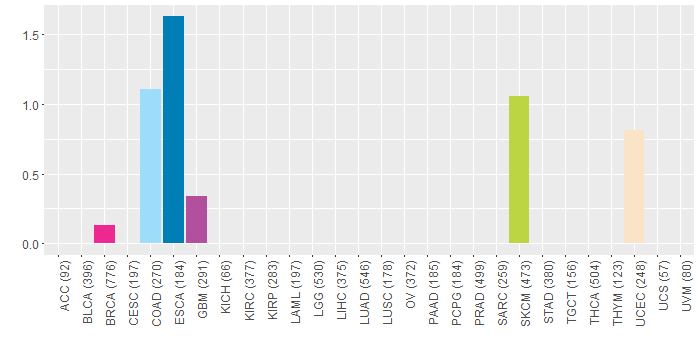
| Different expressions across 14 cancer types with more than 10 samples between matched tumors and normals (X-axis: cancer type and Y-axis: log2(norm_counts+1)) (TCGA IlluminaHiSeq_RNASeqV2, pan-cancer normalized log2(norm_counts+1) data, version 2016-08-16) |
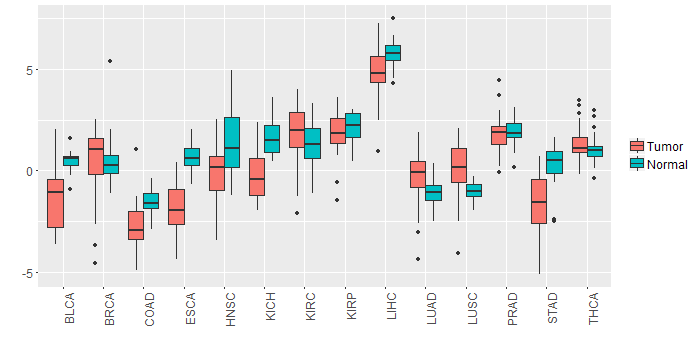 |
| - Significantly differentially expressed cancer types and information. (|Fold change|>1 and FDR<0.05) |
| Cancer type | Mean(exp) in tumor | Mean(exp) in matched normal | Log2FC | P-val. | FDR |
| STAD | -1.694788562 | 0.337636438 | -2.032425 | 2.31E-08 | 8.81E-07 |
| LUSC | 0.10945096 | -0.990721589 | 1.100172549 | 2.06E-07 | 5.60E-07 |
| HNSC | -0.101262036 | 1.419630987 | -1.520893023 | 9.13E-06 | 5.24E-05 |
| KICH | -0.333114687 | 1.611373313 | -1.944488 | 2.81E-08 | 1.39E-07 |
| ESCA | -1.903848506 | 0.639333313 | -2.543181818 | 0.000297 | 0.006809567 |
| BLCA | -1.215693003 | 0.46931226 | -1.685005263 | 0.000335 | 0.002968287 |
| COAD | -2.748101303 | -1.561708995 | -1.186392308 | 8.79E-05 | 0.000326422 |
| Top |
| TissGene-miRNA for GAMT |
| Significantly anti-correlated miRNAs of TissGene across 28 cancer types (Gene-miRNA relations from TargetScanHuman Relsease 7.1, Conserved_Site_Context_Scores.txt.zip, 06.01.2016) (TCGA IlluminaHiSeq_miRNASeq, log2(RPM+1) data, version 2016-11-21) (TCGA IlluminaHiSeq_RNASeqV2, log2(normalized_count+1) data, version 2016-08-16) (Spearman’s Rank Correlation (p-value<0.05 and coefficient<-0.25)) |
| Cancer type | miRNA id | miRNA accession | P-val. | Coeff. | # samples |
| Top |
| TissGeneMut for GAMT |
| TissGeneSNV for GAMT |
| nsSNV counts per each loci. Different colors of circles represent different cancer types. Circle size denotes number of samples. (TCGA somatic mutation (SNPs and small INDELs) data, version 2016-04-25) * Click on the image to enlarge it in a new window. |
 |
| Somatic nucleotide variants of TissGene across 28 cancer types (X-axis: cancer type and Y-axis: % of mutated samples) The numbers in parentheses are numbers of samples with mutation (nsSNVs). (TCGA somatic mutation (SNPs and small INDELs) data, version 2016-04-25) |
 |
| - nsSNVs sorted by frequency. |
| AAchange | Cancer type | # samples |
| p.P227L | ESCA | 2 |
| p.E191D | HNSC | 1 |
| p.W174C | BRCA | 1 |
| p.V95I | UCEC | 1 |
| p.A156T | UCEC | 1 |
| p.E118K | SKCM | 1 |
| p.Y223C | COAD | 1 |
| p.G208R | SKCM | 1 |
| p.S173F | SKCM | 1 |
| p.R158C | HNSC | 1 |
| p.L218I | ESCA | 1 |
| p.R100W | UCEC | 1 |
| p.K153E | COAD | 1 |
| p.G175E | SKCM | 1 |
| p.P217L | GBM | 1 |
| p.R158H | COAD | 1 |
| p.M228I | SKCM | 1 |
| Top |
| TissGeneCNV for GAMT |
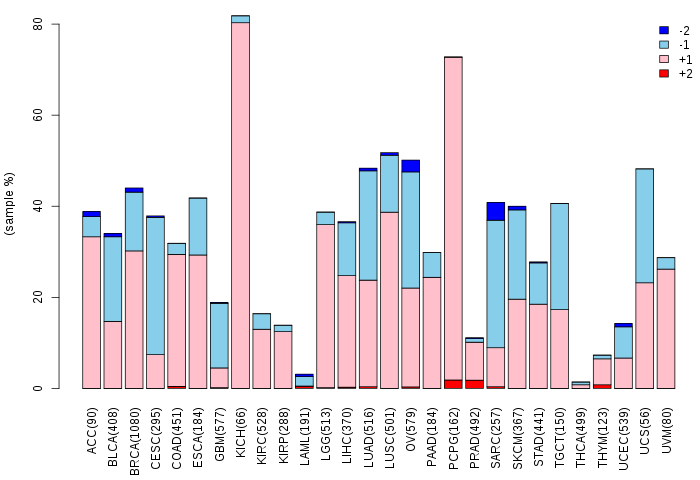
| Copy number variations of TissGene across 28 cancer types (X-axis: cancer type and Y-axis: % of CNV samples) (TCGA Gistic2_CopyNumber_Gistic2_all_data_by_genes, Gistic2 copy number data, version 2016-08-16) |
 |
| Top |
| TissGeneFusions for GAMT |
| Fusion genes including TissGene (ChimerDB 3.0, 2016-12-01 and TCGA fusion Portal 2015-12-01) |
| Database | Src | Cancer type | Sample | Fusion gene | ORF | 5'-gene BP | 3'-gene BP |
| Top |
| TissGeneNet for GAMT |
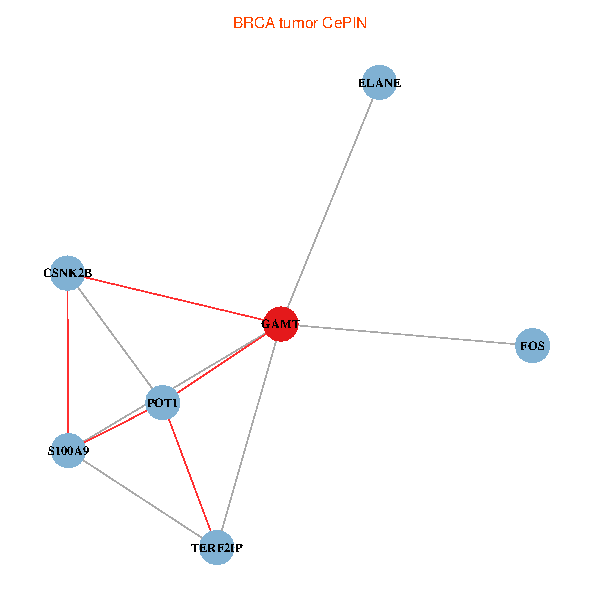
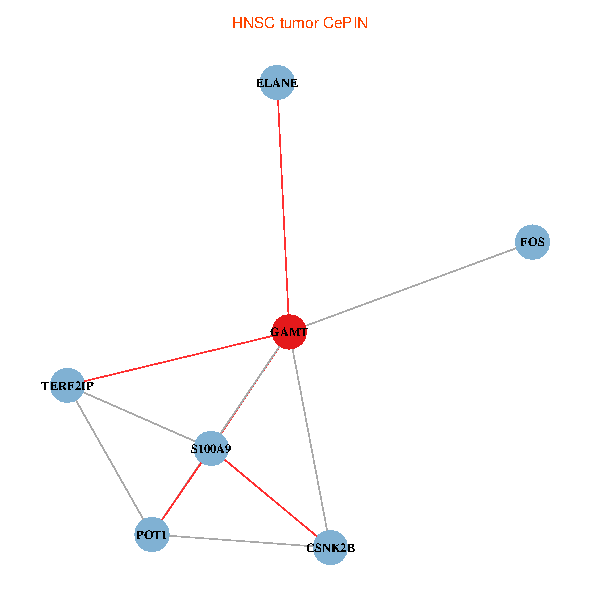
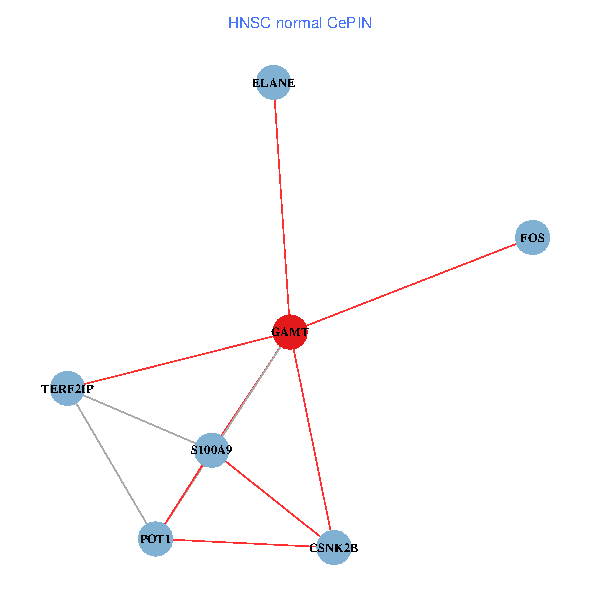
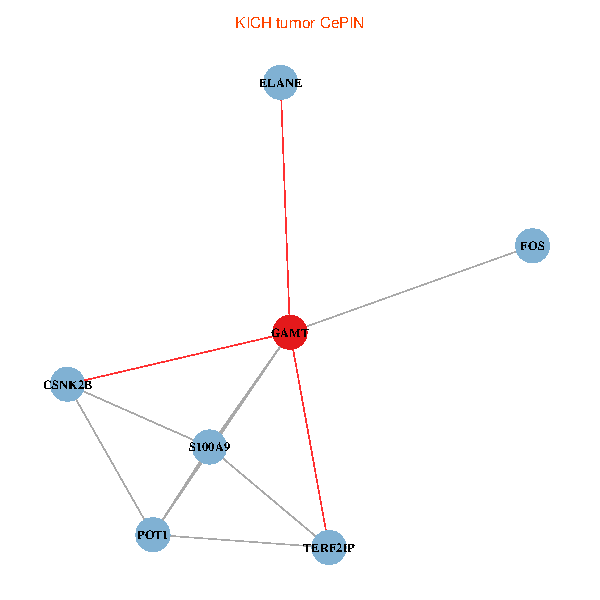
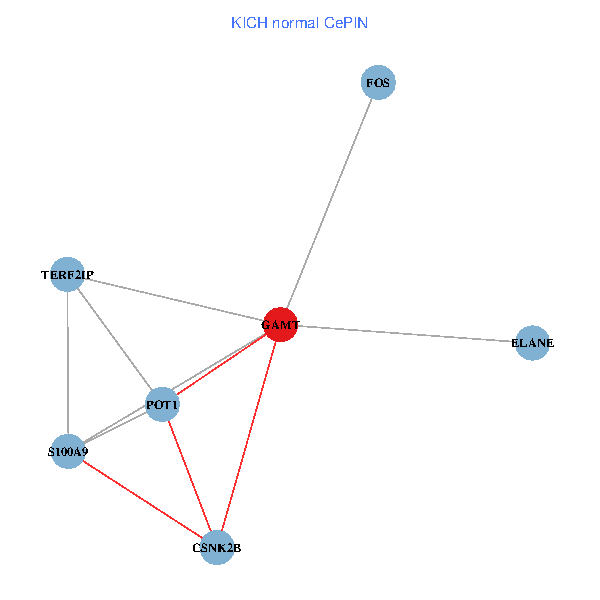
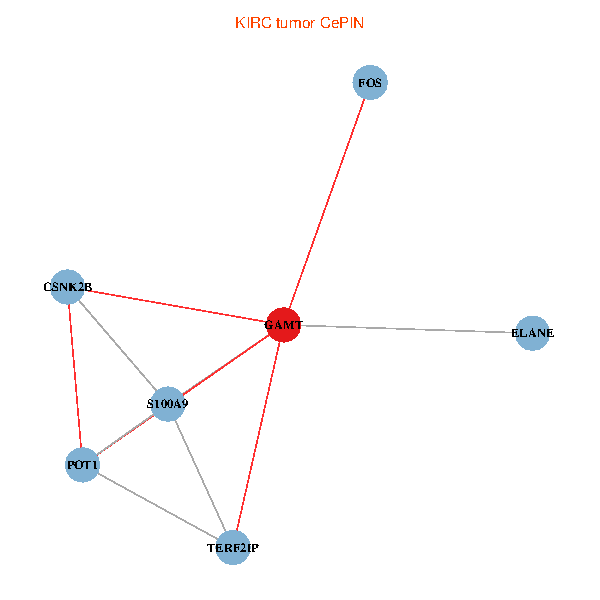
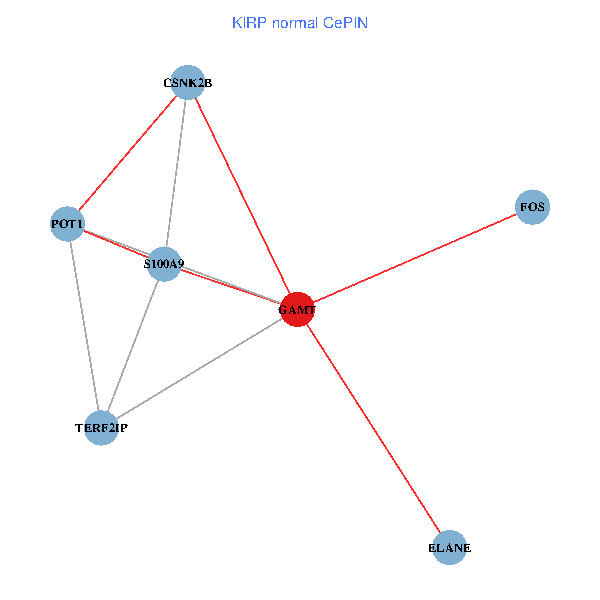
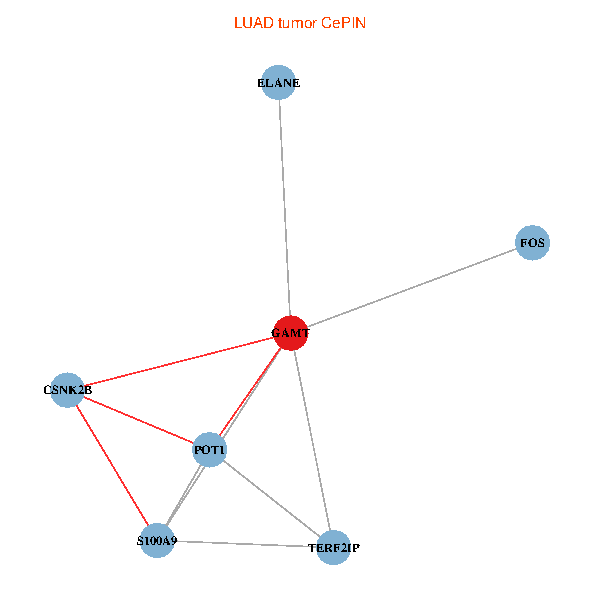
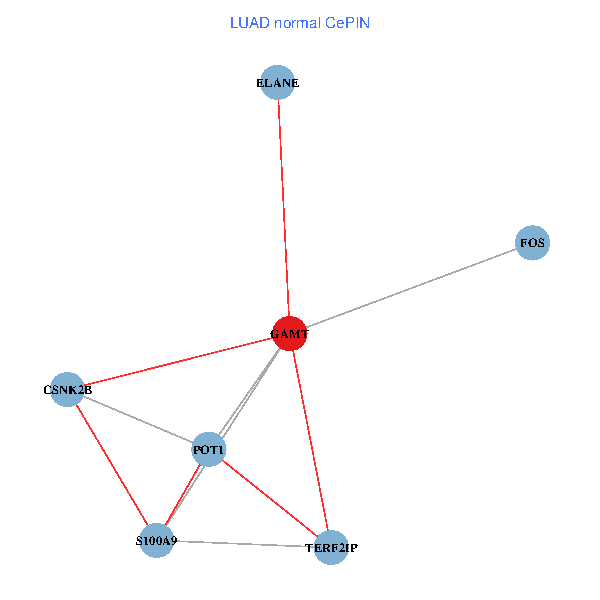
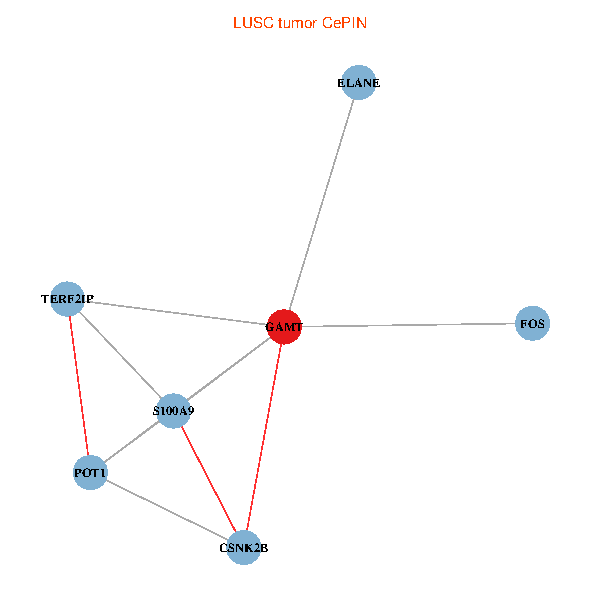
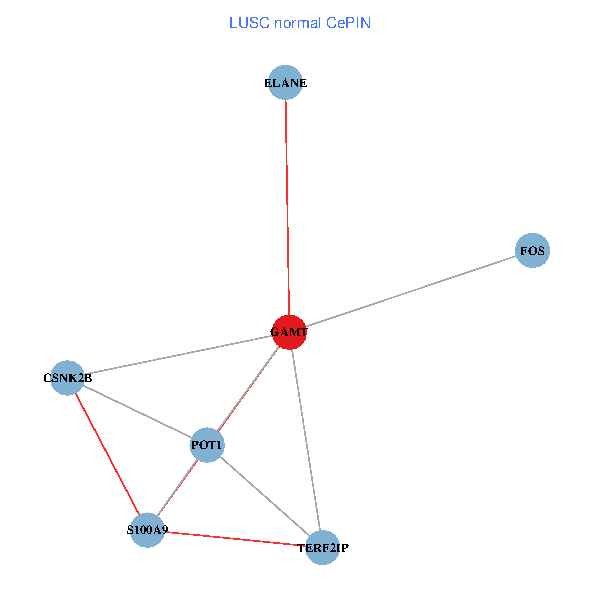
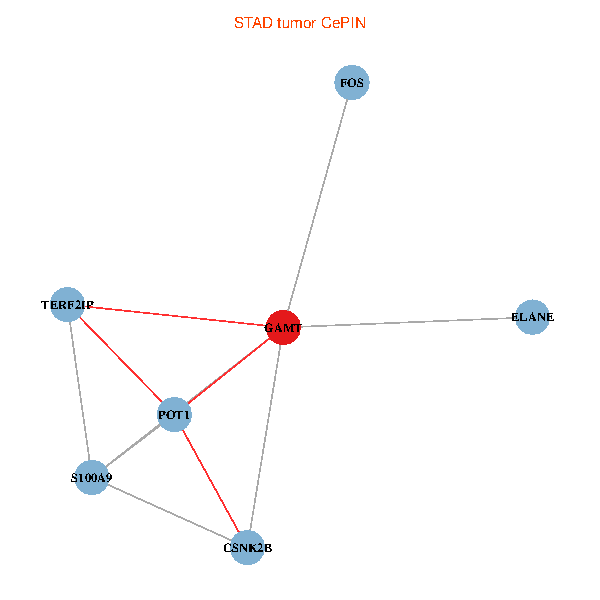
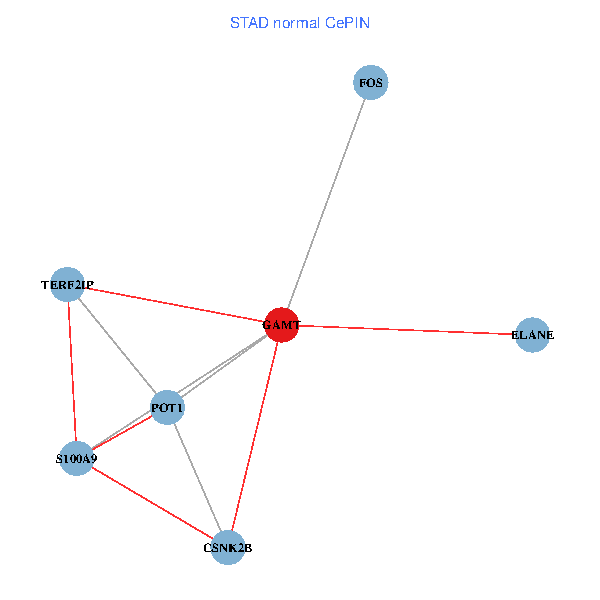
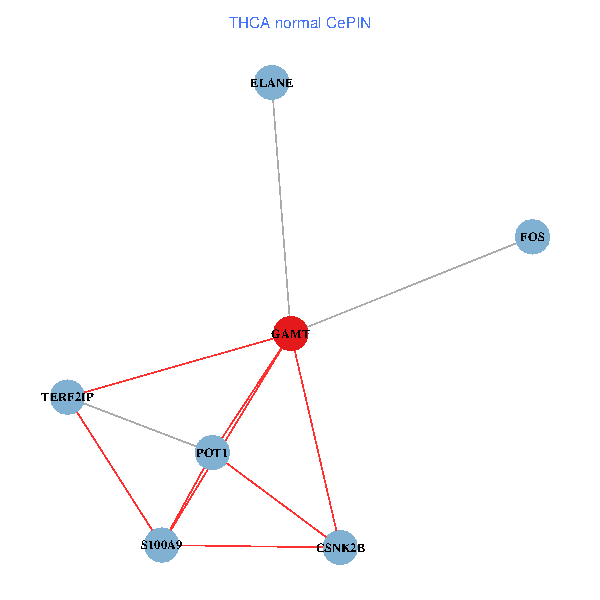
| Co-expressed gene networks based on protein-protein interaction data (CePIN) (TCGA IlluminaHiSeq_RNASeqV2, pan-cancer normalized log2(norm_counts+1) data, version 2016-08-16) (PINA2 ppi data) |
| BRCA (tumor) | BRCA (normal) |
| GAMT, S100A9, POT1, FOS, ELANE, CSNK2B, TERF2IP (tumor) | GAMT, S100A9, POT1, FOS, ELANE, CSNK2B, TERF2IP (normal) |
 |  |
| COAD (tumor) | COAD (normal) |
| GAMT, S100A9, POT1, FOS, ELANE, CSNK2B, TERF2IP (tumor) | GAMT, S100A9, POT1, FOS, ELANE, CSNK2B, TERF2IP (normal) |
 |  |
| HNSC (tumor) | HNSC (normal) |
| GAMT, S100A9, POT1, FOS, ELANE, CSNK2B, TERF2IP (tumor) | GAMT, S100A9, POT1, FOS, ELANE, CSNK2B, TERF2IP (normal) |
 |  |
| KICH (tumor) | KICH (normal) |
| GAMT, S100A9, POT1, FOS, ELANE, CSNK2B, TERF2IP (tumor) | GAMT, S100A9, POT1, FOS, ELANE, CSNK2B, TERF2IP (normal) |
 |  |
| KIRC (tumor) | KIRC (normal) |
| GAMT, S100A9, POT1, FOS, ELANE, CSNK2B, TERF2IP (tumor) | GAMT, S100A9, POT1, FOS, ELANE, CSNK2B, TERF2IP (normal) |
 |  |
| KIRP (tumor) | KIRP (normal) |
| GAMT, S100A9, POT1, FOS, ELANE, CSNK2B, TERF2IP (tumor) | GAMT, S100A9, POT1, FOS, ELANE, CSNK2B, TERF2IP (normal) |
 |  |
| LIHC (tumor) | LIHC (normal) |
| GAMT, S100A9, POT1, FOS, ELANE, CSNK2B, TERF2IP (tumor) | GAMT, S100A9, POT1, FOS, ELANE, CSNK2B, TERF2IP (normal) |
 |  |
| LUAD (tumor) | LUAD (normal) |
| GAMT, S100A9, POT1, FOS, ELANE, CSNK2B, TERF2IP (tumor) | GAMT, S100A9, POT1, FOS, ELANE, CSNK2B, TERF2IP (normal) |
 |  |
| LUSC (tumor) | LUSC (normal) |
| GAMT, S100A9, POT1, FOS, ELANE, CSNK2B, TERF2IP (tumor) | GAMT, S100A9, POT1, FOS, ELANE, CSNK2B, TERF2IP (normal) |
 |  |
| PRAD (tumor) | PRAD (normal) |
| GAMT, S100A9, POT1, FOS, ELANE, CSNK2B, TERF2IP (tumor) | GAMT, S100A9, POT1, FOS, ELANE, CSNK2B, TERF2IP (normal) |
 |  |
| STAD (tumor) | STAD (normal) |
| GAMT, S100A9, POT1, FOS, ELANE, CSNK2B, TERF2IP (tumor) | GAMT, S100A9, POT1, FOS, ELANE, CSNK2B, TERF2IP (normal) |
 |  |
| THCA (tumor) | THCA (normal) |
| GAMT, S100A9, POT1, FOS, ELANE, CSNK2B, TERF2IP (tumor) | GAMT, S100A9, POT1, FOS, ELANE, CSNK2B, TERF2IP (normal) |
 |  |
| Top |
| TissGeneProg for GAMT |
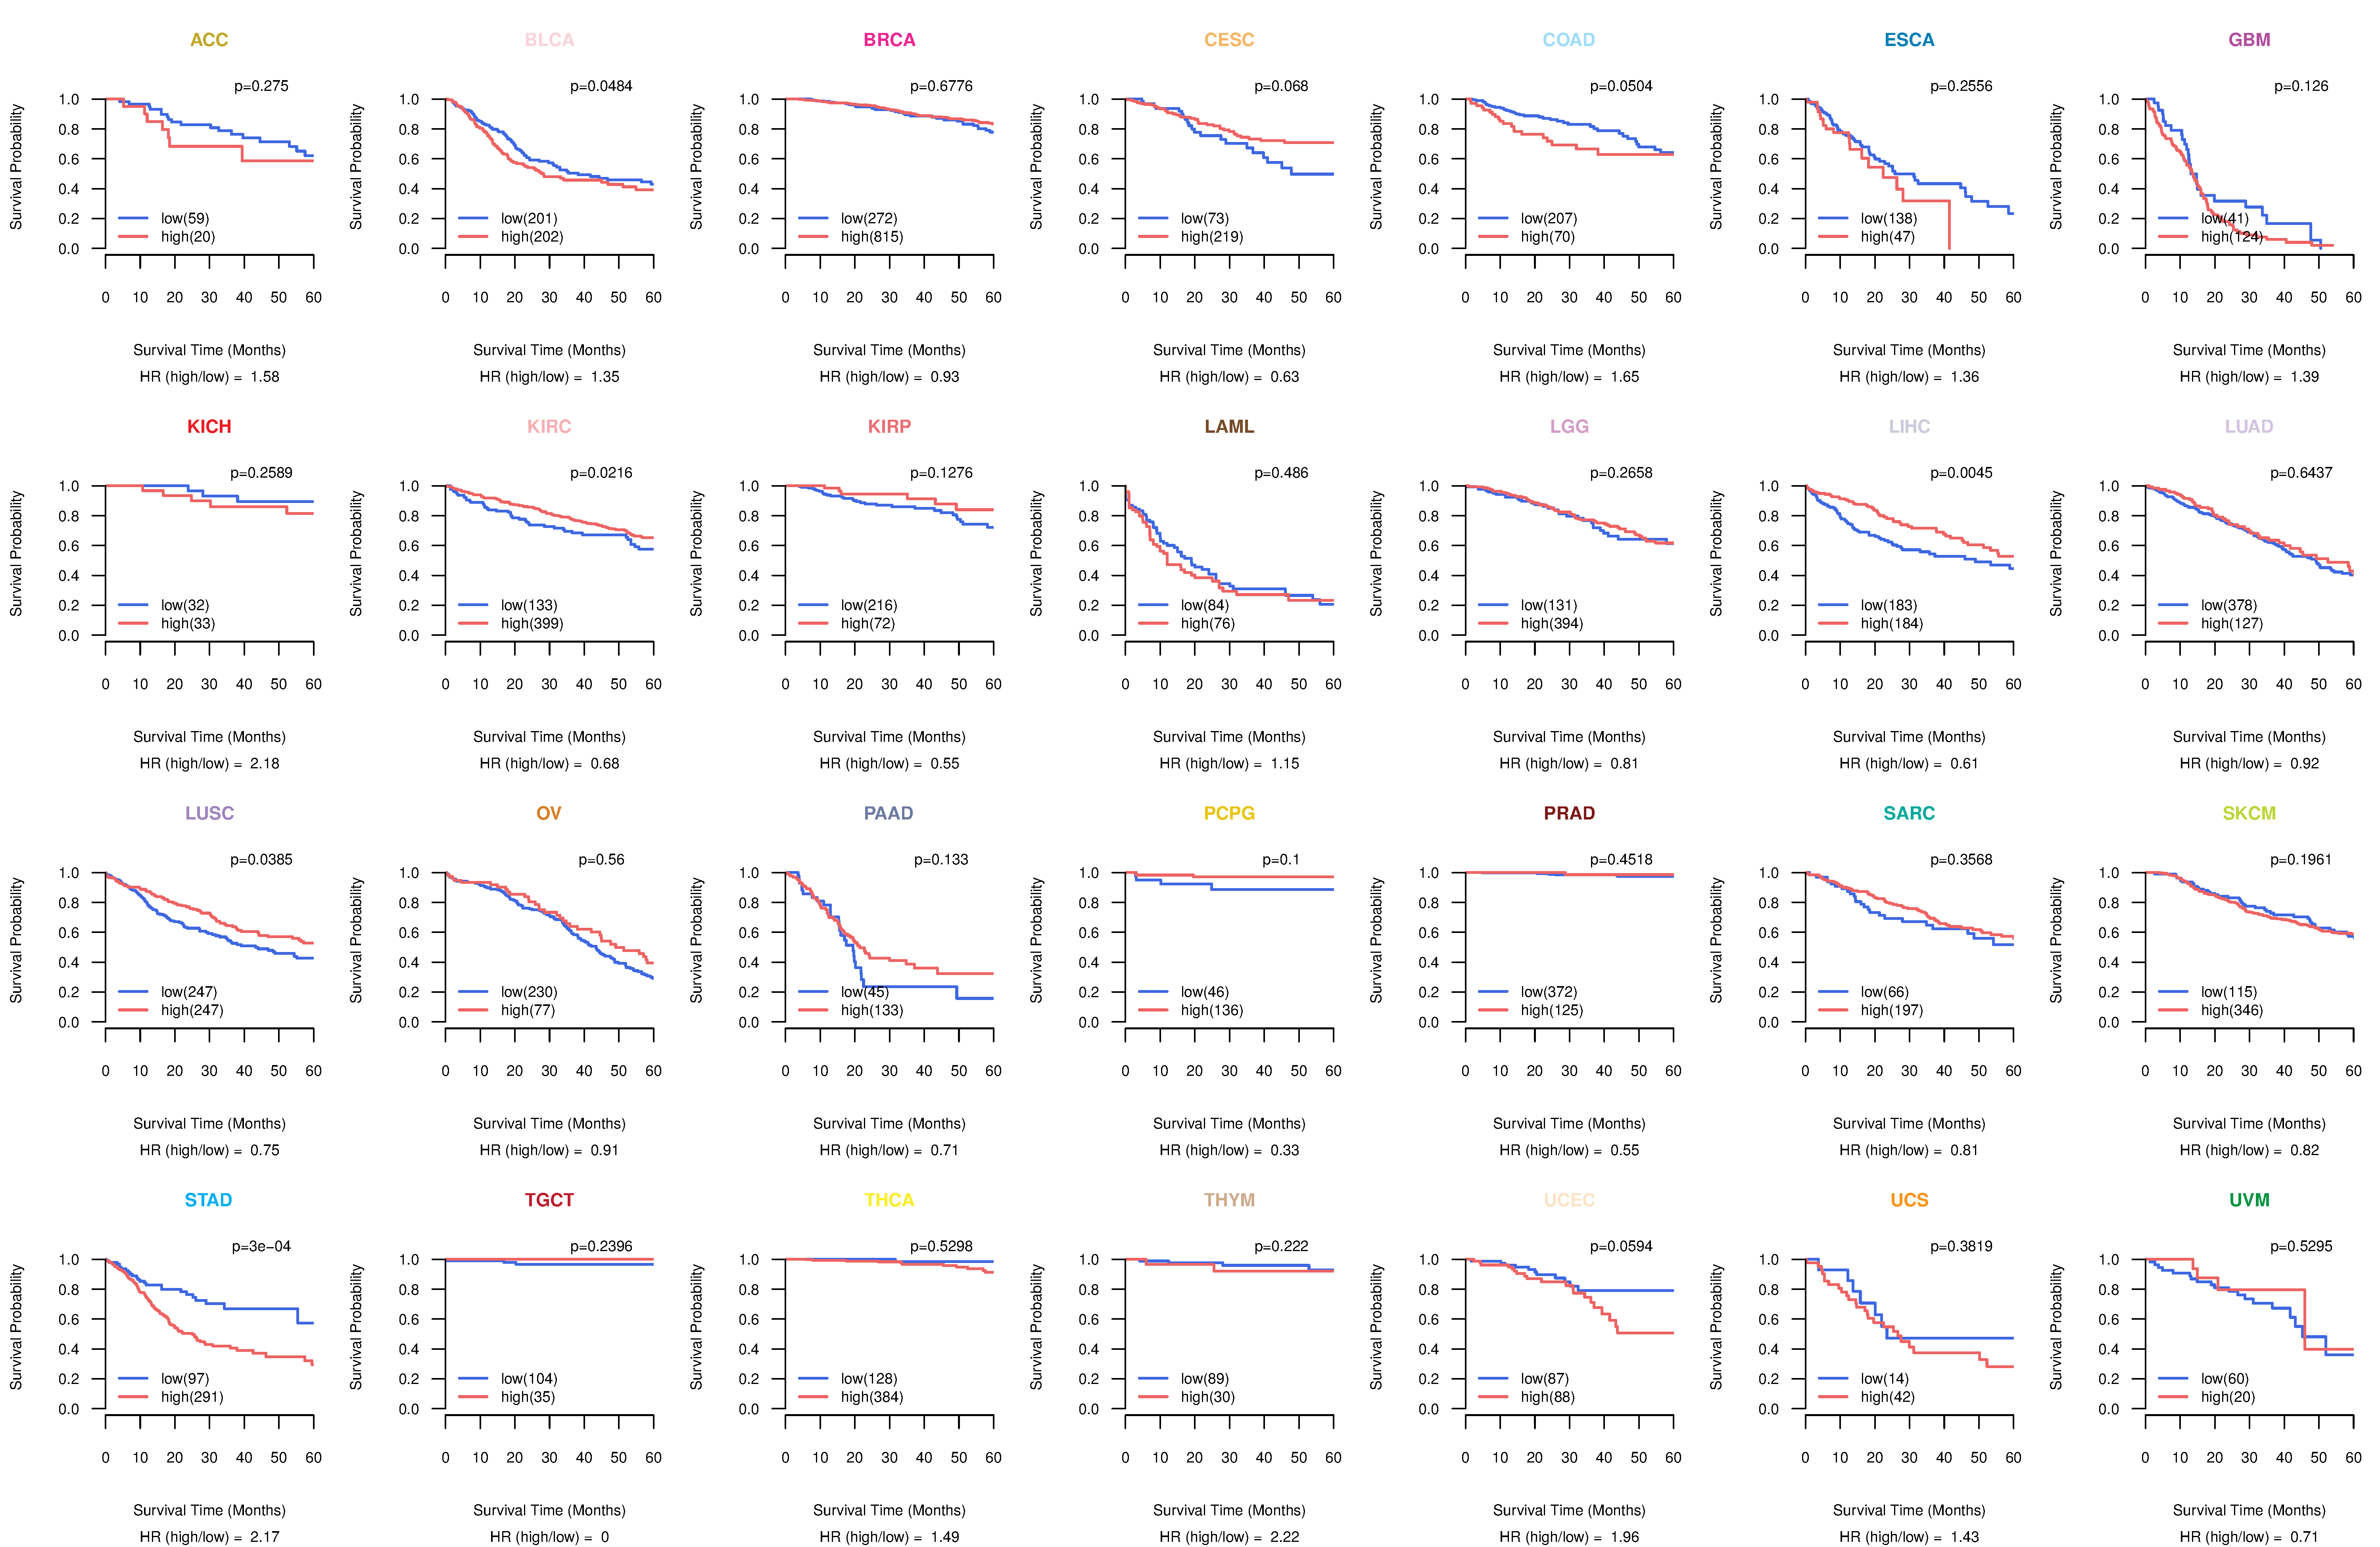
| Kaplan-Meier plots with logrank tests of overall survival (OS) using 28 cancer types (TCGA IlluminaHiSeq_RNASeqV2, pan-cancer normalized log2(norm_counts+1) data, version 2016-08-16) (TCGA clinicalMatrix, phenotype data, version 2016-04-27) * Click on the image to enlarge it in a new window. |
 |
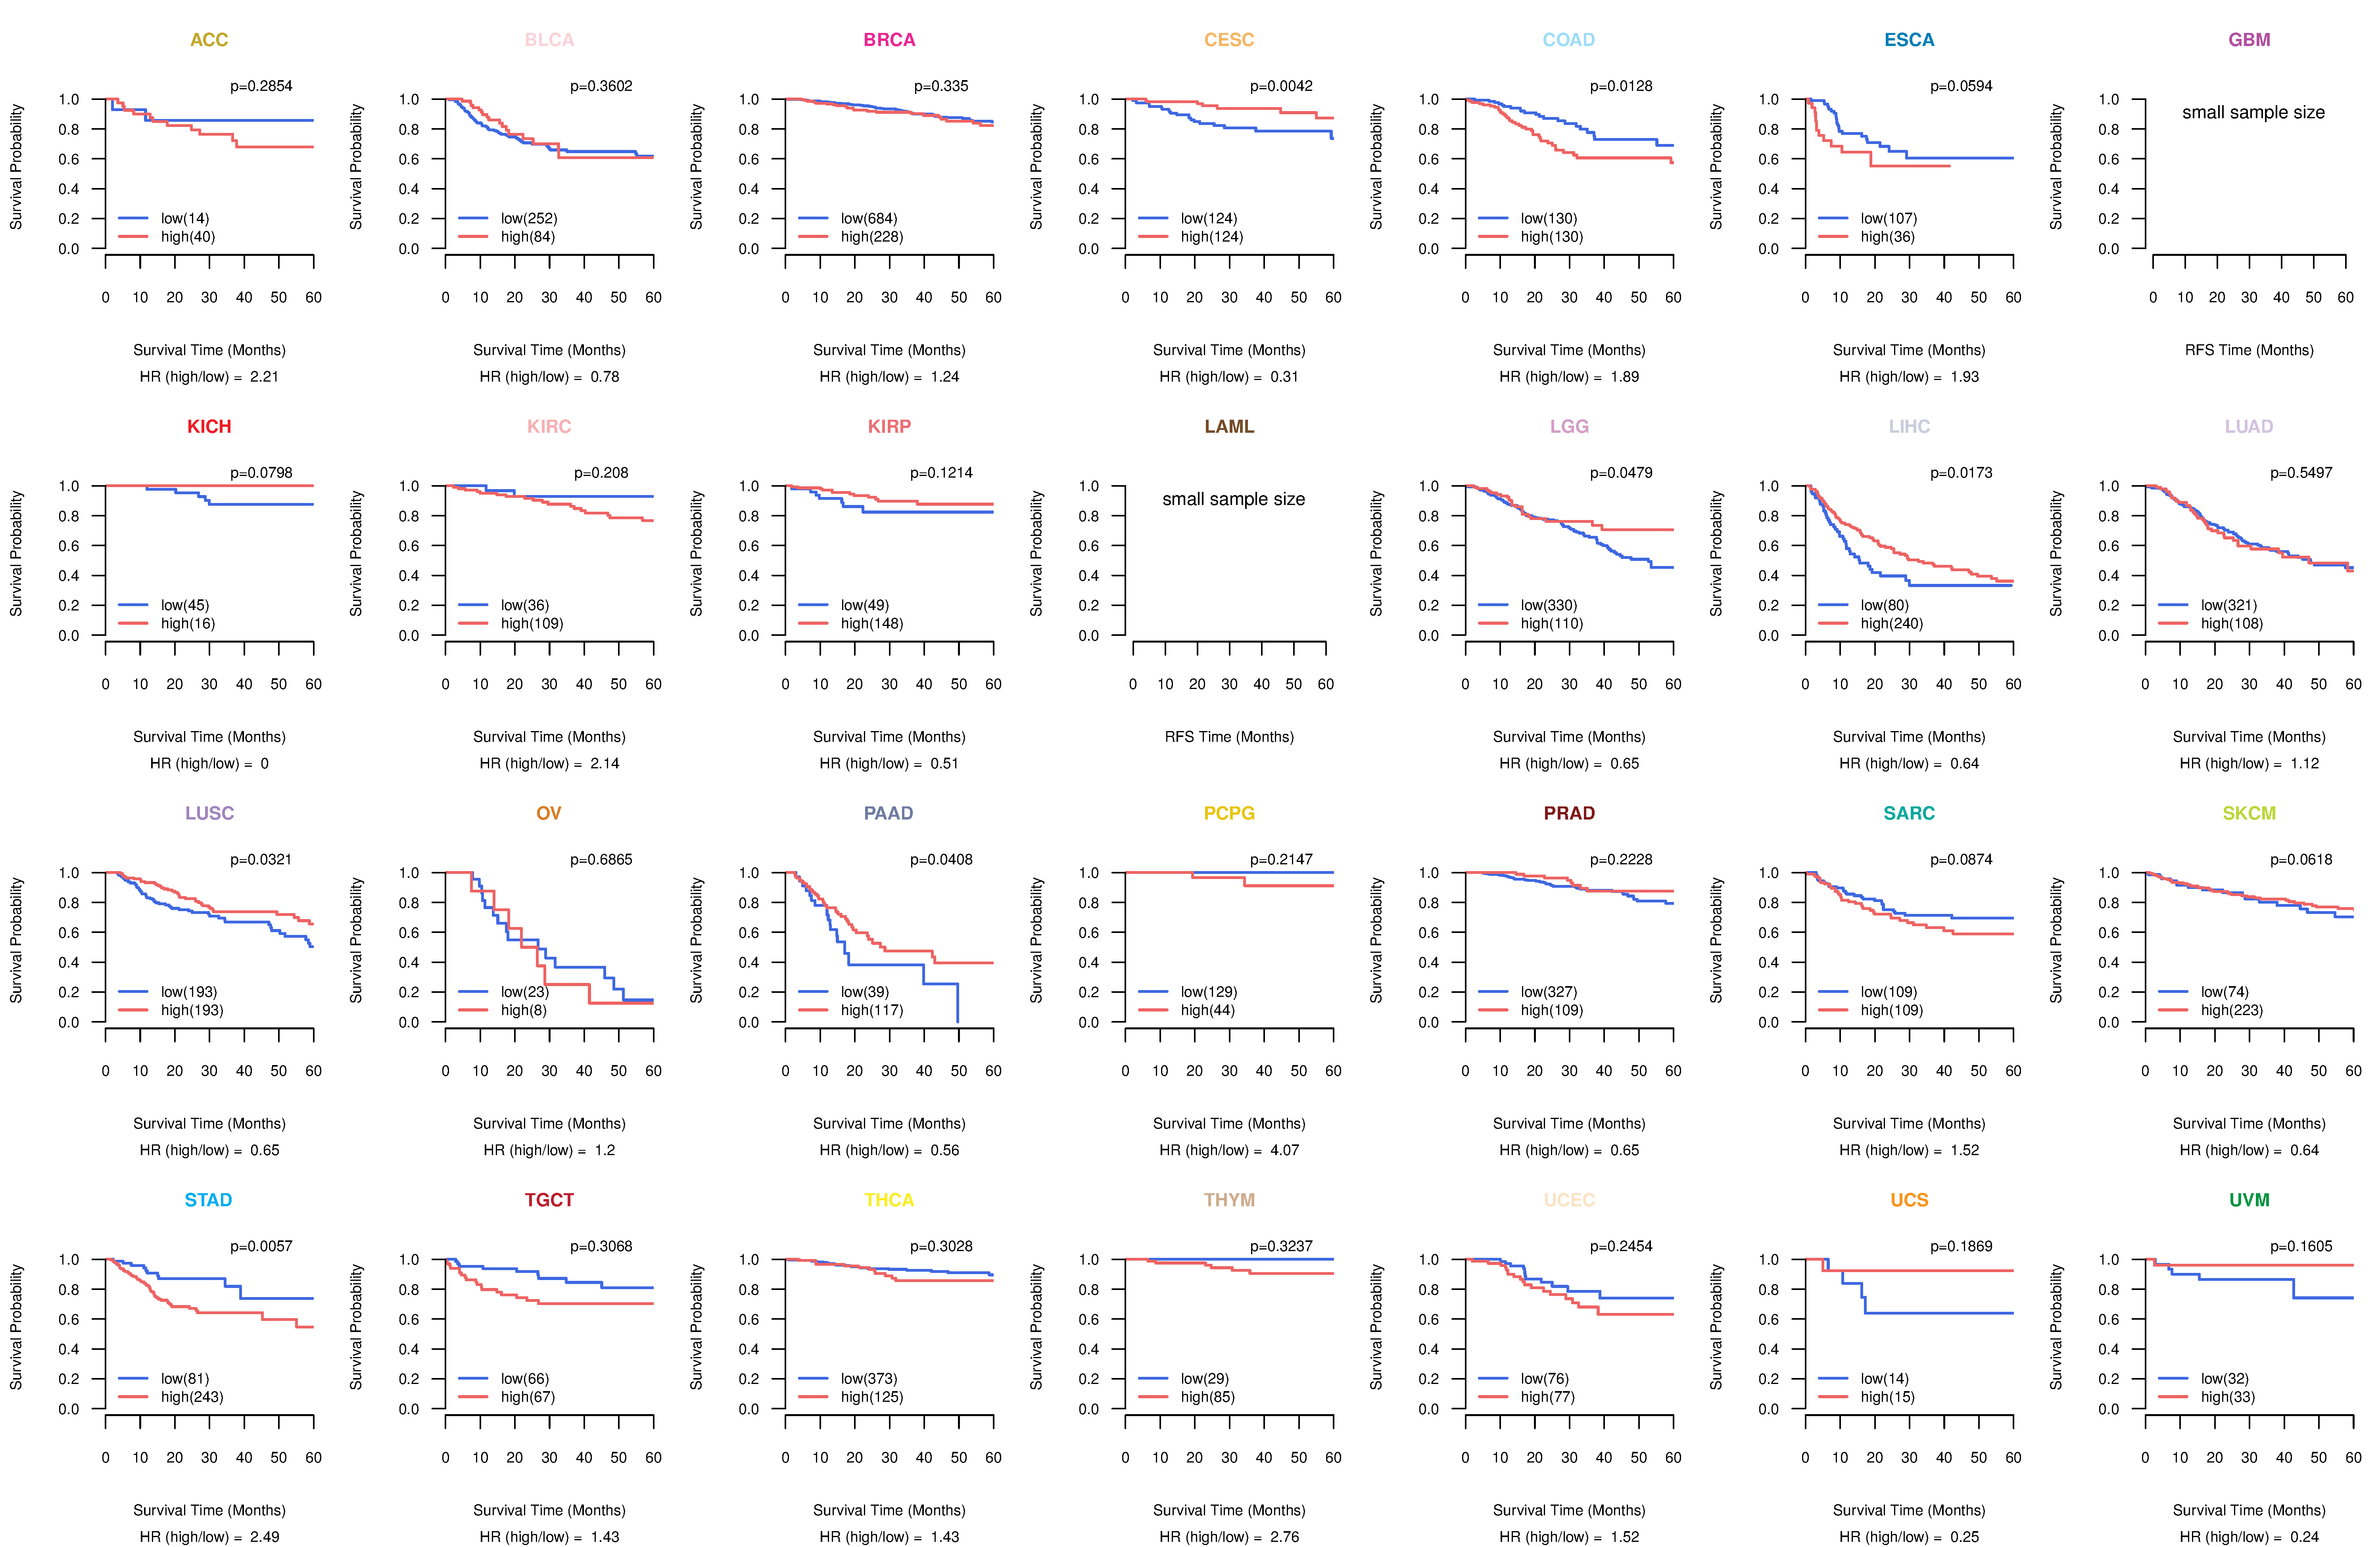
| Kaplan-Meier plots with logrank test of relapse free survival (RFS) using 28 cancer types (TCGA IlluminaHiSeq_RNASeqV2, pan-cancer normalized log2(norm_counts+1) data, version 2016-08-16) (TCGA clinicalMatrix, phenotype data, version 2016-04-27) * Click on the image enlarge it in a new window. |
 |
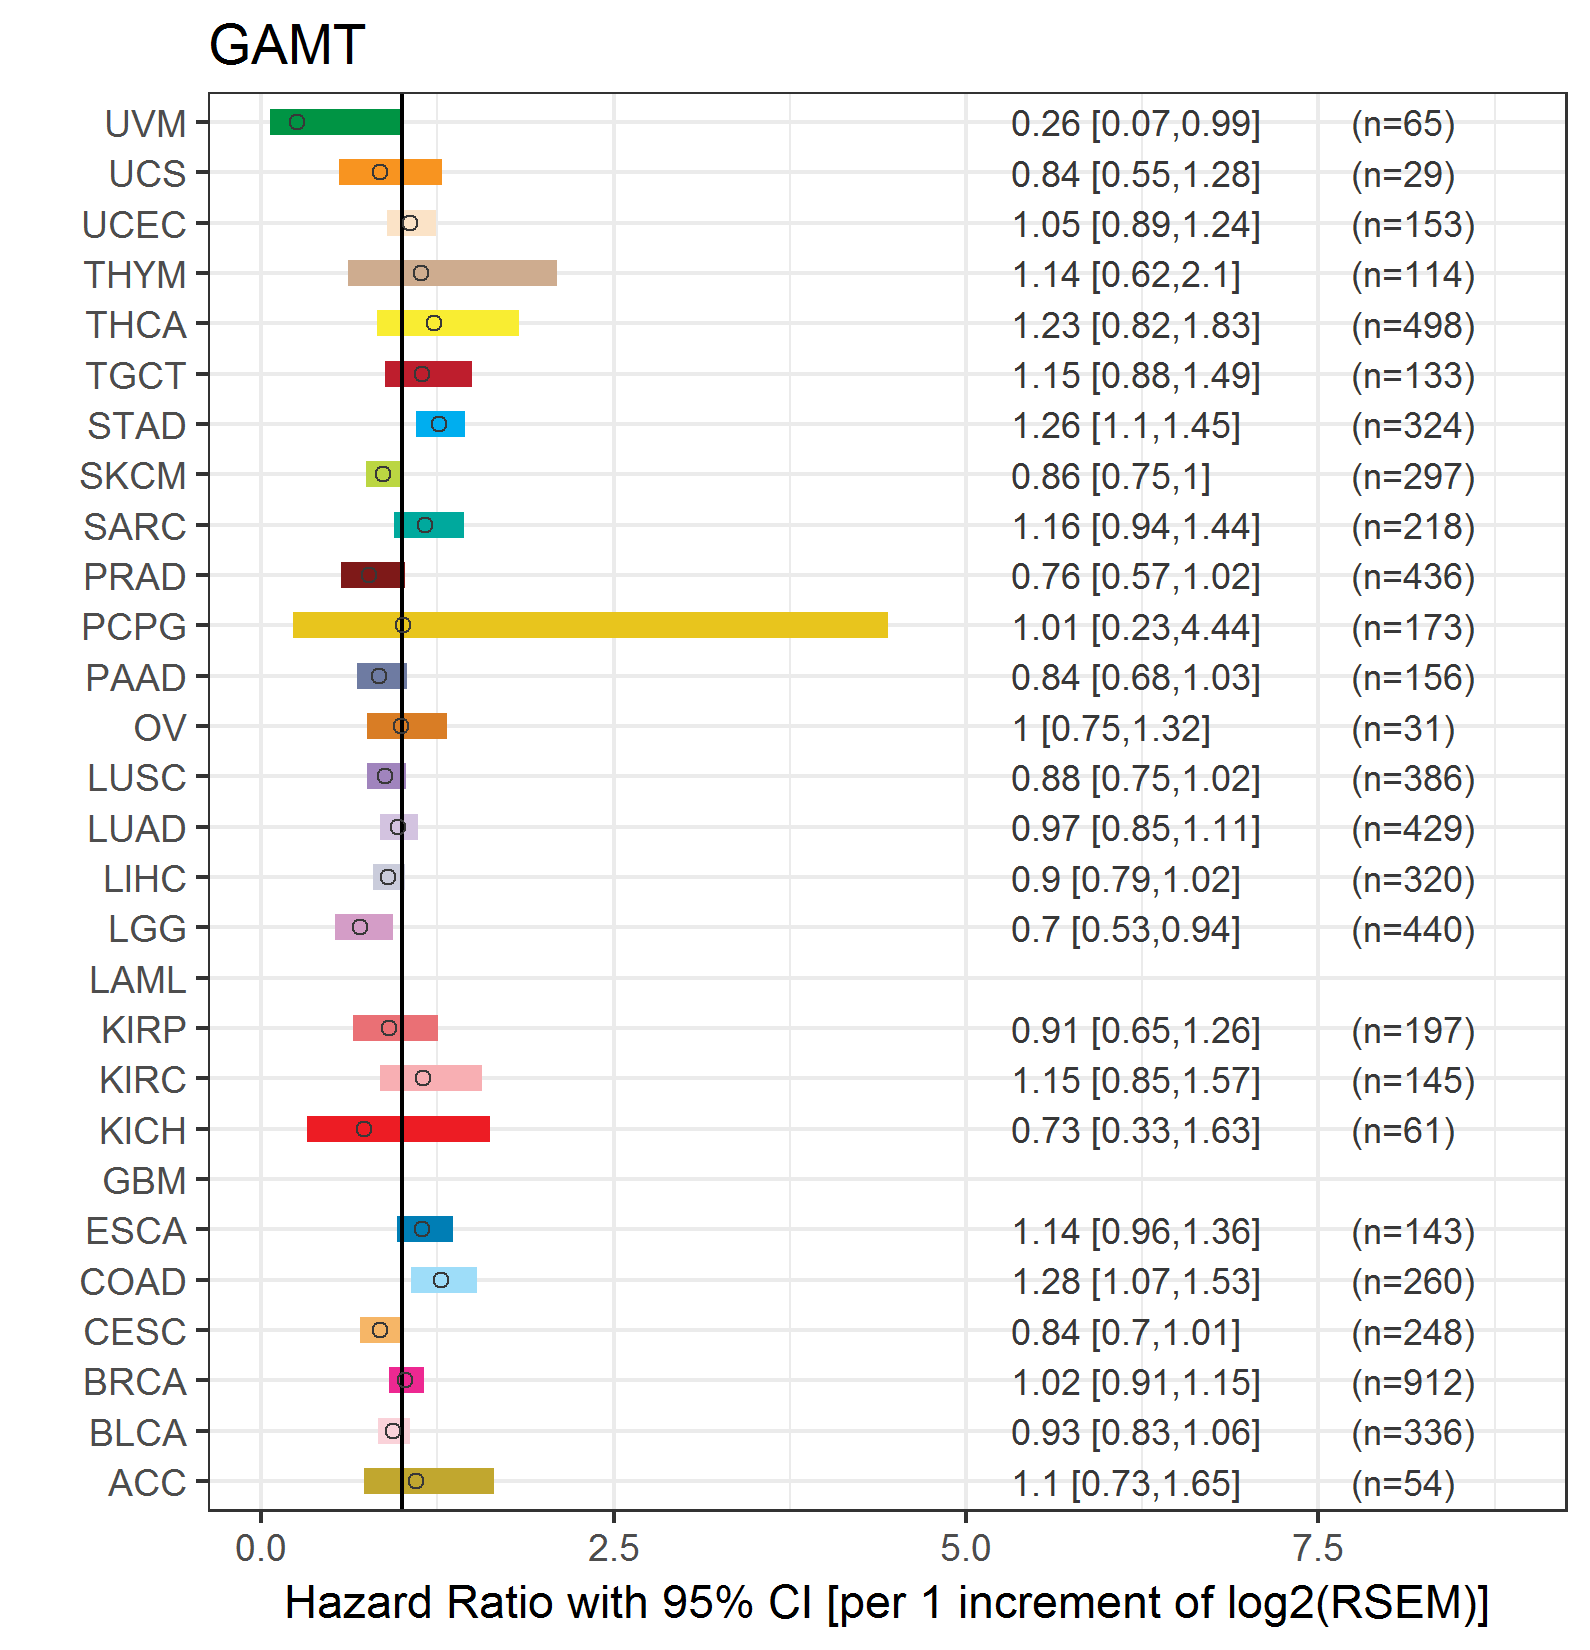
| Forest plot of Cox proportional hazard ratio (HR) and 95% CI of overall survival (OS) using 28 cancer types (TCGA IlluminaHiSeq_RNASeqV2, pan-cancer normalized log2(norm_counts+1) data, version 2016-08-16) (TCGA clinicalMatrix, phenotype data, version 2016-04-27) * Click on the image enlarge it in a new window. |
 |
| Forest plot of Cox proportional hazard ratio (HR) and 95% CI of relapse free survival (RFS) using 28 cancer types (TCGA IlluminaHiSeq_RNASeqV2, pan-cancer normalized log2(norm_counts+1) data, version 2016-08-16) (TCGA clinicalMatrix, phenotype data, version 2016-04-27) * Click on the image enlarge it in a new window. |
 |
| Top |
| TissGeneClin for GAMT |
| TissGeneDrug for GAMT |
| Drug information targeting TissGene (DrugBank Version 5.0.6, 2017-04-01) |
| DrugBank ID | Drug name | Drug activity | Drug type | Drug status |
| DB00148 | Creatine | Product of | Small molecule | Approved|Nutraceutical |
| Top |
| TissGeneDisease for GAMT |
| Disease information associated with TissGene (DisGeNet, 2016-06-01) |
| Disease ID | Disease name | # pubmeds | Source |
| umls:C0574080 | Guanidinoacetate methyltransferase deficiency | 5 | BeFree,CLINVAR,CTD_human,MGD,ORPHANET,UNIPROT |
| umls:C1845862 | Creatine deficiency, X-linked | 2 | BeFree |
| umls:C0002514 | Amino Acid Metabolism, Inborn Errors | 1 | CTD_human |
| umls:C0036572 | Seizures | 1 | CTD_human |
| umls:C0080178 | Spina Bifida | 1 | GAD |
| umls:C0948008 | Ischemic stroke | 1 | BeFree |
| umls:C3272363 | Ischemic Cerebrovascular Accident | 1 | BeFree |
| umls:C3714756 | Intellectual Disability | 1 | CTD_human |
|
Copyright 2016-Present - The University of Texas Health Science Center at Houston (UTHealth) Web File Viewing | How to Report, Fraud, Waste and Abuse | State of Texas | Statewide Search | Texas Homeland Security | Site Policies |