 |
| |
| |
| |
| |
| |
| |
|

| TissGeneSummary for ZNF385A |
 Gene summary Gene summary |
| Basic gene information | Gene symbol | ZNF385A |
| Gene name | zinc finger protein 385A | |
| Synonyms | HZF|RZF|ZFP385|ZNF385 | |
| Cytomap | UCSC genome browser: 12q13.13 | |
| Type of gene | protein-coding | |
| RefGenes | NM_001130967.2, NM_001130968.2,NM_001290001.1,NM_001290002.1,NM_001290004.1, NM_015481.2, | |
| Description | hematopoietic zinc finger proteinretinal zinc finger proteinzinc finger protein 385 | |
| Modification date | 20141207 | |
| dbXrefs | MIM : 609124 | |
| HGNC : HGNC | ||
| Ensembl : ENSG00000161642 | ||
| HPRD : 16448 | ||
| Vega : OTTHUMG00000169840 | ||
| Protein | UniProt: go to UniProt's Cross Reference DB Table | |
| Expression | CleanEX: HS_ZNF385A | |
| BioGPS: 25946 | ||
| Pathway | NCI Pathway Interaction Database: ZNF385A | |
| KEGG: ZNF385A | ||
| REACTOME: ZNF385A | ||
| Pathway Commons: ZNF385A | ||
| Context | iHOP: ZNF385A | |
| ligand binding site mutation search in PubMed: ZNF385A | ||
| UCL Cancer Institute: ZNF385A | ||
| Assigned class in TissGDB* | C | |
| Included tissue-specific gene expression resources | TiGER,GTEx | |
| Specific-tissues in normal samples (assigned by TissGDB using HPA, TiGER, and GTEx) | Bone marrowSkinEye | |
| Cancer types related to the specific-tissues in cancer samples (assigned by TissGDB using TCGA) | LAMLSKCMUVM | |
| Reference showing the relevant tissue of ZNF385A | ||
| Description by TissGene annotations | TissgsLTS | |
| * Class A consists of genes with literature evidence and is part of the cTissGenes. Class B consists of only cTissGenes without additional evidence. The remaining genes belong to Class C. |
| Gene ontology having evidence of Inferred from Direct Assay (IDA) from Entrez |
| GO ID | GO term | PubMed ID |
| Top |
| TissGeneExp for ZNF385A |
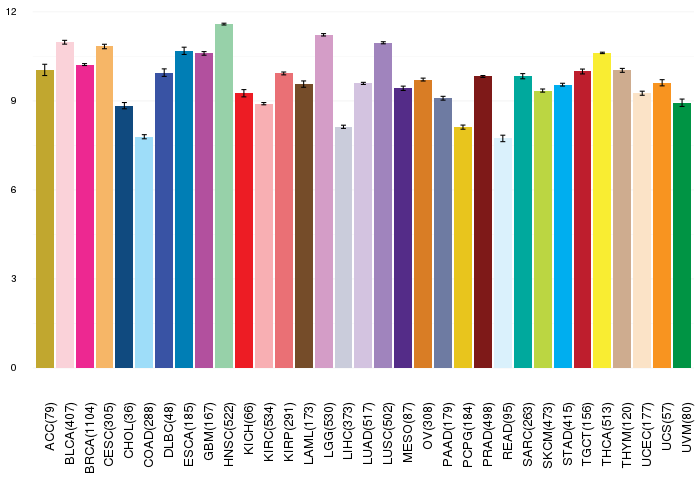
| Gene expressions across 28 cancer types (X-axis: cancer type and Y-axis: log2(norm_counts+1)) (TCGA IlluminaHiSeq_RNASeqV2, pan-cancer normalized log2(norm_counts+1) data, version 2016-08-16) |
 |
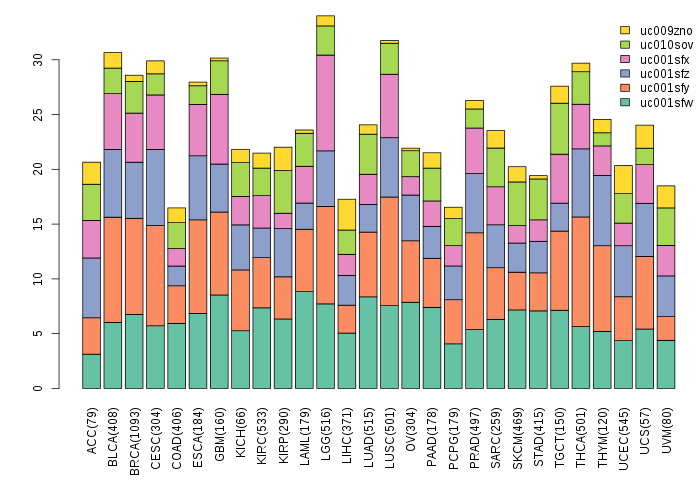
| Gene isoform expressions across 28 cancer types (X-axis: cancer type and Y-axis: log2(norm_counts+1)) (TCGA pan-cancer tcga_rsem_isoform_tpm, version 2016-09-01) |
 |
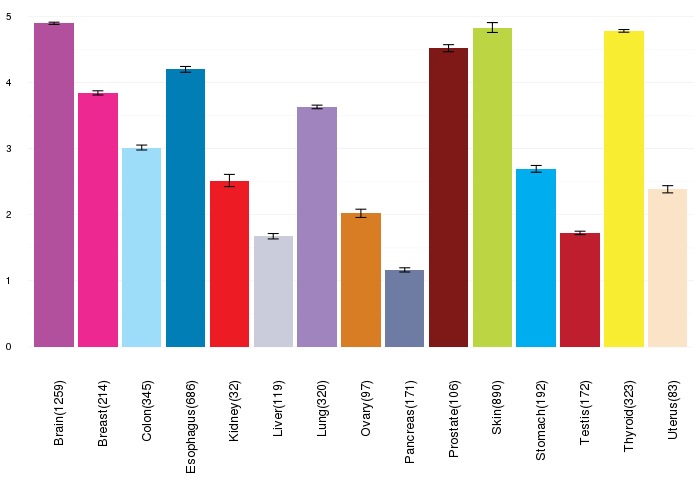
| Gene expressions across normal tissues of GTEx data (GTEx GTEx_Analysis_v6_RNA-seq_RNA-SeQCv1.1.8_gene_rpkm.gct) - Here, we shows the matched tissue types only among our 28 cancer types. |
 |
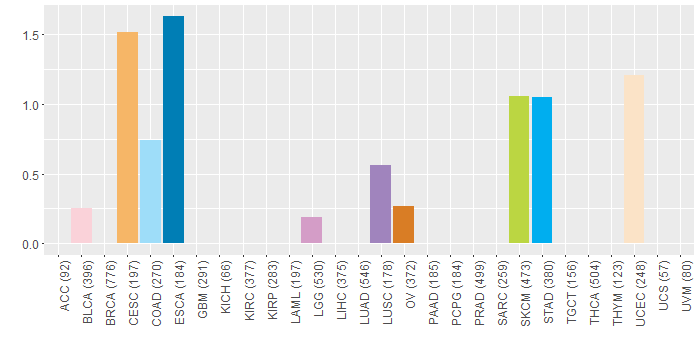
| Different expressions across 14 cancer types with more than 10 samples between matched tumors and normals (X-axis: cancer type and Y-axis: log2(norm_counts+1)) (TCGA IlluminaHiSeq_RNASeqV2, pan-cancer normalized log2(norm_counts+1) data, version 2016-08-16) |
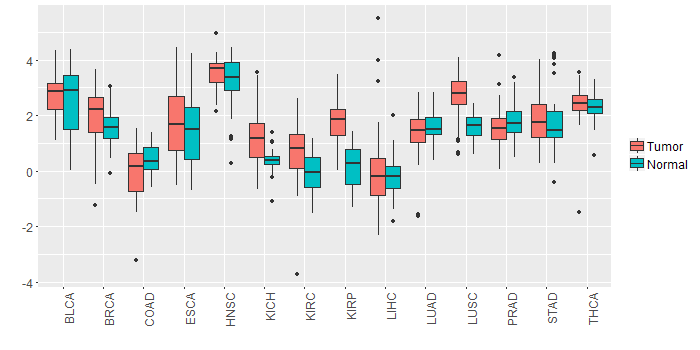 |
| - Significantly differentially expressed cancer types and information. (|Fold change|>1 and FDR<0.05) |
| Cancer type | Mean(exp) in tumor | Mean(exp) in matched normal | Log2FC | P-val. | FDR |
| KIRP | 1.795418185 | 0.156986935 | 1.63843125 | 1.95E-11 | 2.56E-10 |
| LUSC | 2.671459422 | 1.631163344 | 1.040296078 | 3.47E-11 | 1.37E-10 |
| Top |
| TissGene-miRNA for ZNF385A |
| Significantly anti-correlated miRNAs of TissGene across 28 cancer types (Gene-miRNA relations from TargetScanHuman Relsease 7.1, Conserved_Site_Context_Scores.txt.zip, 06.01.2016) (TCGA IlluminaHiSeq_miRNASeq, log2(RPM+1) data, version 2016-11-21) (TCGA IlluminaHiSeq_RNASeqV2, log2(normalized_count+1) data, version 2016-08-16) (Spearman’s Rank Correlation (p-value<0.05 and coefficient<-0.25)) |
| Cancer type | miRNA id | miRNA accession | P-val. | Coeff. | # samples |
| Top |
| TissGeneMut for ZNF385A |
| TissGeneSNV for ZNF385A |
| nsSNV counts per each loci. Different colors of circles represent different cancer types. Circle size denotes number of samples. (TCGA somatic mutation (SNPs and small INDELs) data, version 2016-04-25) * Click on the image to enlarge it in a new window. |
 |
| Somatic nucleotide variants of TissGene across 28 cancer types (X-axis: cancer type and Y-axis: % of mutated samples) The numbers in parentheses are numbers of samples with mutation (nsSNVs). (TCGA somatic mutation (SNPs and small INDELs) data, version 2016-04-25) |
 |
| - nsSNVs sorted by frequency. |
| AAchange | Cancer type | # samples |
| p.P163L | STAD | 2 |
| p.G225R | SKCM | 2 |
| p.R82C | UCEC | 2 |
| p.P183L | STAD | 2 |
| p.H199R | COAD | 1 |
| p.S192F | SKCM | 1 |
| p.P255S | STAD | 1 |
| p.V97I | ESCA | 1 |
| p.A231V | CESC | 1 |
| p.R199W | OV | 1 |
| p.I54V | COAD | 1 |
| p.K187E | BLCA | 1 |
| p.I218M | STAD | 1 |
| p.P120H | ESCA | 1 |
| p.I238M | CESC | 1 |
| p.S85Y | READ | 1 |
| p.H280Q | STAD | 1 |
| p.P235S | STAD | 1 |
| p.R349L | ESCA | 1 |
| p.E106Q | LUSC | 1 |
| p.A162T | LGG | 1 |
| p.G126R | SKCM | 1 |
| p.V117I | ESCA | 1 |
| p.L276Q | CESC | 1 |
| p.L205V | STAD | 1 |
| p.R8Q | CHOL | 1 |
| p.I238M | STAD | 1 |
| p.L185V | STAD | 1 |
| p.G225E | SKCM | 1 |
| p.R329L | ESCA | 1 |
| p.R119C | HNSC | 1 |
| p.Y202C | UCEC | 1 |
| p.R80* | SKCM | 1 |
| p.A197V | STAD | 1 |
| p.H300Q | STAD | 1 |
| p.A177V | STAD | 1 |
| p.A211V | CESC | 1 |
| Top |
| TissGeneCNV for ZNF385A |
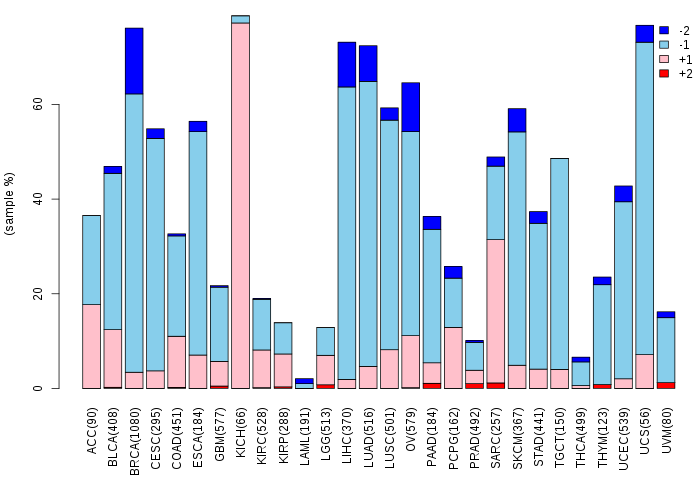
| Copy number variations of TissGene across 28 cancer types (X-axis: cancer type and Y-axis: % of CNV samples) (TCGA Gistic2_CopyNumber_Gistic2_all_data_by_genes, Gistic2 copy number data, version 2016-08-16) |
 |
| Top |
| TissGeneFusions for ZNF385A |
| Fusion genes including TissGene (ChimerDB 3.0, 2016-12-01 and TCGA fusion Portal 2015-12-01) |
| Database | Src | Cancer type | Sample | Fusion gene | ORF | 5'-gene BP | 3'-gene BP |
| Chimerdb3.0 | ChiTaRs | NA | DA465008 | REV1-ZNF385A | chr2:100094141 | chr12:54778212 | |
| Chimerdb3.0 | ChiTaRs | NA | AW291910 | MRE11A-ZNF385A | chr11:94151783 | chr12:54762925 |
| Top |
| TissGeneNet for ZNF385A |
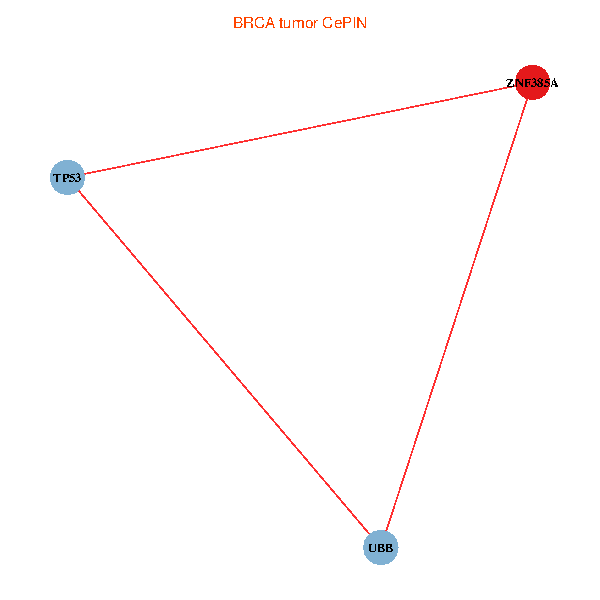
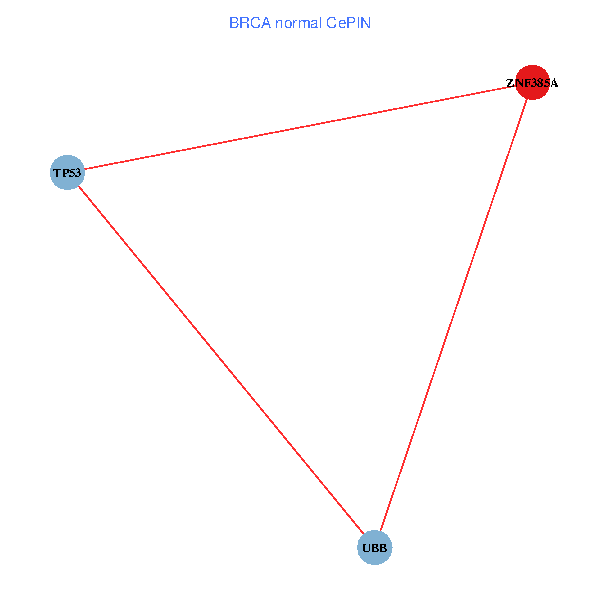
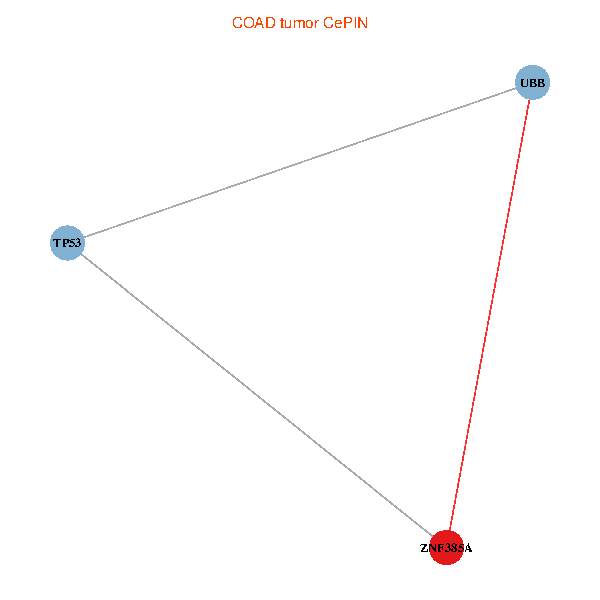
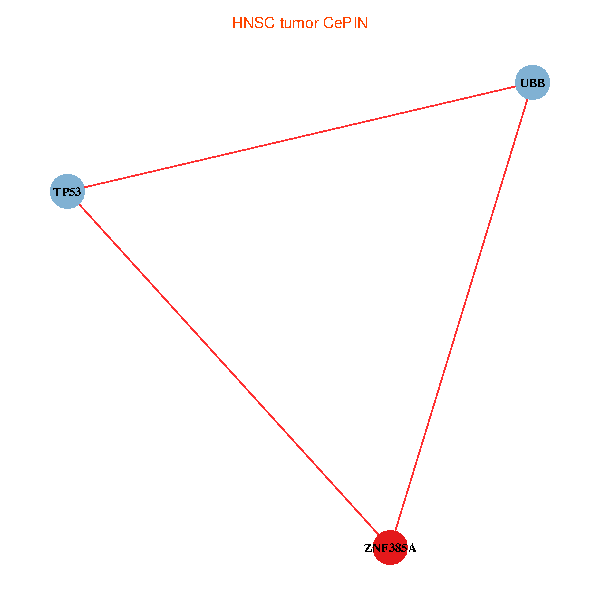
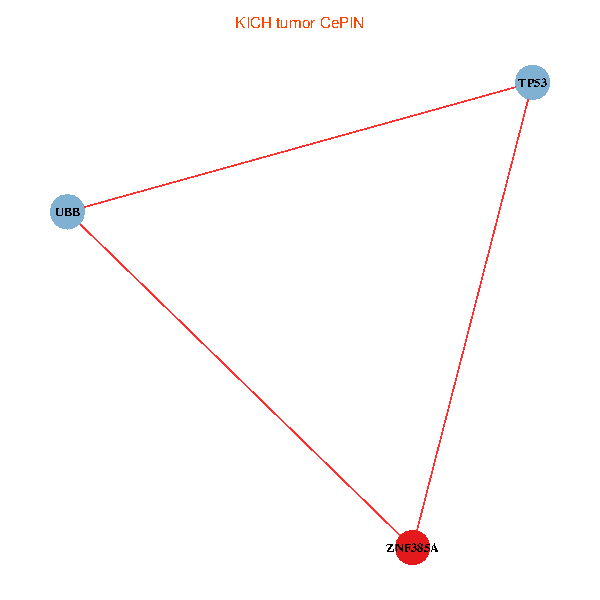
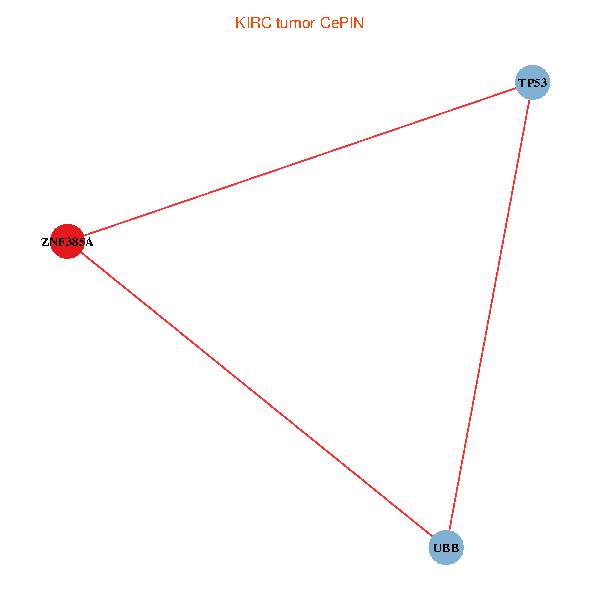
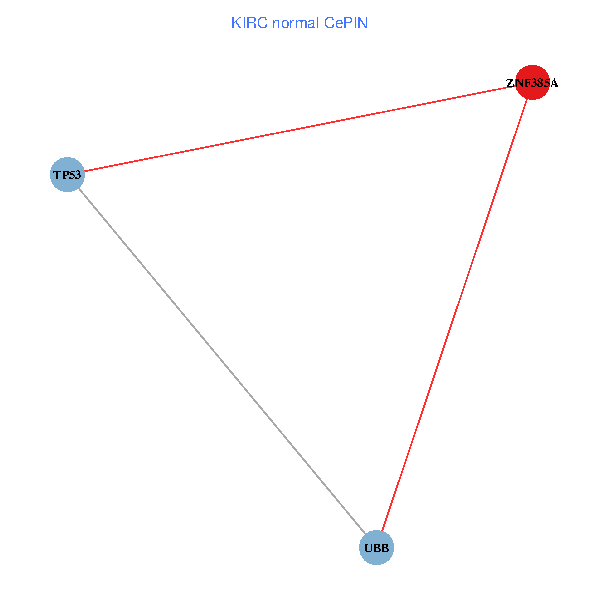
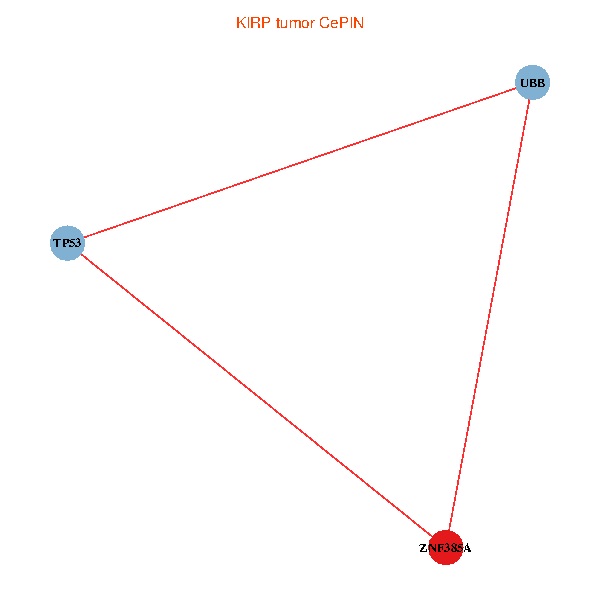
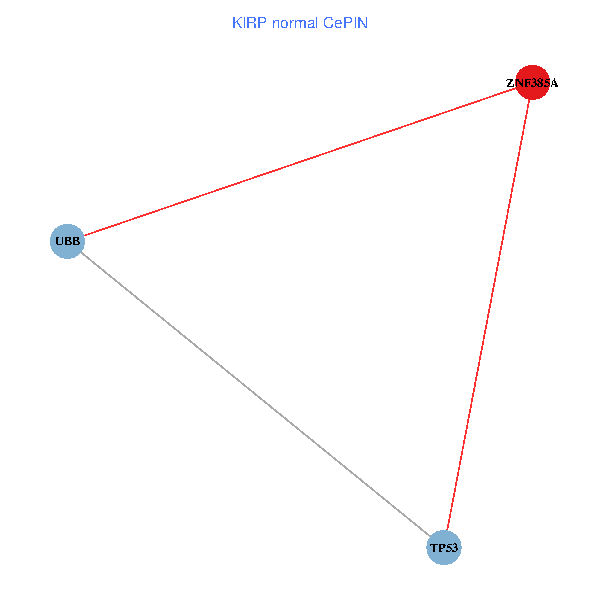
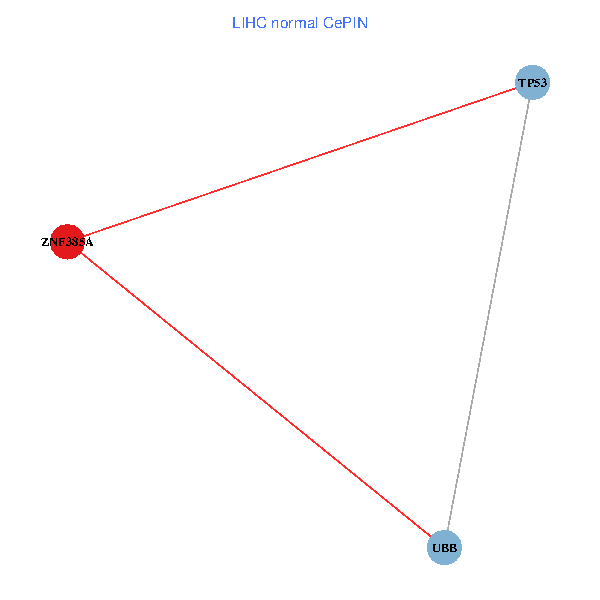
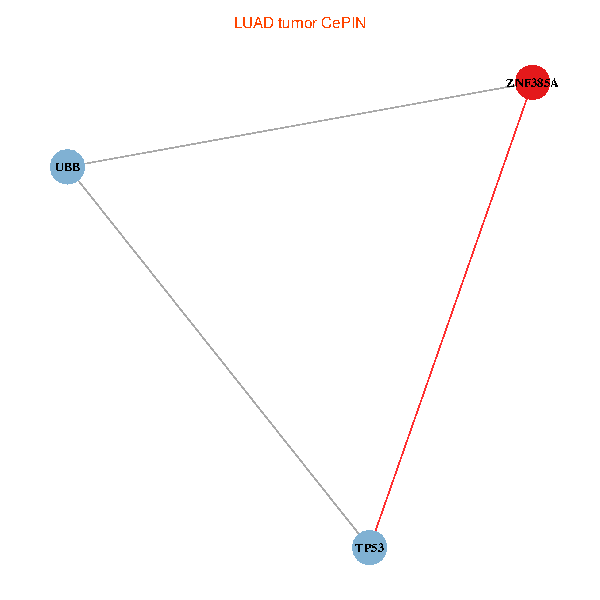
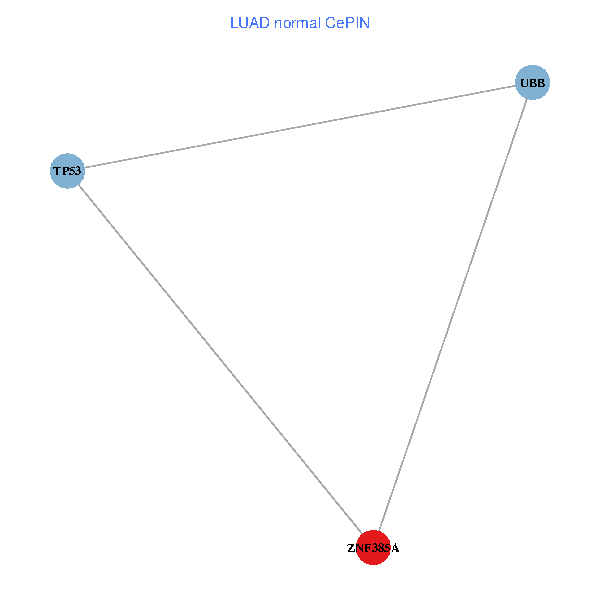
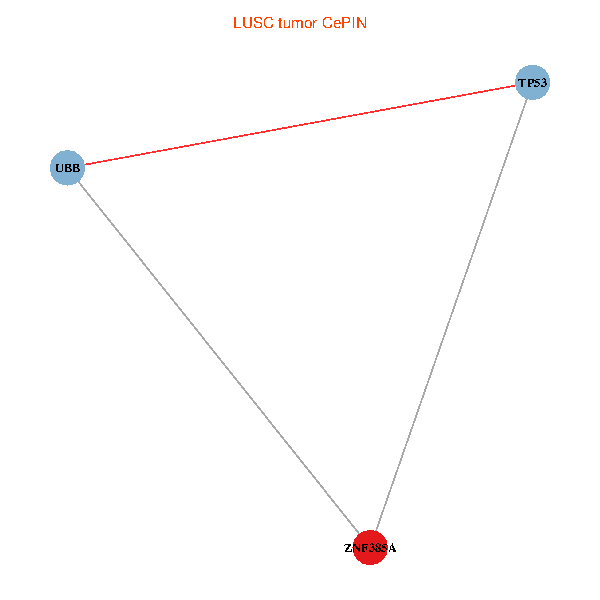
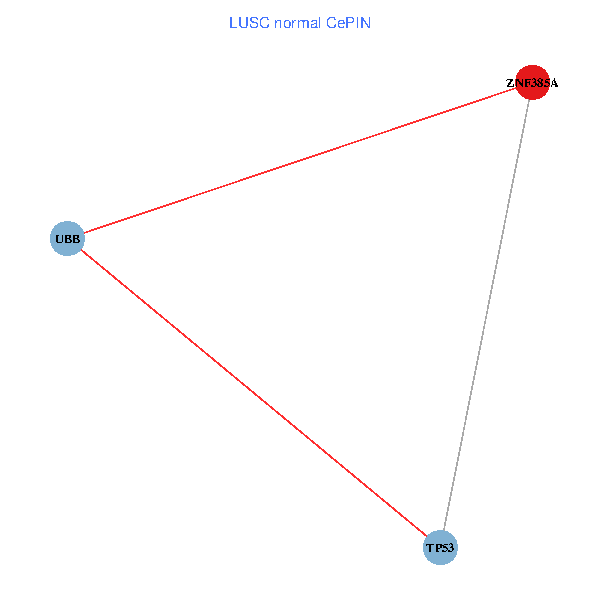
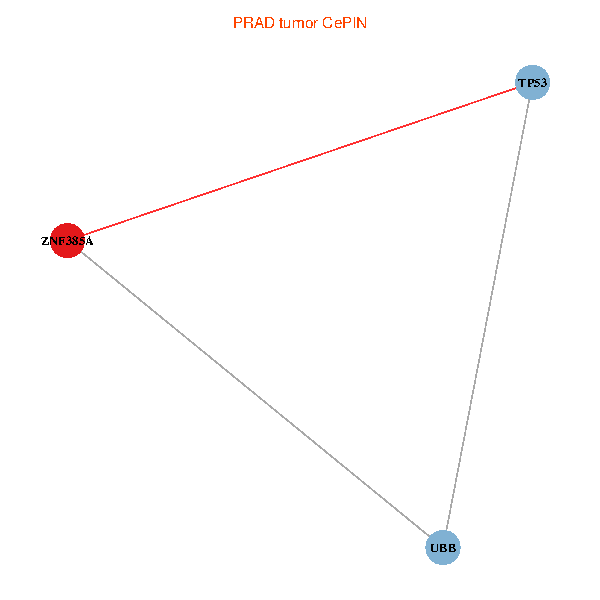
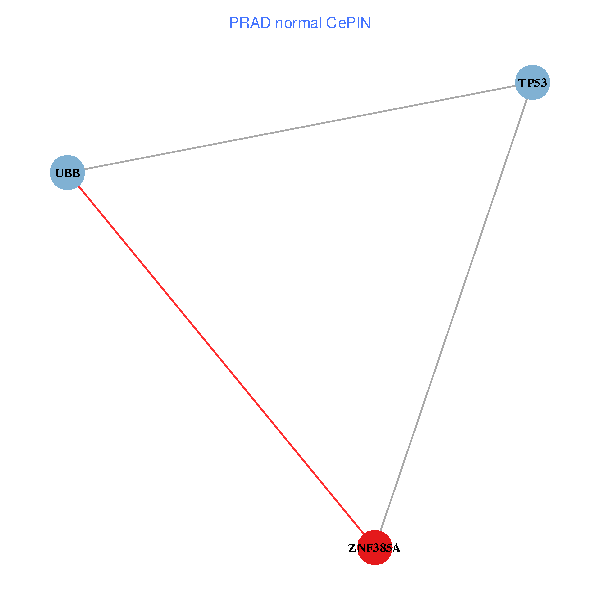
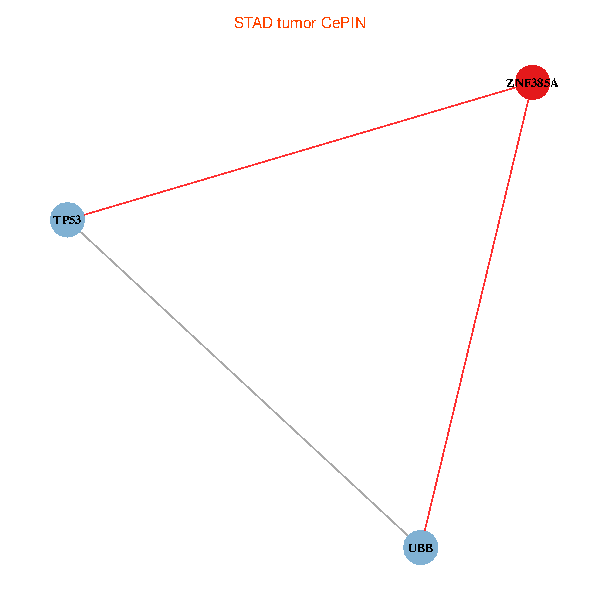
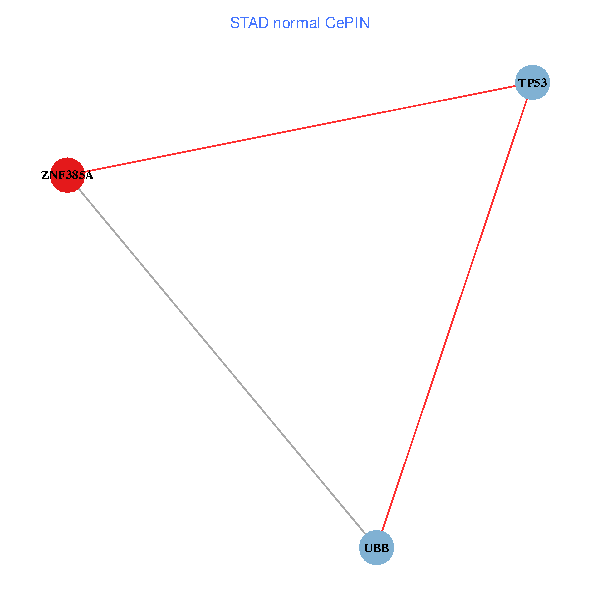
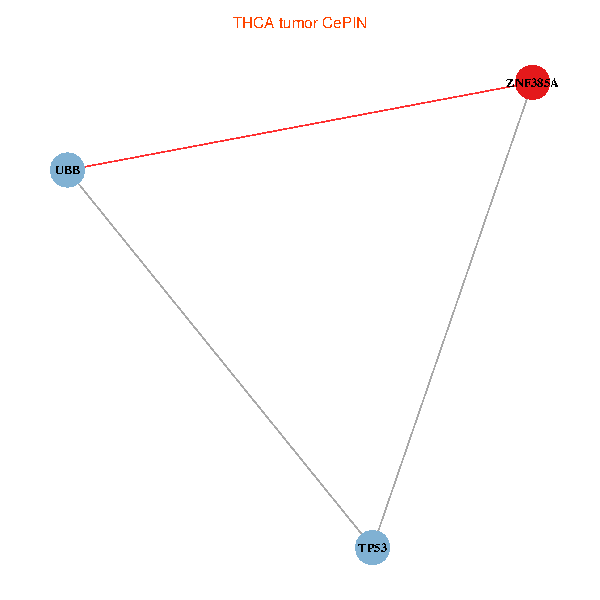
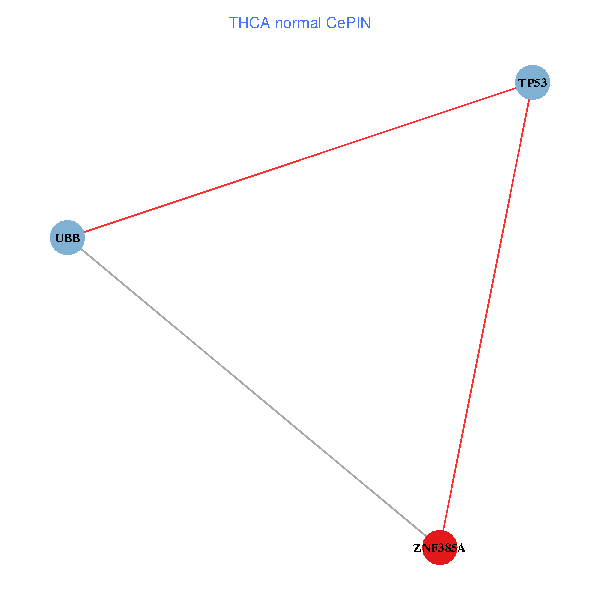
| Co-expressed gene networks based on protein-protein interaction data (CePIN) (TCGA IlluminaHiSeq_RNASeqV2, pan-cancer normalized log2(norm_counts+1) data, version 2016-08-16) (PINA2 ppi data) |
| BRCA (tumor) | BRCA (normal) |
| ZNF385A, TP53, UBB (tumor) | ZNF385A, TP53, UBB (normal) |
 |  |
| COAD (tumor) | COAD (normal) |
| ZNF385A, TP53, UBB (tumor) | ZNF385A, TP53, UBB (normal) |
 |  |
| HNSC (tumor) | HNSC (normal) |
| ZNF385A, TP53, UBB (tumor) | ZNF385A, TP53, UBB (normal) |
 |  |
| KICH (tumor) | KICH (normal) |
| ZNF385A, TP53, UBB (tumor) | ZNF385A, TP53, UBB (normal) |
 |  |
| KIRC (tumor) | KIRC (normal) |
| ZNF385A, TP53, UBB (tumor) | ZNF385A, TP53, UBB (normal) |
 |  |
| KIRP (tumor) | KIRP (normal) |
| ZNF385A, TP53, UBB (tumor) | ZNF385A, TP53, UBB (normal) |
 |  |
| LIHC (tumor) | LIHC (normal) |
| ZNF385A, TP53, UBB (tumor) | ZNF385A, TP53, UBB (normal) |
 |  |
| LUAD (tumor) | LUAD (normal) |
| ZNF385A, TP53, UBB (tumor) | ZNF385A, TP53, UBB (normal) |
 |  |
| LUSC (tumor) | LUSC (normal) |
| ZNF385A, TP53, UBB (tumor) | ZNF385A, TP53, UBB (normal) |
 |  |
| PRAD (tumor) | PRAD (normal) |
| ZNF385A, TP53, UBB (tumor) | ZNF385A, TP53, UBB (normal) |
 |  |
| STAD (tumor) | STAD (normal) |
| ZNF385A, TP53, UBB (tumor) | ZNF385A, TP53, UBB (normal) |
 |  |
| THCA (tumor) | THCA (normal) |
| ZNF385A, TP53, UBB (tumor) | ZNF385A, TP53, UBB (normal) |
 |  |
| Top |
| TissGeneProg for ZNF385A |
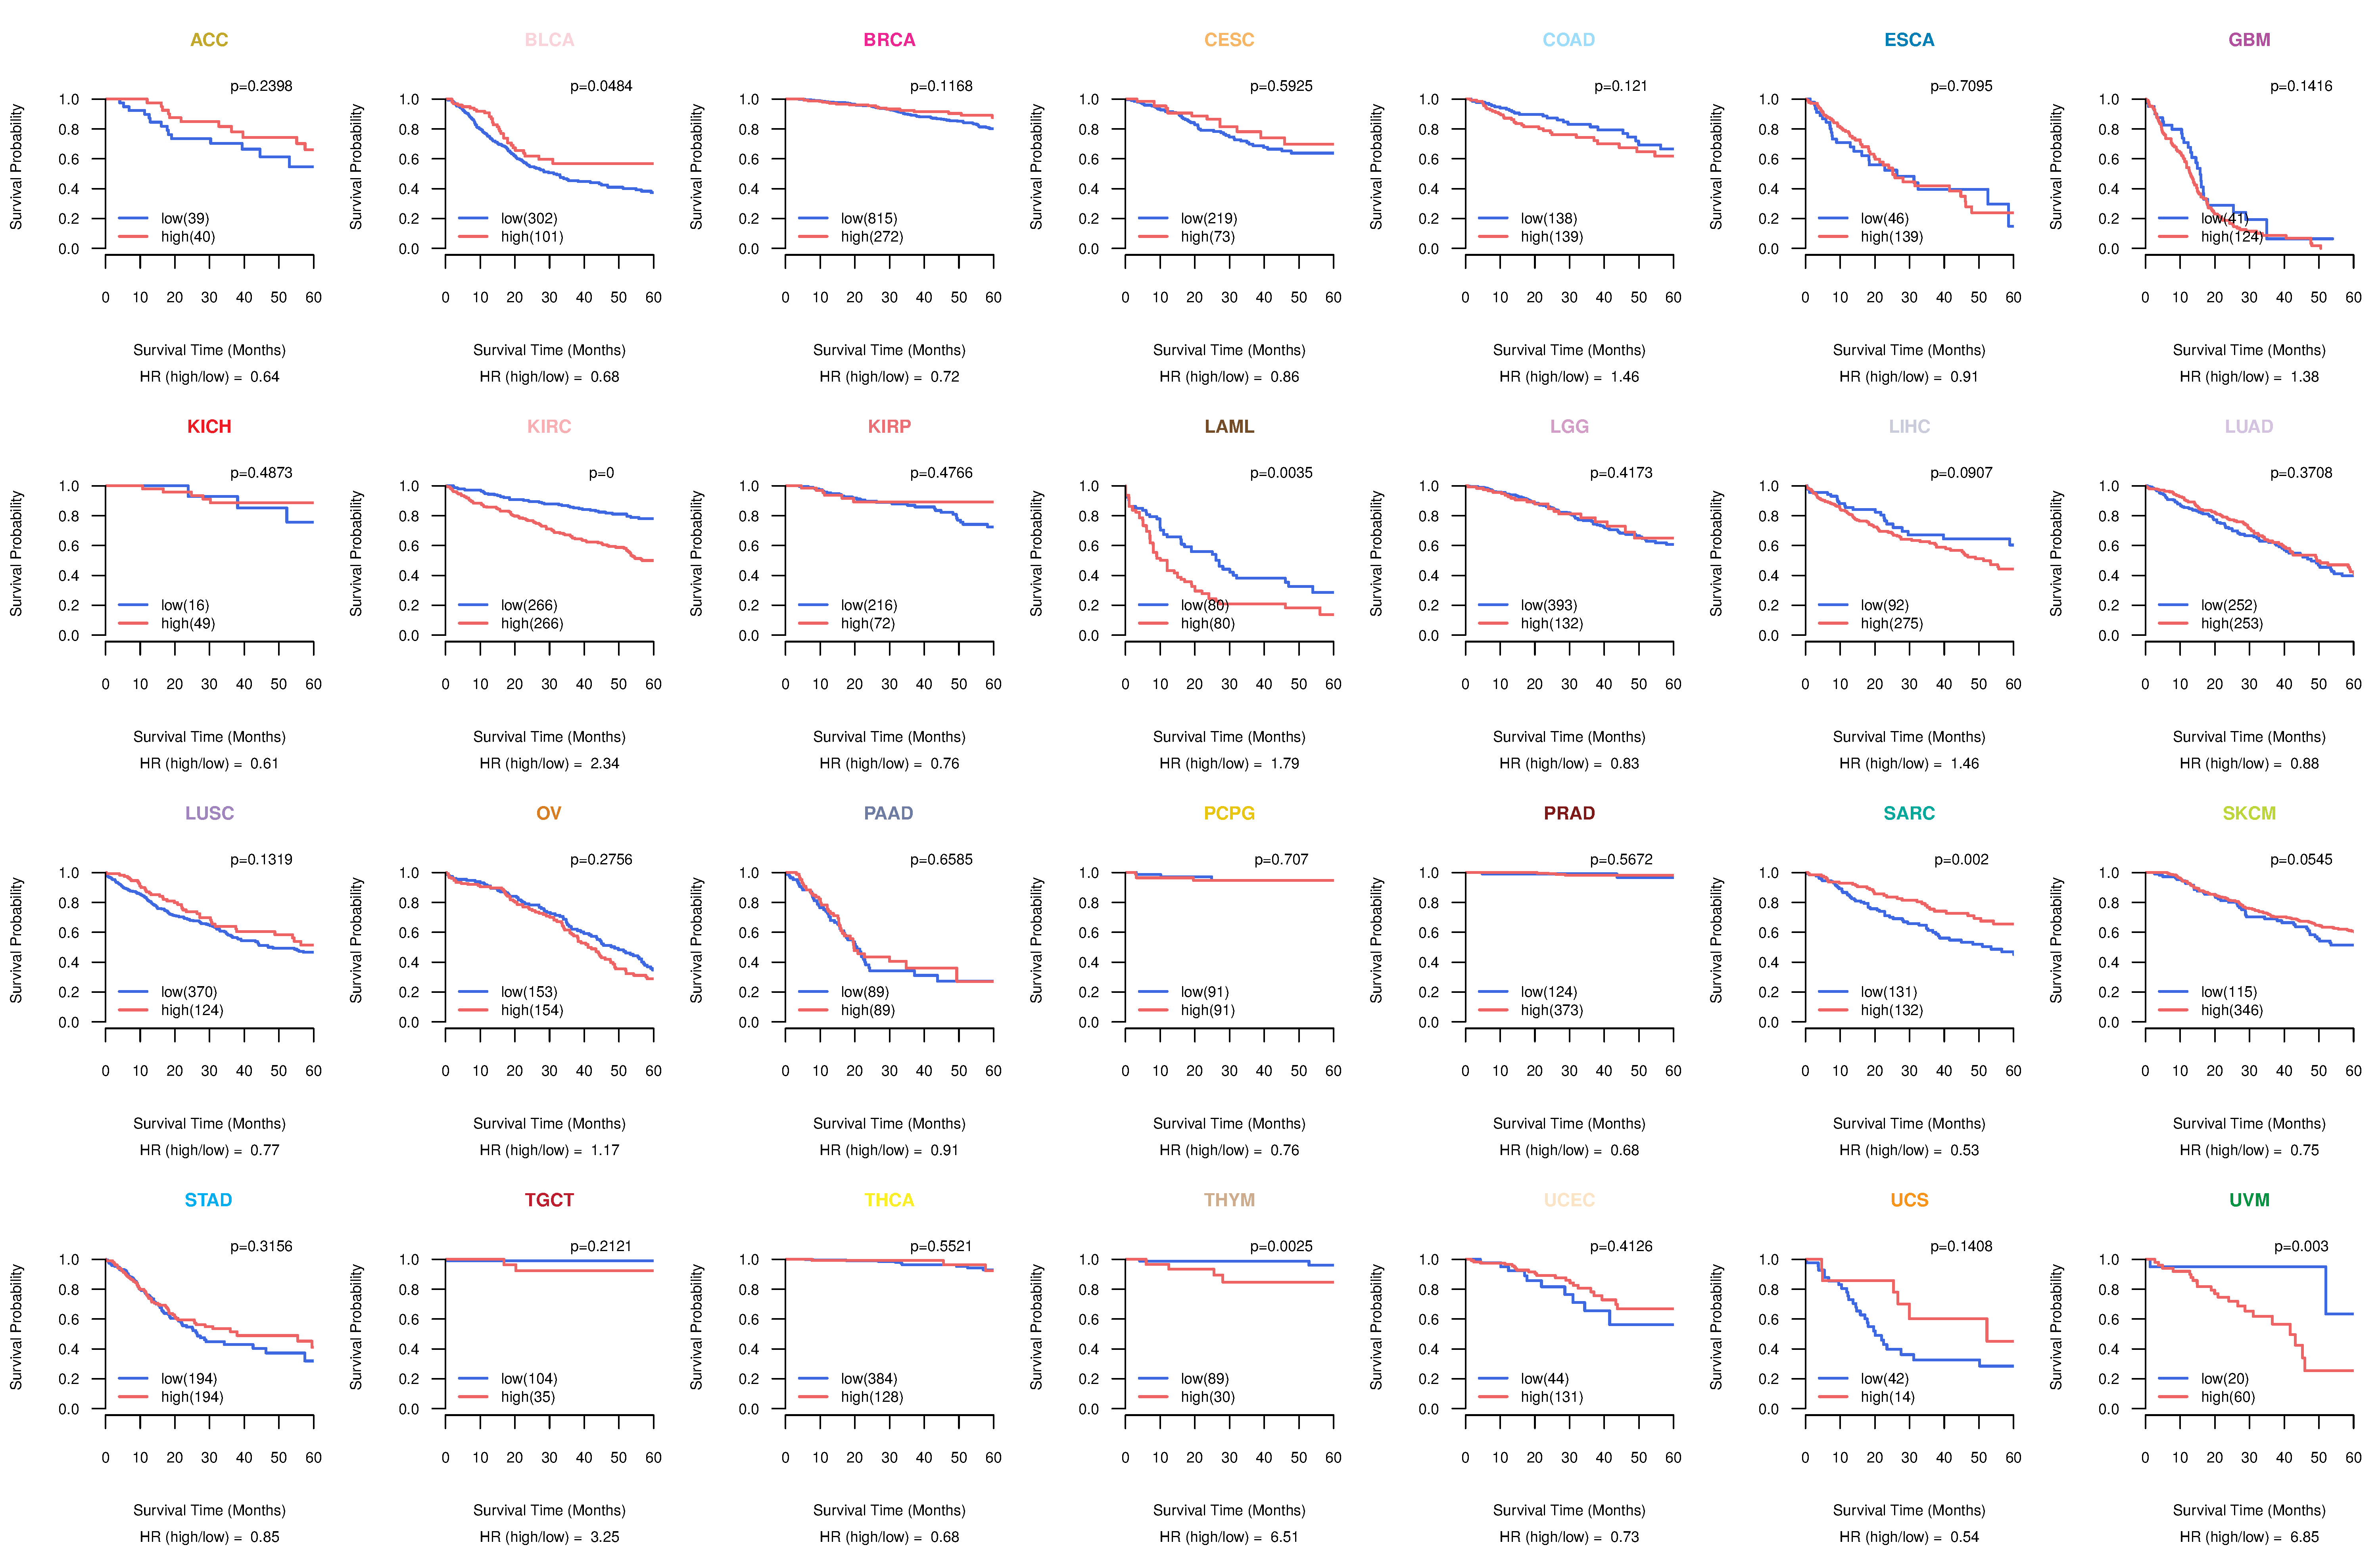
| Kaplan-Meier plots with logrank tests of overall survival (OS) using 28 cancer types (TCGA IlluminaHiSeq_RNASeqV2, pan-cancer normalized log2(norm_counts+1) data, version 2016-08-16) (TCGA clinicalMatrix, phenotype data, version 2016-04-27) * Click on the image to enlarge it in a new window. |
 |
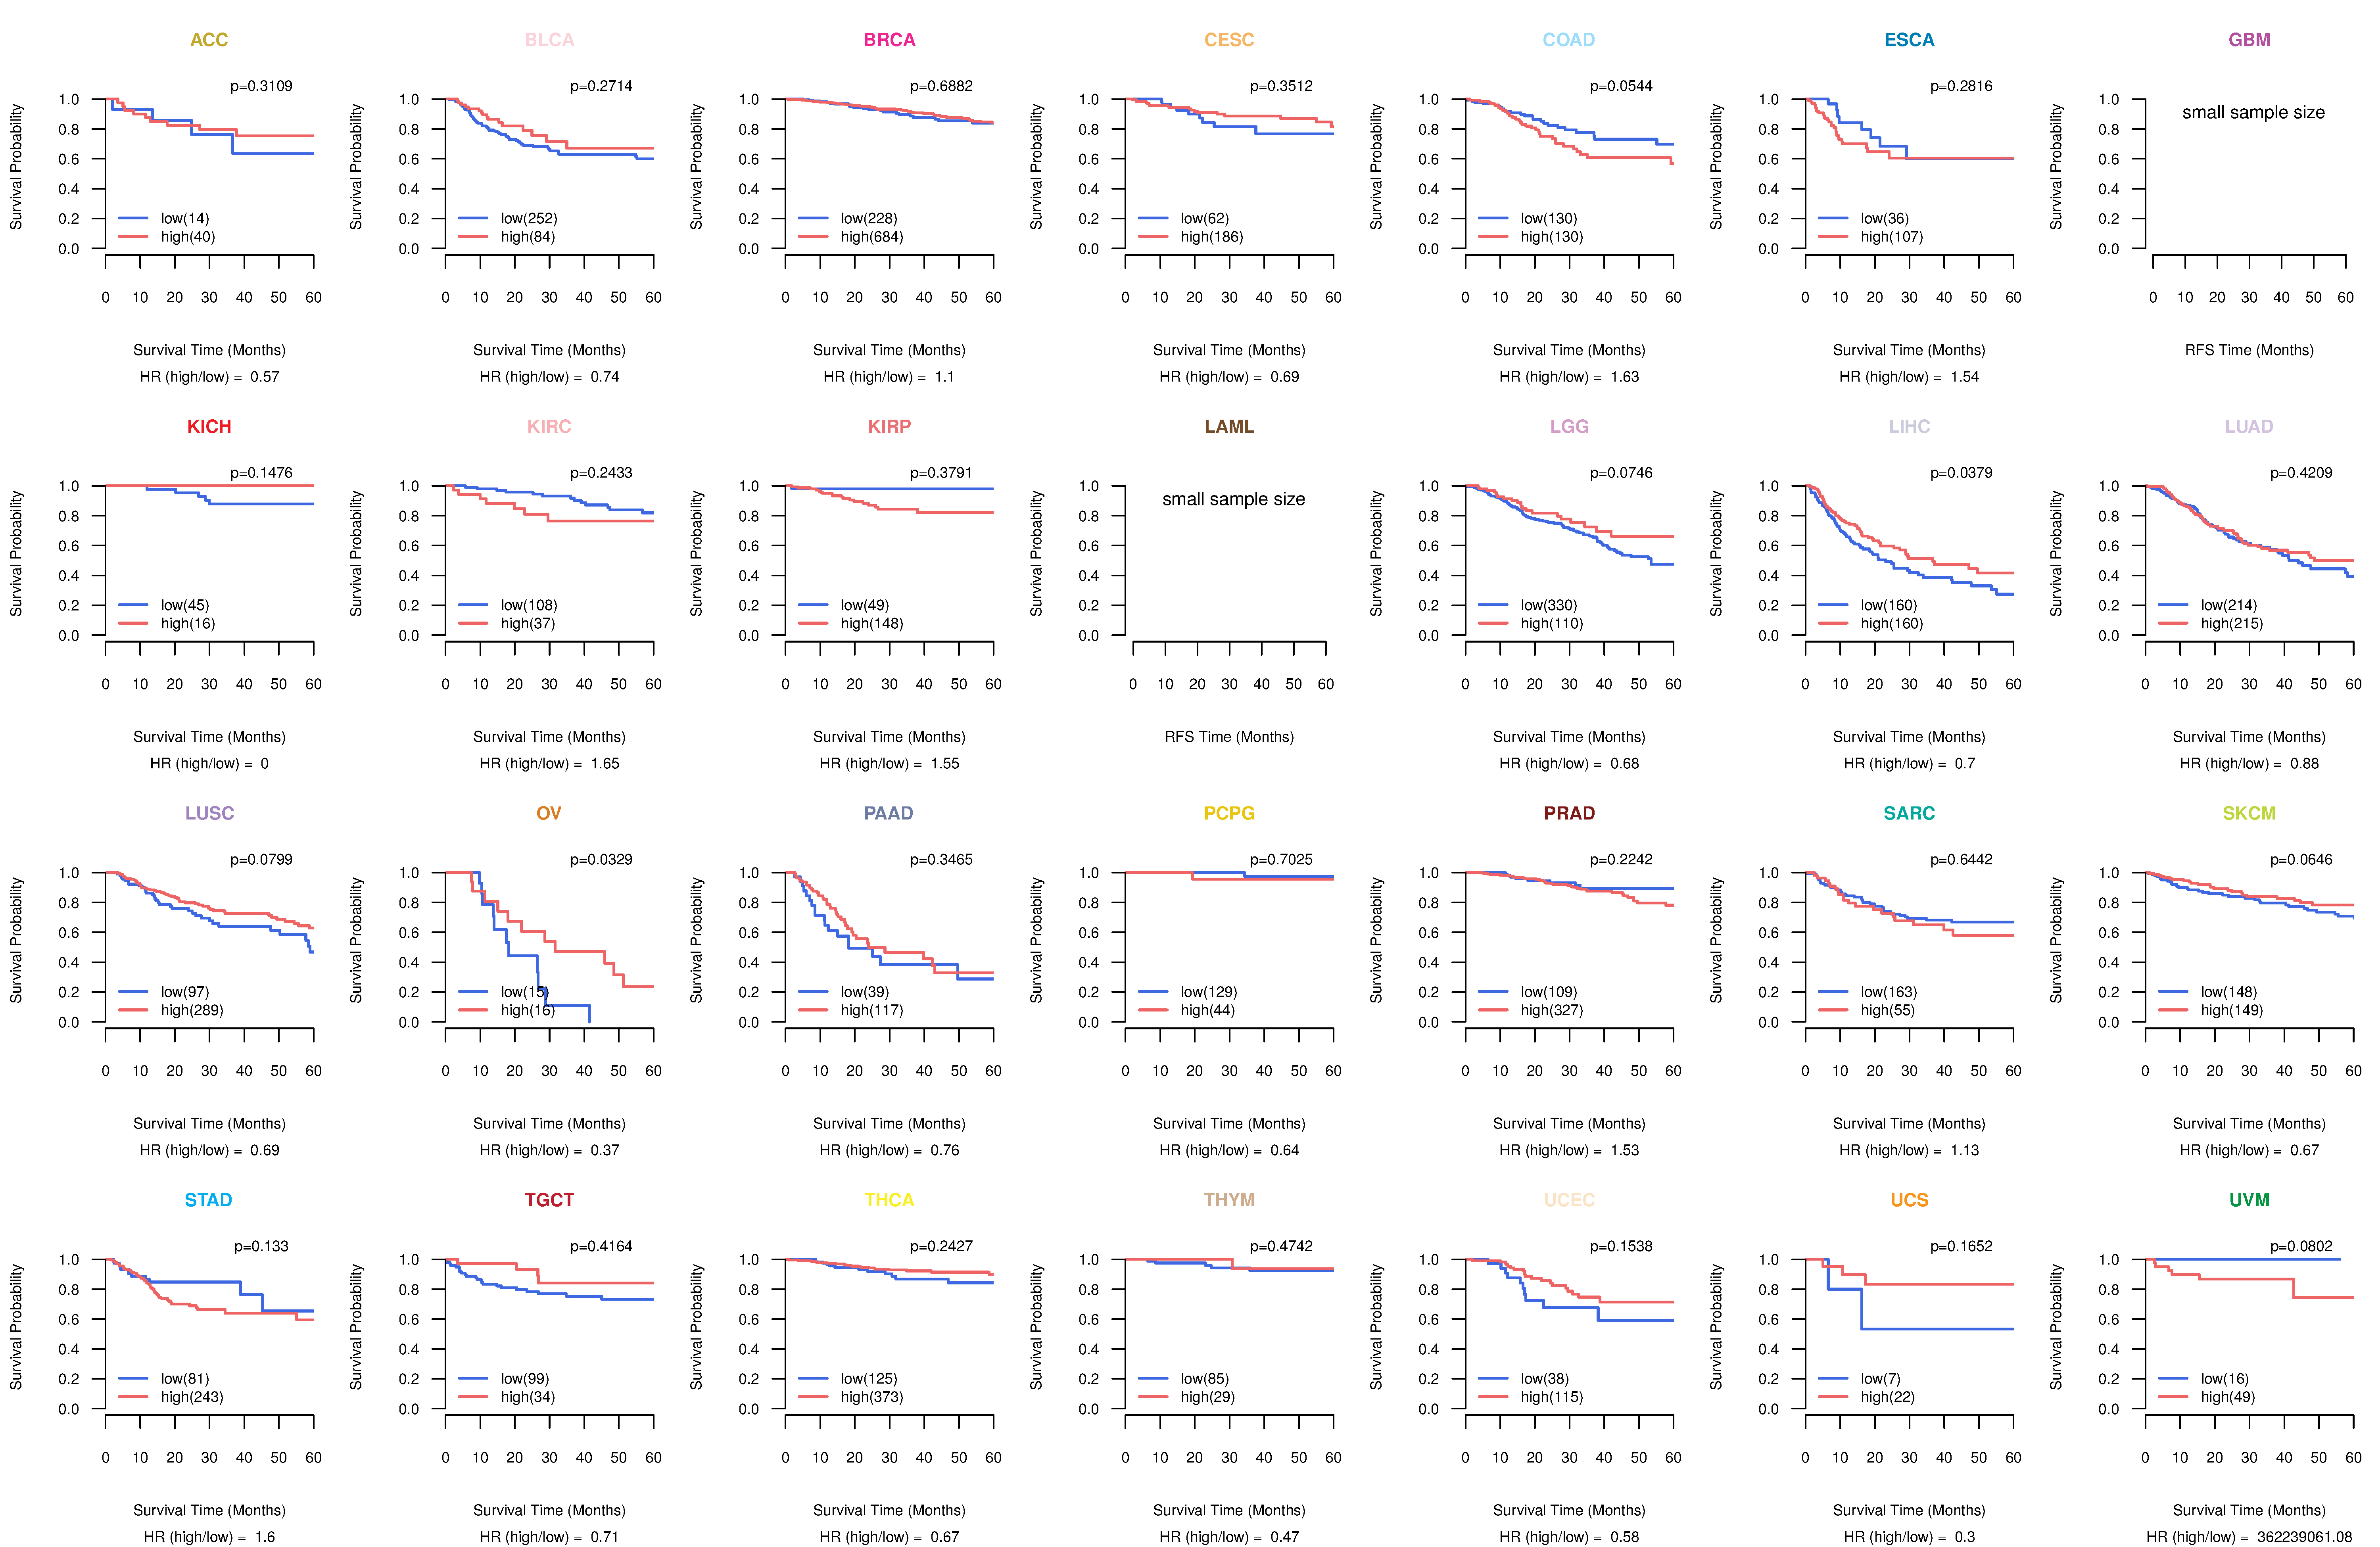
| Kaplan-Meier plots with logrank test of relapse free survival (RFS) using 28 cancer types (TCGA IlluminaHiSeq_RNASeqV2, pan-cancer normalized log2(norm_counts+1) data, version 2016-08-16) (TCGA clinicalMatrix, phenotype data, version 2016-04-27) * Click on the image enlarge it in a new window. |
 |
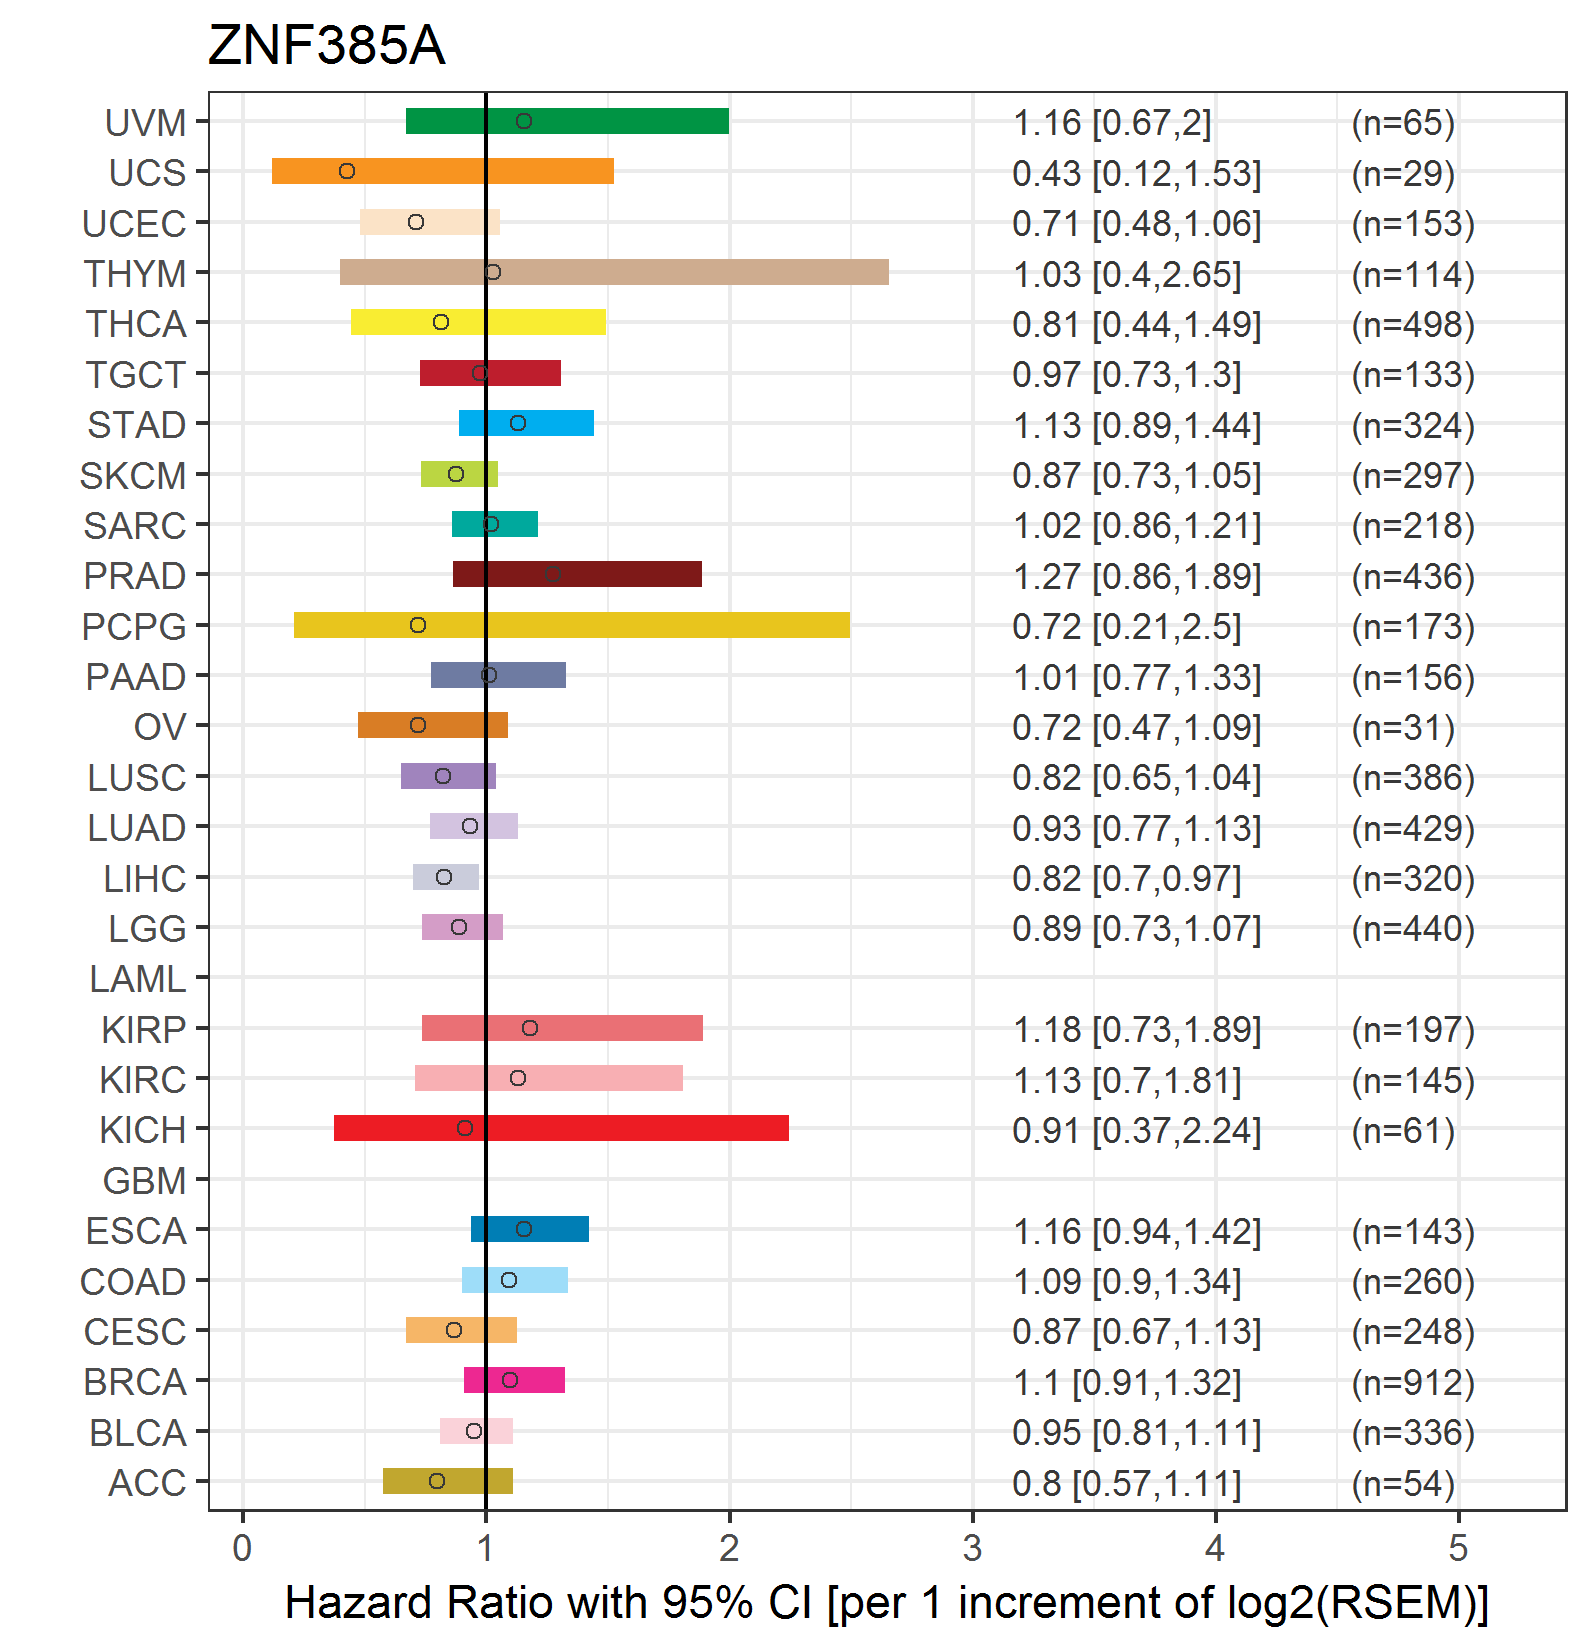
| Forest plot of Cox proportional hazard ratio (HR) and 95% CI of overall survival (OS) using 28 cancer types (TCGA IlluminaHiSeq_RNASeqV2, pan-cancer normalized log2(norm_counts+1) data, version 2016-08-16) (TCGA clinicalMatrix, phenotype data, version 2016-04-27) * Click on the image enlarge it in a new window. |
 |
| Forest plot of Cox proportional hazard ratio (HR) and 95% CI of relapse free survival (RFS) using 28 cancer types (TCGA IlluminaHiSeq_RNASeqV2, pan-cancer normalized log2(norm_counts+1) data, version 2016-08-16) (TCGA clinicalMatrix, phenotype data, version 2016-04-27) * Click on the image enlarge it in a new window. |
 |
| Top |
| TissGeneClin for ZNF385A |
| TissGeneDrug for ZNF385A |
| Drug information targeting TissGene (DrugBank Version 5.0.6, 2017-04-01) |
| DrugBank ID | Drug name | Drug activity | Drug type | Drug status |
| Top |
| TissGeneDisease for ZNF385A |
| Disease information associated with TissGene (DisGeNet, 2016-06-01) |
| Disease ID | Disease name | # pubmeds | Source |
| umls:C0035309 | Retinal Diseases | 1 | LHGDN |
|
Copyright 2016-Present - The University of Texas Health Science Center at Houston (UTHealth) Web File Viewing | How to Report, Fraud, Waste and Abuse | State of Texas | Statewide Search | Texas Homeland Security | Site Policies |