 |
| |
| |
| |
| |
| |
| |
|

| TissGeneSummary for GATM |
 Gene summary Gene summary |
| Basic gene information | Gene symbol | GATM |
| Gene name | glycine amidinotransferase (L-arginine:glycine amidinotransferase) | |
| Synonyms | AGAT|AT|CCDS3 | |
| Cytomap | UCSC genome browser: 15q21.1 | |
| Type of gene | protein-coding | |
| RefGenes | NM_001482.2, | |
| Description | glycine amidinotransferase, mitochondrialtransamidinase | |
| Modification date | 20141219 | |
| dbXrefs | MIM : 602360 | |
| HGNC : HGNC | ||
| Ensembl : ENSG00000171766 | ||
| HPRD : 03838 | ||
| Vega : OTTHUMG00000131427 | ||
| Protein | UniProt: go to UniProt's Cross Reference DB Table | |
| Expression | CleanEX: HS_GATM | |
| BioGPS: 2628 | ||
| Pathway | NCI Pathway Interaction Database: GATM | |
| KEGG: GATM | ||
| REACTOME: GATM | ||
| Pathway Commons: GATM | ||
| Context | iHOP: GATM | |
| ligand binding site mutation search in PubMed: GATM | ||
| UCL Cancer Institute: GATM | ||
| Assigned class in TissGDB* | C | |
| Included tissue-specific gene expression resources | TiGER,GTEx | |
| Specific-tissues in normal samples (assigned by TissGDB using HPA, TiGER, and GTEx) | KidneyLiverPancreas | |
| Cancer types related to the specific-tissues in cancer samples (assigned by TissGDB using TCGA) | KIRC,KIRP,KICHLIHCPAAD | |
| Reference showing the relevant tissue of GATM | ||
| Description by TissGene annotations | Fused withTSGene | |
| * Class A consists of genes with literature evidence and is part of the cTissGenes. Class B consists of only cTissGenes without additional evidence. The remaining genes belong to Class C. |
| Gene ontology having evidence of Inferred from Direct Assay (IDA) from Entrez |
| GO ID | GO term | PubMed ID | GO:0006601 | creatine biosynthetic process | 9218780 | GO:0006601 | creatine biosynthetic process | 9218780 |
| Top |
| TissGeneExp for GATM |
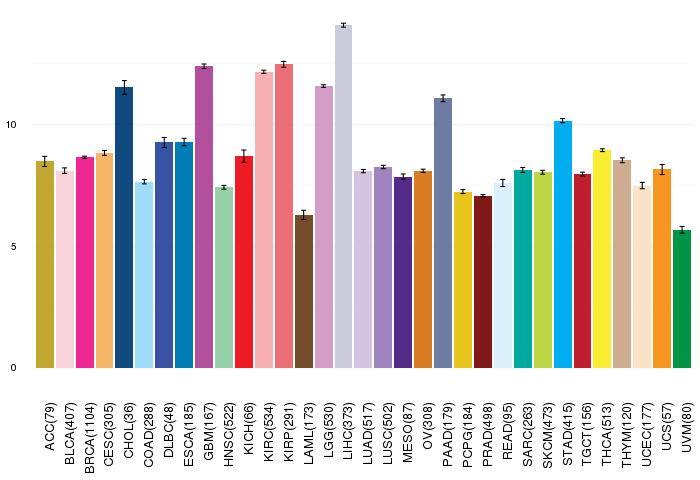
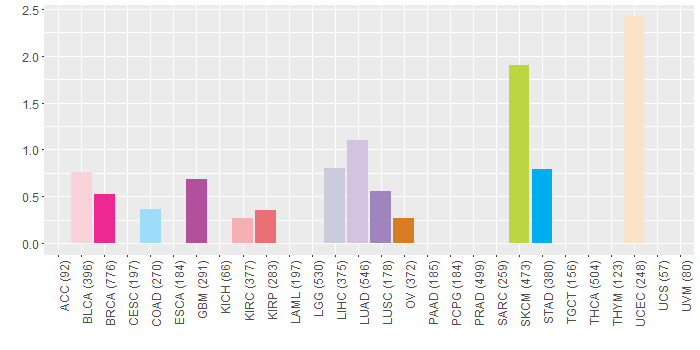
| Gene expressions across 28 cancer types (X-axis: cancer type and Y-axis: log2(norm_counts+1)) (TCGA IlluminaHiSeq_RNASeqV2, pan-cancer normalized log2(norm_counts+1) data, version 2016-08-16) |
 |
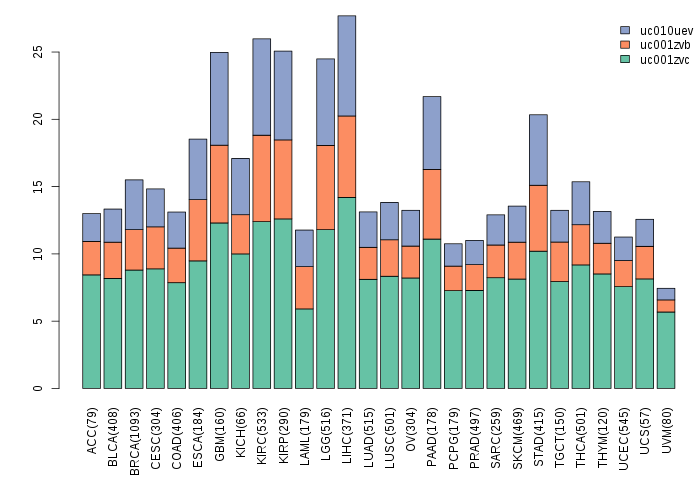
| Gene isoform expressions across 28 cancer types (X-axis: cancer type and Y-axis: log2(norm_counts+1)) (TCGA pan-cancer tcga_rsem_isoform_tpm, version 2016-09-01) |
 |
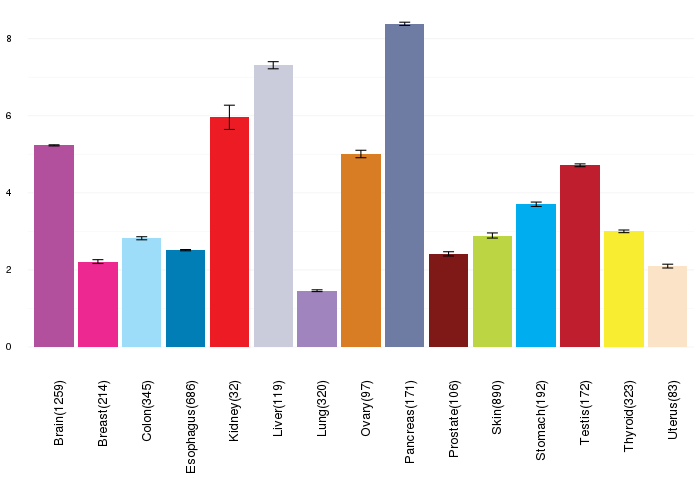
| Gene expressions across normal tissues of GTEx data (GTEx GTEx_Analysis_v6_RNA-seq_RNA-SeQCv1.1.8_gene_rpkm.gct) - Here, we shows the matched tissue types only among our 28 cancer types. |
 |
| Different expressions across 14 cancer types with more than 10 samples between matched tumors and normals (X-axis: cancer type and Y-axis: log2(norm_counts+1)) (TCGA IlluminaHiSeq_RNASeqV2, pan-cancer normalized log2(norm_counts+1) data, version 2016-08-16) |
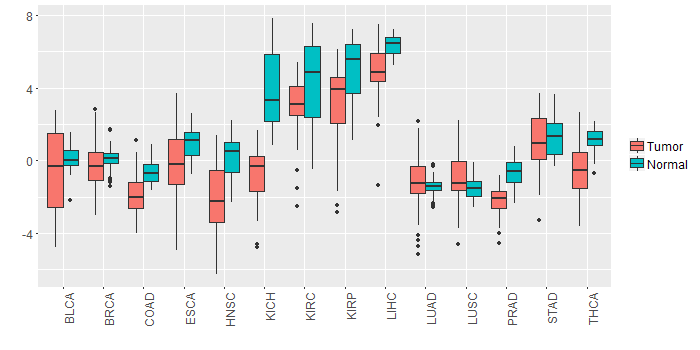 |
| - Significantly differentially expressed cancer types and information. (|Fold change|>1 and FDR<0.05) |
| Cancer type | Mean(exp) in tumor | Mean(exp) in matched normal | Log2FC | P-val. | FDR |
| KIRC | 3.059034308 | 4.380923197 | -1.321888889 | 3.82E-05 | 8.47E-05 |
| KICH | -0.711371359 | 3.854820641 | -4.566192 | 1.10E-10 | 8.42E-10 |
| HNSC | -2.154142242 | 0.235469386 | -2.389611628 | 2.02E-09 | 2.97E-08 |
| PRAD | -2.191782359 | -0.621151589 | -1.570630769 | 6.94E-18 | 2.11E-15 |
| LIHC | 4.883190641 | 6.348794641 | -1.465604 | 2.01E-08 | 1.66E-07 |
| THCA | -0.479771765 | 1.155079082 | -1.634850847 | 1.17E-12 | 1.02E-11 |
| KIRP | 2.976755141 | 4.935617641 | -1.9588625 | 0.00103 | 0.002829975 |
| COAD | -1.799053512 | -0.615784282 | -1.183269231 | 0.00018 | 0.000614299 |
| Top |
| TissGene-miRNA for GATM |
| Significantly anti-correlated miRNAs of TissGene across 28 cancer types (Gene-miRNA relations from TargetScanHuman Relsease 7.1, Conserved_Site_Context_Scores.txt.zip, 06.01.2016) (TCGA IlluminaHiSeq_miRNASeq, log2(RPM+1) data, version 2016-11-21) (TCGA IlluminaHiSeq_RNASeqV2, log2(normalized_count+1) data, version 2016-08-16) (Spearman’s Rank Correlation (p-value<0.05 and coefficient<-0.25)) |
| Cancer type | miRNA id | miRNA accession | P-val. | Coeff. | # samples |
| UCEC | hsa-let-7a-5p | MIMAT0000062 | 0.00018 | -0.27 | 194 |
| UCS | hsa-miR-30b-5p | MIMAT0000420 | 0.029 | -0.29 | 56 |
| Top |
| TissGeneMut for GATM |
| TissGeneSNV for GATM |
| nsSNV counts per each loci. Different colors of circles represent different cancer types. Circle size denotes number of samples. (TCGA somatic mutation (SNPs and small INDELs) data, version 2016-04-25) * Click on the image to enlarge it in a new window. |
 |
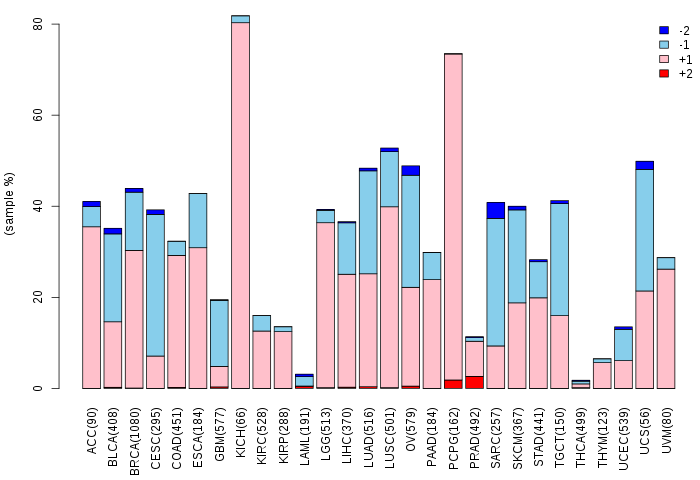
| Somatic nucleotide variants of TissGene across 28 cancer types (X-axis: cancer type and Y-axis: % of mutated samples) The numbers in parentheses are numbers of samples with mutation (nsSNVs). (TCGA somatic mutation (SNPs and small INDELs) data, version 2016-04-25) |
 |
| - nsSNVs sorted by frequency. |
| AAchange | Cancer type | # samples |
| p.I259F | BRCA | 1 |
| p.R187L | LUAD | 1 |
| p.R26Q | SKCM | 1 |
| p.W335* | SKCM | 1 |
| p.R282C | UCEC | 1 |
| p.E279K | BLCA | 1 |
| p.R414H | SKCM | 1 |
| p.R414C | HNSC | 1 |
| p.V245A | OV | 1 |
| p.G314R | SKCM | 1 |
| p.I293V | HNSC | 1 |
| p.G402E | BLCA | 1 |
| p.N132T | UCEC | 1 |
| p.P340S | LUAD | 1 |
| p.G262V | BRCA | 1 |
| p.P183L | SKCM | 1 |
| p.R47G | KIRC | 1 |
| p.P105L | SKCM | 1 |
| p.H406R | MESO | 1 |
| p.P90L | HNSC | 1 |
| p.D63A | LIHC | 1 |
| p.T389S | UCEC | 1 |
| p.A286S | BRCA | 1 |
| p.H119N | UCEC | 1 |
| p.I388V | LUAD | 1 |
| p.D63N | SKCM | 1 |
| p.E181K | SKCM | 1 |
| p.E126V | BRCA | 1 |
| p.Y196H | LUAD | 1 |
| p.R206L | LUAD | 1 |
| p.P378S | STAD | 1 |
| p.R194Q | HNSC | 1 |
| p.R290K | LUSC | 1 |
| p.F36L | GBM | 1 |
| p.R187C | STAD | 1 |
| p.D226G | LIHC | 1 |
| p.R34Q | BLCA | 1 |
| p.R189H | COAD | 1 |
| p.Q241R | STAD | 1 |
| p.S295F | SKCM | 1 |
| p.L151S | LIHC | 1 |
| p.D298G | GBM | 1 |
| p.F253L | LIHC | 1 |
| p.W149L | LUAD | 1 |
| p.L75X | KIRP | 1 |
| p.D298Y | UCEC | 1 |
| p.T247A | UCEC | 1 |
| Top |
| TissGeneCNV for GATM |
| Copy number variations of TissGene across 28 cancer types (X-axis: cancer type and Y-axis: % of CNV samples) (TCGA Gistic2_CopyNumber_Gistic2_all_data_by_genes, Gistic2 copy number data, version 2016-08-16) |
 |
| Top |
| TissGeneFusions for GATM |
| Fusion genes including TissGene (ChimerDB 3.0, 2016-12-01 and TCGA fusion Portal 2015-12-01) |
| Database | Src | Cancer type | Sample | Fusion gene | ORF | 5'-gene BP | 3'-gene BP |
| Chimerdb3.0 | ChiTaRs | NA | BF933512 | GATM-DDX3X | chr15:45656463 | chrX:41197147 | |
| Chimerdb3.0 | ChiTaRs | NA | AW861199 | WSB1-GATM | chr17:25630602 | chr15:45657895 | |
| Chimerdb3.0 | ChiTaRs | NA | BF946024 | GATM-TSEN2 | chr15:45654108 | chr3:12560544 |
| Top |
| TissGeneNet for GATM |
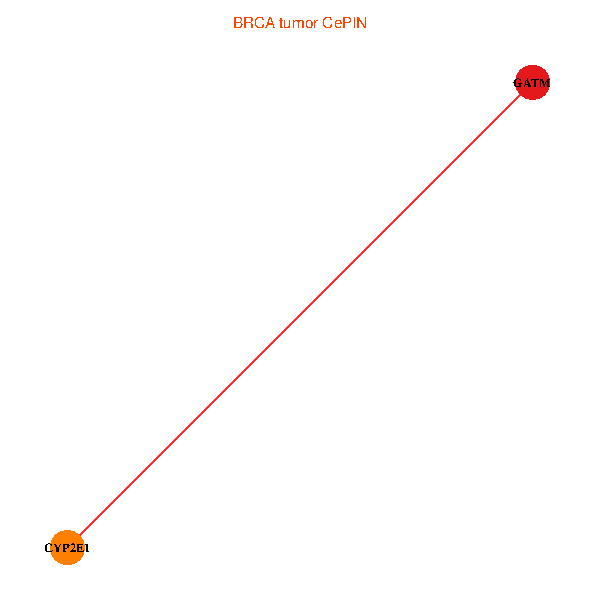
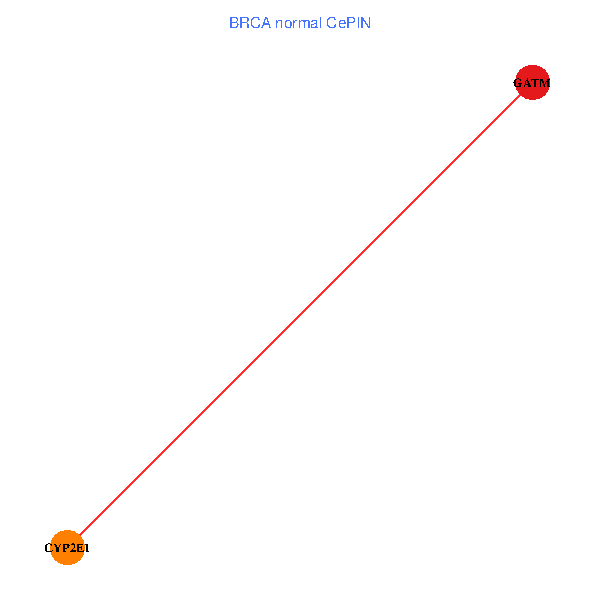
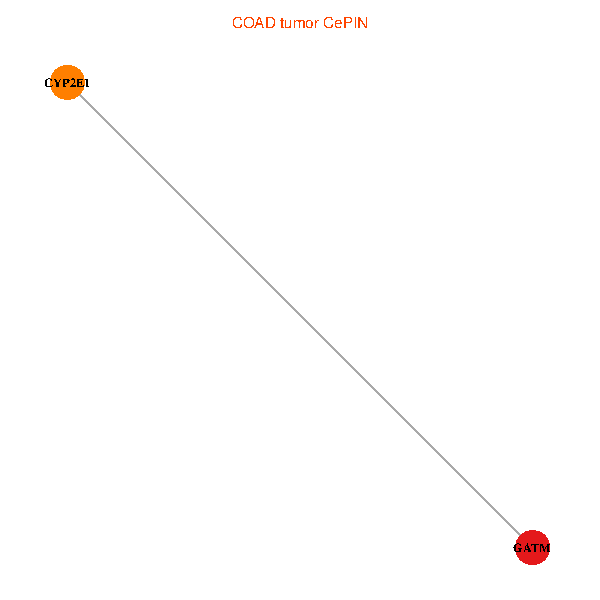
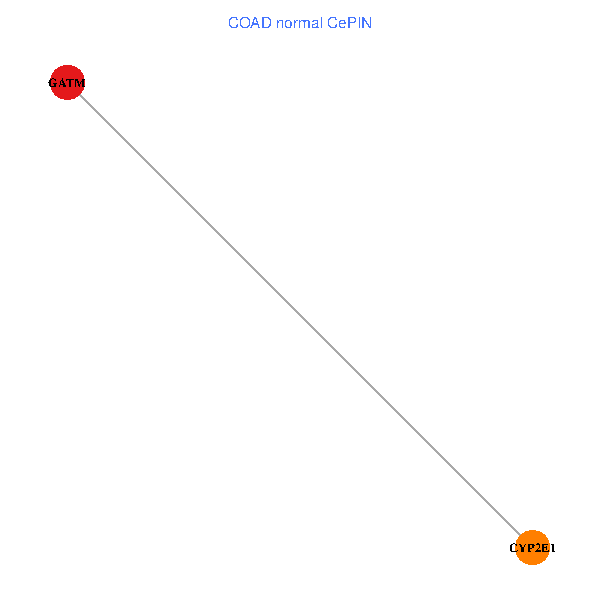
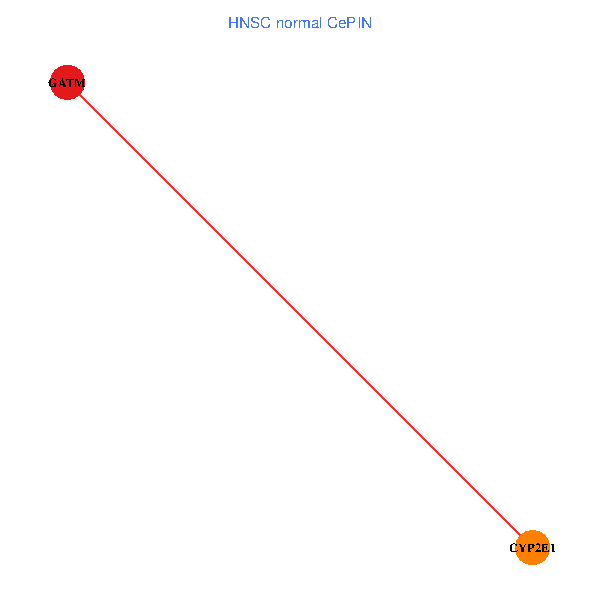
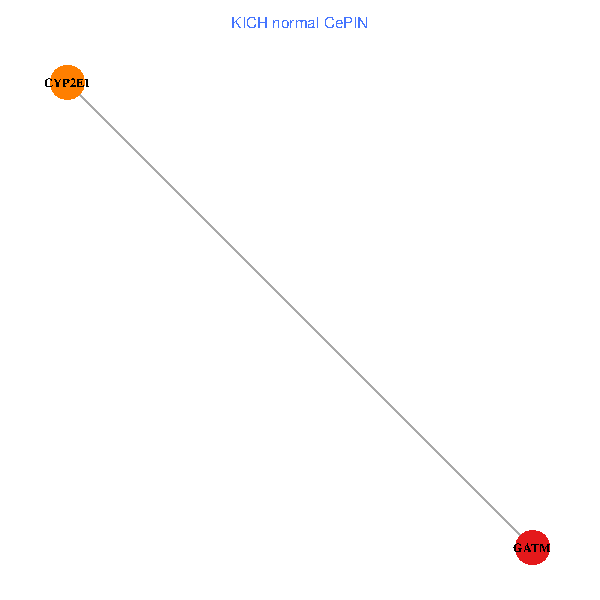
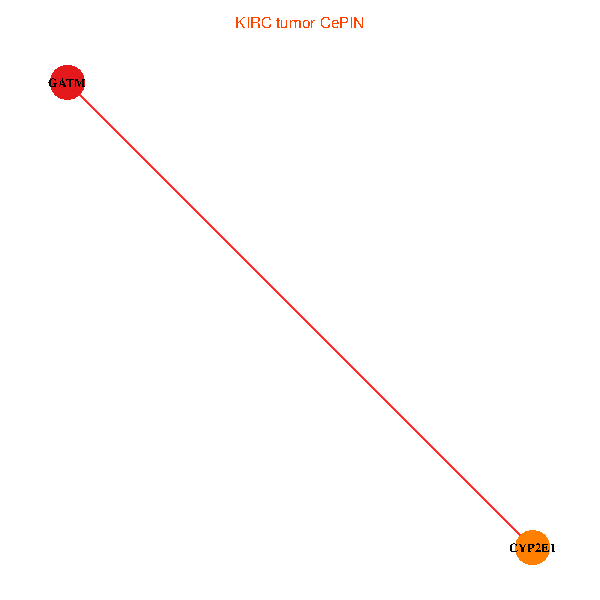
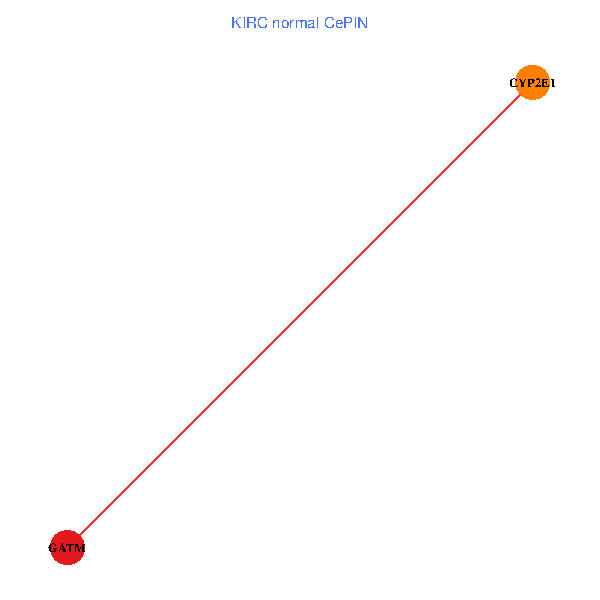
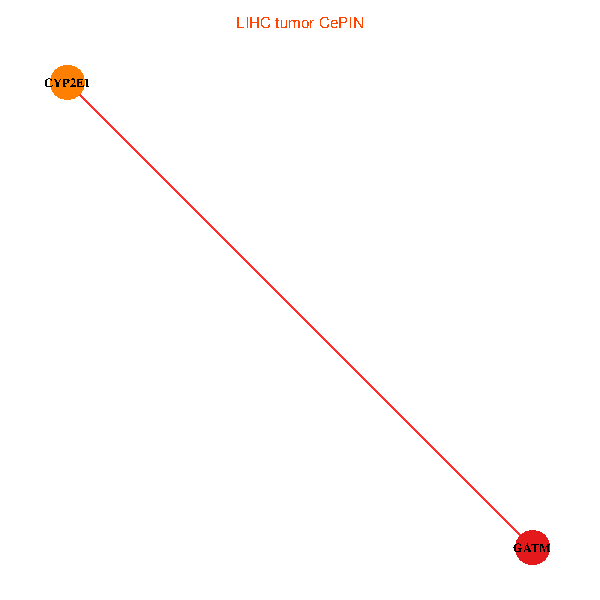
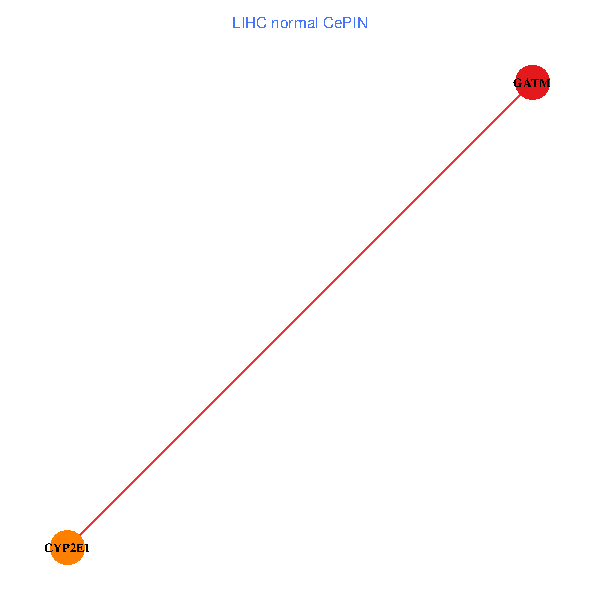
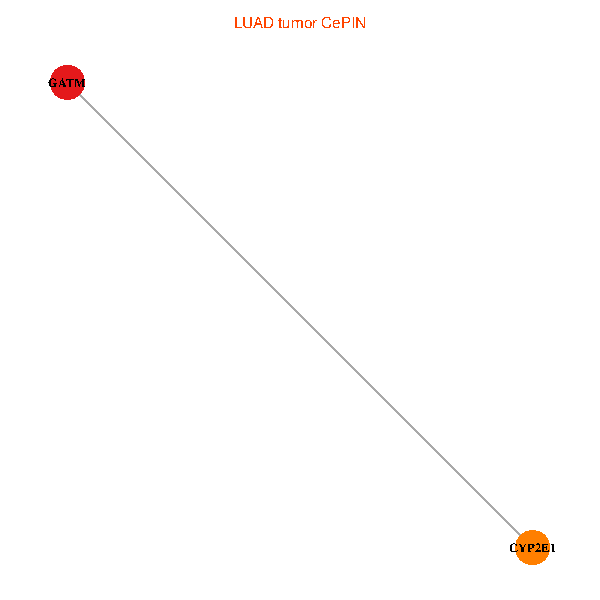
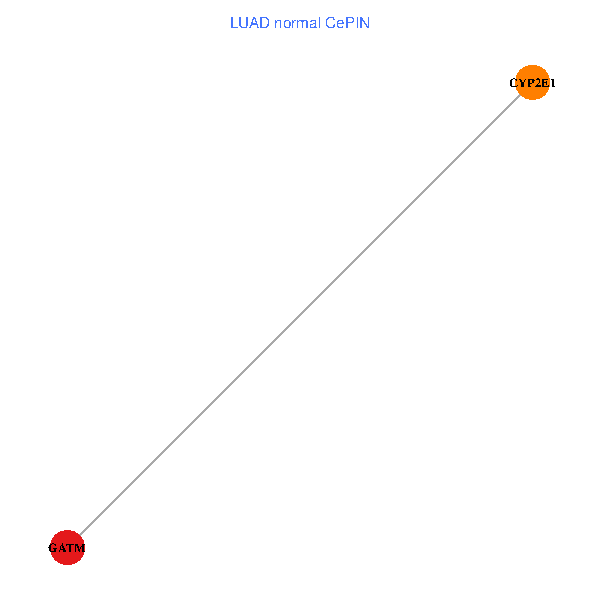
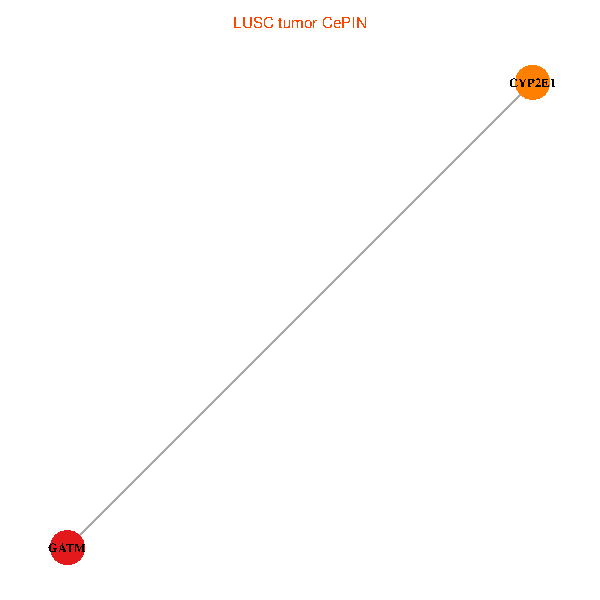
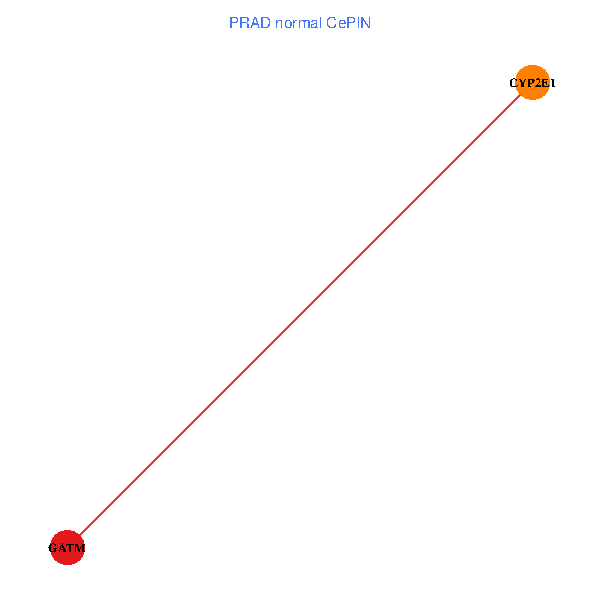
| Co-expressed gene networks based on protein-protein interaction data (CePIN) (TCGA IlluminaHiSeq_RNASeqV2, pan-cancer normalized log2(norm_counts+1) data, version 2016-08-16) (PINA2 ppi data) |
| BRCA (tumor) | BRCA (normal) |
| GATM, CYP2E1 (tumor) | GATM, CYP2E1 (normal) |
 |  |
| COAD (tumor) | COAD (normal) |
| GATM, CYP2E1 (tumor) | GATM, CYP2E1 (normal) |
 |  |
| HNSC (tumor) | HNSC (normal) |
| GATM, CYP2E1 (tumor) | GATM, CYP2E1 (normal) |
 |  |
| KICH (tumor) | KICH (normal) |
| GATM, CYP2E1 (tumor) | GATM, CYP2E1 (normal) |
 |  |
| KIRC (tumor) | KIRC (normal) |
| GATM, CYP2E1 (tumor) | GATM, CYP2E1 (normal) |
 |  |
| KIRP (tumor) | KIRP (normal) |
| GATM, CYP2E1 (tumor) | GATM, CYP2E1 (normal) |
 |  |
| LIHC (tumor) | LIHC (normal) |
| GATM, CYP2E1 (tumor) | GATM, CYP2E1 (normal) |
 |  |
| LUAD (tumor) | LUAD (normal) |
| GATM, CYP2E1 (tumor) | GATM, CYP2E1 (normal) |
 |  |
| LUSC (tumor) | LUSC (normal) |
| GATM, CYP2E1 (tumor) | GATM, CYP2E1 (normal) |
 |  |
| PRAD (tumor) | PRAD (normal) |
| GATM, CYP2E1 (tumor) | GATM, CYP2E1 (normal) |
 |  |
| STAD (tumor) | STAD (normal) |
| GATM, CYP2E1 (tumor) | GATM, CYP2E1 (normal) |
 |  |
| THCA (tumor) | THCA (normal) |
| GATM, CYP2E1 (tumor) | GATM, CYP2E1 (normal) |
 |  |
| Top |
| TissGeneProg for GATM |
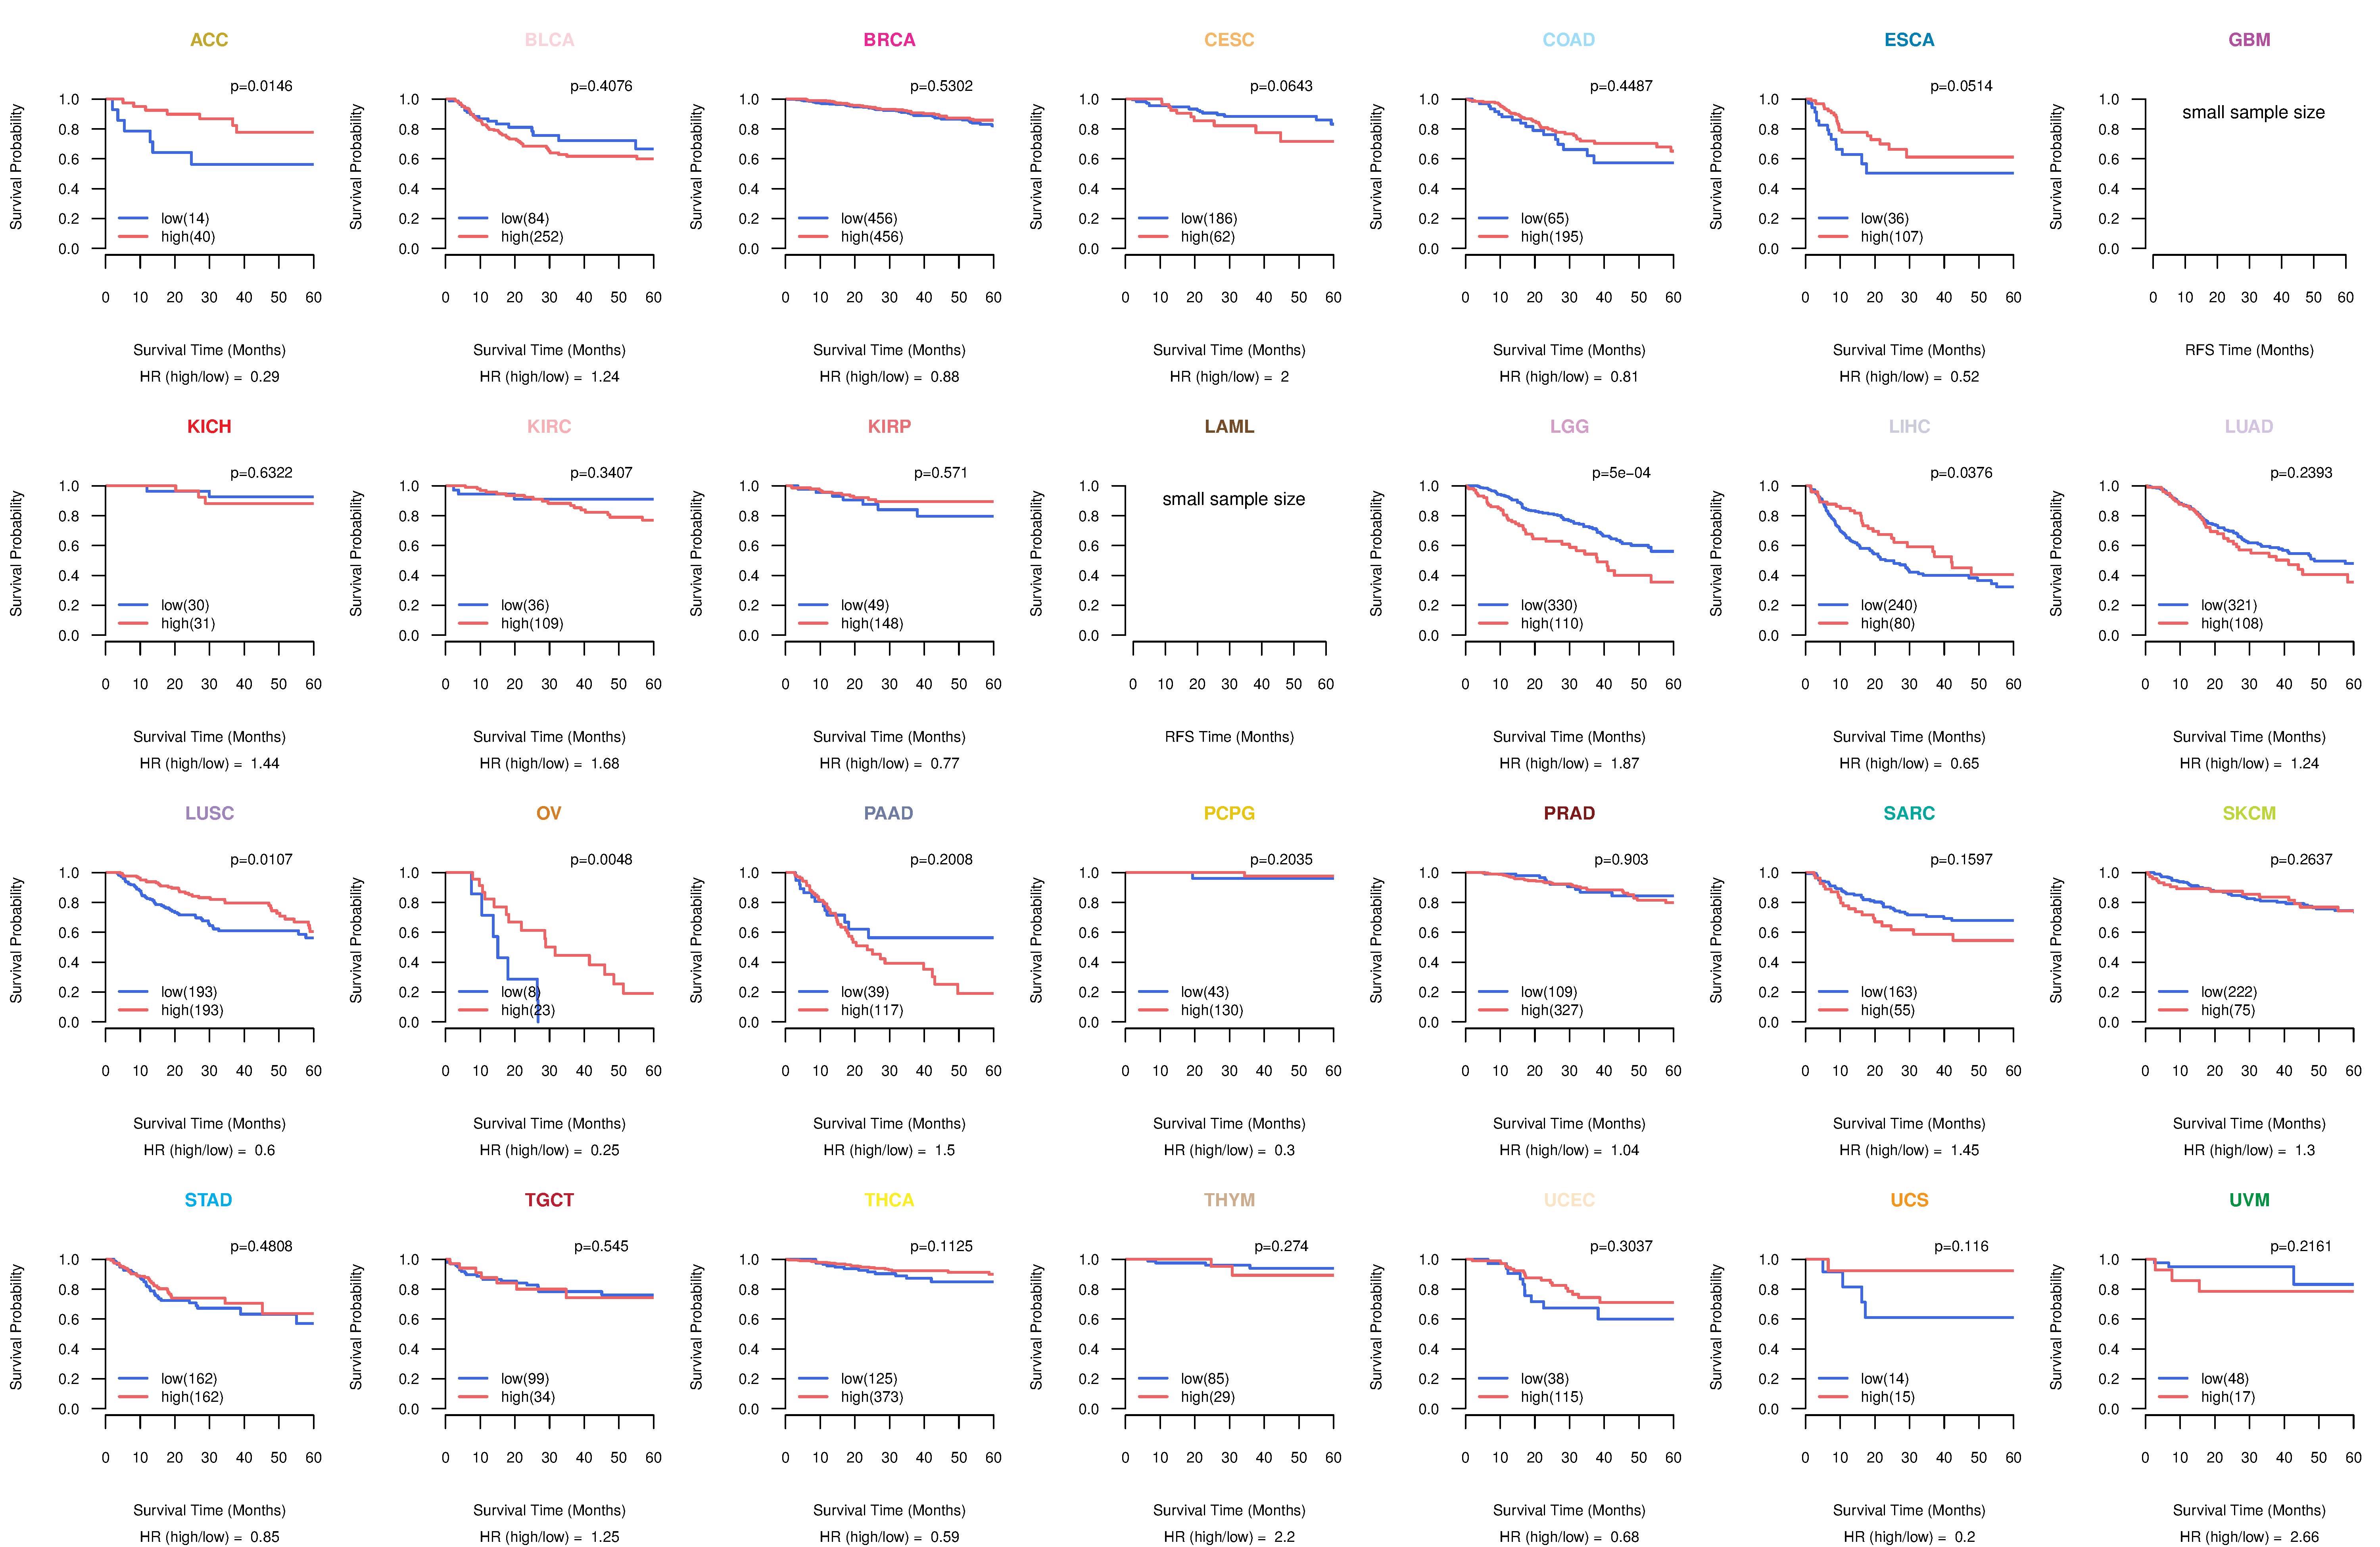
| Kaplan-Meier plots with logrank tests of overall survival (OS) using 28 cancer types (TCGA IlluminaHiSeq_RNASeqV2, pan-cancer normalized log2(norm_counts+1) data, version 2016-08-16) (TCGA clinicalMatrix, phenotype data, version 2016-04-27) * Click on the image to enlarge it in a new window. |
 |
| Kaplan-Meier plots with logrank test of relapse free survival (RFS) using 28 cancer types (TCGA IlluminaHiSeq_RNASeqV2, pan-cancer normalized log2(norm_counts+1) data, version 2016-08-16) (TCGA clinicalMatrix, phenotype data, version 2016-04-27) * Click on the image enlarge it in a new window. |
 |
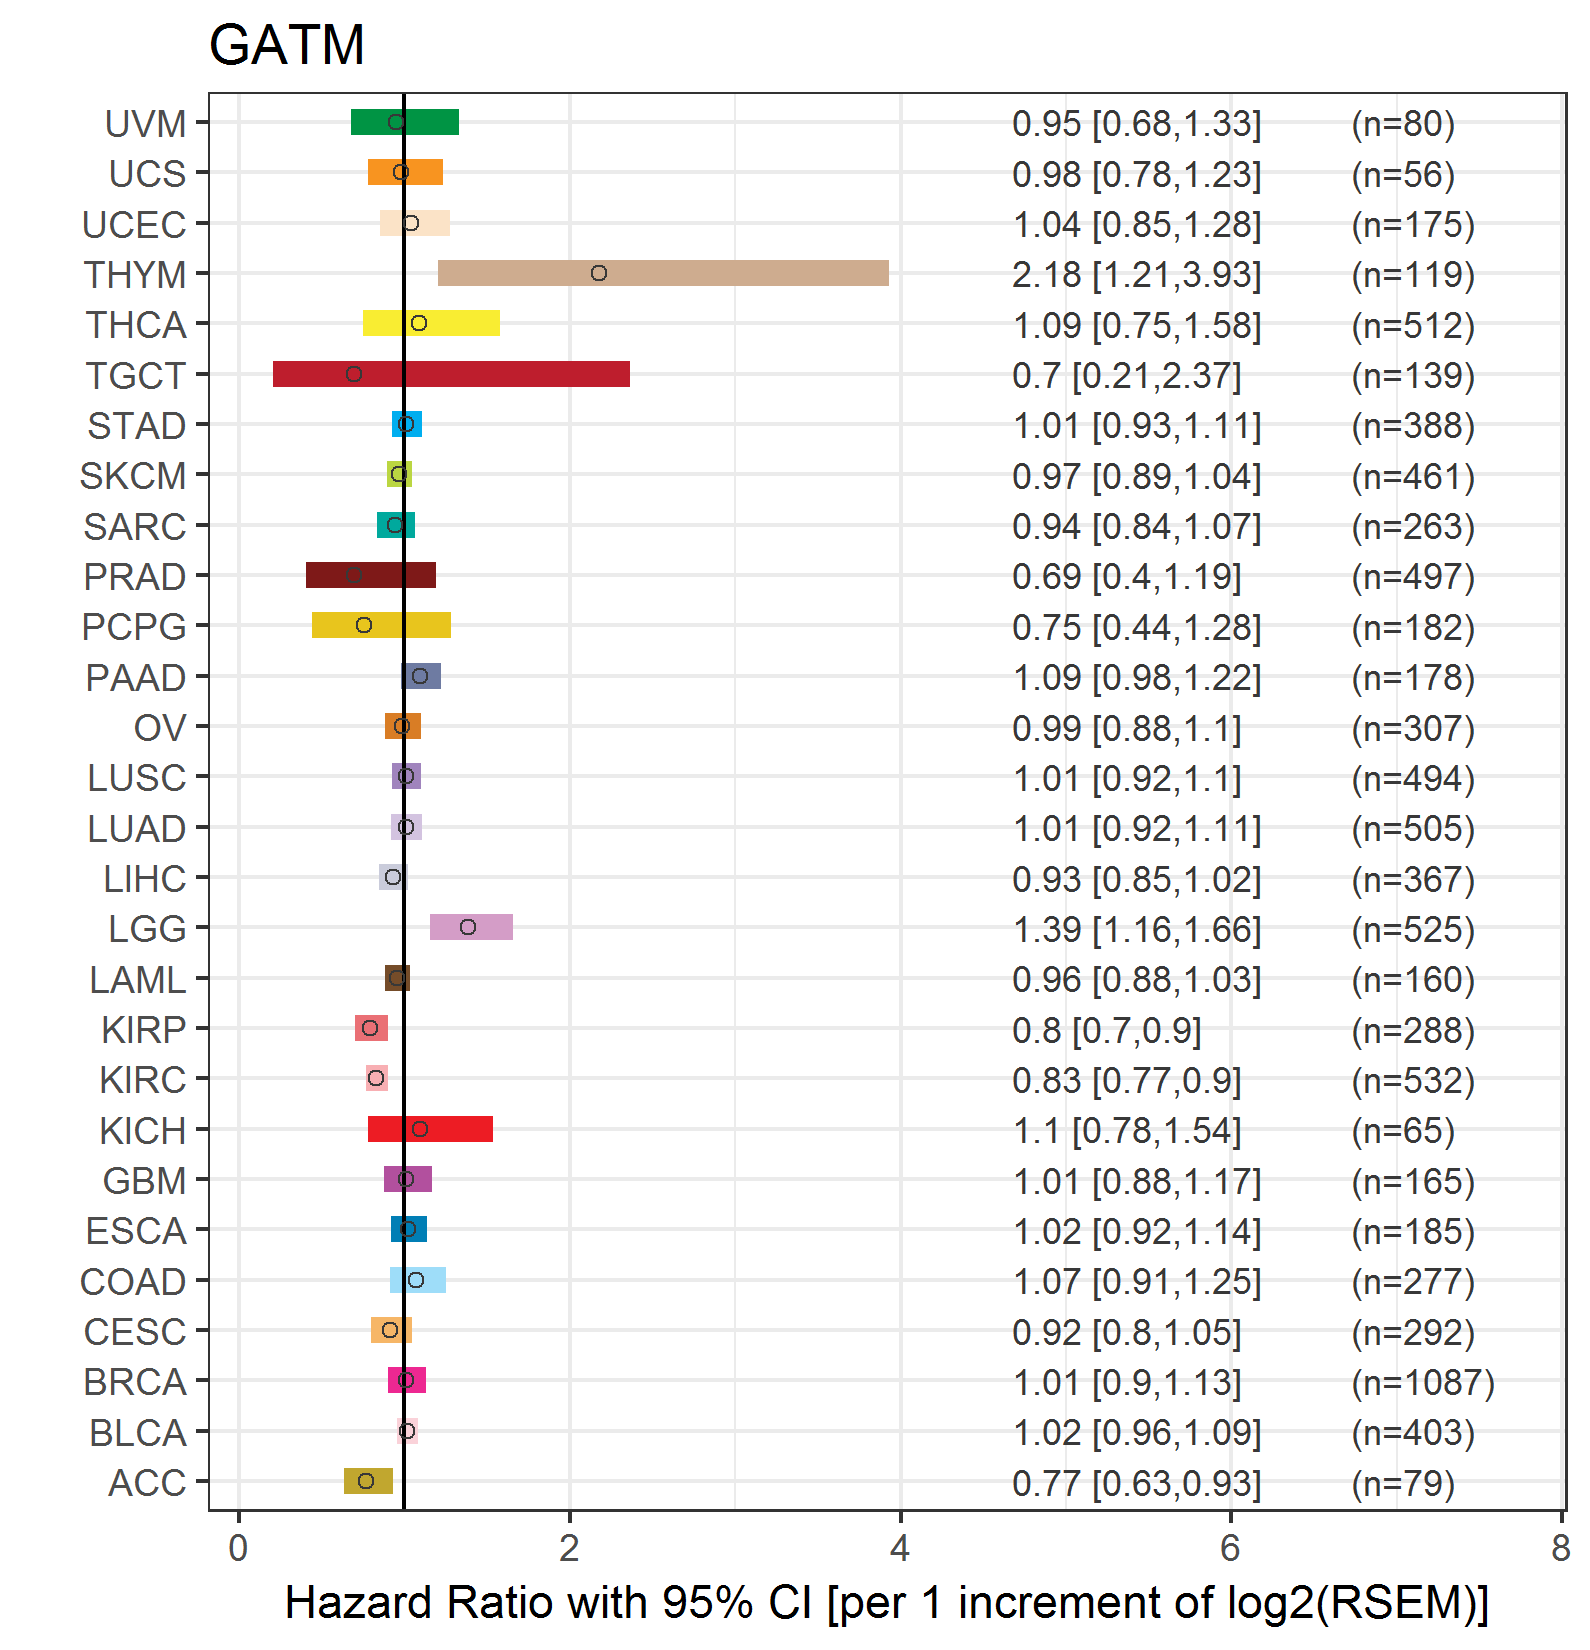
| Forest plot of Cox proportional hazard ratio (HR) and 95% CI of overall survival (OS) using 28 cancer types (TCGA IlluminaHiSeq_RNASeqV2, pan-cancer normalized log2(norm_counts+1) data, version 2016-08-16) (TCGA clinicalMatrix, phenotype data, version 2016-04-27) * Click on the image enlarge it in a new window. |
 |
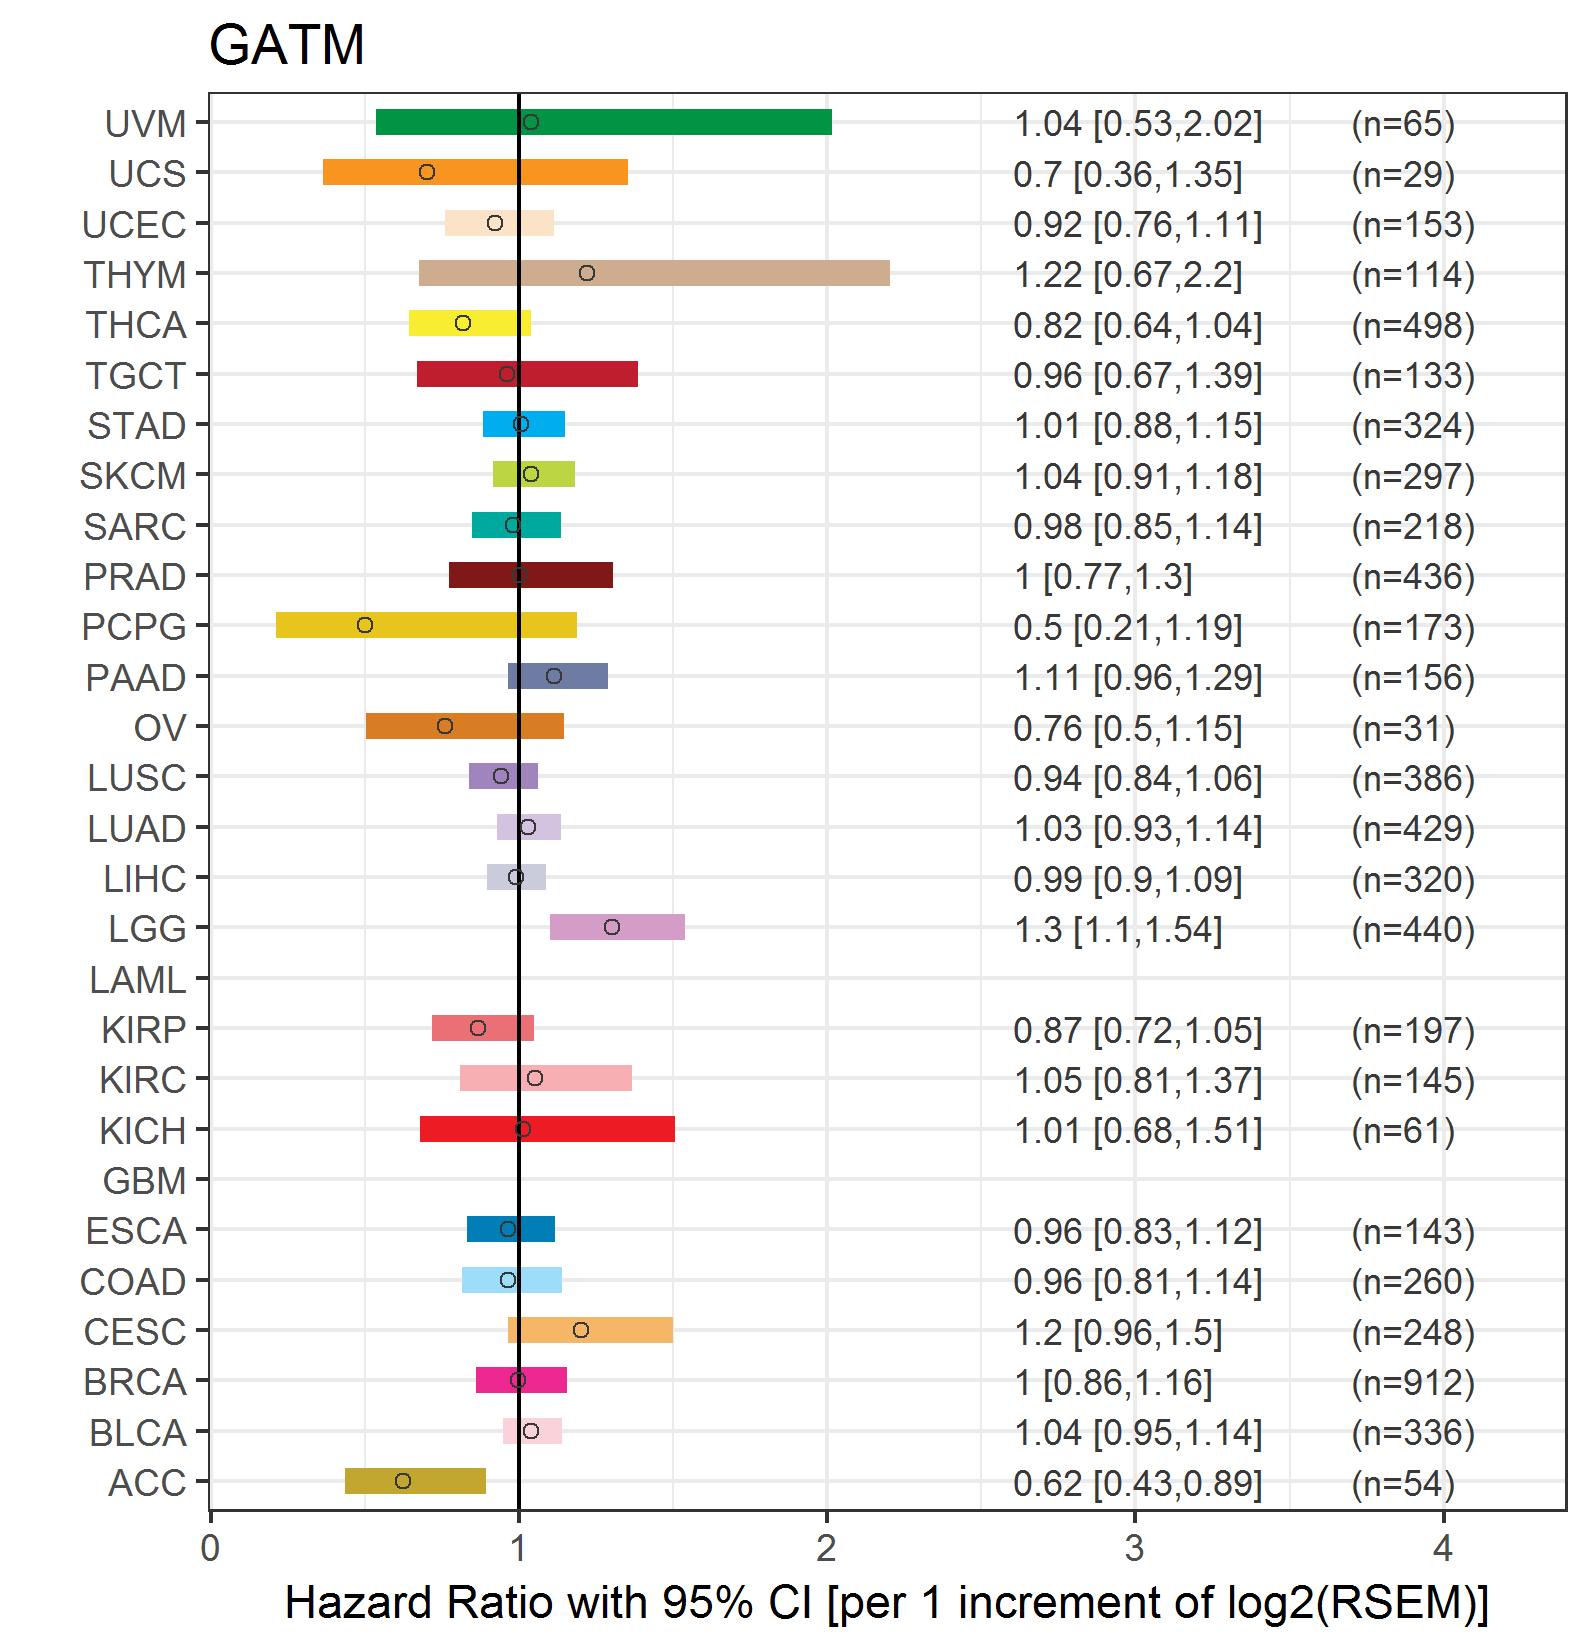
| Forest plot of Cox proportional hazard ratio (HR) and 95% CI of relapse free survival (RFS) using 28 cancer types (TCGA IlluminaHiSeq_RNASeqV2, pan-cancer normalized log2(norm_counts+1) data, version 2016-08-16) (TCGA clinicalMatrix, phenotype data, version 2016-04-27) * Click on the image enlarge it in a new window. |
 |
| Top |
| TissGeneClin for GATM |
| TissGeneDrug for GATM |
| Drug information targeting TissGene (DrugBank Version 5.0.6, 2017-04-01) |
| DrugBank ID | Drug name | Drug activity | Drug type | Drug status |
| DB00145 | Glycine | Small molecule | Approved|Nutraceutical|Vet_approved |
| Top |
| TissGeneDisease for GATM |
| Disease information associated with TissGene (DisGeNet, 2016-06-01) |
| Disease ID | Disease name | # pubmeds | Source |
| umls:C2675179 | Arginine:Glycine Amidinotransferase Deficiency | 3 | BeFree,CLINVAR,CTD_human,ORPHANET,UNIPROT |
| umls:C0026848 | Myopathy | 2 | BeFree |
| umls:C0007134 | Renal Cell Carcinoma | 1 | BeFree |
| umls:C0008312 | Primary biliary cirrhosis | 1 | BeFree |
| umls:C0018801 | Heart failure | 1 | BeFree,CTD_human |
| umls:C0018802 | Congestive heart failure | 1 | BeFree |
| umls:C0022658 | Kidney Diseases | 1 | CTD_human |
| umls:C0024667 | Animal Mammary Neoplasms | 1 | CTD_human |
| umls:C0024668 | Mammary Neoplasms, Experimental | 1 | CTD_human |
| umls:C0027540 | Necrosis | 1 | CTD_human |
| umls:C0151744 | Myocardial Ischemia | 1 | CTD_human |
| umls:C0376358 | Malignant neoplasm of prostate | 1 | BeFree |
| umls:C0574080 | Guanidinoacetate methyltransferase deficiency | 1 | BeFree |
| umls:C0600139 | Prostate carcinoma | 1 | BeFree |
| umls:C1845862 | Creatine deficiency, X-linked | 1 | BeFree |
| umls:C1853195 | Prostate Cancer, Hereditary, 7 | 1 | BeFree |
| umls:C2609414 | Acute kidney injury | 1 | RGD |
|
Copyright 2016-Present - The University of Texas Health Science Center at Houston (UTHealth) Web File Viewing | How to Report, Fraud, Waste and Abuse | State of Texas | Statewide Search | Texas Homeland Security | Site Policies |