 |
| |
| |
| |
| |
| |
| |
|

| TissGeneSummary for TSPAN16 |
 Gene summary Gene summary |
| Basic gene information | Gene symbol | TSPAN16 |
| Gene name | tetraspanin 16 | |
| Synonyms | TM-8|TM4-B|TM4SF16 | |
| Cytomap | UCSC genome browser: 19p13.2 | |
| Type of gene | protein-coding | |
| RefGenes | NM_001282509.1, NM_001282510.1,NM_012466.3,NR_104199.1, | |
| Description | tetraspanin TM4-Btetraspanin-16transmembrane 4 superfamily member 16tspan-16 | |
| Modification date | 20141207 | |
| dbXrefs | HGNC : HGNC | |
| Ensembl : ENSG00000130167 | ||
| HPRD : 18197 | ||
| Vega : OTTHUMG00000180833 | ||
| Protein | UniProt: go to UniProt's Cross Reference DB Table | |
| Expression | CleanEX: HS_TSPAN16 | |
| BioGPS: 26526 | ||
| Pathway | NCI Pathway Interaction Database: TSPAN16 | |
| KEGG: TSPAN16 | ||
| REACTOME: TSPAN16 | ||
| Pathway Commons: TSPAN16 | ||
| Context | iHOP: TSPAN16 | |
| ligand binding site mutation search in PubMed: TSPAN16 | ||
| UCL Cancer Institute: TSPAN16 | ||
| Assigned class in TissGDB* | C | |
| Included tissue-specific gene expression resources | HPA,GTEx | |
| Specific-tissues in normal samples (assigned by TissGDB using HPA, TiGER, and GTEx) | Testis | |
| Cancer types related to the specific-tissues in cancer samples (assigned by TissGDB using TCGA) | TGCT | |
| Reference showing the relevant tissue of TSPAN16 | ||
| Description by TissGene annotations | Fused withTSGene | |
| * Class A consists of genes with literature evidence and is part of the cTissGenes. Class B consists of only cTissGenes without additional evidence. The remaining genes belong to Class C. |
| Gene ontology having evidence of Inferred from Direct Assay (IDA) from Entrez |
| GO ID | GO term | PubMed ID |
| Top |
| TissGeneExp for TSPAN16 |
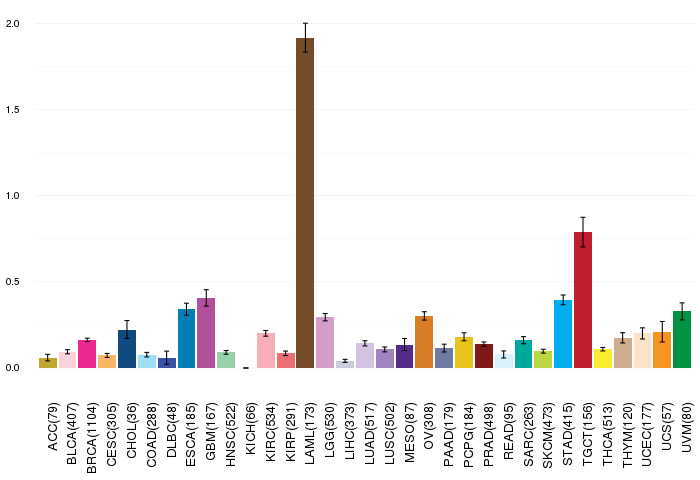
| Gene expressions across 28 cancer types (X-axis: cancer type and Y-axis: log2(norm_counts+1)) (TCGA IlluminaHiSeq_RNASeqV2, pan-cancer normalized log2(norm_counts+1) data, version 2016-08-16) |
 |
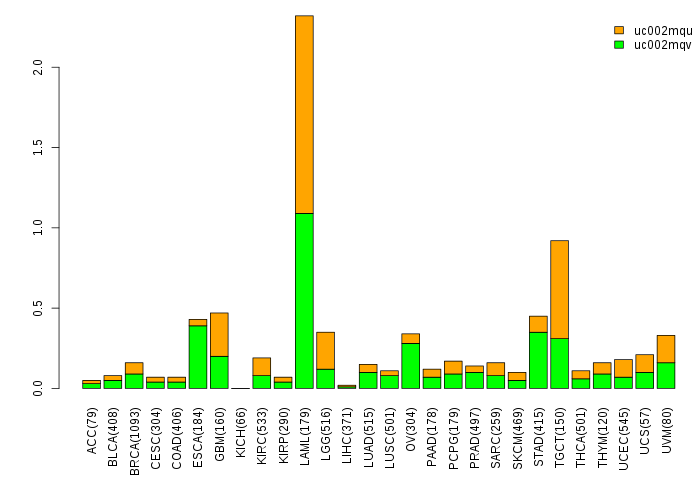
| Gene isoform expressions across 28 cancer types (X-axis: cancer type and Y-axis: log2(norm_counts+1)) (TCGA pan-cancer tcga_rsem_isoform_tpm, version 2016-09-01) |
 |
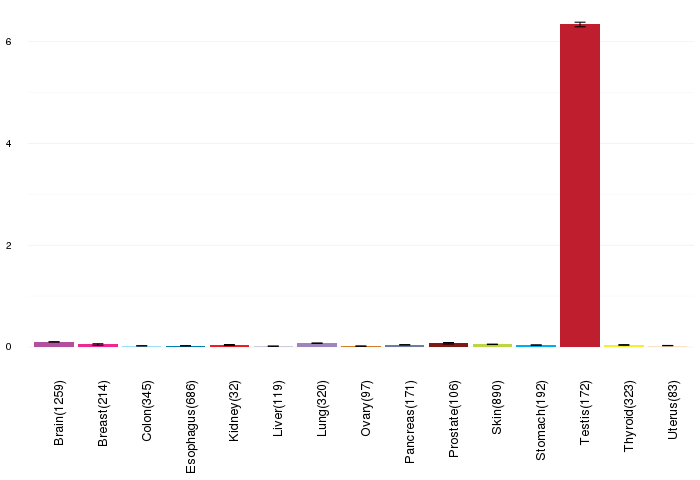
| Gene expressions across normal tissues of GTEx data (GTEx GTEx_Analysis_v6_RNA-seq_RNA-SeQCv1.1.8_gene_rpkm.gct) - Here, we shows the matched tissue types only among our 28 cancer types. |
 |
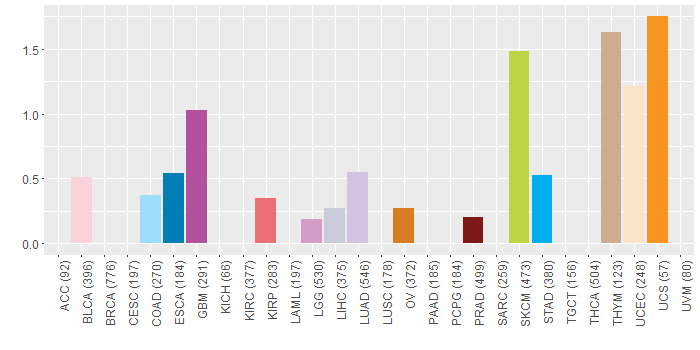
| Different expressions across 14 cancer types with more than 10 samples between matched tumors and normals (X-axis: cancer type and Y-axis: log2(norm_counts+1)) (TCGA IlluminaHiSeq_RNASeqV2, pan-cancer normalized log2(norm_counts+1) data, version 2016-08-16) |
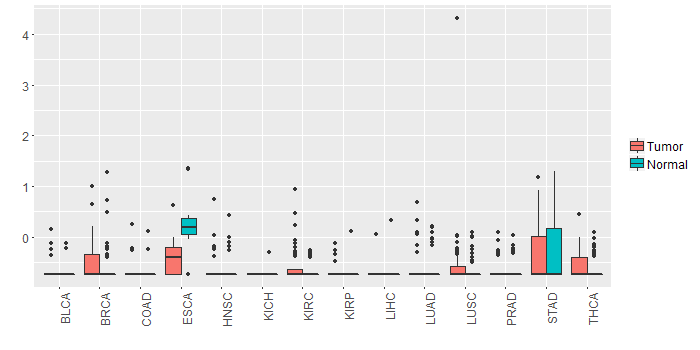 |
| - Significantly differentially expressed cancer types and information. (|Fold change|>1 and FDR<0.05) |
| Cancer type | Mean(exp) in tumor | Mean(exp) in matched normal | Log2FC | P-val. | FDR |
| Top |
| TissGene-miRNA for TSPAN16 |
| Significantly anti-correlated miRNAs of TissGene across 28 cancer types (Gene-miRNA relations from TargetScanHuman Relsease 7.1, Conserved_Site_Context_Scores.txt.zip, 06.01.2016) (TCGA IlluminaHiSeq_miRNASeq, log2(RPM+1) data, version 2016-11-21) (TCGA IlluminaHiSeq_RNASeqV2, log2(normalized_count+1) data, version 2016-08-16) (Spearman’s Rank Correlation (p-value<0.05 and coefficient<-0.25)) |
| Cancer type | miRNA id | miRNA accession | P-val. | Coeff. | # samples |
| Top |
| TissGeneMut for TSPAN16 |
| TissGeneSNV for TSPAN16 |
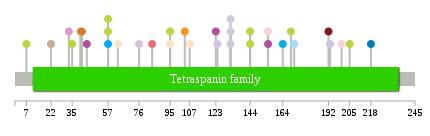
| nsSNV counts per each loci. Different colors of circles represent different cancer types. Circle size denotes number of samples. (TCGA somatic mutation (SNPs and small INDELs) data, version 2016-04-25) * Click on the image to enlarge it in a new window. |
 |
 |
| Somatic nucleotide variants of TissGene across 28 cancer types (X-axis: cancer type and Y-axis: % of mutated samples) The numbers in parentheses are numbers of samples with mutation (nsSNVs). (TCGA somatic mutation (SNPs and small INDELs) data, version 2016-04-25) |
 |
| - nsSNVs sorted by frequency. |
| AAchange | Cancer type | # samples |
| p.V57I | STAD | 1 |
| p.V95A | UCEC | 1 |
| p.H205Y | SKCM | 1 |
| p.S221R | HNSC | 1 |
| p.F124L | LUAD | 1 |
| p.V107L | UCEC | 1 |
| p.M169I | SKCM | 1 |
| p.P7S | SKCM | 1 |
| p.G164D | STAD | 1 |
| p.D192G | PRAD | 1 |
| p.R132S | LIHC | 1 |
| p.V57D | SKCM | 1 |
| p.T171M | COAD | 1 |
| p.G155W | BLCA | 1 |
| p.R132I | LIHC | 1 |
| p.R132X | LIHC | 1 |
| p.G33D | LGG | 1 |
| p.G35S | SKCM | 1 |
| p.A41V | OV | 1 |
| p.R84K | KIRP | 1 |
| p.Q200H | BLCA | 1 |
| p.A104V | UCS | 1 |
| p.L218P | ESCA | 1 |
| p.V22L | THYM | 1 |
| p.G58C | CHOL | 1 |
| p.V63L | UCEC | 1 |
| p.S16P | DLBC | 1 |
| p.W76C | LUAD | 1 |
| p.W144X | SKCM | 1 |
| p.G40E | THYM | 1 |
| p.G155R | GBM | 1 |
| p.V95L | SKCM | 1 |
| p.S185T | MESO | 1 |
| p.T44M | GBM | 1 |
| p.T123I | GBM | 1 |
| p.V57I | SKCM | 1 |
| p.V193M | LUAD | 1 |
| p.W144* | SKCM | 1 |
| Top |
| TissGeneCNV for TSPAN16 |
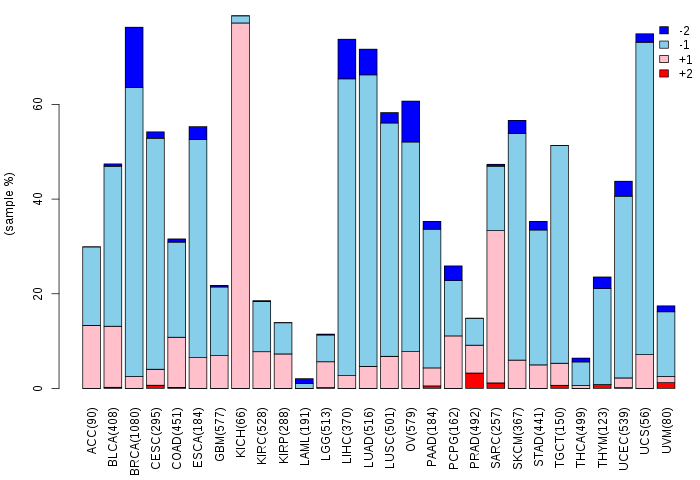
| Copy number variations of TissGene across 28 cancer types (X-axis: cancer type and Y-axis: % of CNV samples) (TCGA Gistic2_CopyNumber_Gistic2_all_data_by_genes, Gistic2 copy number data, version 2016-08-16) |
 |
| Top |
| TissGeneFusions for TSPAN16 |
| Fusion genes including TissGene (ChimerDB 3.0, 2016-12-01 and TCGA fusion Portal 2015-12-01) |
| Database | Src | Cancer type | Sample | Fusion gene | ORF | 5'-gene BP | 3'-gene BP |
| Chimerdb3.0 | ChiTaRs | NA | AF133424 | TSPAN16-HADH | chr19:11437672 | chr4:108940694 | |
| Chimerdb3.0 | ChiTaRs | NA | BG982427 | TSPAN16-TSPAN16 | chr19:11435280 | chr19:11434546 | |
| Chimerdb3.0 | ChiTaRs | NA | AL044228 | TSPAN16-EP300 | chr19:11435261 | chr22:41573606 | |
| Chimerdb3.0 | ChiTaRs | NA | BE008423 | TSPAN16-AHNAK | chr19:11433505 | chr11:62286790 |
| Top |
| TissGeneNet for TSPAN16 |
| Co-expressed gene networks based on protein-protein interaction data (CePIN) (TCGA IlluminaHiSeq_RNASeqV2, pan-cancer normalized log2(norm_counts+1) data, version 2016-08-16) (PINA2 ppi data) |
| Top |
| TissGeneProg for TSPAN16 |
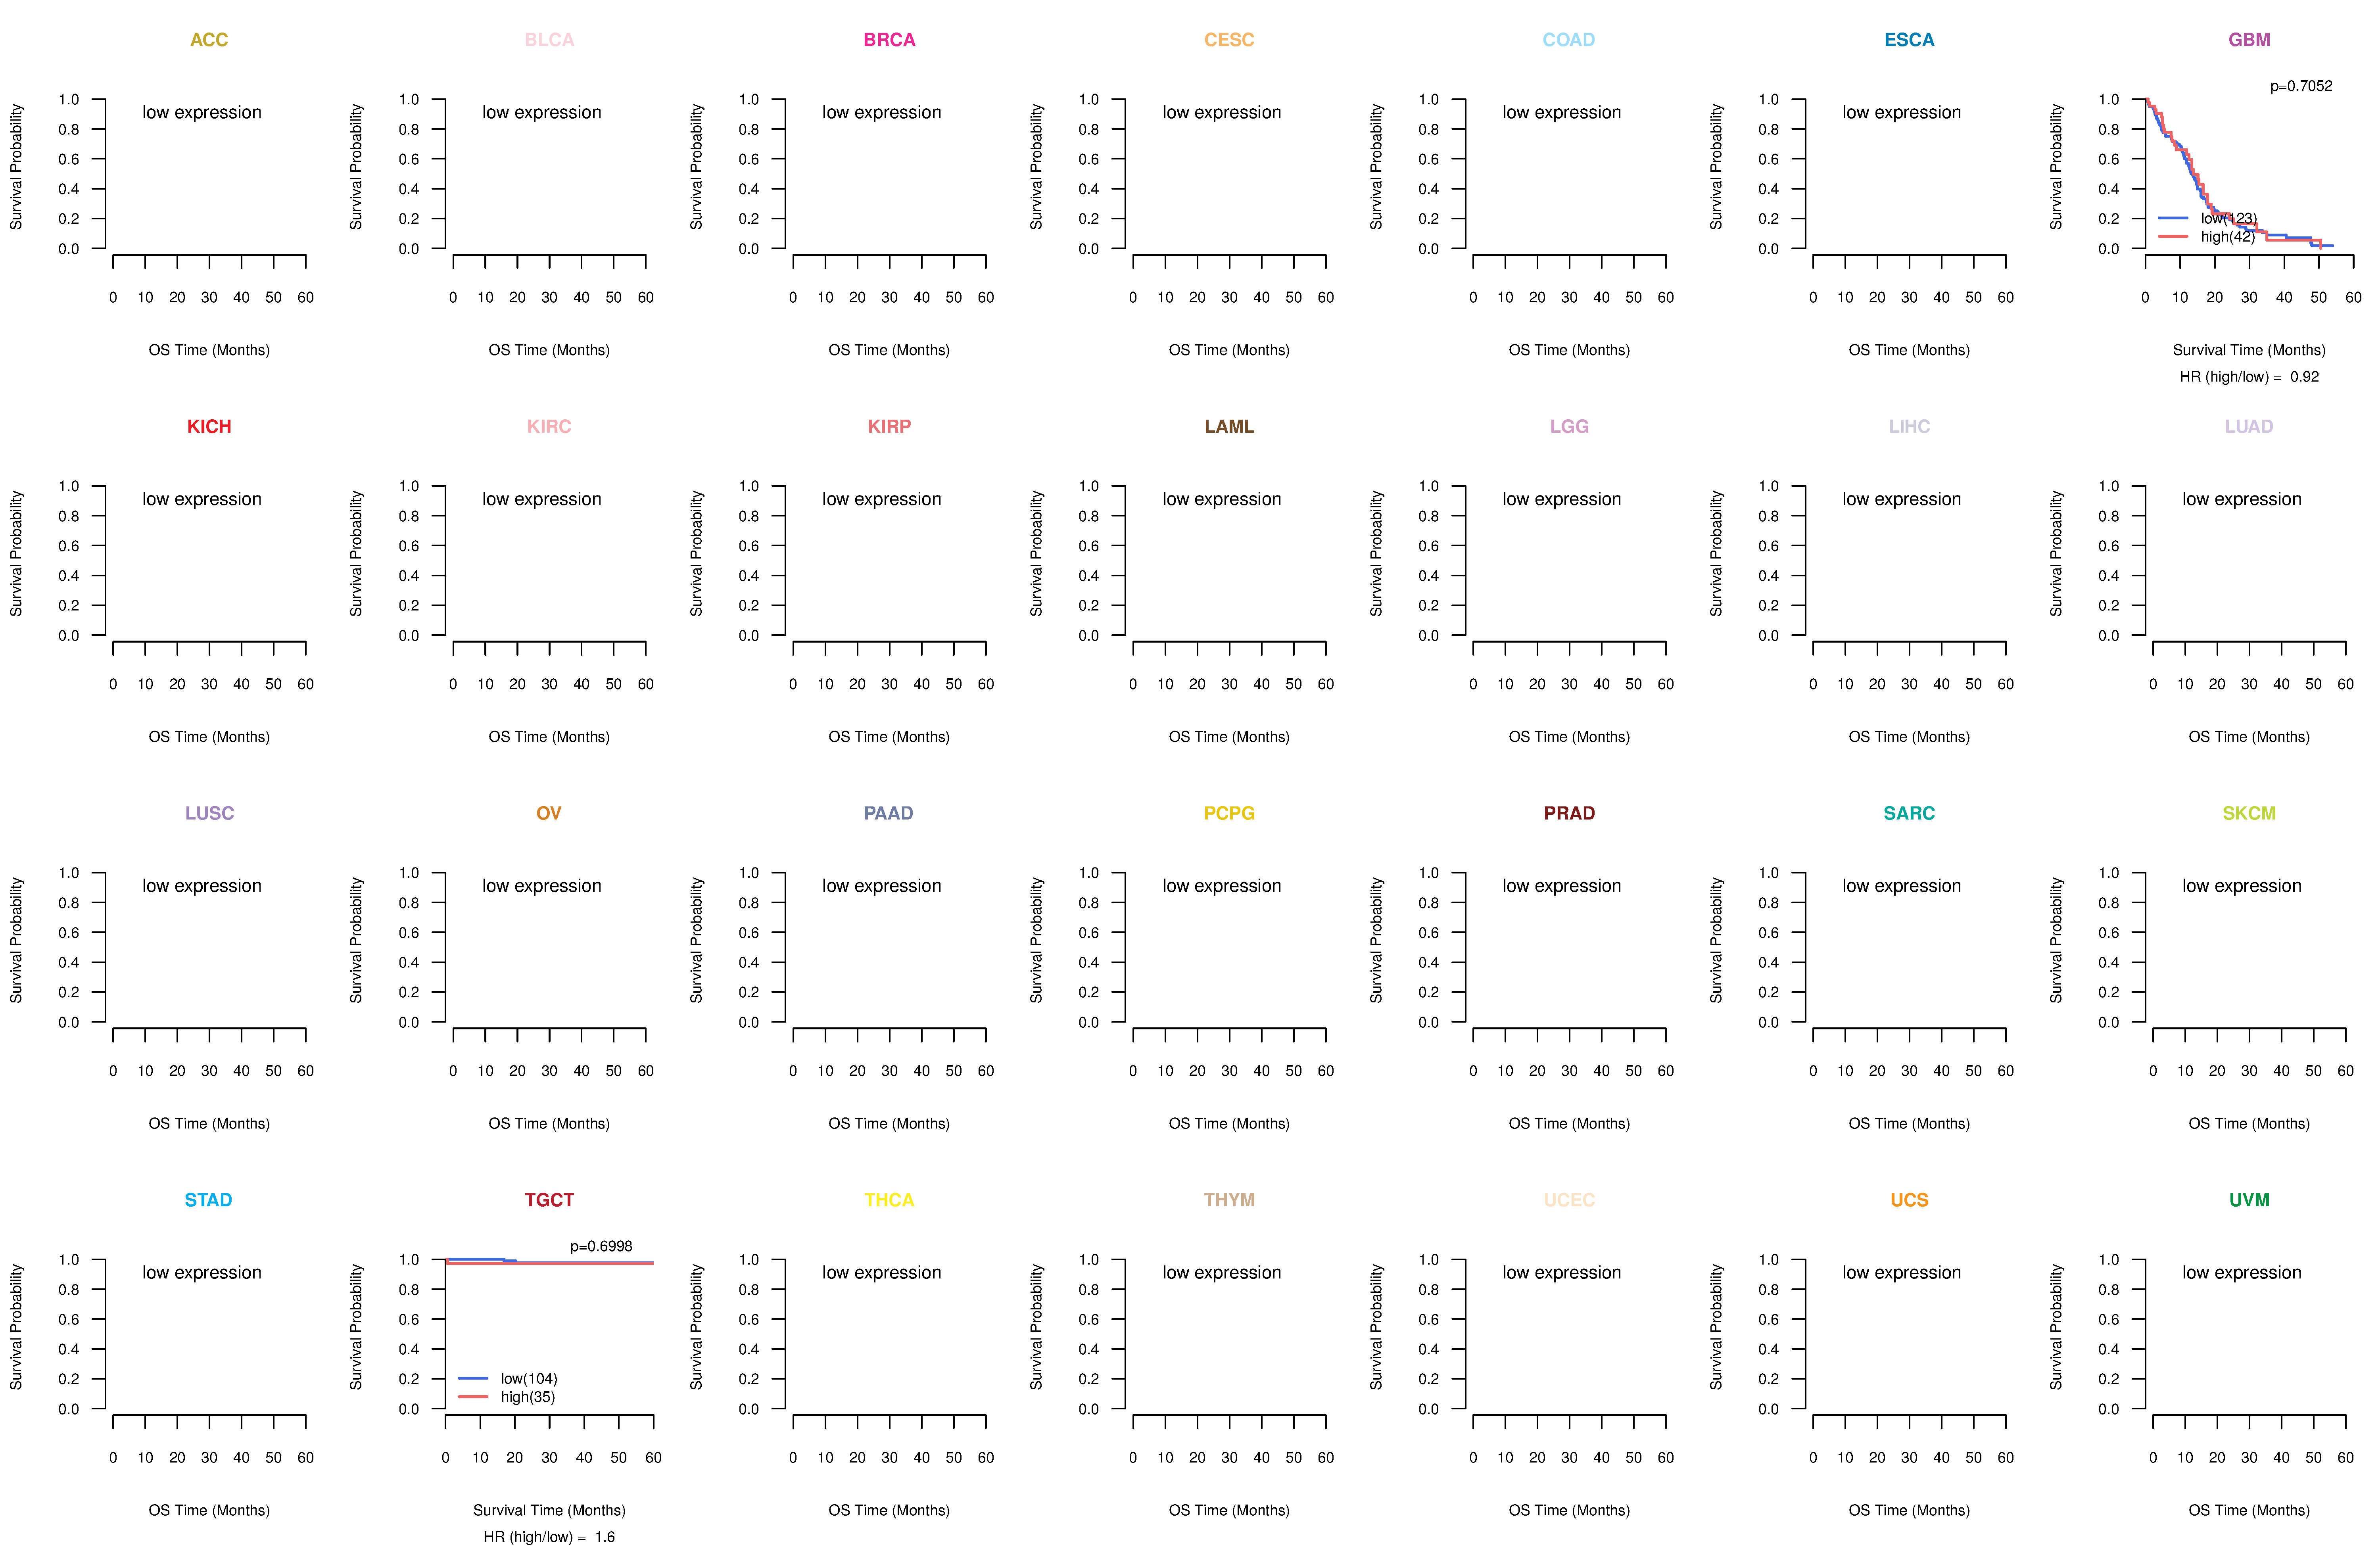
| Kaplan-Meier plots with logrank tests of overall survival (OS) using 28 cancer types (TCGA IlluminaHiSeq_RNASeqV2, pan-cancer normalized log2(norm_counts+1) data, version 2016-08-16) (TCGA clinicalMatrix, phenotype data, version 2016-04-27) * Click on the image to enlarge it in a new window. |
 |
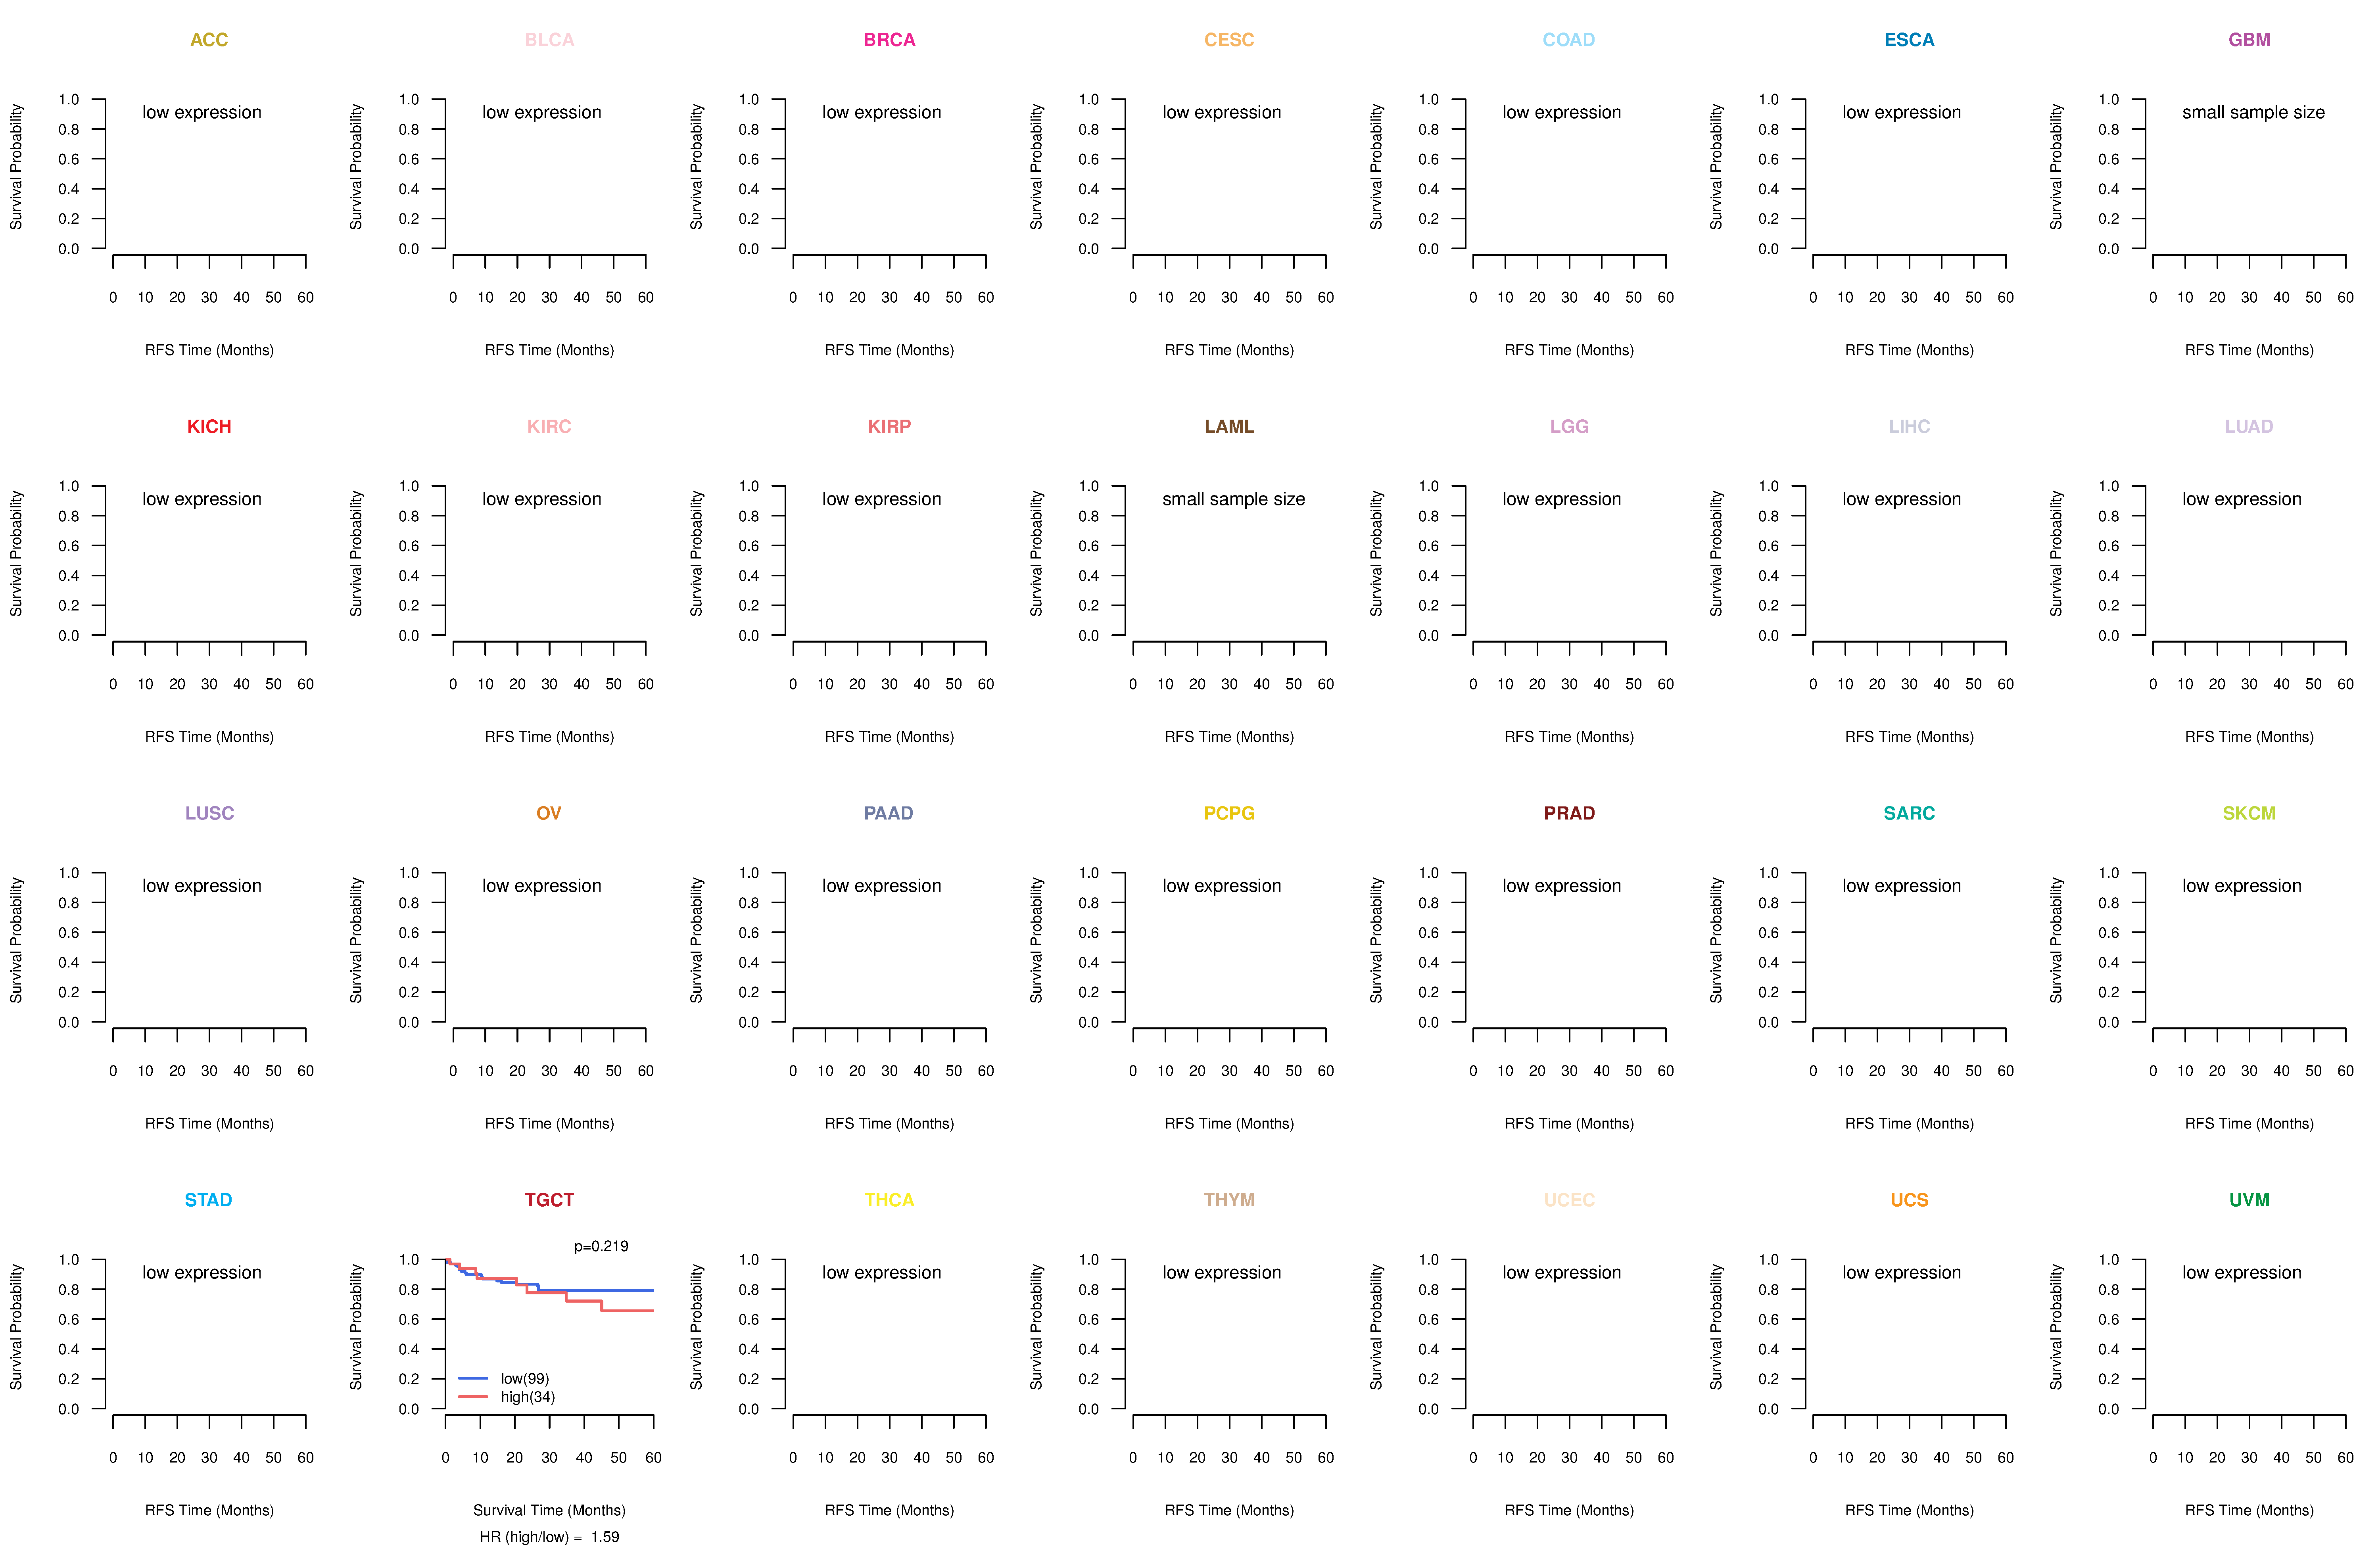
| Kaplan-Meier plots with logrank test of relapse free survival (RFS) using 28 cancer types (TCGA IlluminaHiSeq_RNASeqV2, pan-cancer normalized log2(norm_counts+1) data, version 2016-08-16) (TCGA clinicalMatrix, phenotype data, version 2016-04-27) * Click on the image enlarge it in a new window. |
 |
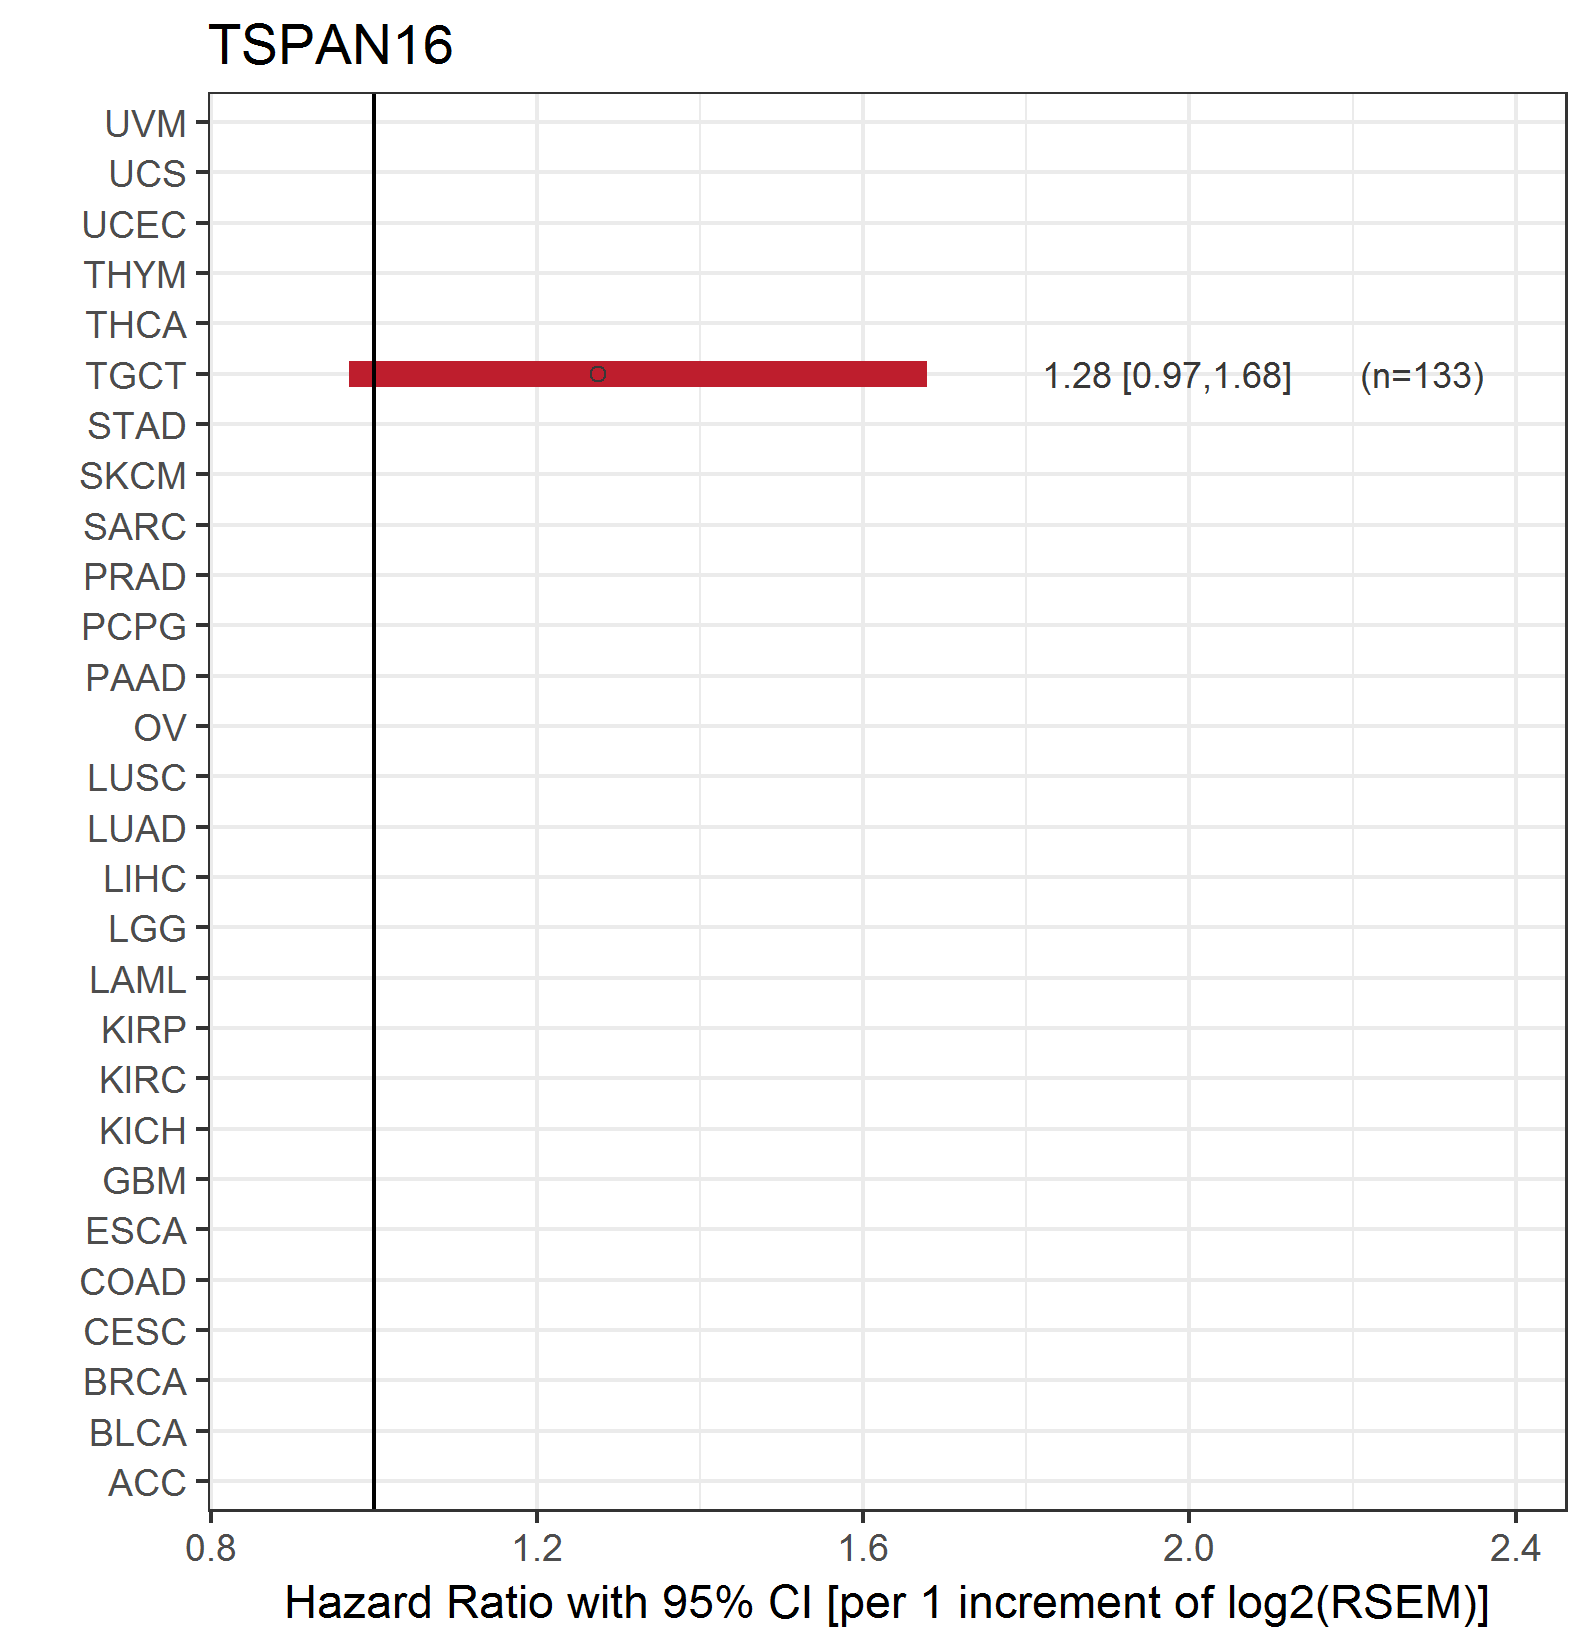
| Forest plot of Cox proportional hazard ratio (HR) and 95% CI of overall survival (OS) using 28 cancer types (TCGA IlluminaHiSeq_RNASeqV2, pan-cancer normalized log2(norm_counts+1) data, version 2016-08-16) (TCGA clinicalMatrix, phenotype data, version 2016-04-27) * Click on the image enlarge it in a new window. |
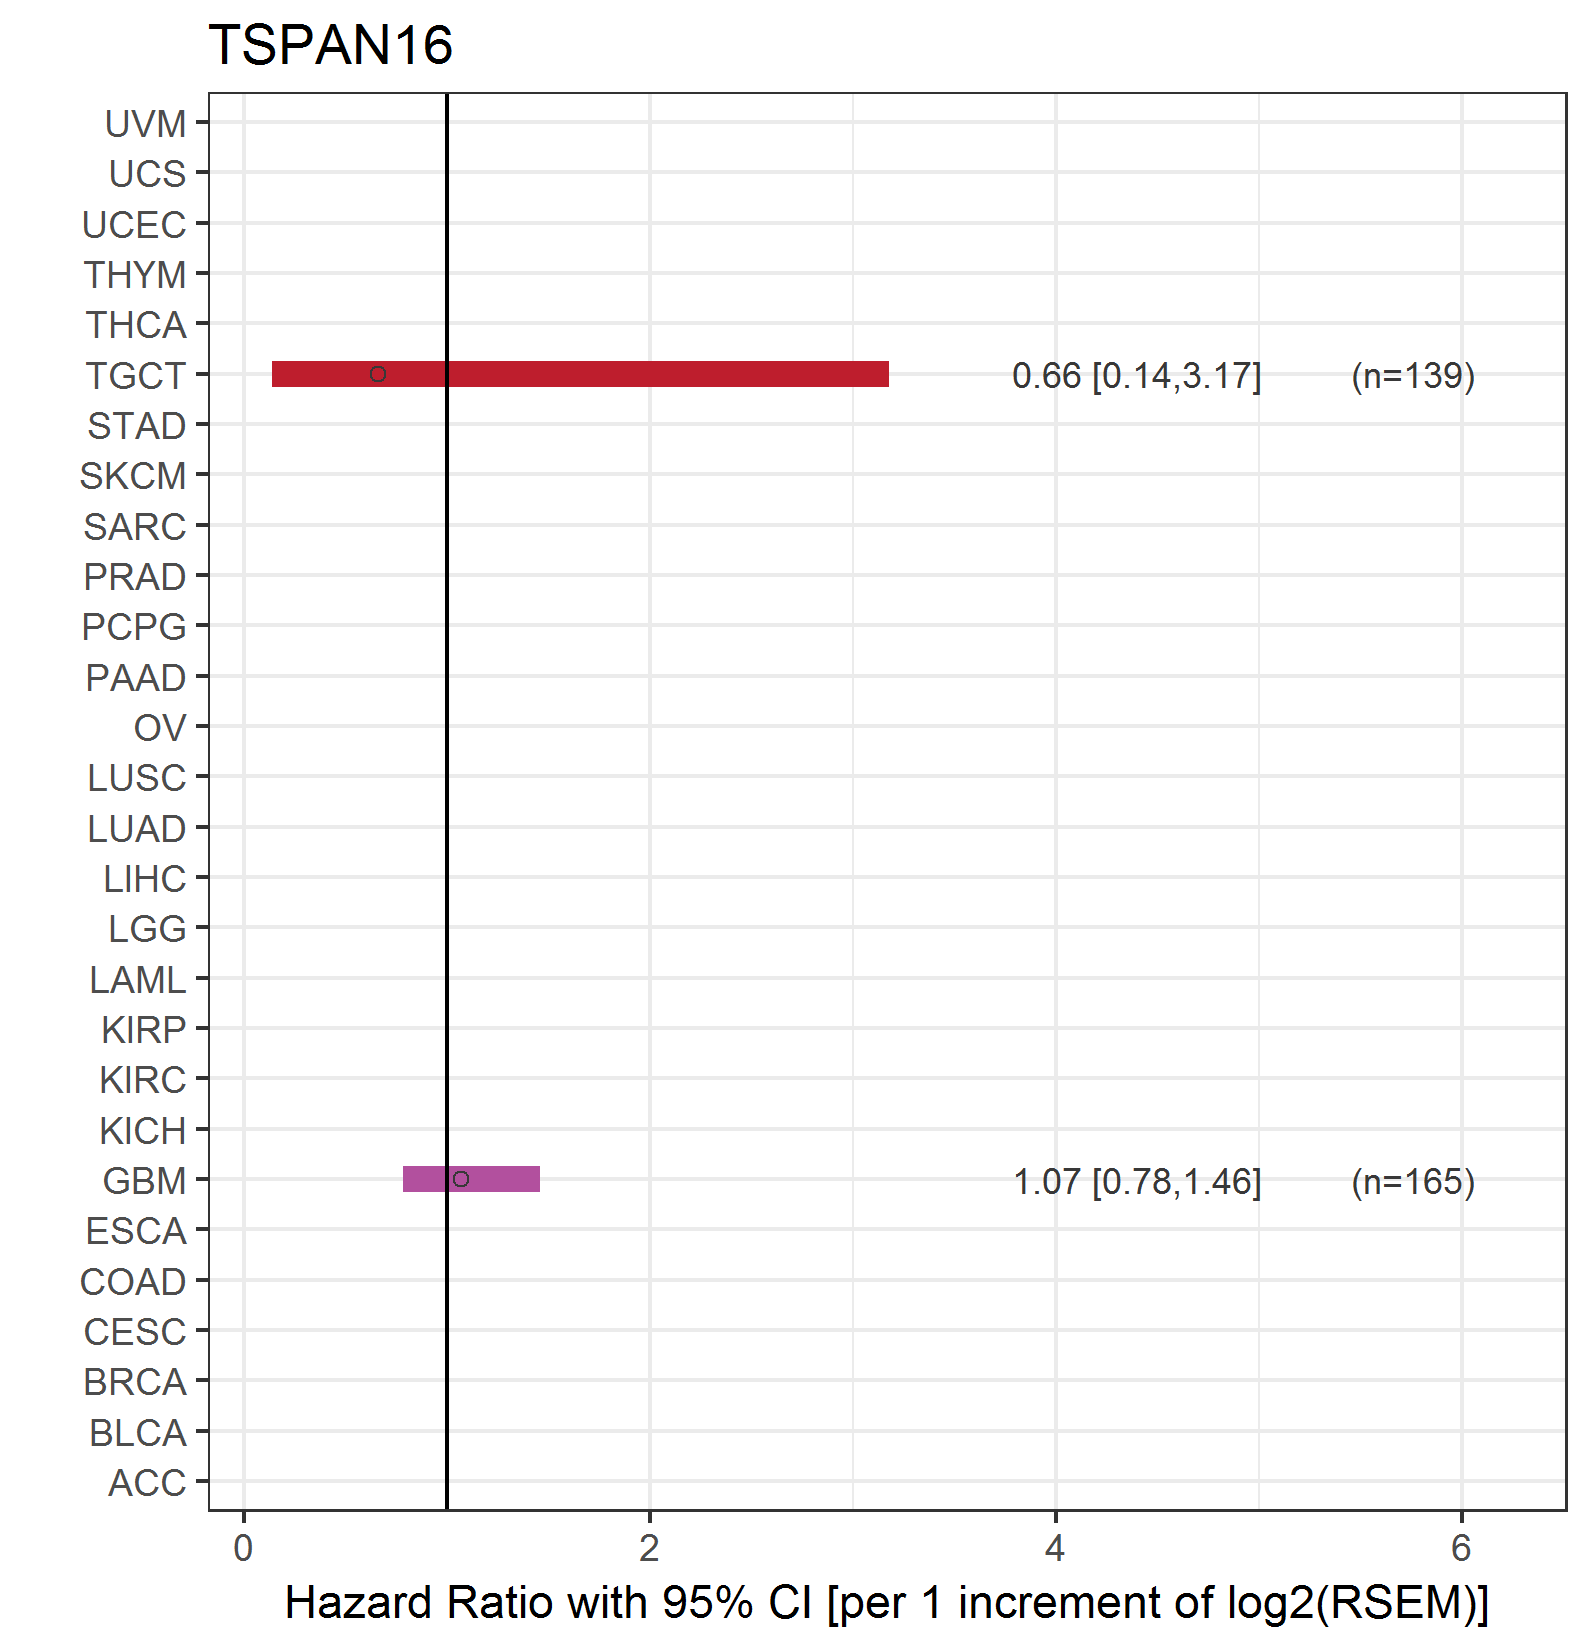 |
| Forest plot of Cox proportional hazard ratio (HR) and 95% CI of relapse free survival (RFS) using 28 cancer types (TCGA IlluminaHiSeq_RNASeqV2, pan-cancer normalized log2(norm_counts+1) data, version 2016-08-16) (TCGA clinicalMatrix, phenotype data, version 2016-04-27) * Click on the image enlarge it in a new window. |
 |
| Top |
| TissGeneClin for TSPAN16 |
| TissGeneDrug for TSPAN16 |
| Drug information targeting TissGene (DrugBank Version 5.0.6, 2017-04-01) |
| DrugBank ID | Drug name | Drug activity | Drug type | Drug status |
| Top |
| TissGeneDisease for TSPAN16 |
| Disease information associated with TissGene (DisGeNet, 2016-06-01) |
| Disease ID | Disease name | # pubmeds | Source |
| umls:C0023449 | Acute lymphocytic leukemia | 1 | BeFree |
| umls:C1961102 | Precursor Cell Lymphoblastic Leukemia Lymphoma | 1 | BeFree |
|
Copyright 2016-Present - The University of Texas Health Science Center at Houston (UTHealth) Web File Viewing | How to Report, Fraud, Waste and Abuse | State of Texas | Statewide Search | Texas Homeland Security | Site Policies |