 |
| |
| |
| |
| |
| |
| |
|

| TissGeneSummary for GDF2 |
 Gene summary Gene summary |
| Basic gene information | Gene symbol | GDF2 |
| Gene name | growth differentiation factor 2 | |
| Synonyms | BMP-9|BMP9|HHT5 | |
| Cytomap | UCSC genome browser: 10q11.22 | |
| Type of gene | protein-coding | |
| RefGenes | NM_016204.2, | |
| Description | GDF-2bone morphogenetic protein 9growth/differentiation factor 2 | |
| Modification date | 20141219 | |
| dbXrefs | MIM : 605120 | |
| HGNC : HGNC | ||
| Ensembl : ENSG00000263761 | ||
| HPRD : 05492 | ||
| Vega : OTTHUMG00000188320 | ||
| Protein | UniProt: go to UniProt's Cross Reference DB Table | |
| Expression | CleanEX: HS_GDF2 | |
| BioGPS: 2658 | ||
| Pathway | NCI Pathway Interaction Database: GDF2 | |
| KEGG: GDF2 | ||
| REACTOME: GDF2 | ||
| Pathway Commons: GDF2 | ||
| Context | iHOP: GDF2 | |
| ligand binding site mutation search in PubMed: GDF2 | ||
| UCL Cancer Institute: GDF2 | ||
| Assigned class in TissGDB* | C | |
| Included tissue-specific gene expression resources | HPA,GTEx | |
| Specific-tissues in normal samples (assigned by TissGDB using HPA, TiGER, and GTEx) | Liver | |
| Cancer types related to the specific-tissues in cancer samples (assigned by TissGDB using TCGA) | LIHC | |
| Reference showing the relevant tissue of GDF2 | ||
| Description by TissGene annotations | TissgsKTS | |
| * Class A consists of genes with literature evidence and is part of the cTissGenes. Class B consists of only cTissGenes without additional evidence. The remaining genes belong to Class C. |
| Gene ontology having evidence of Inferred from Direct Assay (IDA) from Entrez |
| GO ID | GO term | PubMed ID | GO:0001569 | patterning of blood vessels | 20406889 | GO:0001937 | negative regulation of endothelial cell proliferation | 20406889 | GO:0001938 | positive regulation of endothelial cell proliferation | 20406889 | GO:0010596 | negative regulation of endothelial cell migration | 17068149 | GO:0010862 | positive regulation of pathway-restricted SMAD protein phosphorylation | 17068149 | GO:0030308 | negative regulation of cell growth | 17068149 | GO:0030509 | BMP signaling pathway | 17068149 | GO:0032757 | positive regulation of interleukin-8 production | 19366699 | GO:0032924 | activin receptor signaling pathway | 17068149 | GO:0045766 | positive regulation of angiogenesis | 20406889 | GO:0045893 | positive regulation of transcription, DNA-templated | 17068149 | GO:0045944 | positive regulation of transcription from RNA polymerase II promoter | 19366699 | GO:0048514 | blood vessel morphogenesis | 20406889 | GO:0060389 | pathway-restricted SMAD protein phosphorylation | 17068149 | GO:0071773 | cellular response to BMP stimulus | 19366699 | GO:2000279 | negative regulation of DNA biosynthetic process | 19366699 | GO:0001569 | patterning of blood vessels | 20406889 | GO:0001937 | negative regulation of endothelial cell proliferation | 20406889 | GO:0001938 | positive regulation of endothelial cell proliferation | 20406889 | GO:0010596 | negative regulation of endothelial cell migration | 17068149 | GO:0010862 | positive regulation of pathway-restricted SMAD protein phosphorylation | 17068149 | GO:0030308 | negative regulation of cell growth | 17068149 | GO:0030509 | BMP signaling pathway | 17068149 | GO:0032757 | positive regulation of interleukin-8 production | 19366699 | GO:0032924 | activin receptor signaling pathway | 17068149 | GO:0045766 | positive regulation of angiogenesis | 20406889 | GO:0045893 | positive regulation of transcription, DNA-templated | 17068149 | GO:0045944 | positive regulation of transcription from RNA polymerase II promoter | 19366699 | GO:0048514 | blood vessel morphogenesis | 20406889 | GO:0060389 | pathway-restricted SMAD protein phosphorylation | 17068149 | GO:0071773 | cellular response to BMP stimulus | 19366699 | GO:2000279 | negative regulation of DNA biosynthetic process | 19366699 |
| Top |
| TissGeneExp for GDF2 |
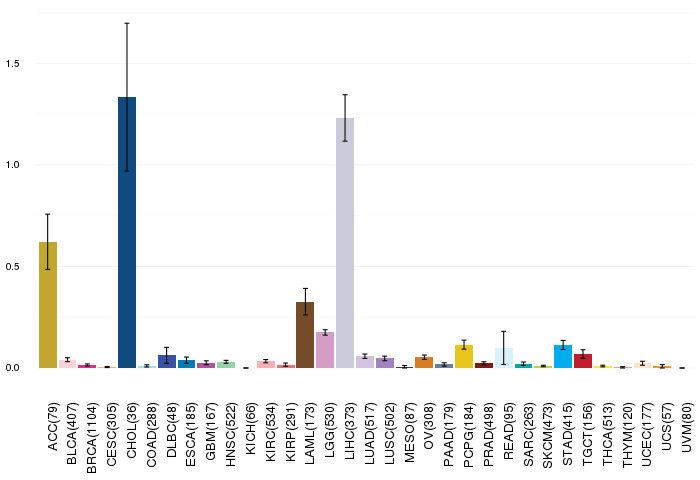
| Gene expressions across 28 cancer types (X-axis: cancer type and Y-axis: log2(norm_counts+1)) (TCGA IlluminaHiSeq_RNASeqV2, pan-cancer normalized log2(norm_counts+1) data, version 2016-08-16) |
 |
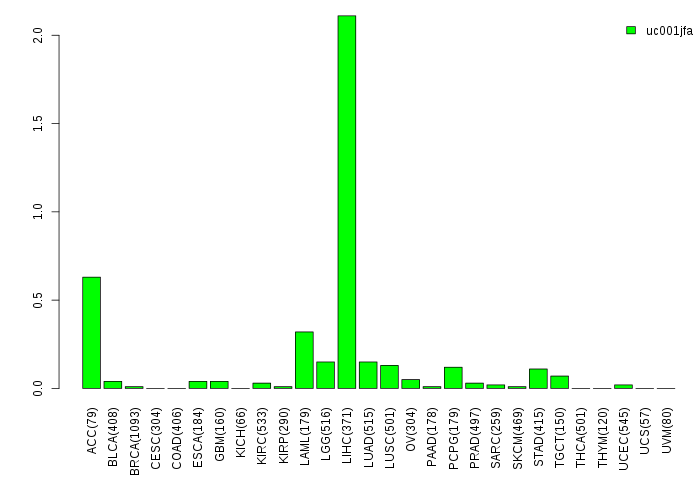
| Gene isoform expressions across 28 cancer types (X-axis: cancer type and Y-axis: log2(norm_counts+1)) (TCGA pan-cancer tcga_rsem_isoform_tpm, version 2016-09-01) |
 |
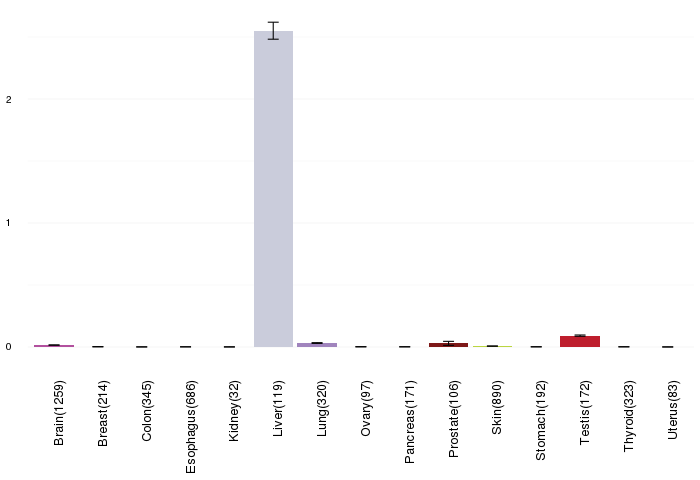
| Gene expressions across normal tissues of GTEx data (GTEx GTEx_Analysis_v6_RNA-seq_RNA-SeQCv1.1.8_gene_rpkm.gct) - Here, we shows the matched tissue types only among our 28 cancer types. |
 |
| Different expressions across 14 cancer types with more than 10 samples between matched tumors and normals (X-axis: cancer type and Y-axis: log2(norm_counts+1)) (TCGA IlluminaHiSeq_RNASeqV2, pan-cancer normalized log2(norm_counts+1) data, version 2016-08-16) |
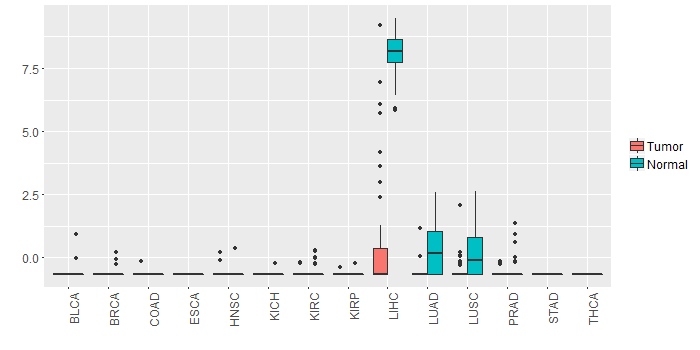 |
| - Significantly differentially expressed cancer types and information. (|Fold change|>1 and FDR<0.05) |
| Cancer type | Mean(exp) in tumor | Mean(exp) in matched normal | Log2FC | P-val. | FDR |
| LIHC | 0.480071361 | 8.117367361 | -7.637296 | 8.21E-31 | 9.12E-28 |
| Top |
| TissGene-miRNA for GDF2 |
| Significantly anti-correlated miRNAs of TissGene across 28 cancer types (Gene-miRNA relations from TargetScanHuman Relsease 7.1, Conserved_Site_Context_Scores.txt.zip, 06.01.2016) (TCGA IlluminaHiSeq_miRNASeq, log2(RPM+1) data, version 2016-11-21) (TCGA IlluminaHiSeq_RNASeqV2, log2(normalized_count+1) data, version 2016-08-16) (Spearman’s Rank Correlation (p-value<0.05 and coefficient<-0.25)) |
| Cancer type | miRNA id | miRNA accession | P-val. | Coeff. | # samples |
| Top |
| TissGeneMut for GDF2 |
| TissGeneSNV for GDF2 |
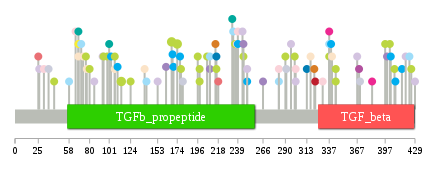
| nsSNV counts per each loci. Different colors of circles represent different cancer types. Circle size denotes number of samples. (TCGA somatic mutation (SNPs and small INDELs) data, version 2016-04-25) * Click on the image to enlarge it in a new window. |
 |
 |
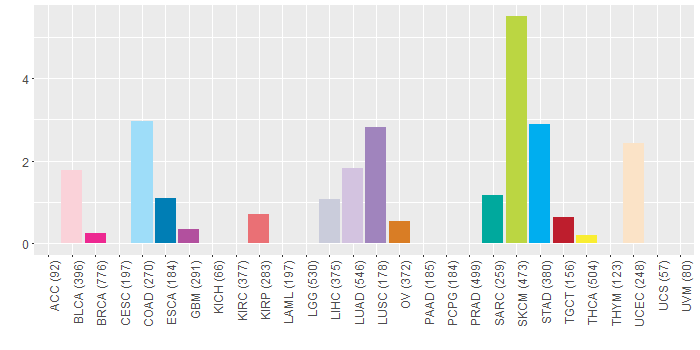
| Somatic nucleotide variants of TissGene across 28 cancer types (X-axis: cancer type and Y-axis: % of mutated samples) The numbers in parentheses are numbers of samples with mutation (nsSNVs). (TCGA somatic mutation (SNPs and small INDELs) data, version 2016-04-25) |
 |
| - nsSNVs sorted by frequency. |
| AAchange | Cancer type | # samples |
| p.G168E | SKCM | 2 |
| p.D174N | SKCM | 2 |
| p.M114I | SKCM | 2 |
| p.P370L | LIHC | 1 |
| p.T330S | BLCA | 1 |
| p.Q198X | SKCM | 1 |
| p.P245S | LUSC | 1 |
| p.S77L | UCEC | 1 |
| p.T239M | STAD | 1 |
| p.R317Q | UCEC | 1 |
| p.T103M | STAD | 1 |
| p.K383N | BRCA | 1 |
| p.K415R | STAD | 1 |
| p.R216W | SKCM | 1 |
| p.S73G | UCEC | 1 |
| p.V423M | COAD | 1 |
| p.E337K | SKCM | 1 |
| p.V215D | OV | 1 |
| p.R68C | UCEC | 1 |
| p.V283M | BLCA | 1 |
| p.R216Q | ESCA | 1 |
| p.Q26L | LUAD | 1 |
| p.G340D | UCEC | 1 |
| p.R68C | HNSC | 1 |
| p.D407N | SKCM | 1 |
| p.V244I | LUAD | 1 |
| p.G31W | BLCA | 1 |
| p.Q198* | SKCM | 1 |
| p.E337K | COAD | 1 |
| p.D238N | BLCA | 1 |
| p.R68C | SARC | 1 |
| p.S312L | HNSC | 1 |
| p.S399R | LUSC | 1 |
| p.K266R | LUSC | 1 |
| p.D218N | KIRP | 1 |
| p.T313S | ESCA | 1 |
| p.G236S | SKCM | 1 |
| p.G296C | LUAD | 1 |
| p.E124K | SKCM | 1 |
| p.L25P | KIRP | 1 |
| p.D177G | STAD | 1 |
| p.E301K | BLCA | 1 |
| p.K397N | SKCM | 1 |
| p.H233Y | SARC | 1 |
| p.D99N | SKCM | 1 |
| p.A321G | OV | 1 |
| p.N94K | LUAD | 1 |
| p.R234M | COAD | 1 |
| p.N107D | UCEC | 1 |
| p.D177N | HNSC | 1 |
| p.G322R | TGCT | 1 |
| p.F58L | COAD | 1 |
| p.T369M | GBM | 1 |
| p.G291C | LIHC | 1 |
| p.W344X | SKCM | 1 |
| p.I139V | UCEC | 1 |
| p.D65H | BLCA | 1 |
| p.E337K | BRCA | 1 |
| p.T239M | BLCA | 1 |
| p.S402F | SKCM | 1 |
| p.R249G | STAD | 1 |
| p.R249T | LUAD | 1 |
| p.W344* | SKCM | 1 |
| p.R95K | SKCM | 1 |
| p.R141M | COAD | 1 |
| p.S209R | LUSC | 1 |
| p.I339T | STAD | 1 |
| p.S209G | COAD | 1 |
| p.E419K | LUAD | 1 |
| p.E301Q | LUAD | 1 |
| p.R429T | LUAD | 1 |
| p.E206K | SKCM | 1 |
| p.S169I | STAD | 1 |
| p.R110W | STAD | 1 |
| p.S101L | SARC | 1 |
| p.G178E | SKCM | 1 |
| p.P245S | SKCM | 1 |
| p.G42R | SKCM | 1 |
| p.R68H | THCA | 1 |
| p.E425V | SKCM | 1 |
| p.V170M | STAD | 1 |
| p.D408G | STAD | 1 |
| p.D196N | SKCM | 1 |
| p.D180G | LIHC | 1 |
| p.H300D | SKCM | 1 |
| p.Y153C | LUAD | 1 |
| p.N107S | SKCM | 1 |
| p.P76S | SKCM | 1 |
| p.P162T | LUSC | 1 |
| p.V283M | COAD | 1 |
| p.N71D | COAD | 1 |
| p.V215A | HNSC | 1 |
| p.N36D | LIHC | 1 |
| p.D367Y | LUAD | 1 |
| p.V403I | STAD | 1 |
| p.K80N | SKCM | 1 |
| p.D290H | SKCM | 1 |
| p.P85L | LUAD | 1 |
| Top |
| TissGeneCNV for GDF2 |
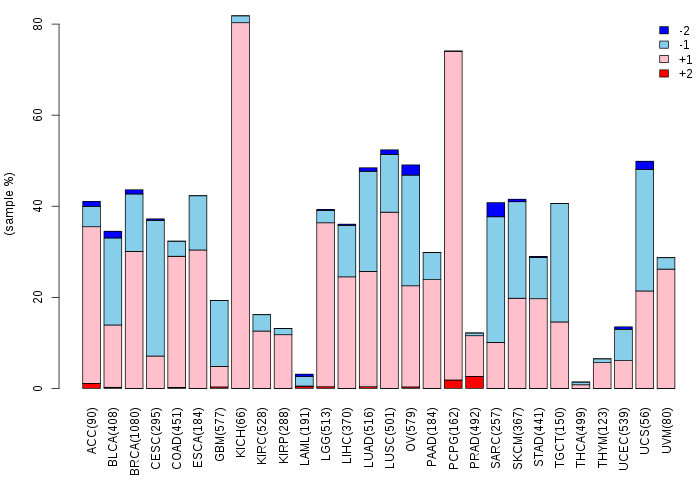
| Copy number variations of TissGene across 28 cancer types (X-axis: cancer type and Y-axis: % of CNV samples) (TCGA Gistic2_CopyNumber_Gistic2_all_data_by_genes, Gistic2 copy number data, version 2016-08-16) |
 |
| Top |
| TissGeneFusions for GDF2 |
| Fusion genes including TissGene (ChimerDB 3.0, 2016-12-01 and TCGA fusion Portal 2015-12-01) |
| Database | Src | Cancer type | Sample | Fusion gene | ORF | 5'-gene BP | 3'-gene BP |
| Top |
| TissGeneNet for GDF2 |
| Co-expressed gene networks based on protein-protein interaction data (CePIN) (TCGA IlluminaHiSeq_RNASeqV2, pan-cancer normalized log2(norm_counts+1) data, version 2016-08-16) (PINA2 ppi data) |
| Top |
| TissGeneProg for GDF2 |
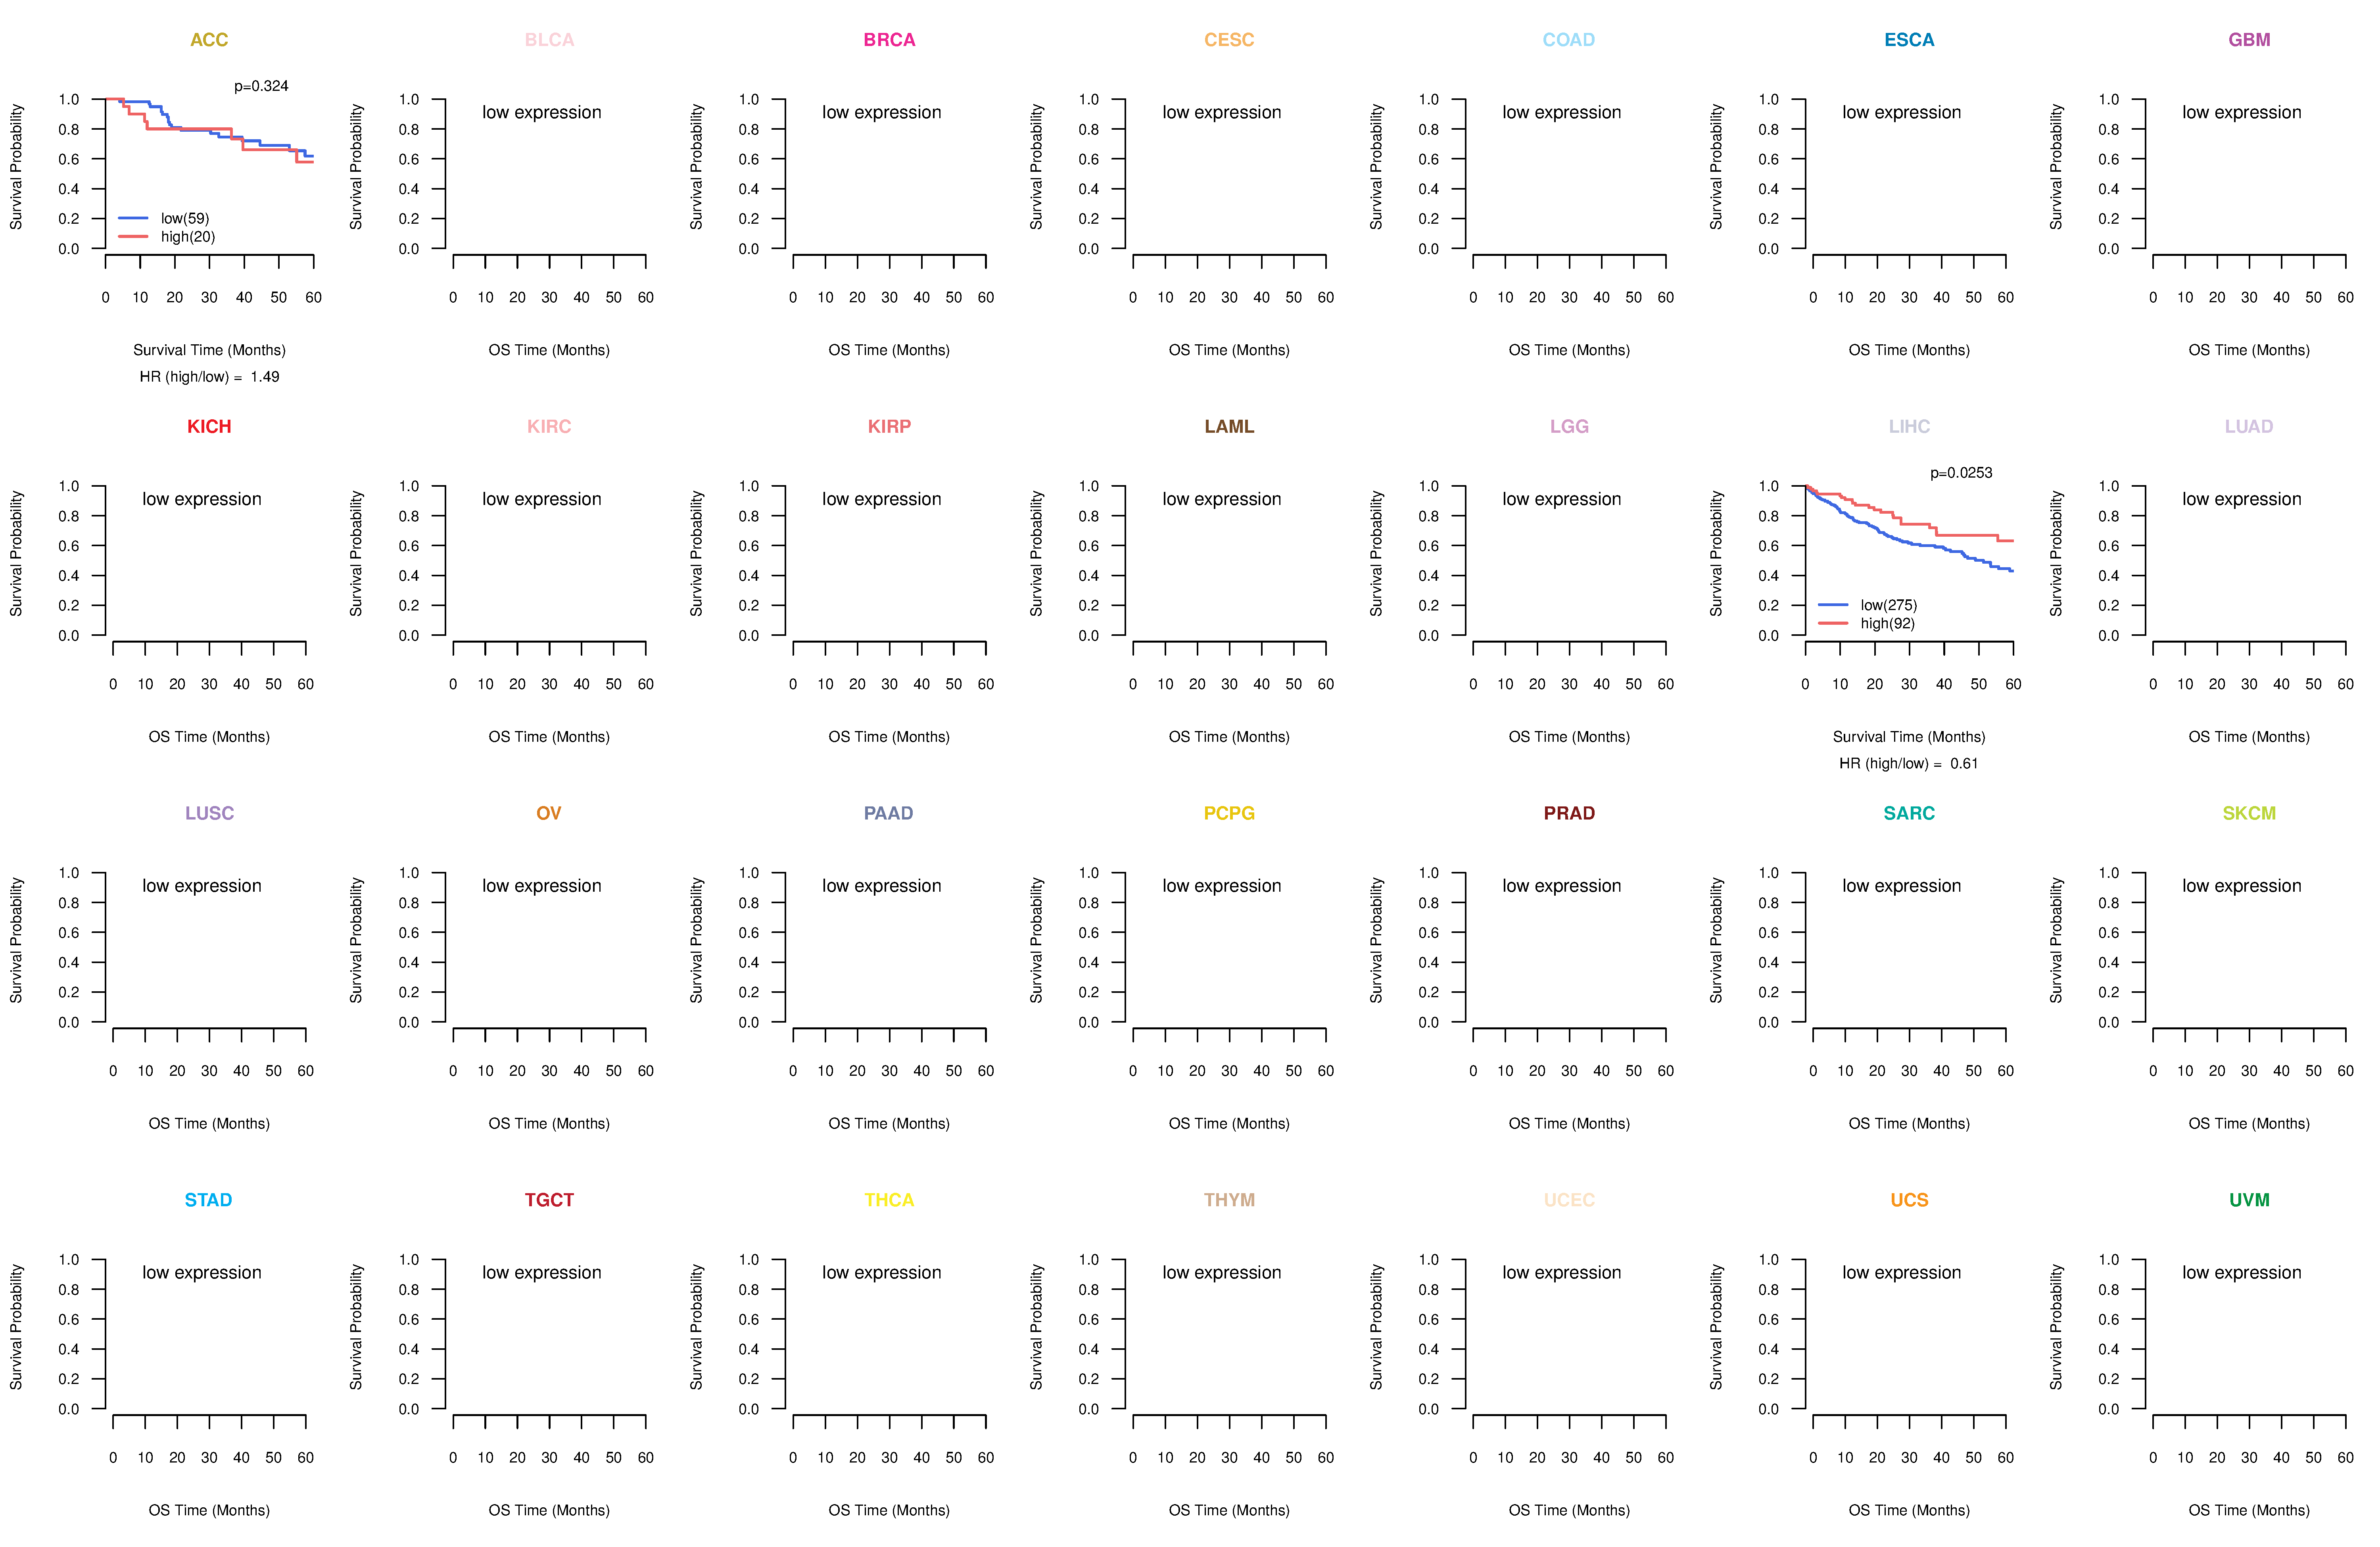
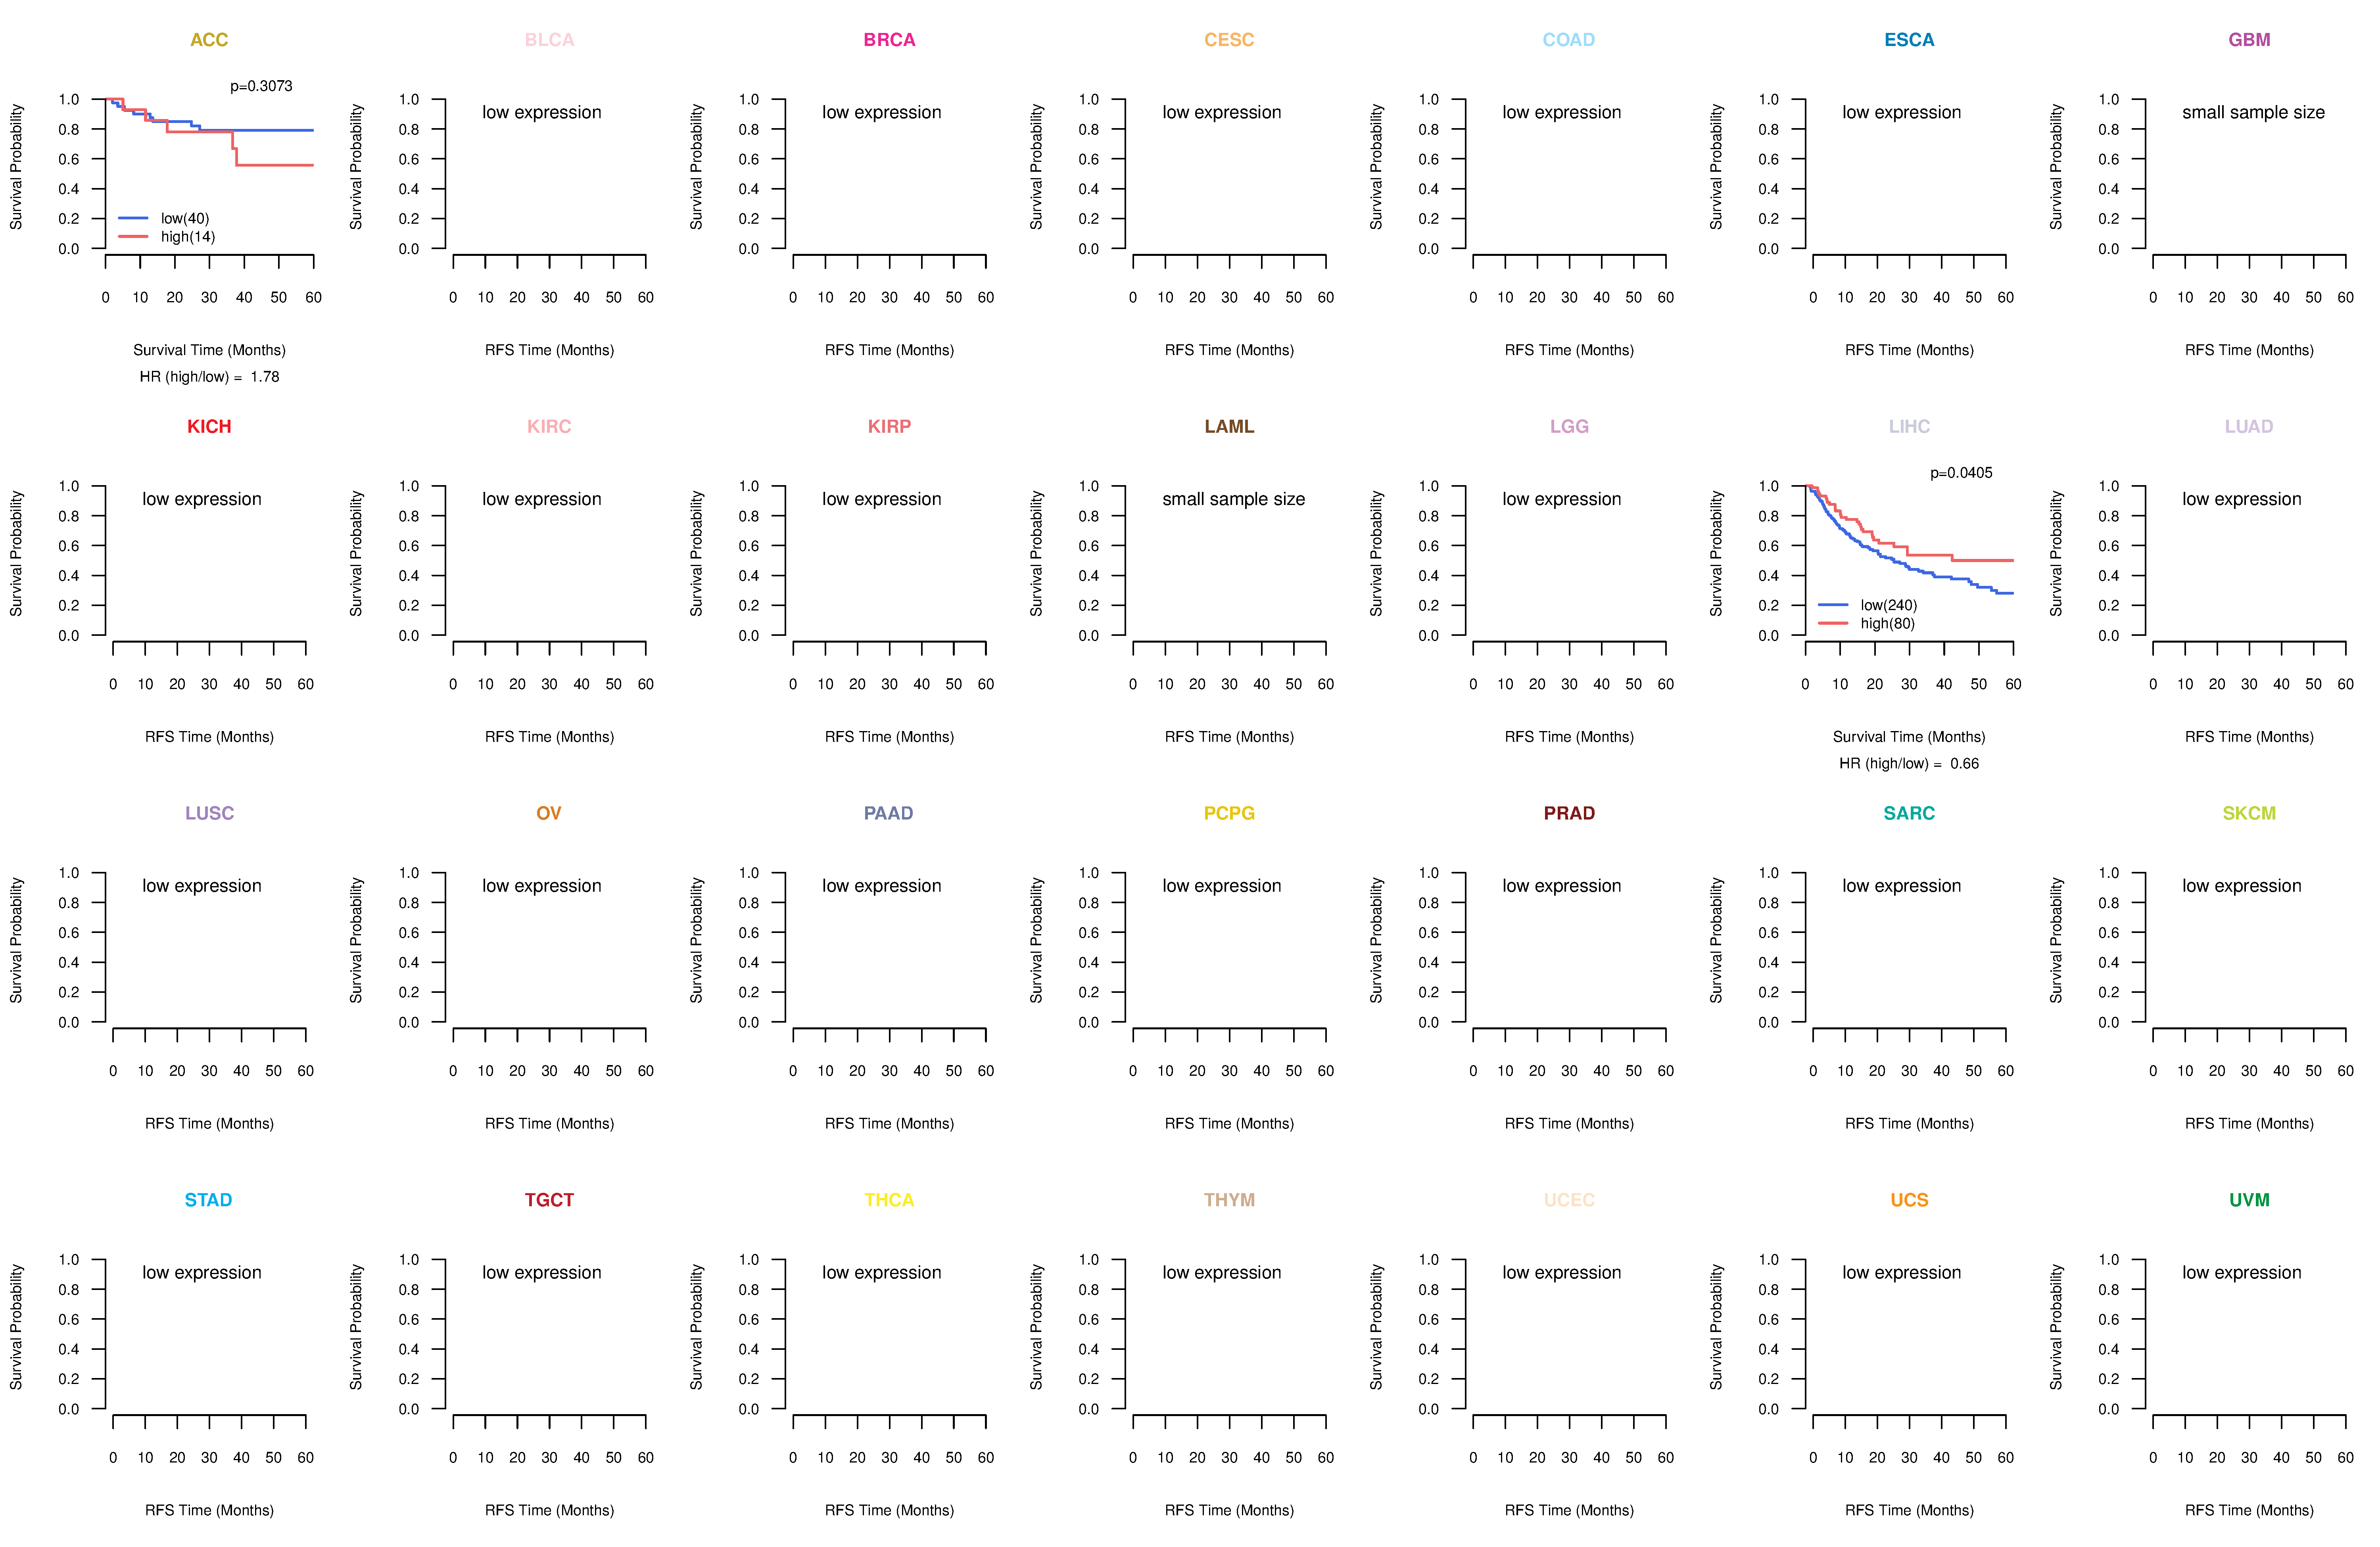
| Kaplan-Meier plots with logrank tests of overall survival (OS) using 28 cancer types (TCGA IlluminaHiSeq_RNASeqV2, pan-cancer normalized log2(norm_counts+1) data, version 2016-08-16) (TCGA clinicalMatrix, phenotype data, version 2016-04-27) * Click on the image to enlarge it in a new window. |
 |
| Kaplan-Meier plots with logrank test of relapse free survival (RFS) using 28 cancer types (TCGA IlluminaHiSeq_RNASeqV2, pan-cancer normalized log2(norm_counts+1) data, version 2016-08-16) (TCGA clinicalMatrix, phenotype data, version 2016-04-27) * Click on the image enlarge it in a new window. |
 |
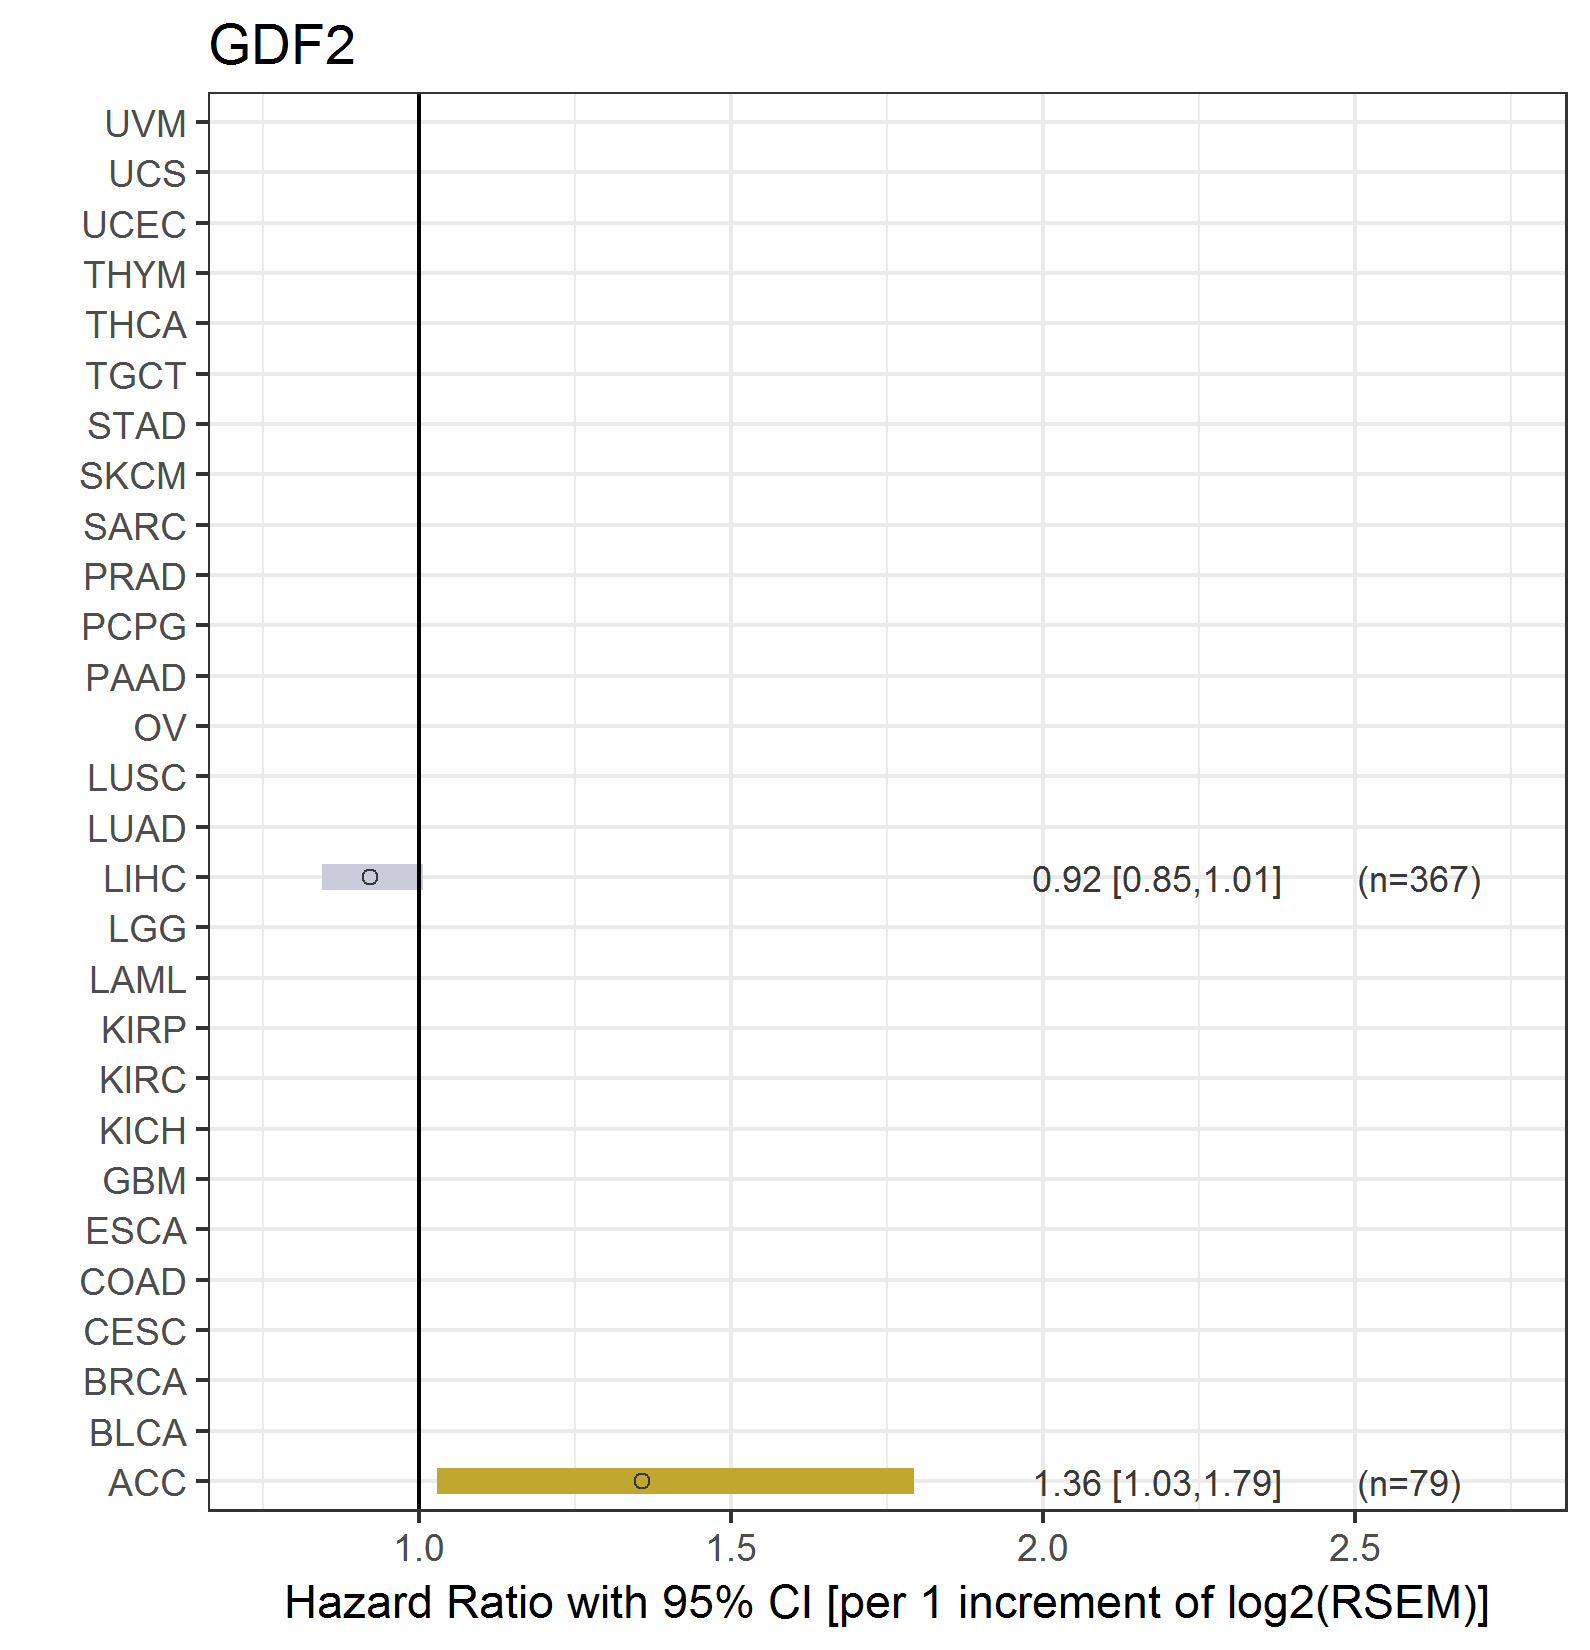
| Forest plot of Cox proportional hazard ratio (HR) and 95% CI of overall survival (OS) using 28 cancer types (TCGA IlluminaHiSeq_RNASeqV2, pan-cancer normalized log2(norm_counts+1) data, version 2016-08-16) (TCGA clinicalMatrix, phenotype data, version 2016-04-27) * Click on the image enlarge it in a new window. |
 |
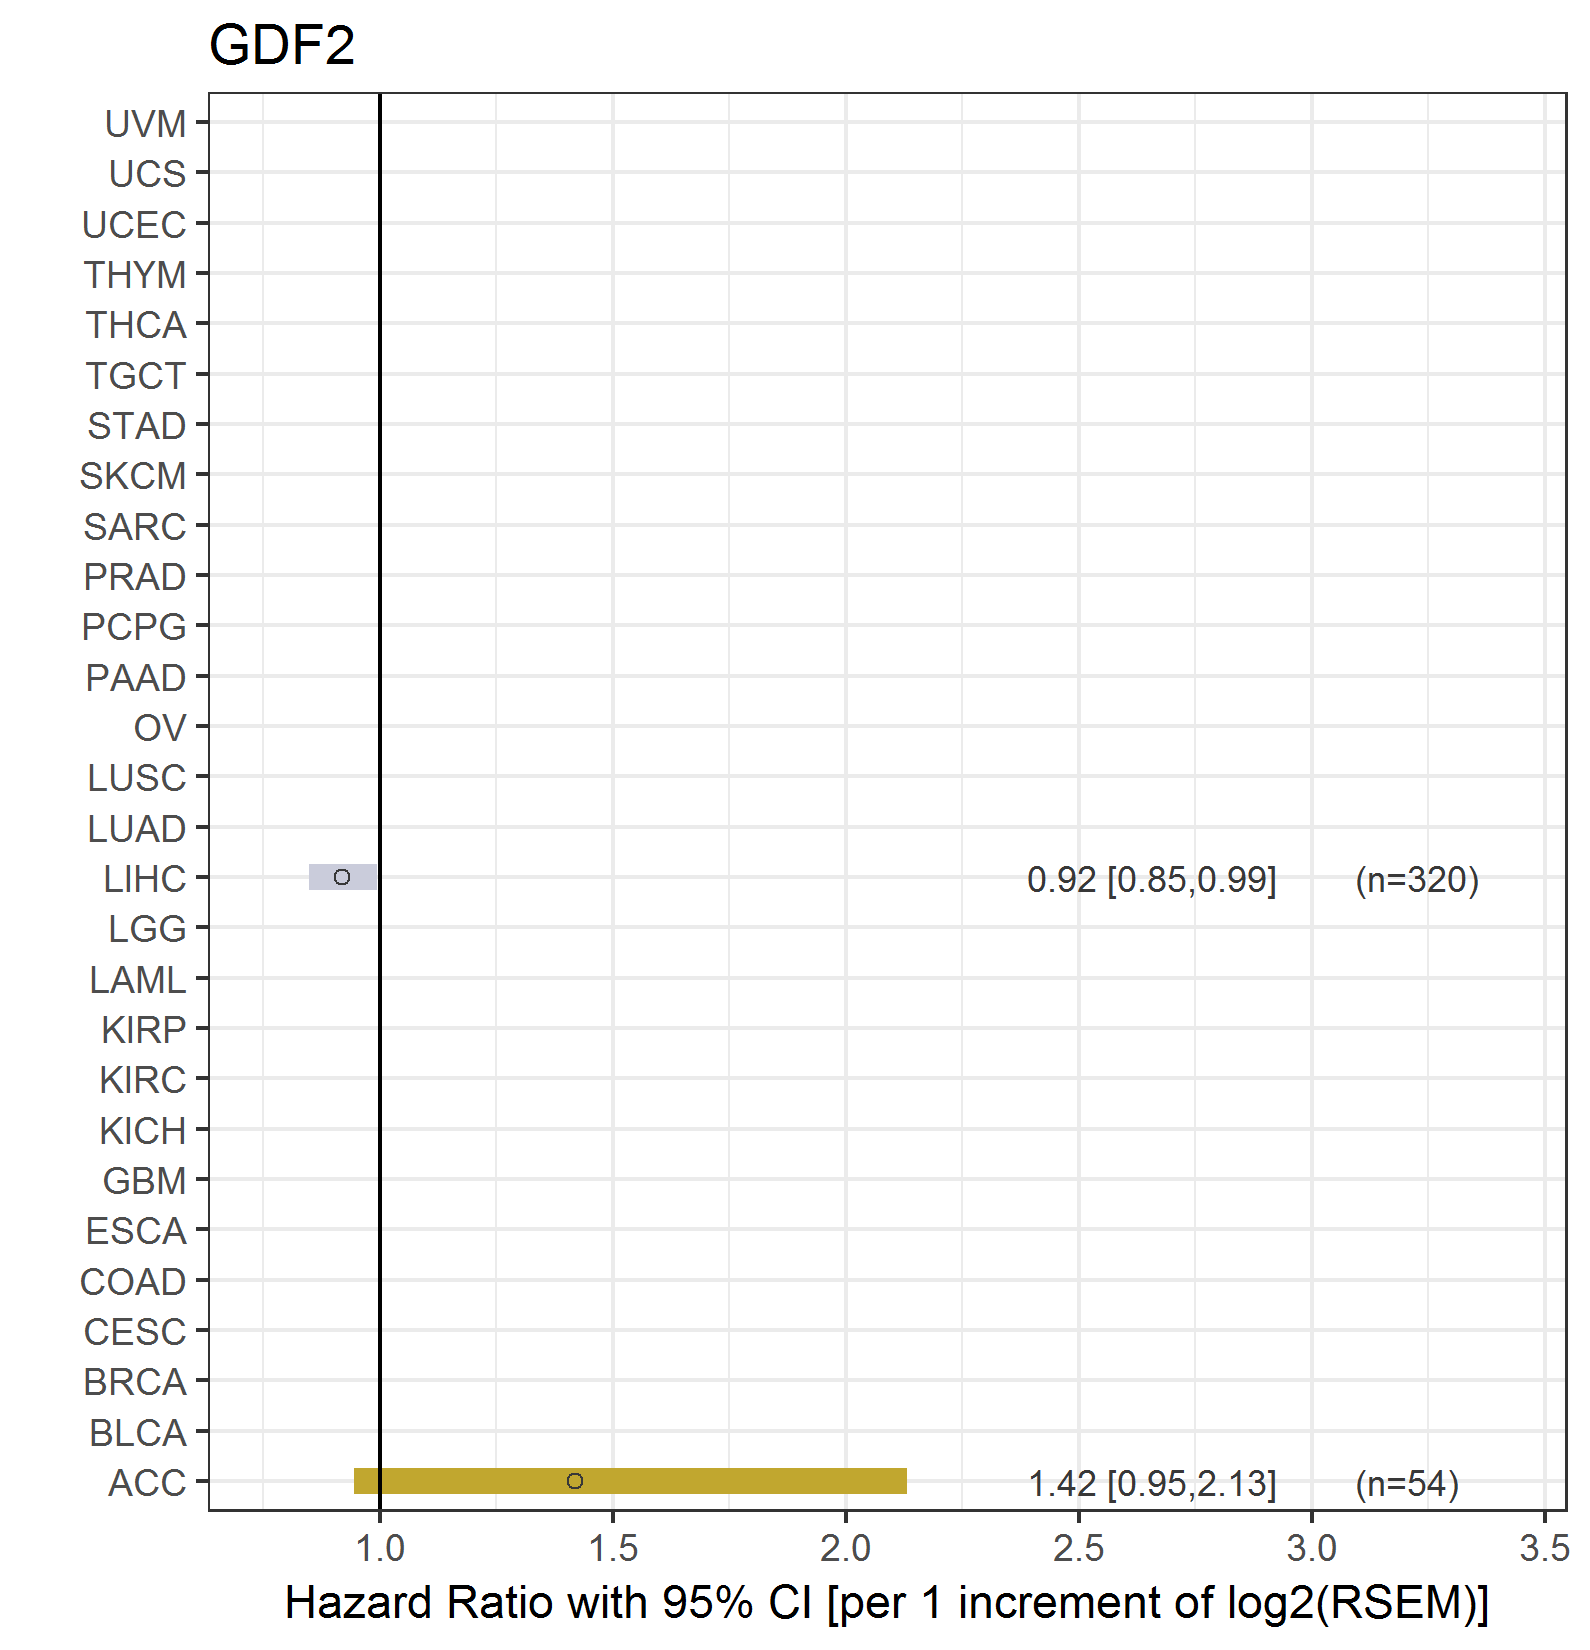
| Forest plot of Cox proportional hazard ratio (HR) and 95% CI of relapse free survival (RFS) using 28 cancer types (TCGA IlluminaHiSeq_RNASeqV2, pan-cancer normalized log2(norm_counts+1) data, version 2016-08-16) (TCGA clinicalMatrix, phenotype data, version 2016-04-27) * Click on the image enlarge it in a new window. |
 |
| Top |
| TissGeneClin for GDF2 |
| TissGeneDrug for GDF2 |
| Drug information targeting TissGene (DrugBank Version 5.0.6, 2017-04-01) |
| DrugBank ID | Drug name | Drug activity | Drug type | Drug status |
| Top |
| TissGeneDisease for GDF2 |
| Disease information associated with TissGene (DisGeNet, 2016-06-01) |
| Disease ID | Disease name | # pubmeds | Source |
| umls:C0006142 | Malignant neoplasm of breast | 4 | BeFree |
| umls:C0029463 | Osteosarcoma | 4 | BeFree |
| umls:C0585442 | Osteosarcoma of bone | 4 | BeFree |
| umls:C0678222 | Breast Carcinoma | 4 | BeFree |
| umls:C0376358 | Malignant neoplasm of prostate | 3 | BeFree |
| umls:C0022116 | Ischemia | 2 | BeFree |
| umls:C0039445 | Hereditary hemorrhagic telangiectasia | 2 | BeFree,ORPHANET |
| umls:C0178874 | Tumor Progression | 2 | BeFree |
| umls:C0600139 | Prostate carcinoma | 2 | BeFree |
| umls:C2239176 | Liver carcinoma | 2 | BeFree,CTD_human |
| umls:C0004936 | Mental disorders | 1 | GAD |
| umls:C0023890 | Liver Cirrhosis | 1 | GAD |
| umls:C0024623 | Malignant neoplasm of stomach | 1 | BeFree |
| umls:C0027627 | Neoplasm Metastasis | 1 | BeFree |
| umls:C0029925 | Ovarian Carcinoma | 1 | BeFree |
| umls:C0152171 | Idiopathic pulmonary hypertension | 1 | BeFree |
| umls:C0158570 | Vascular anomaly | 1 | BeFree |
| umls:C0235974 | Pancreatic carcinoma | 1 | BeFree |
| umls:C0346647 | Malignant neoplasm of pancreas | 1 | BeFree |
| umls:C0600452 | Hepatopulmonary Syndrome | 1 | GAD |
| umls:C0699791 | Stomach Carcinoma | 1 | BeFree |
| umls:C1140680 | Malignant neoplasm of ovary | 1 | BeFree |
| umls:C1519670 | Tumor Angiogenesis | 1 | BeFree |
| umls:C1520166 | Xenograft Model | 1 | BeFree |
| umls:C2973725 | Pulmonary arterial hypertension | 1 | BeFree |
| umls:C3714844 | Pulmonary Hypertension, Primary, 1, With Hereditary Hemorrhagic Telangiectasia | 1 | BeFree |
| umls:C3809710 | TELANGIECTASIA, HEREDITARY HEMORRHAGIC, TYPE 5 | 1 | CLINVAR,UNIPROT |
|
Copyright 2016-Present - The University of Texas Health Science Center at Houston (UTHealth) Web File Viewing | How to Report, Fraud, Waste and Abuse | State of Texas | Statewide Search | Texas Homeland Security | Site Policies |