 |
| |
| |
| |
| |
| |
| |
|

| TissGeneSummary for GLS2 |
 Gene summary Gene summary |
| Basic gene information | Gene symbol | GLS2 |
| Gene name | glutaminase 2 (liver, mitochondrial) | |
| Synonyms | GA|GLS|LGA|hLGA | |
| Cytomap | UCSC genome browser: 12q13.3 | |
| Type of gene | protein-coding | |
| RefGenes | NM_001280796.1, NM_001280797.1,NM_001280798.1,NM_013267.3,NM_138566.1, | |
| Description | L-glutamine amidohydrolasebreast cell glutaminaseglutaminase Iglutaminase liver isoform, mitochondrialphosphate-activated glutaminasephosphate-dependent glutaminase | |
| Modification date | 20141211 | |
| dbXrefs | MIM : 606365 | |
| HGNC : HGNC | ||
| Ensembl : ENSG00000135423 | ||
| HPRD : 05901 | ||
| Vega : OTTHUMG00000140379 | ||
| Protein | UniProt: go to UniProt's Cross Reference DB Table | |
| Expression | CleanEX: HS_GLS2 | |
| BioGPS: 27165 | ||
| Pathway | NCI Pathway Interaction Database: GLS2 | |
| KEGG: GLS2 | ||
| REACTOME: GLS2 | ||
| Pathway Commons: GLS2 | ||
| Context | iHOP: GLS2 | |
| ligand binding site mutation search in PubMed: GLS2 | ||
| UCL Cancer Institute: GLS2 | ||
| Assigned class in TissGDB* | C | |
| Included tissue-specific gene expression resources | HPA,GTEx | |
| Specific-tissues in normal samples (assigned by TissGDB using HPA, TiGER, and GTEx) | Liver | |
| Cancer types related to the specific-tissues in cancer samples (assigned by TissGDB using TCGA) | LIHC | |
| Reference showing the relevant tissue of GLS2 | ||
| Description by TissGene annotations | Fused withTSGene | |
| * Class A consists of genes with literature evidence and is part of the cTissGenes. Class B consists of only cTissGenes without additional evidence. The remaining genes belong to Class C. |
| Gene ontology having evidence of Inferred from Direct Assay (IDA) from Entrez |
| GO ID | GO term | PubMed ID |
| Top |
| TissGeneExp for GLS2 |
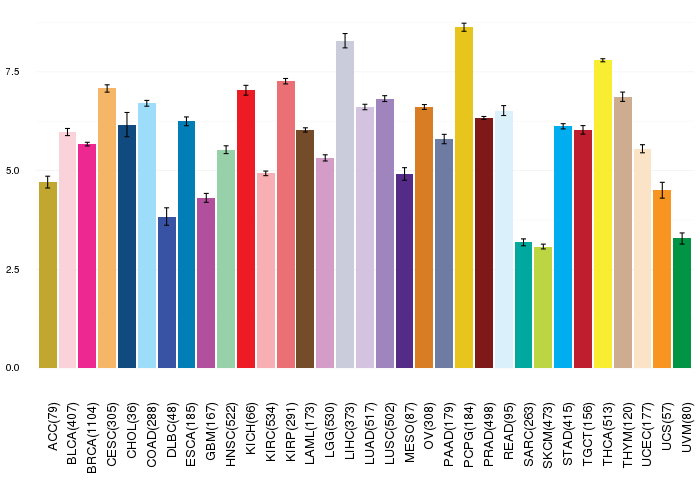
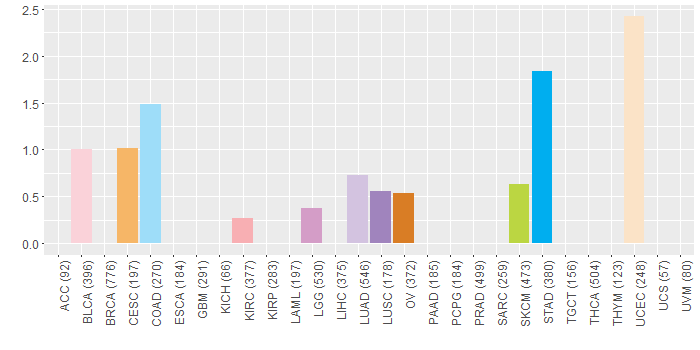
| Gene expressions across 28 cancer types (X-axis: cancer type and Y-axis: log2(norm_counts+1)) (TCGA IlluminaHiSeq_RNASeqV2, pan-cancer normalized log2(norm_counts+1) data, version 2016-08-16) |
 |
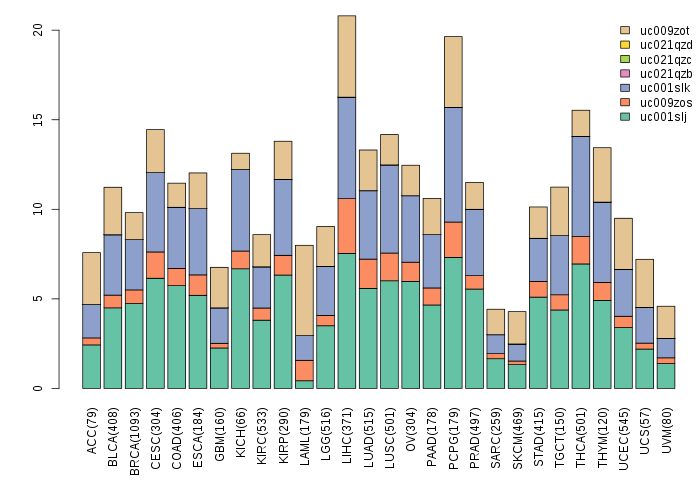
| Gene isoform expressions across 28 cancer types (X-axis: cancer type and Y-axis: log2(norm_counts+1)) (TCGA pan-cancer tcga_rsem_isoform_tpm, version 2016-09-01) |
 |
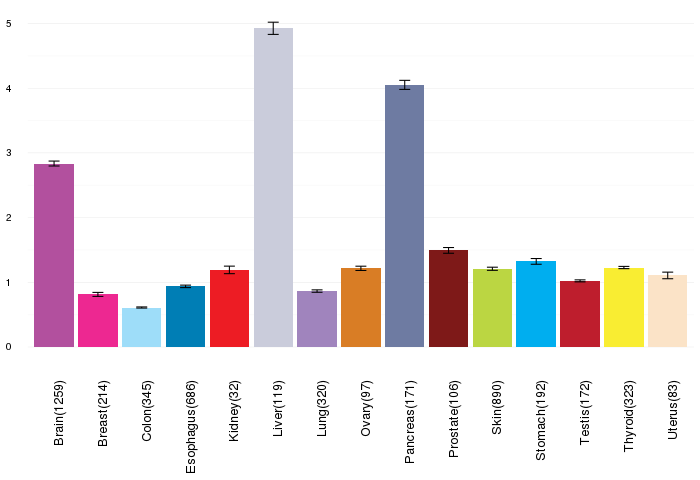
| Gene expressions across normal tissues of GTEx data (GTEx GTEx_Analysis_v6_RNA-seq_RNA-SeQCv1.1.8_gene_rpkm.gct) - Here, we shows the matched tissue types only among our 28 cancer types. |
 |
| Different expressions across 14 cancer types with more than 10 samples between matched tumors and normals (X-axis: cancer type and Y-axis: log2(norm_counts+1)) (TCGA IlluminaHiSeq_RNASeqV2, pan-cancer normalized log2(norm_counts+1) data, version 2016-08-16) |
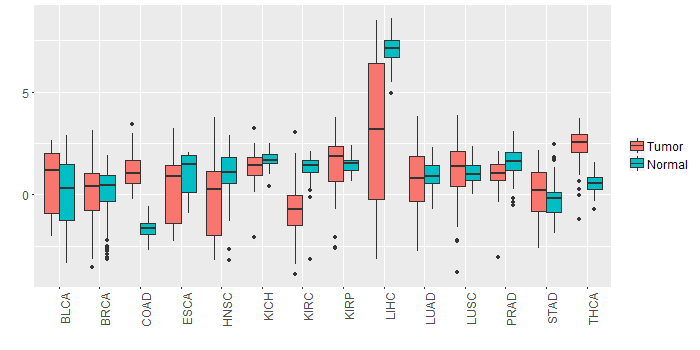 |
| - Significantly differentially expressed cancer types and information. (|Fold change|>1 and FDR<0.05) |
| Cancer type | Mean(exp) in tumor | Mean(exp) in matched normal | Log2FC | P-val. | FDR |
| COAD | 1.201620332 | -1.65398736 | 2.855607692 | 3.03E-15 | 2.07E-13 |
| THCA | 2.330966682 | 0.534139563 | 1.796827119 | 2.45E-23 | 2.01E-21 |
| KIRC | -0.747310437 | 1.297745119 | -2.045055556 | 1.57E-20 | 1.30E-19 |
| LIHC | 2.960027563 | 7.129483563 | -4.169456 | 7.57E-11 | 1.00E-09 |
| HNSC | -0.173313925 | 0.976472121 | -1.149786047 | 0.00215 | 0.006563772 |
| Top |
| TissGene-miRNA for GLS2 |
| Significantly anti-correlated miRNAs of TissGene across 28 cancer types (Gene-miRNA relations from TargetScanHuman Relsease 7.1, Conserved_Site_Context_Scores.txt.zip, 06.01.2016) (TCGA IlluminaHiSeq_miRNASeq, log2(RPM+1) data, version 2016-11-21) (TCGA IlluminaHiSeq_RNASeqV2, log2(normalized_count+1) data, version 2016-08-16) (Spearman’s Rank Correlation (p-value<0.05 and coefficient<-0.25)) |
| Cancer type | miRNA id | miRNA accession | P-val. | Coeff. | # samples |
| Top |
| TissGeneMut for GLS2 |
| TissGeneSNV for GLS2 |
| nsSNV counts per each loci. Different colors of circles represent different cancer types. Circle size denotes number of samples. (TCGA somatic mutation (SNPs and small INDELs) data, version 2016-04-25) * Click on the image to enlarge it in a new window. |
 |
 |
| Somatic nucleotide variants of TissGene across 28 cancer types (X-axis: cancer type and Y-axis: % of mutated samples) The numbers in parentheses are numbers of samples with mutation (nsSNVs). (TCGA somatic mutation (SNPs and small INDELs) data, version 2016-04-25) |
 |
| - nsSNVs sorted by frequency. |
| AAchange | Cancer type | # samples |
| p.W168* | UCEC | 1 |
| p.R71H | COAD | 1 |
| p.E173K | LUAD | 1 |
| p.E316K | SKCM | 1 |
| p.L32I | COAD | 1 |
| p.R387H | BLCA | 1 |
| p.R477H | UCEC | 1 |
| p.R503* | STAD | 1 |
| p.E173Q | BLCA | 1 |
| p.T161M | MESO | 1 |
| p.G100A | CESC | 1 |
| p.Q102* | UCEC | 1 |
| p.G397S | STAD | 1 |
| p.D289H | LUSC | 1 |
| p.L108R | LGG | 1 |
| p.S519L | HNSC | 1 |
| p.R250C | COAD | 1 |
| p.D129N | SKCM | 1 |
| p.R483W | UCEC | 1 |
| p.R520H | UCEC | 1 |
| p.S508* | BLCA | 1 |
| p.E591K | LUAD | 1 |
| p.V569A | BLCA | 1 |
| p.M429I | STAD | 1 |
| p.D550Y | KIRC | 1 |
| p.G530E | HNSC | 1 |
| p.D550E | OV | 1 |
| p.T376I | OV | 1 |
| p.E314K | LUAD | 1 |
| p.S149* | UCEC | 1 |
| p.R471Q | STAD | 1 |
| p.Q576L | COAD | 1 |
| p.M393V | STAD | 1 |
| p.D339G | STAD | 1 |
| p.L457F | LGG | 1 |
| p.E158Q | CESC | 1 |
| p.I141T | STAD | 1 |
| p.R86Q | SKCM | 1 |
| p.R20* | UCEC | 1 |
| p.R20G | LUAD | 1 |
| Top |
| TissGeneCNV for GLS2 |
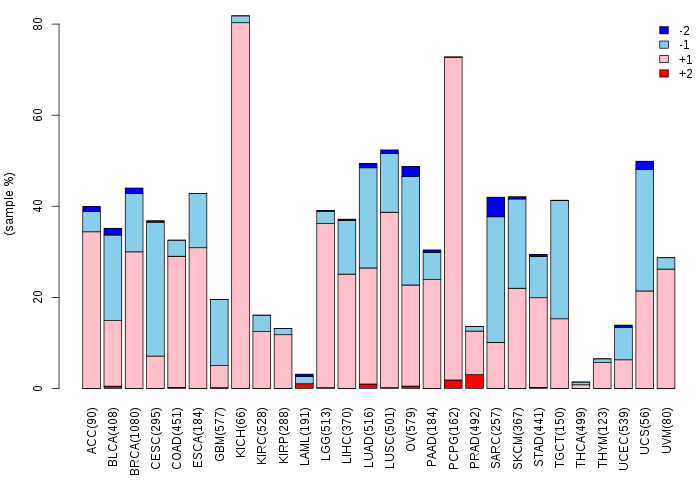
| Copy number variations of TissGene across 28 cancer types (X-axis: cancer type and Y-axis: % of CNV samples) (TCGA Gistic2_CopyNumber_Gistic2_all_data_by_genes, Gistic2 copy number data, version 2016-08-16) |
 |
| Top |
| TissGeneFusions for GLS2 |
| Fusion genes including TissGene (ChimerDB 3.0, 2016-12-01 and TCGA fusion Portal 2015-12-01) |
| Database | Src | Cancer type | Sample | Fusion gene | ORF | 5'-gene BP | 3'-gene BP |
| Chimerdb3.0 | ChiTaRs | NA | AW894954 | GLS2-GLS2 | chr12:56880346 | chr12:56876296 |
| Top |
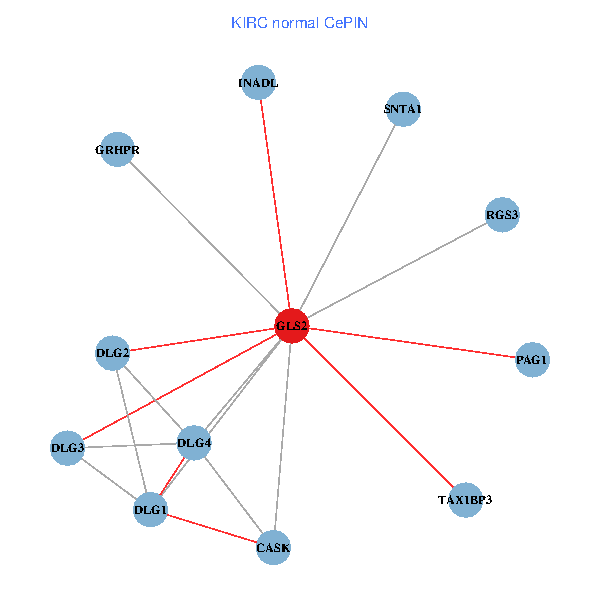
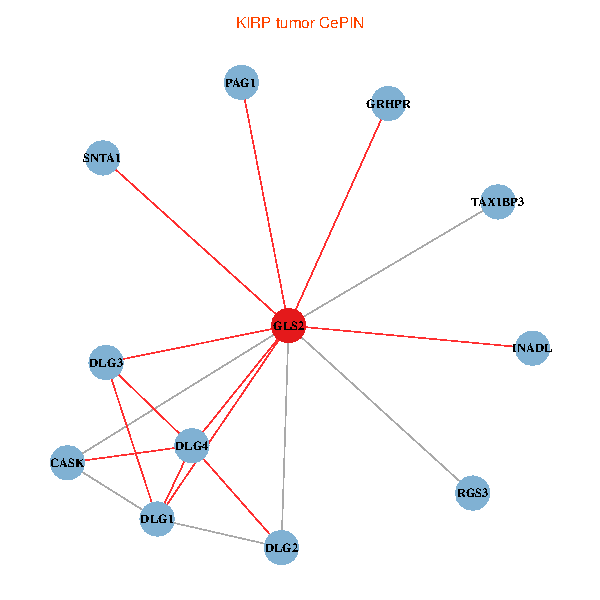
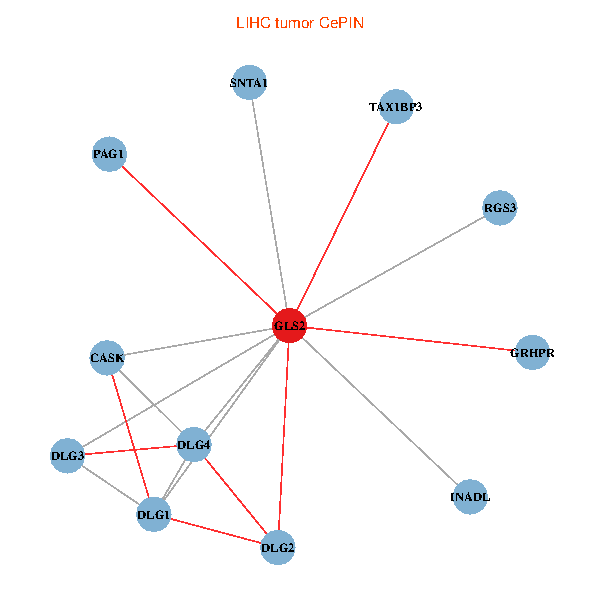
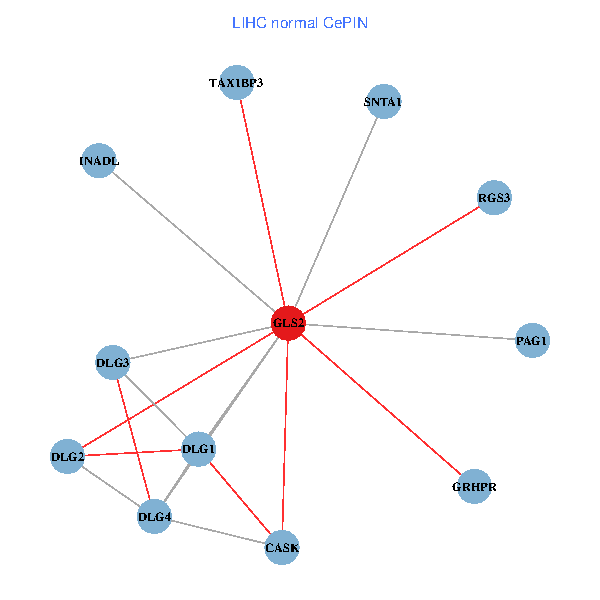
| TissGeneNet for GLS2 |
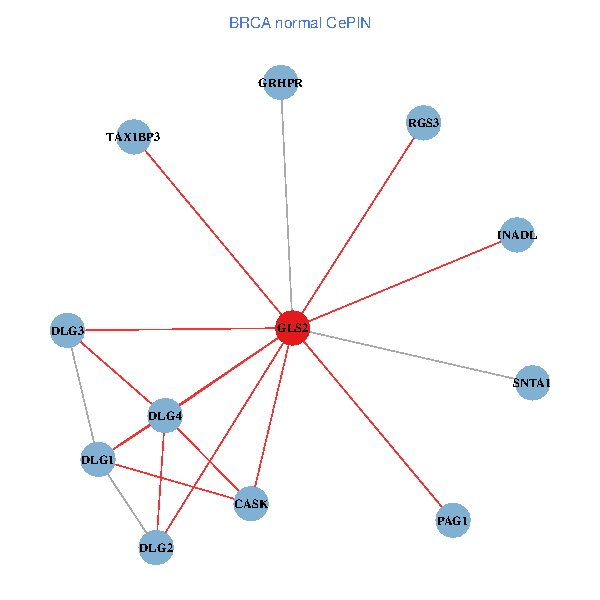
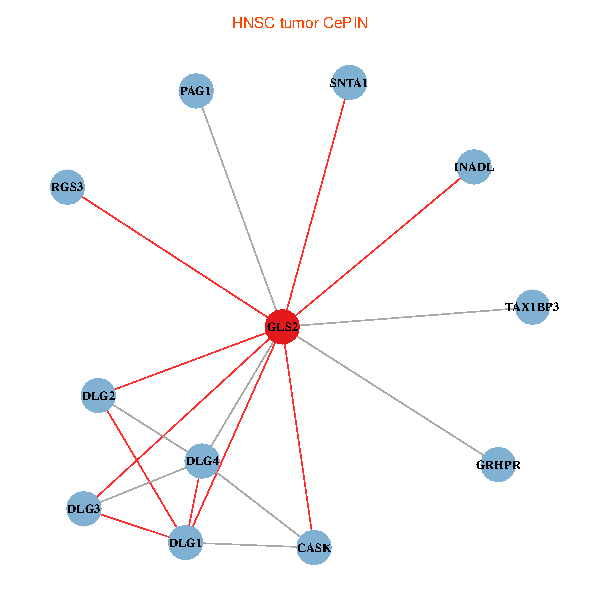
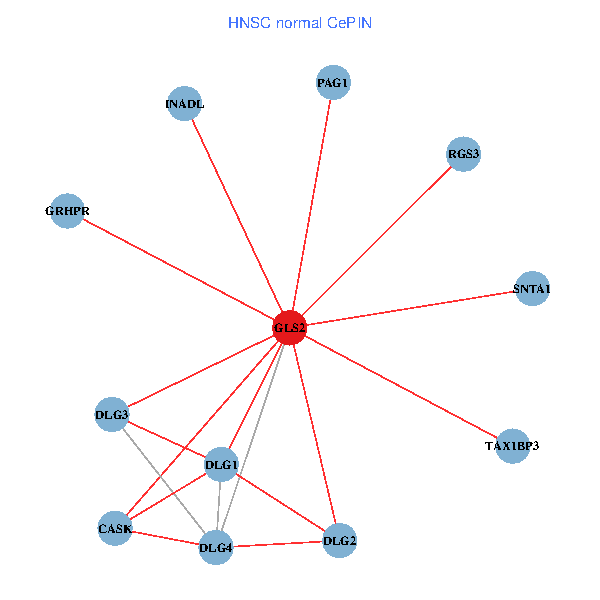
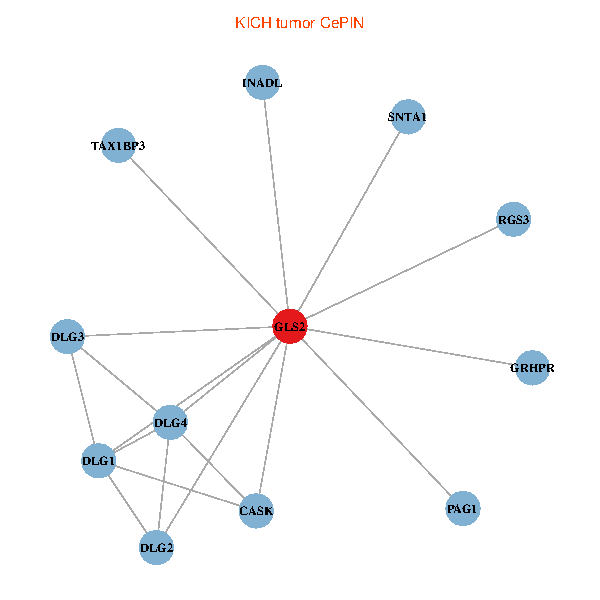
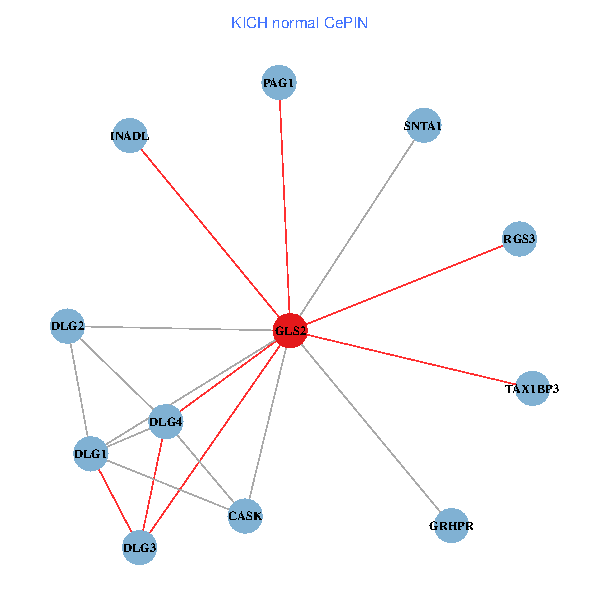
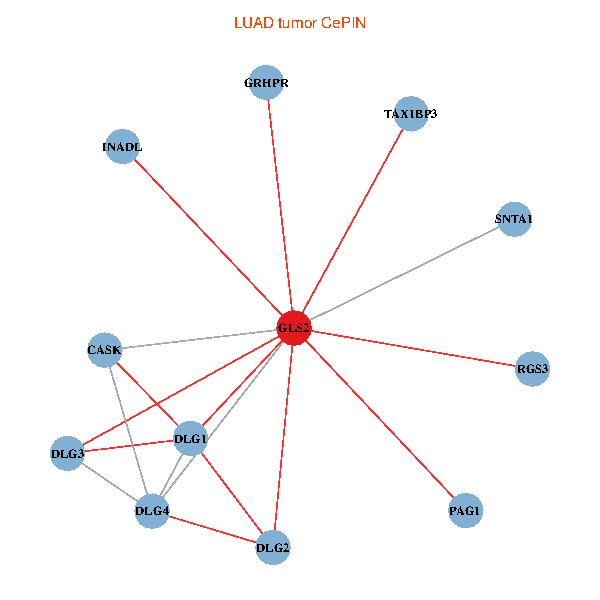
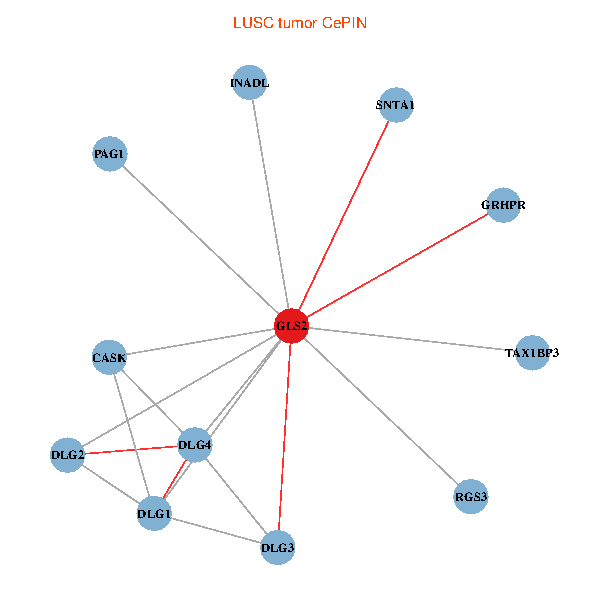
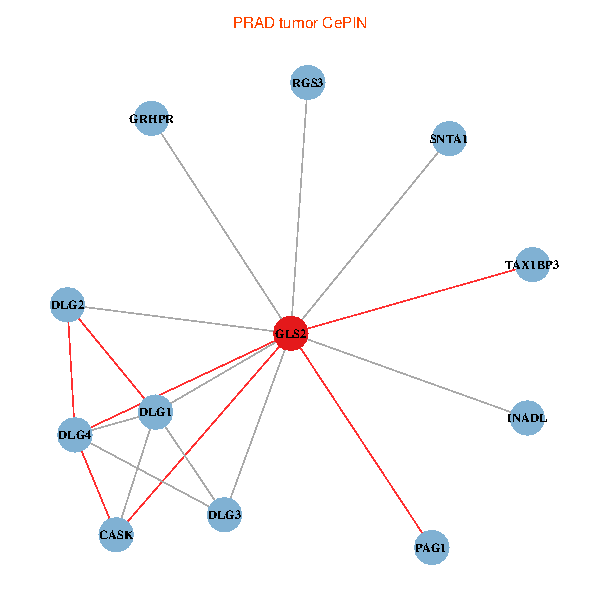
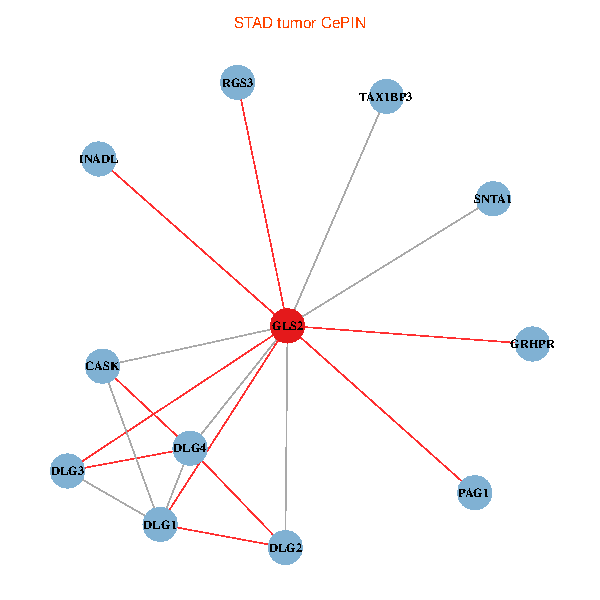
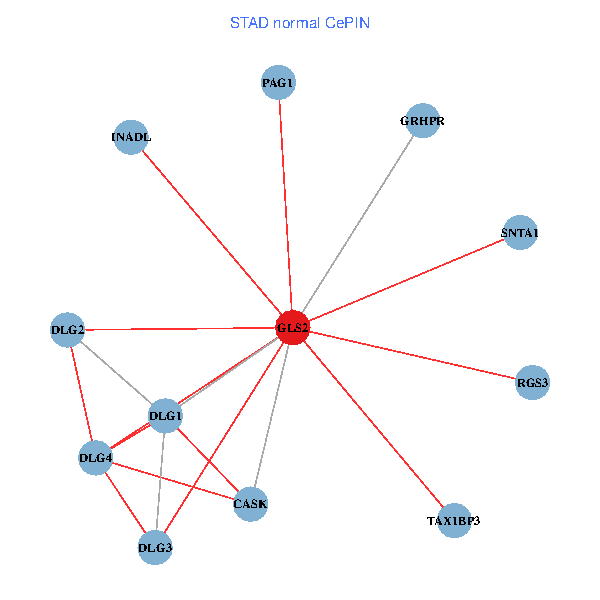
| Co-expressed gene networks based on protein-protein interaction data (CePIN) (TCGA IlluminaHiSeq_RNASeqV2, pan-cancer normalized log2(norm_counts+1) data, version 2016-08-16) (PINA2 ppi data) |
| BRCA (tumor) | BRCA (normal) |
| GLS2, PAG1, DLG2, DLG4, CASK, INADL, DLG1, RGS3, SNTA1, DLG3, TAX1BP3, GRHPR (tumor) | GLS2, PAG1, DLG2, DLG4, CASK, INADL, DLG1, RGS3, SNTA1, DLG3, TAX1BP3, GRHPR (normal) |
 |  |
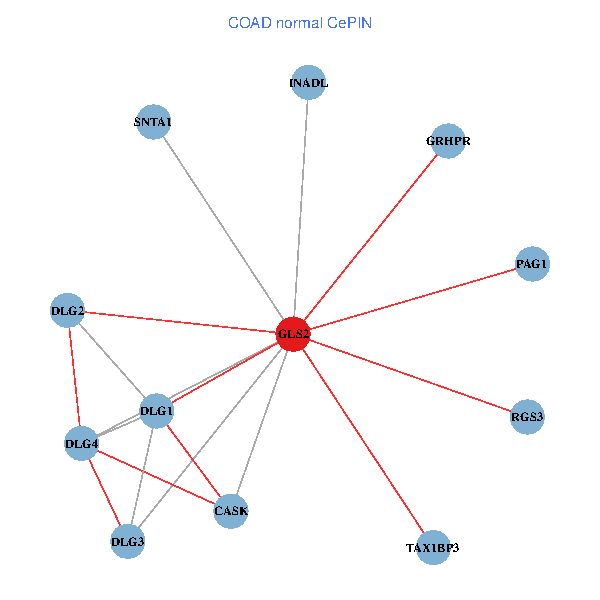
| COAD (tumor) | COAD (normal) |
| GLS2, PAG1, DLG2, DLG4, CASK, INADL, DLG1, RGS3, SNTA1, DLG3, TAX1BP3, GRHPR (tumor) | GLS2, PAG1, DLG2, DLG4, CASK, INADL, DLG1, RGS3, SNTA1, DLG3, TAX1BP3, GRHPR (normal) |
 |  |
| HNSC (tumor) | HNSC (normal) |
| GLS2, PAG1, DLG2, DLG4, CASK, INADL, DLG1, RGS3, SNTA1, DLG3, TAX1BP3, GRHPR (tumor) | GLS2, PAG1, DLG2, DLG4, CASK, INADL, DLG1, RGS3, SNTA1, DLG3, TAX1BP3, GRHPR (normal) |
 |  |
| KICH (tumor) | KICH (normal) |
| GLS2, PAG1, DLG2, DLG4, CASK, INADL, DLG1, RGS3, SNTA1, DLG3, TAX1BP3, GRHPR (tumor) | GLS2, PAG1, DLG2, DLG4, CASK, INADL, DLG1, RGS3, SNTA1, DLG3, TAX1BP3, GRHPR (normal) |
 |  |
| KIRC (tumor) | KIRC (normal) |
| GLS2, PAG1, DLG2, DLG4, CASK, INADL, DLG1, RGS3, SNTA1, DLG3, TAX1BP3, GRHPR (tumor) | GLS2, PAG1, DLG2, DLG4, CASK, INADL, DLG1, RGS3, SNTA1, DLG3, TAX1BP3, GRHPR (normal) |
 |  |
| KIRP (tumor) | KIRP (normal) |
| GLS2, PAG1, DLG2, DLG4, CASK, INADL, DLG1, RGS3, SNTA1, DLG3, TAX1BP3, GRHPR (tumor) | GLS2, PAG1, DLG2, DLG4, CASK, INADL, DLG1, RGS3, SNTA1, DLG3, TAX1BP3, GRHPR (normal) |
 |  |
| LIHC (tumor) | LIHC (normal) |
| GLS2, PAG1, DLG2, DLG4, CASK, INADL, DLG1, RGS3, SNTA1, DLG3, TAX1BP3, GRHPR (tumor) | GLS2, PAG1, DLG2, DLG4, CASK, INADL, DLG1, RGS3, SNTA1, DLG3, TAX1BP3, GRHPR (normal) |
 |  |
| LUAD (tumor) | LUAD (normal) |
| GLS2, PAG1, DLG2, DLG4, CASK, INADL, DLG1, RGS3, SNTA1, DLG3, TAX1BP3, GRHPR (tumor) | GLS2, PAG1, DLG2, DLG4, CASK, INADL, DLG1, RGS3, SNTA1, DLG3, TAX1BP3, GRHPR (normal) |
 |  |
| LUSC (tumor) | LUSC (normal) |
| GLS2, PAG1, DLG2, DLG4, CASK, INADL, DLG1, RGS3, SNTA1, DLG3, TAX1BP3, GRHPR (tumor) | GLS2, PAG1, DLG2, DLG4, CASK, INADL, DLG1, RGS3, SNTA1, DLG3, TAX1BP3, GRHPR (normal) |
 |  |
| PRAD (tumor) | PRAD (normal) |
| GLS2, PAG1, DLG2, DLG4, CASK, INADL, DLG1, RGS3, SNTA1, DLG3, TAX1BP3, GRHPR (tumor) | GLS2, PAG1, DLG2, DLG4, CASK, INADL, DLG1, RGS3, SNTA1, DLG3, TAX1BP3, GRHPR (normal) |
 |  |
| STAD (tumor) | STAD (normal) |
| GLS2, PAG1, DLG2, DLG4, CASK, INADL, DLG1, RGS3, SNTA1, DLG3, TAX1BP3, GRHPR (tumor) | GLS2, PAG1, DLG2, DLG4, CASK, INADL, DLG1, RGS3, SNTA1, DLG3, TAX1BP3, GRHPR (normal) |
 |  |
| THCA (tumor) | THCA (normal) |
| GLS2, PAG1, DLG2, DLG4, CASK, INADL, DLG1, RGS3, SNTA1, DLG3, TAX1BP3, GRHPR (tumor) | GLS2, PAG1, DLG2, DLG4, CASK, INADL, DLG1, RGS3, SNTA1, DLG3, TAX1BP3, GRHPR (normal) |
 |  |
| Top |
| TissGeneProg for GLS2 |
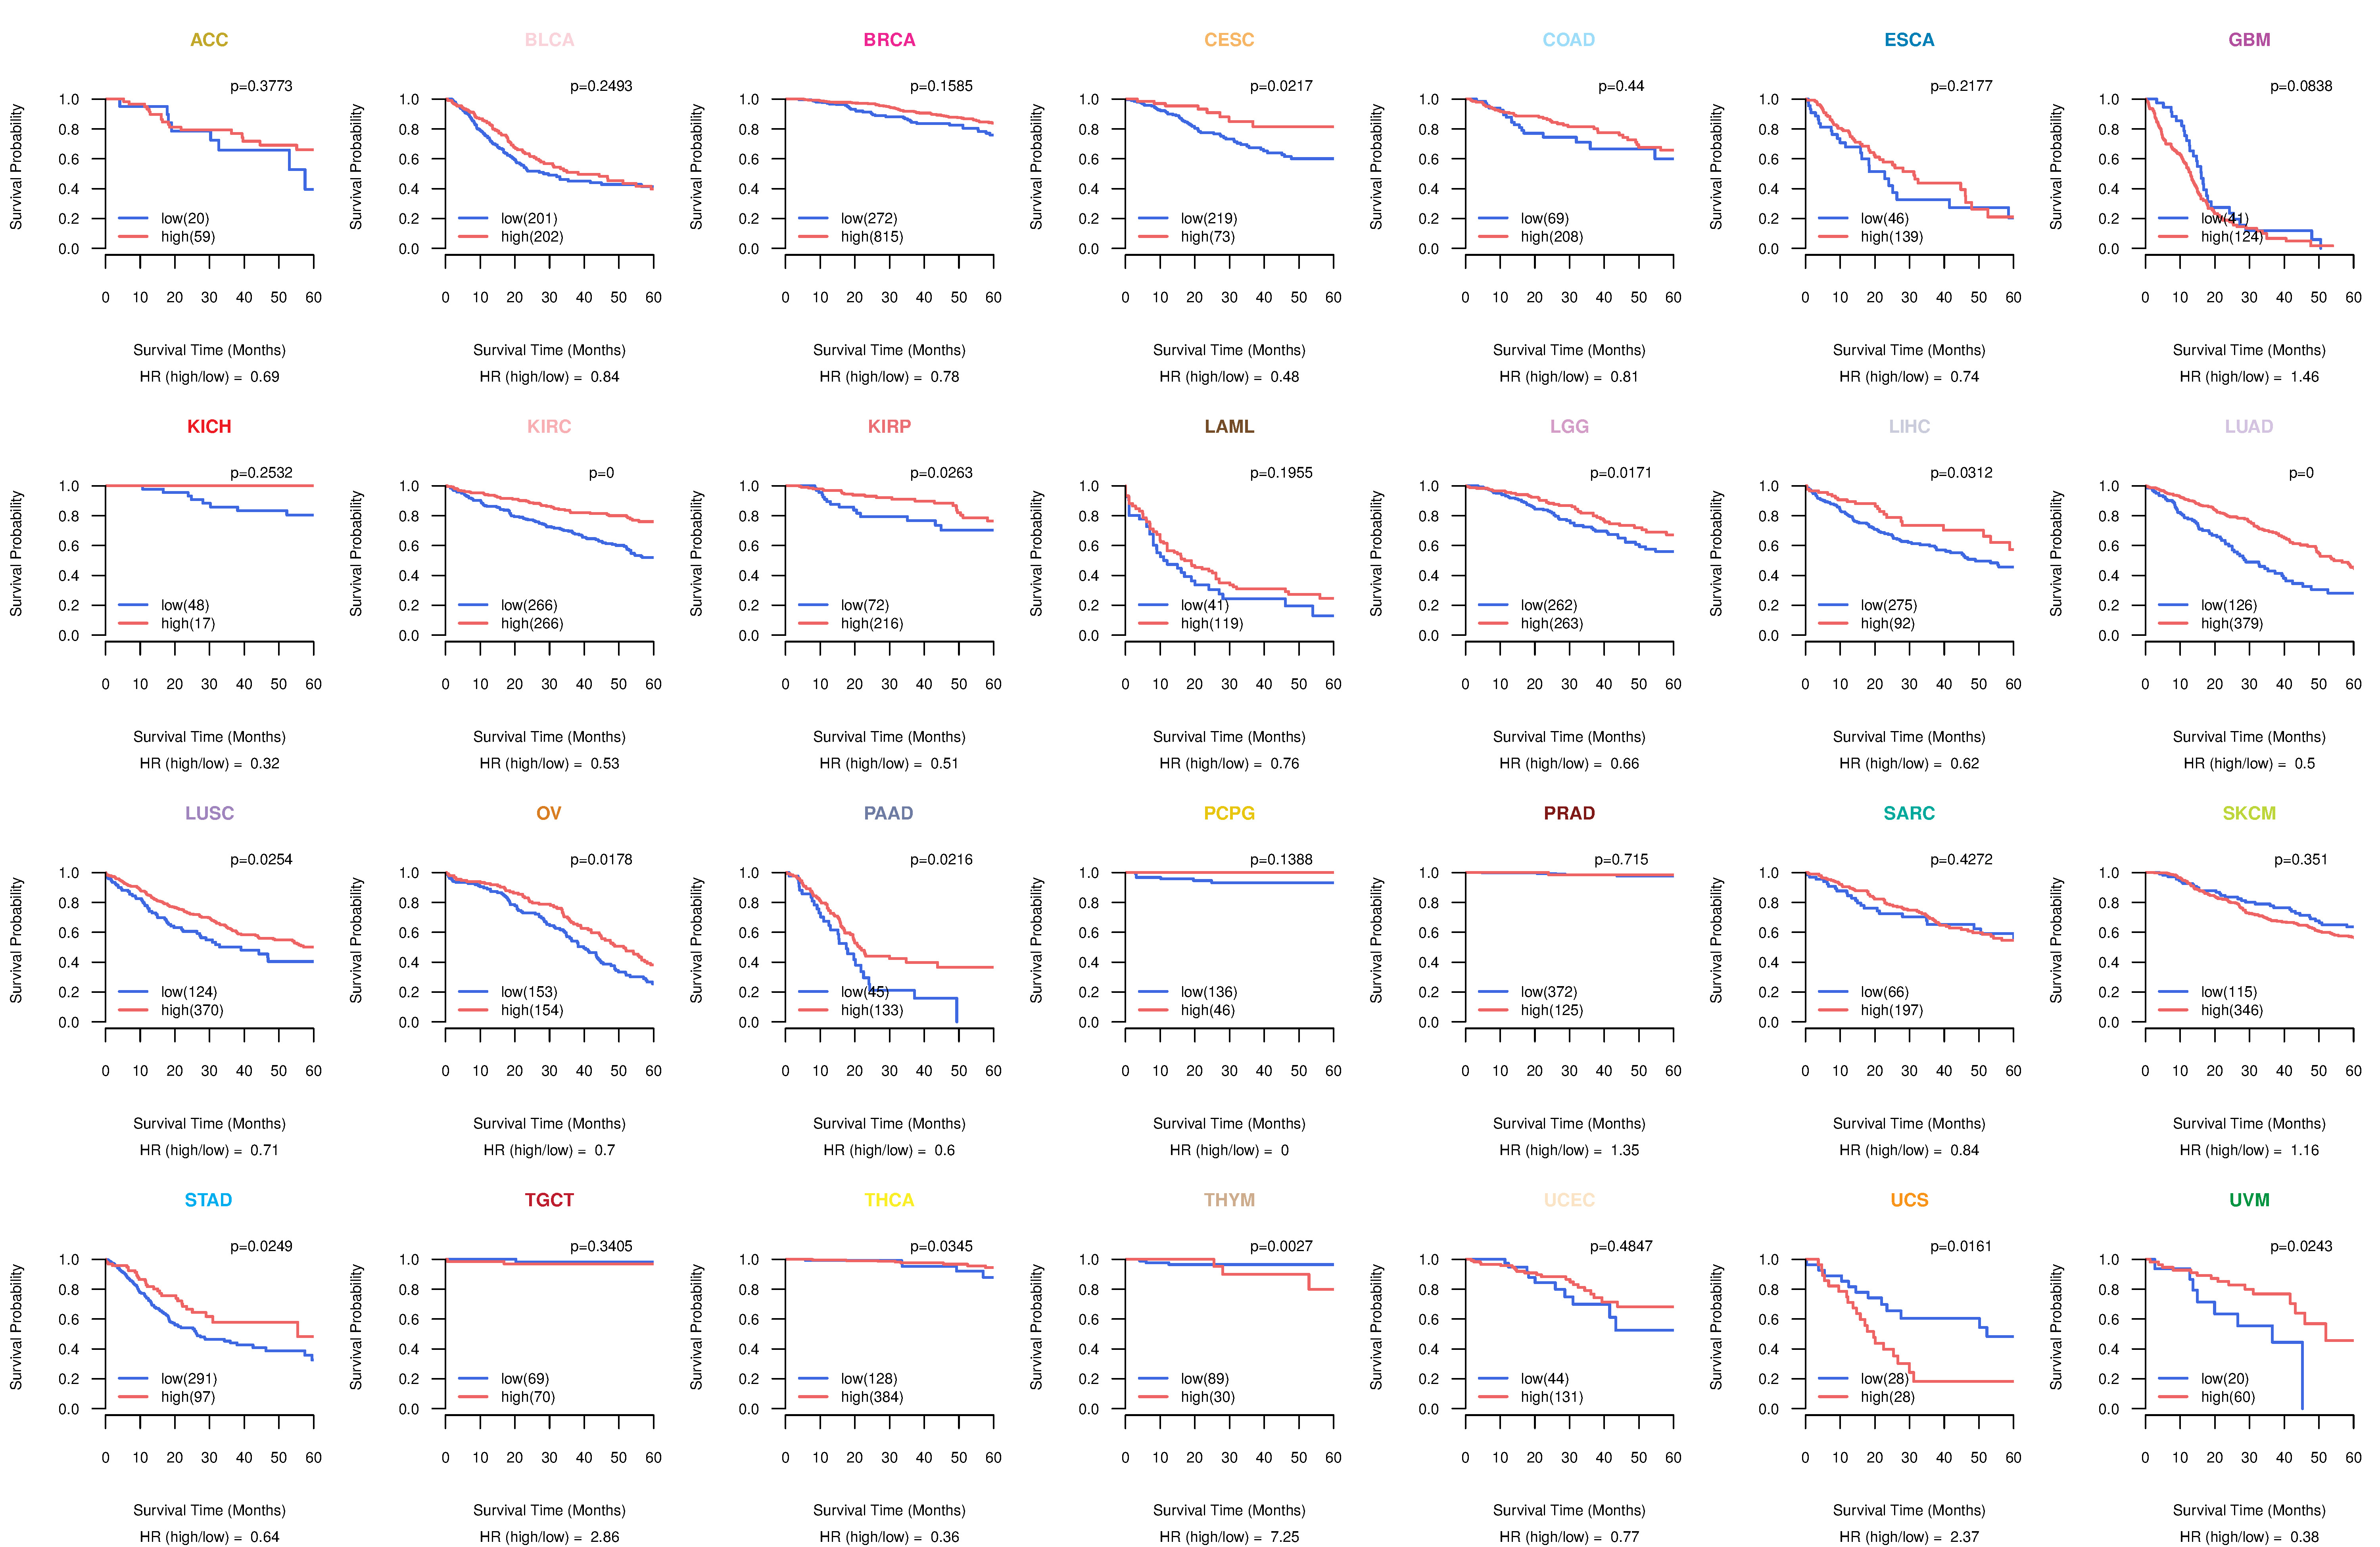
| Kaplan-Meier plots with logrank tests of overall survival (OS) using 28 cancer types (TCGA IlluminaHiSeq_RNASeqV2, pan-cancer normalized log2(norm_counts+1) data, version 2016-08-16) (TCGA clinicalMatrix, phenotype data, version 2016-04-27) * Click on the image to enlarge it in a new window. |
 |
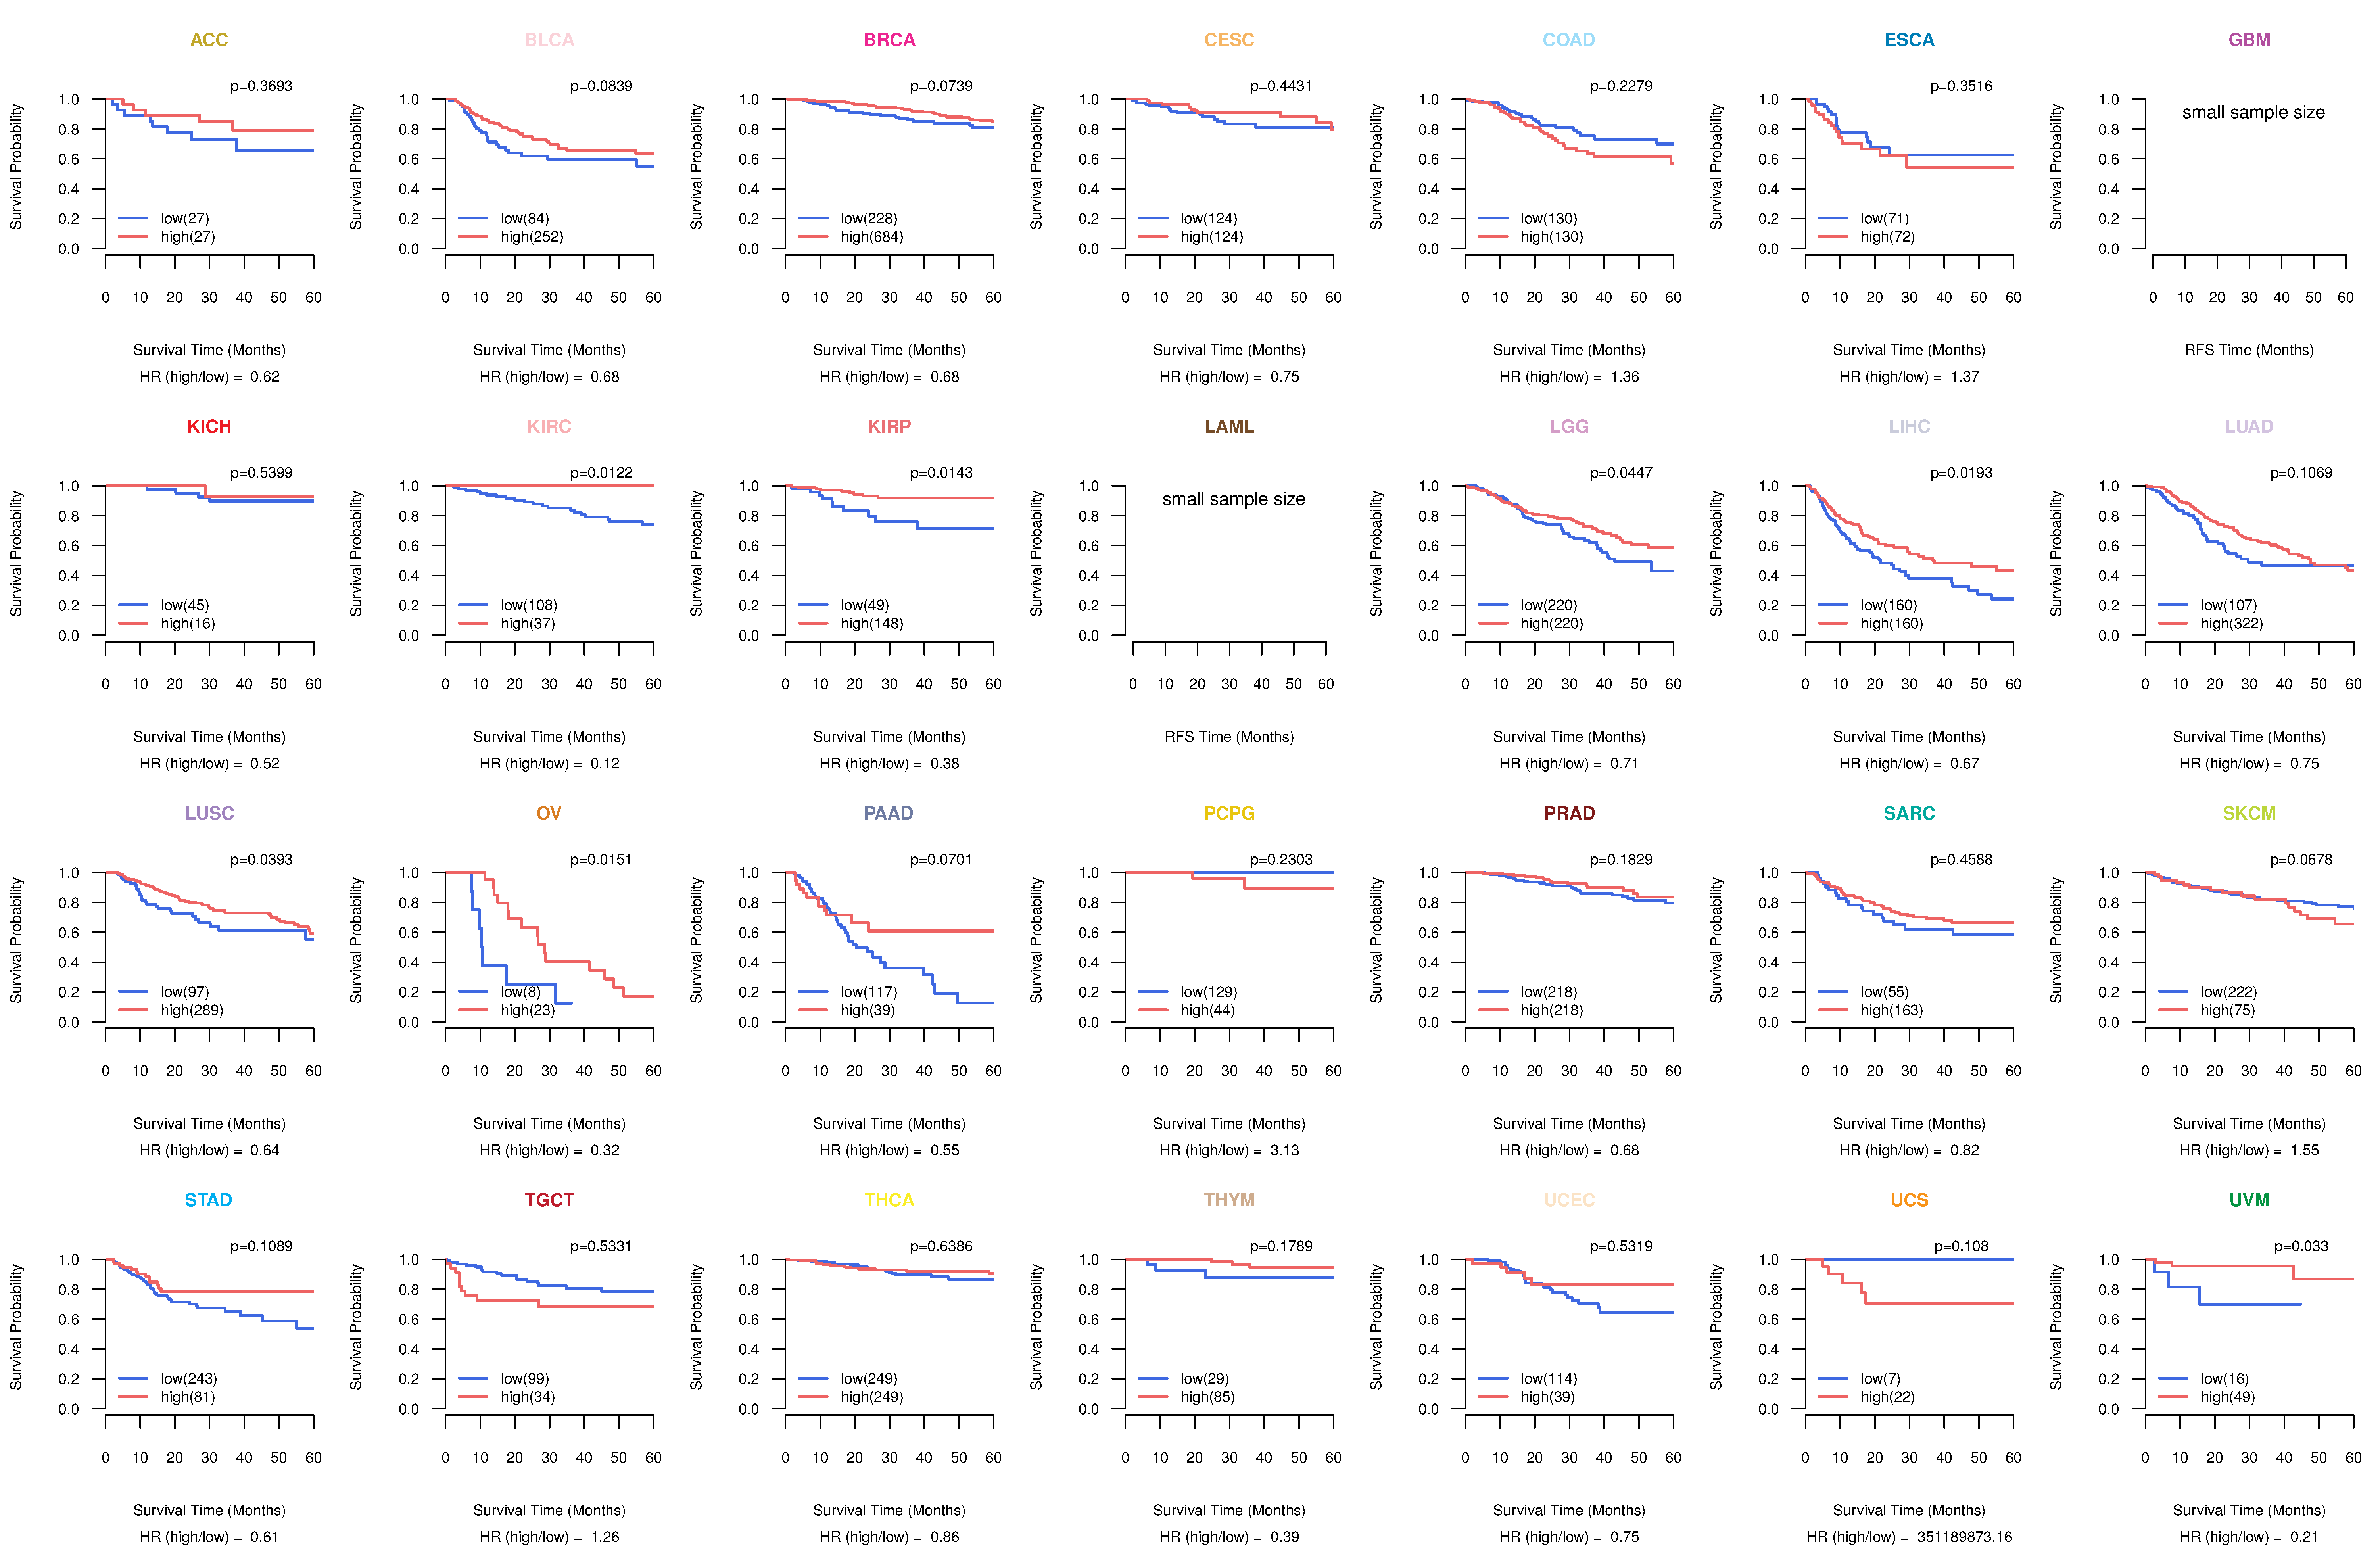
| Kaplan-Meier plots with logrank test of relapse free survival (RFS) using 28 cancer types (TCGA IlluminaHiSeq_RNASeqV2, pan-cancer normalized log2(norm_counts+1) data, version 2016-08-16) (TCGA clinicalMatrix, phenotype data, version 2016-04-27) * Click on the image enlarge it in a new window. |
 |
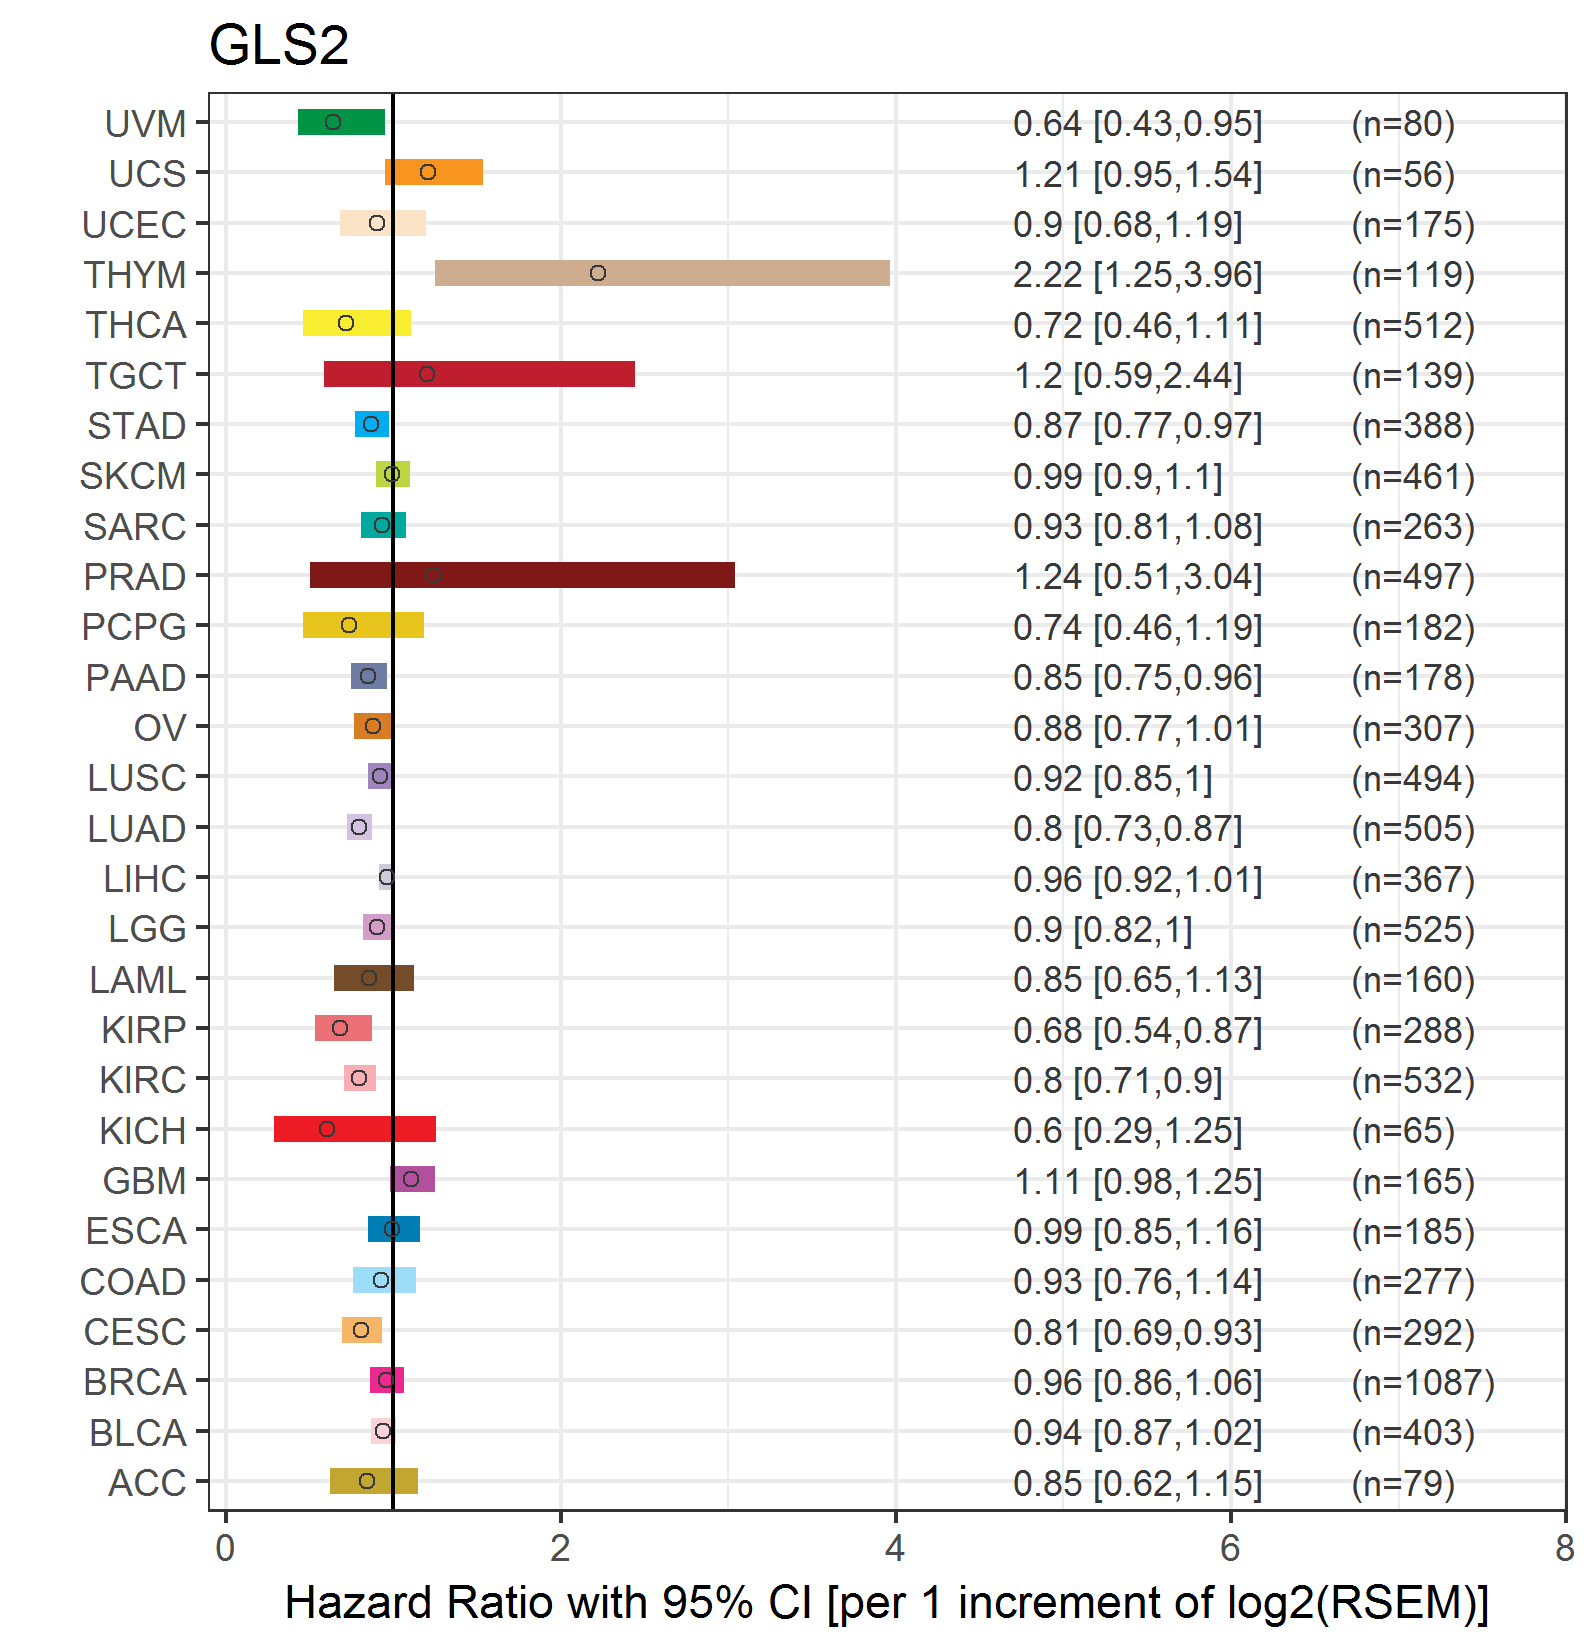
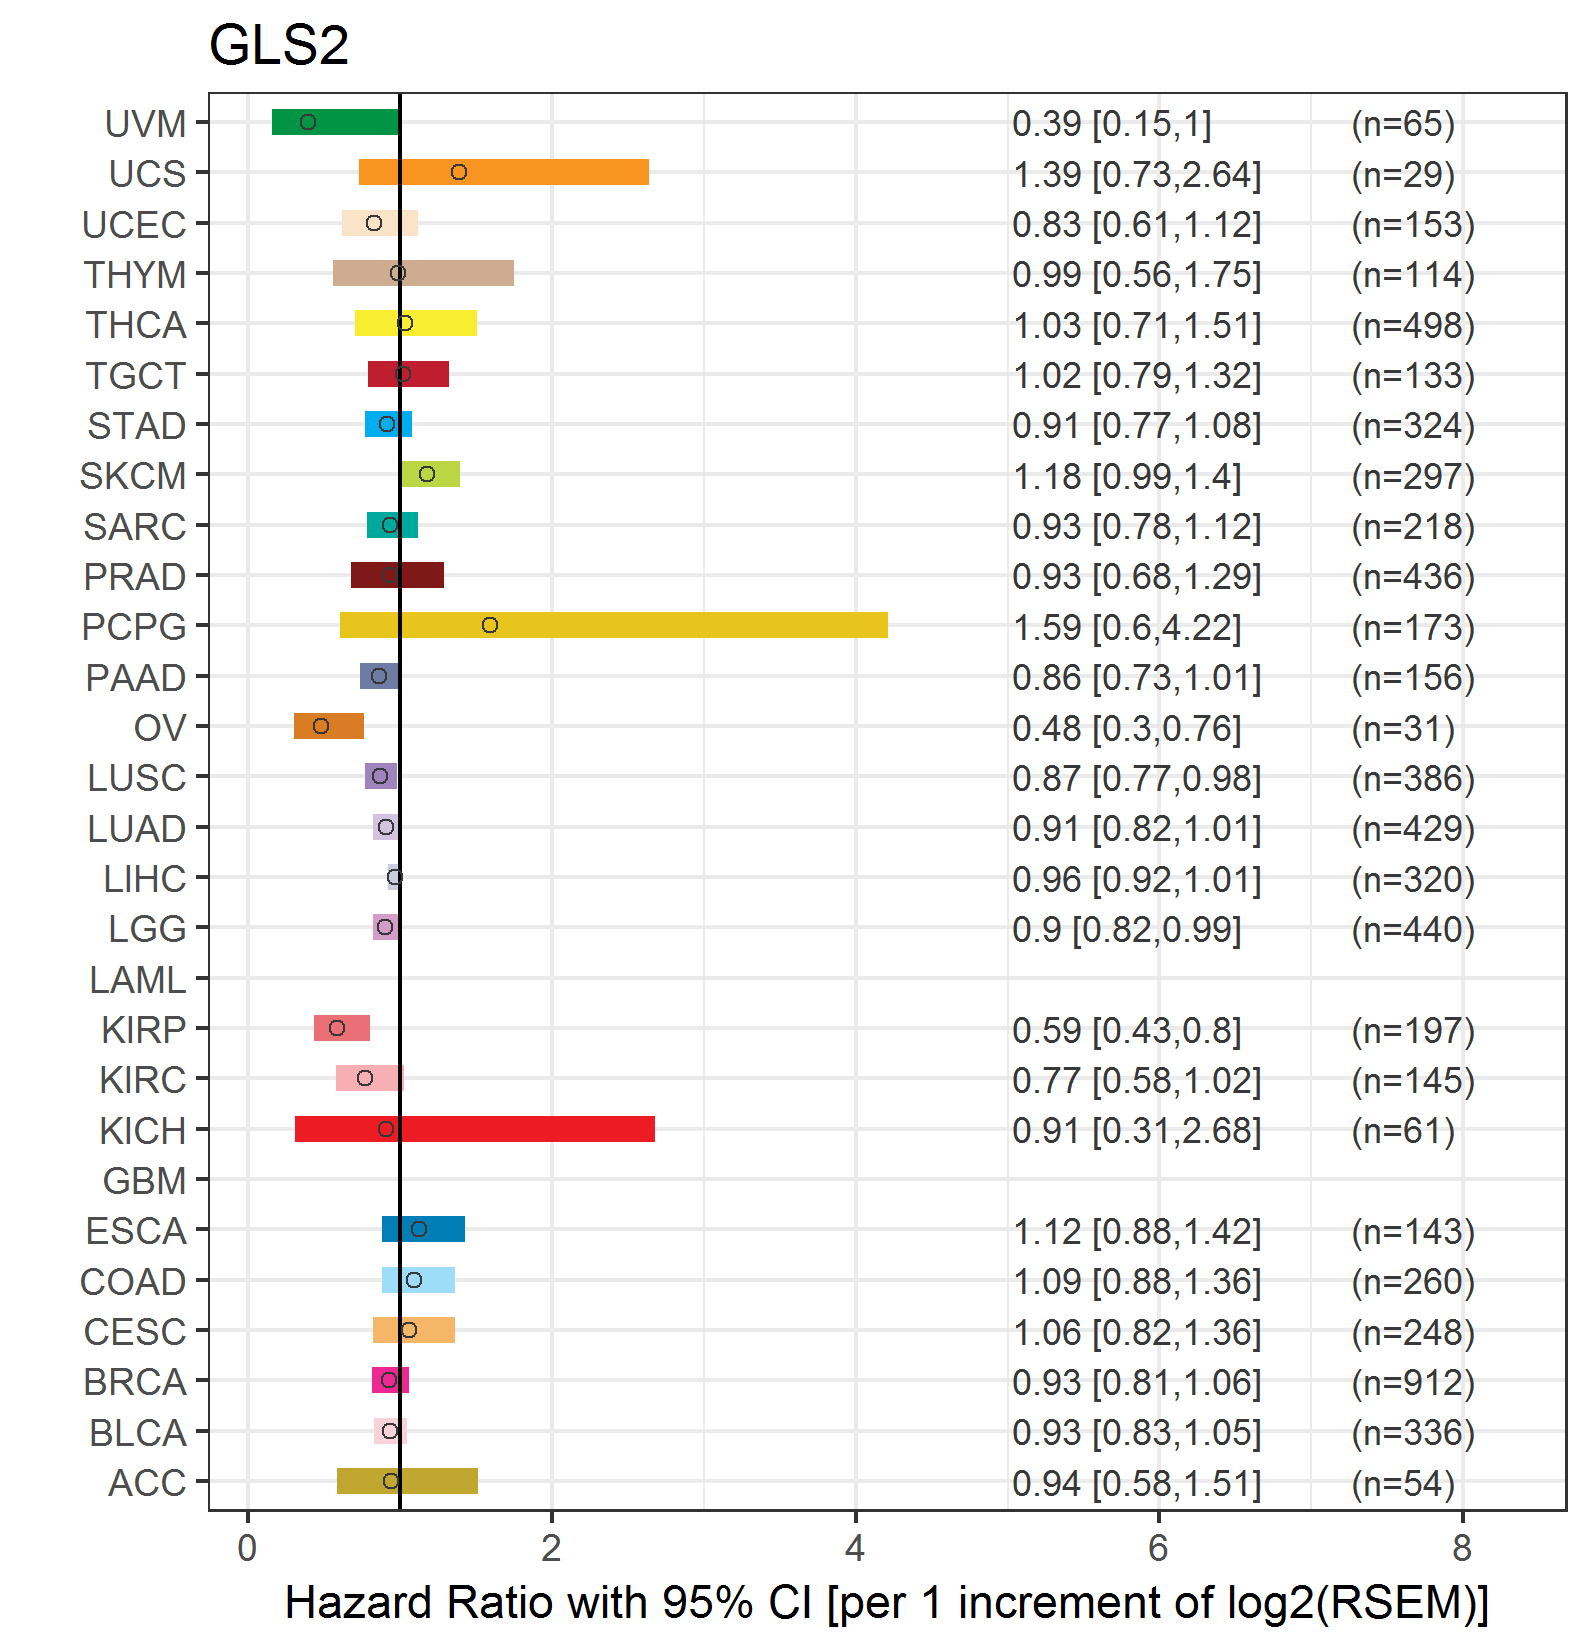
| Forest plot of Cox proportional hazard ratio (HR) and 95% CI of overall survival (OS) using 28 cancer types (TCGA IlluminaHiSeq_RNASeqV2, pan-cancer normalized log2(norm_counts+1) data, version 2016-08-16) (TCGA clinicalMatrix, phenotype data, version 2016-04-27) * Click on the image enlarge it in a new window. |
 |
| Forest plot of Cox proportional hazard ratio (HR) and 95% CI of relapse free survival (RFS) using 28 cancer types (TCGA IlluminaHiSeq_RNASeqV2, pan-cancer normalized log2(norm_counts+1) data, version 2016-08-16) (TCGA clinicalMatrix, phenotype data, version 2016-04-27) * Click on the image enlarge it in a new window. |
 |
| Top |
| TissGeneClin for GLS2 |
| TissGeneDrug for GLS2 |
| Drug information targeting TissGene (DrugBank Version 5.0.6, 2017-04-01) |
| DrugBank ID | Drug name | Drug activity | Drug type | Drug status |
| Top |
| TissGeneDisease for GLS2 |
| Disease information associated with TissGene (DisGeNet, 2016-06-01) |
| Disease ID | Disease name | # pubmeds | Source |
| umls:C0003873 | Rheumatoid Arthritis | 2 | BeFree |
| umls:C0019151 | Hepatic Encephalopathy | 2 | BeFree |
| umls:C0085207 | Gestational Diabetes | 2 | BeFree |
| umls:C0596263 | Carcinogenesis | 2 | BeFree |
| umls:C2239176 | Liver carcinoma | 2 | BeFree |
| umls:C0004114 | Astrocytoma | 1 | BeFree |
| umls:C0005684 | Malignant neoplasm of urinary bladder | 1 | BeFree |
| umls:C0007102 | Malignant tumor of colon | 1 | BeFree |
| umls:C0007131 | Non-Small Cell Lung Carcinoma | 1 | BeFree |
| umls:C0007138 | Carcinoma, Transitional Cell | 1 | BeFree |
| umls:C0014474 | Ependymoma | 1 | BeFree |
| umls:C0014544 | Epilepsy | 1 | BeFree |
| umls:C0014556 | Epilepsy, Temporal Lobe | 1 | BeFree |
| umls:C0017636 | Glioblastoma | 1 | BeFree |
| umls:C0017638 | Glioma | 1 | BeFree |
| umls:C0023890 | Liver Cirrhosis | 1 | BeFree |
| umls:C0023903 | Liver neoplasms | 1 | BeFree |
| umls:C0028945 | oligodendroglioma | 1 | BeFree |
| umls:C0032962 | Pregnancy Complications | 1 | BeFree |
| umls:C0036341 | Schizophrenia | 1 | BeFree |
| umls:C0041296 | Tuberculosis | 1 | BeFree |
| umls:C0205768 | Subependymal Giant Cell Astrocytoma | 1 | BeFree |
| umls:C0206716 | Ganglioglioma | 1 | BeFree |
| umls:C0271650 | Impaired glucose tolerance | 1 | BeFree |
| umls:C0334590 | Anaplastic Oligodendroglioma | 1 | BeFree |
| umls:C0338106 | Adenocarcinoma of colon | 1 | BeFree |
| umls:C0497327 | Dementia | 1 | LHGDN |
| umls:C0555198 | Malignant Glioma | 1 | BeFree |
| umls:C0699790 | Colon Carcinoma | 1 | BeFree |
| umls:C0699885 | Carcinoma of bladder | 1 | BeFree |
| umls:C0751396 | Well Differentiated Oligodendroglioma | 1 | BeFree |
| umls:C1516170 | Cancer Cell Growth | 1 | BeFree |
| umls:C1623038 | Cirrhosis | 1 | BeFree |
| umls:C2145472 | Urothelial Carcinoma | 1 | BeFree |
|
Copyright 2016-Present - The University of Texas Health Science Center at Houston (UTHealth) Web File Viewing | How to Report, Fraud, Waste and Abuse | State of Texas | Statewide Search | Texas Homeland Security | Site Policies |