 |
| |
| |
| |
| |
| |
| |
|

| TissGeneSummary for RBMXL2 |
 Gene summary Gene summary |
| Basic gene information | Gene symbol | RBMXL2 |
| Gene name | RNA binding motif protein, X-linked-like 2 | |
| Synonyms | HNRNPG-T|HNRNPGT|HNRPGT | |
| Cytomap | UCSC genome browser: 11p15 | |
| Type of gene | protein-coding | |
| RefGenes | NM_014469.4, | |
| Description | RNA-binding motif protein, X-linked-like-2heterogeneous nuclear ribonucleoprotein G ThnRNP G-Ttestes specific heterogenous nuclear ribonucleoprotein G Ttestes-specific heterogenous nuclear ribonucleoprotein G-Ttestis-specific heterogeneous nuclear ri | |
| Modification date | 20141207 | |
| dbXrefs | MIM : 605444 | |
| HGNC : HGNC | ||
| Ensembl : ENSG00000170748 | ||
| HPRD : 05672 | ||
| Vega : OTTHUMG00000165509 | ||
| Protein | UniProt: go to UniProt's Cross Reference DB Table | |
| Expression | CleanEX: HS_RBMXL2 | |
| BioGPS: 27288 | ||
| Pathway | NCI Pathway Interaction Database: RBMXL2 | |
| KEGG: RBMXL2 | ||
| REACTOME: RBMXL2 | ||
| Pathway Commons: RBMXL2 | ||
| Context | iHOP: RBMXL2 | |
| ligand binding site mutation search in PubMed: RBMXL2 | ||
| UCL Cancer Institute: RBMXL2 | ||
| Assigned class in TissGDB* | B | |
| Included tissue-specific gene expression resources | HPA,TiGER,GTEx | |
| Specific-tissues in normal samples (assigned by TissGDB using HPA, TiGER, and GTEx) | Testis | |
| Cancer types related to the specific-tissues in cancer samples (assigned by TissGDB using TCGA) | TGCT | |
| Reference showing the relevant tissue of RBMXL2 | ||
| Description by TissGene annotations | TissgsKTS CNV lost TissGeneKTS | |
| * Class A consists of genes with literature evidence and is part of the cTissGenes. Class B consists of only cTissGenes without additional evidence. The remaining genes belong to Class C. |
| Gene ontology having evidence of Inferred from Direct Assay (IDA) from Entrez |
| GO ID | GO term | PubMed ID |
| Top |
| TissGeneExp for RBMXL2 |
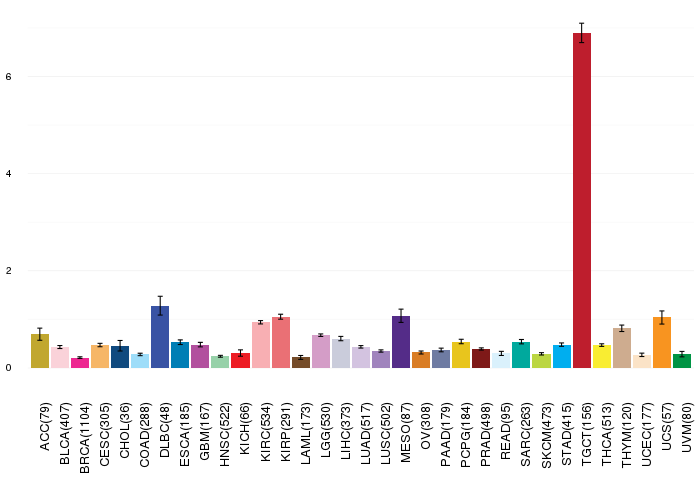
| Gene expressions across 28 cancer types (X-axis: cancer type and Y-axis: log2(norm_counts+1)) (TCGA IlluminaHiSeq_RNASeqV2, pan-cancer normalized log2(norm_counts+1) data, version 2016-08-16) |
 |
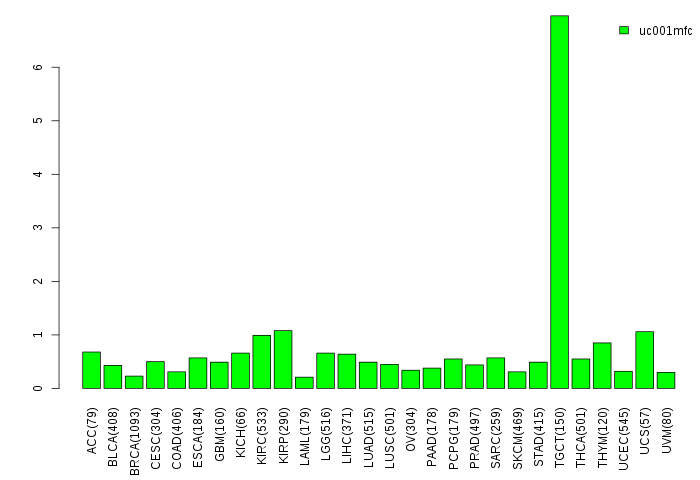
| Gene isoform expressions across 28 cancer types (X-axis: cancer type and Y-axis: log2(norm_counts+1)) (TCGA pan-cancer tcga_rsem_isoform_tpm, version 2016-09-01) |
 |
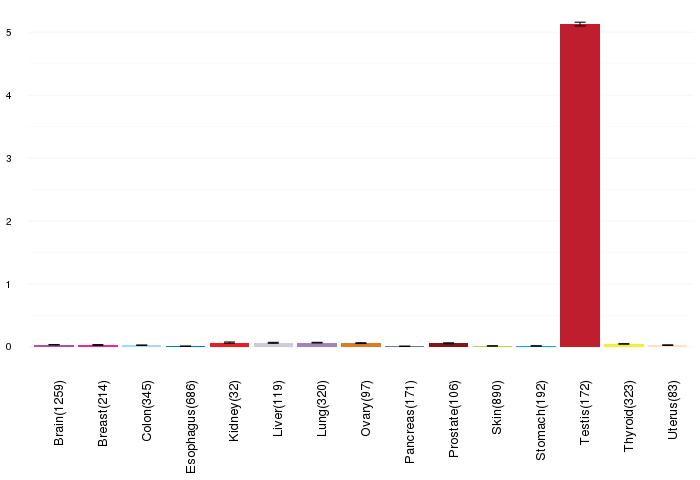
| Gene expressions across normal tissues of GTEx data (GTEx GTEx_Analysis_v6_RNA-seq_RNA-SeQCv1.1.8_gene_rpkm.gct) - Here, we shows the matched tissue types only among our 28 cancer types. |
 |
| Different expressions across 14 cancer types with more than 10 samples between matched tumors and normals (X-axis: cancer type and Y-axis: log2(norm_counts+1)) (TCGA IlluminaHiSeq_RNASeqV2, pan-cancer normalized log2(norm_counts+1) data, version 2016-08-16) |
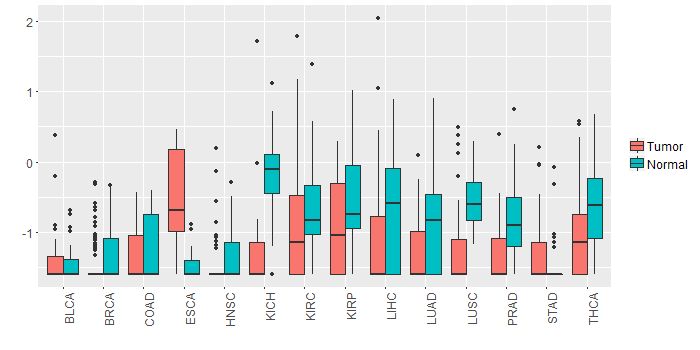 |
| - Significantly differentially expressed cancer types and information. (|Fold change|>1 and FDR<0.05) |
| Cancer type | Mean(exp) in tumor | Mean(exp) in matched normal | Log2FC | P-val. | FDR |
| KICH | -1.223165272 | -0.219305272 | -1.00386 | 2.78E-06 | 9.69E-06 |
| Top |
| TissGene-miRNA for RBMXL2 |
| Significantly anti-correlated miRNAs of TissGene across 28 cancer types (Gene-miRNA relations from TargetScanHuman Relsease 7.1, Conserved_Site_Context_Scores.txt.zip, 06.01.2016) (TCGA IlluminaHiSeq_miRNASeq, log2(RPM+1) data, version 2016-11-21) (TCGA IlluminaHiSeq_RNASeqV2, log2(normalized_count+1) data, version 2016-08-16) (Spearman’s Rank Correlation (p-value<0.05 and coefficient<-0.25)) |
| Cancer type | miRNA id | miRNA accession | P-val. | Coeff. | # samples |
| Top |
| TissGeneMut for RBMXL2 |
| TissGeneSNV for RBMXL2 |
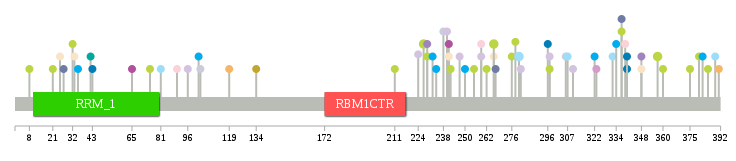
| nsSNV counts per each loci. Different colors of circles represent different cancer types. Circle size denotes number of samples. (TCGA somatic mutation (SNPs and small INDELs) data, version 2016-04-25) * Click on the image to enlarge it in a new window. |
 |
 |
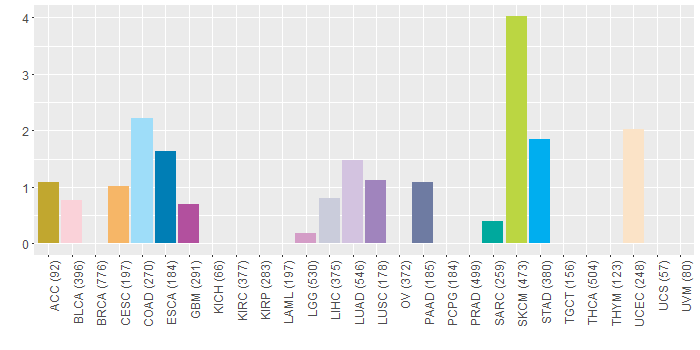
| Somatic nucleotide variants of TissGene across 28 cancer types (X-axis: cancer type and Y-axis: % of mutated samples) The numbers in parentheses are numbers of samples with mutation (nsSNVs). (TCGA somatic mutation (SNPs and small INDELs) data, version 2016-04-25) |
 |
| - nsSNVs sorted by frequency. |
| AAchange | Cancer type | # samples |
| p.R266C | SKCM | 2 |
| p.R280Q | COAD | 2 |
| p.G357S | SKCM | 2 |
| p.E227K | SKCM | 2 |
| p.G32D | SKCM | 1 |
| p.G380R | SKCM | 1 |
| p.D75N | SKCM | 1 |
| p.D250V | STAD | 1 |
| p.R389W | COAD | 1 |
| p.G306C | LIHC | 1 |
| p.V81M | COAD | 1 |
| p.E21K | SKCM | 1 |
| p.G375S | SKCM | 1 |
| p.P96Q | LUAD | 1 |
| p.R348S | LUSC | 1 |
| p.D267N | PAAD | 1 |
| p.R323C | LGG | 1 |
| p.D251N | HNSC | 1 |
| p.R340* | ESCA | 1 |
| p.R385K | SKCM | 1 |
| p.G8R | SKCM | 1 |
| p.G297V | LUAD | 1 |
| p.D211N | SKCM | 1 |
| p.G339D | BLCA | 1 |
| p.D42G | SARC | 1 |
| p.V35I | STAD | 1 |
| p.S234L | STAD | 1 |
| p.S337L | SKCM | 1 |
| p.G262S | SKCM | 1 |
| p.P360S | SKCM | 1 |
| p.E25K | UCEC | 1 |
| p.R266H | UCEC | 1 |
| p.E281D | LUAD | 1 |
| p.R104H | HNSC | 1 |
| p.R332Q | COAD | 1 |
| p.R43Q | ESCA | 1 |
| p.R307H | COAD | 1 |
| p.R119W | CESC | 1 |
| p.R391T | CESC | 1 |
| p.D259Y | LUAD | 1 |
| p.E310D | LUAD | 1 |
| p.G297R | SKCM | 1 |
| p.D259N | BLCA | 1 |
| p.S247C | LUAD | 1 |
| p.R340X | ESCA | 1 |
| p.R382C | STAD | 1 |
| p.E90K | BLCA | 1 |
| p.A232V | STAD | 1 |
| p.H240Q | LUAD | 1 |
| p.R296W | ESCA | 1 |
| p.R241H | UCEC | 1 |
| p.R241H | GBM | 1 |
| p.R93W | HNSC | 1 |
| p.A65V | GBM | 1 |
| p.Y238H | LIHC | 1 |
| p.R33H | UCEC | 1 |
| p.R348C | UCEC | 1 |
| p.S222R | HNSC | 1 |
| p.S278F | SKCM | 1 |
| p.R229Q | LUSC | 1 |
| p.R255K | SKCM | 1 |
| p.R276K | SKCM | 1 |
| p.R102C | STAD | 1 |
| p.D224E | LUAD | 1 |
| p.D334N | STAD | 1 |
| p.P299S | HNSC | 1 |
| p.R229Q | SKCM | 1 |
| p.T134A | ACC | 1 |
| p.R367Q | HNSC | 1 |
| p.S337L | PAAD | 1 |
| p.R332Q | HNSC | 1 |
| p.G103S | LIHC | 1 |
| p.R367L | DLBC | 1 |
| p.E27K | PAAD | 1 |
| p.D242N | SKCM | 1 |
| p.G322S | STAD | 1 |
| Top |
| TissGeneCNV for RBMXL2 |
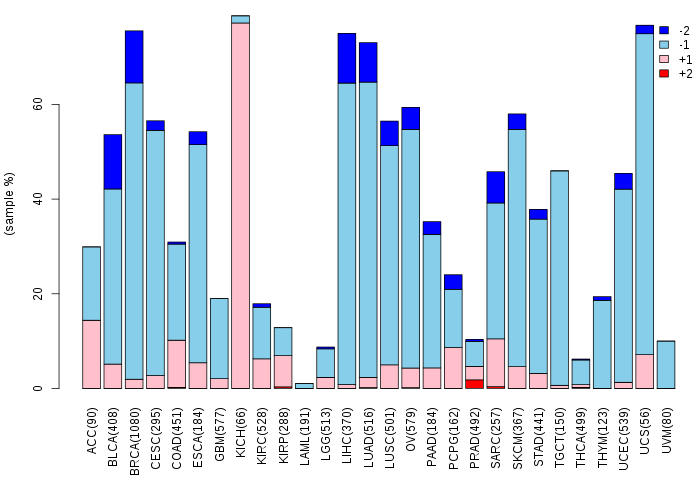
| Copy number variations of TissGene across 28 cancer types (X-axis: cancer type and Y-axis: % of CNV samples) (TCGA Gistic2_CopyNumber_Gistic2_all_data_by_genes, Gistic2 copy number data, version 2016-08-16) |
 |
| Top |
| TissGeneFusions for RBMXL2 |
| Fusion genes including TissGene (ChimerDB 3.0, 2016-12-01 and TCGA fusion Portal 2015-12-01) |
| Database | Src | Cancer type | Sample | Fusion gene | ORF | 5'-gene BP | 3'-gene BP |
| Top |
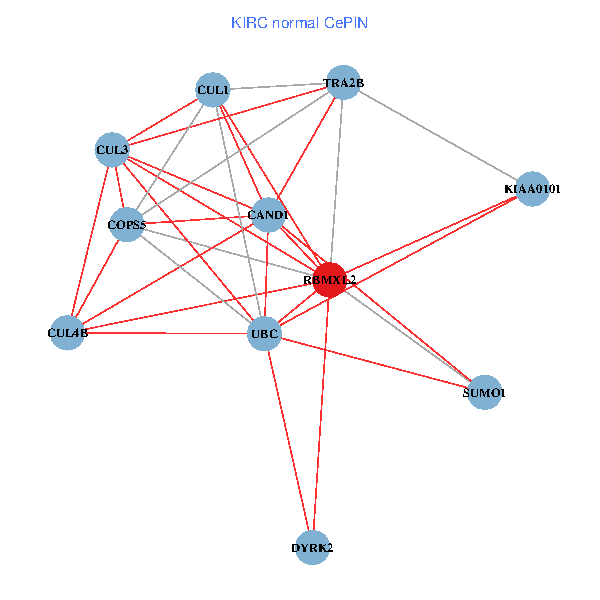
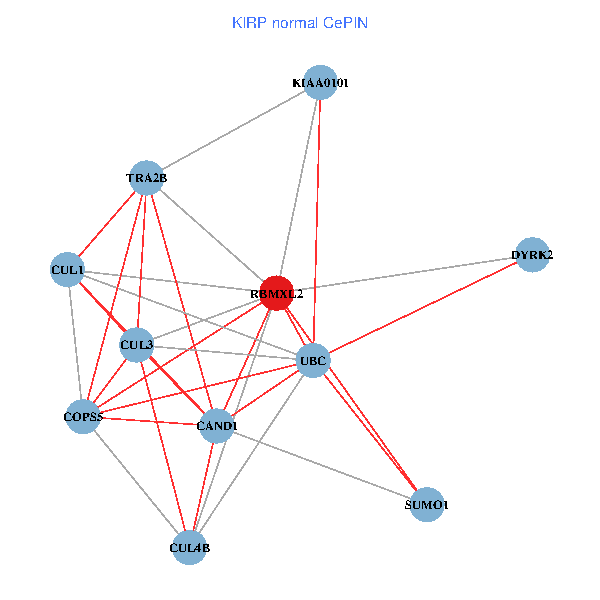
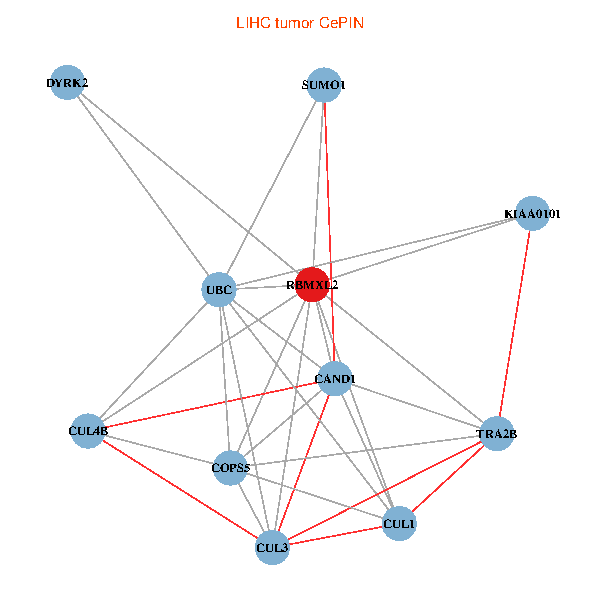
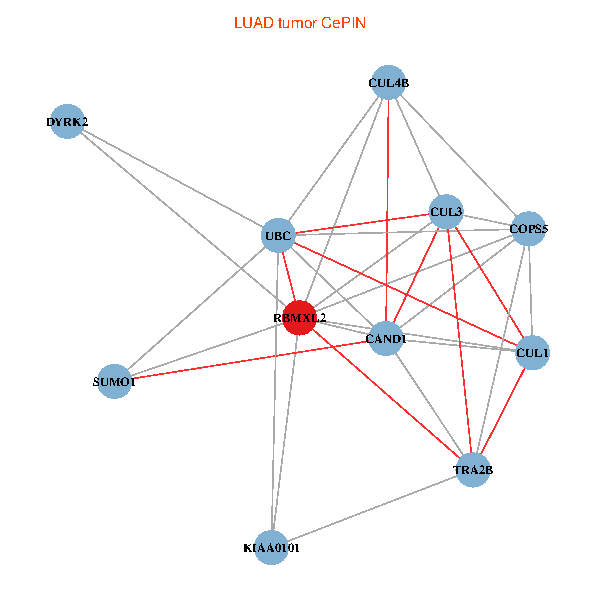
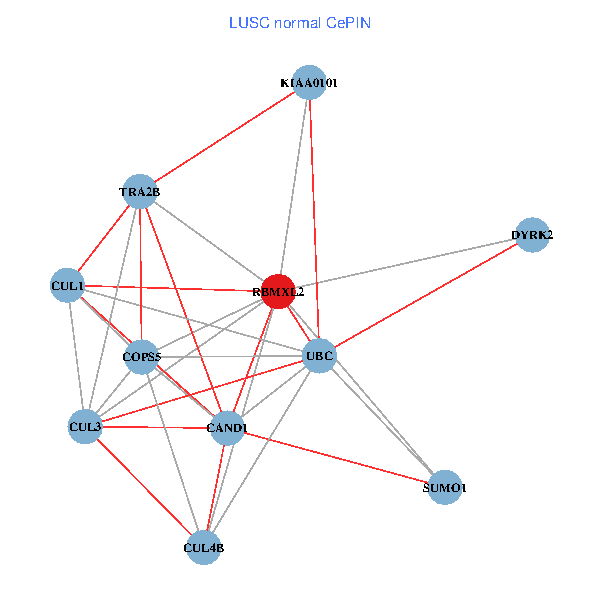
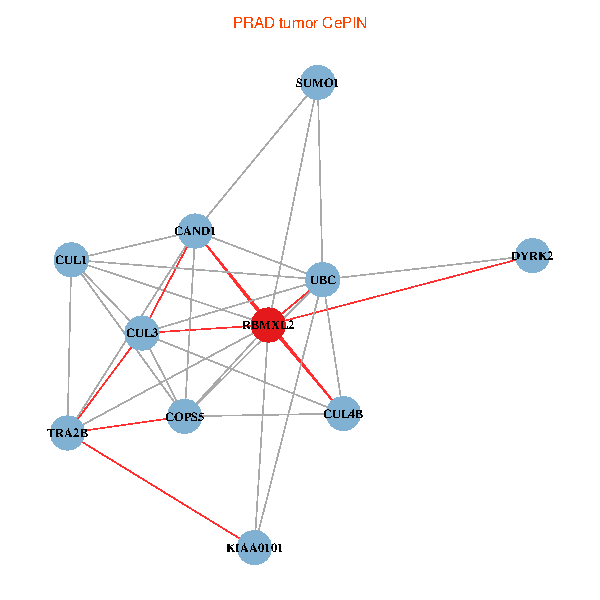
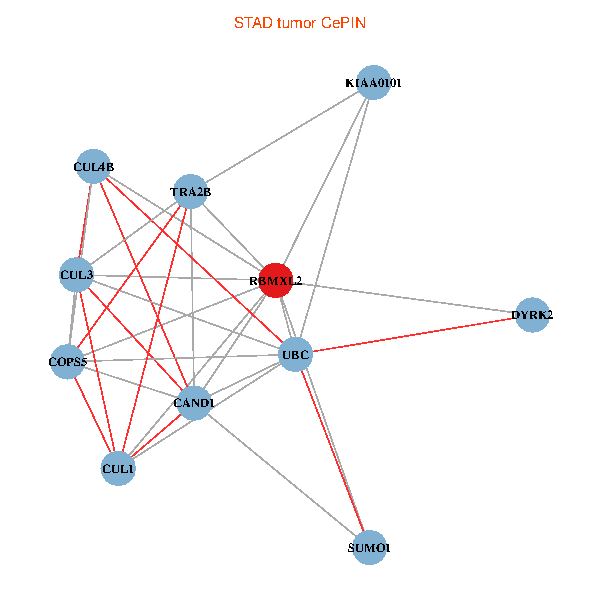
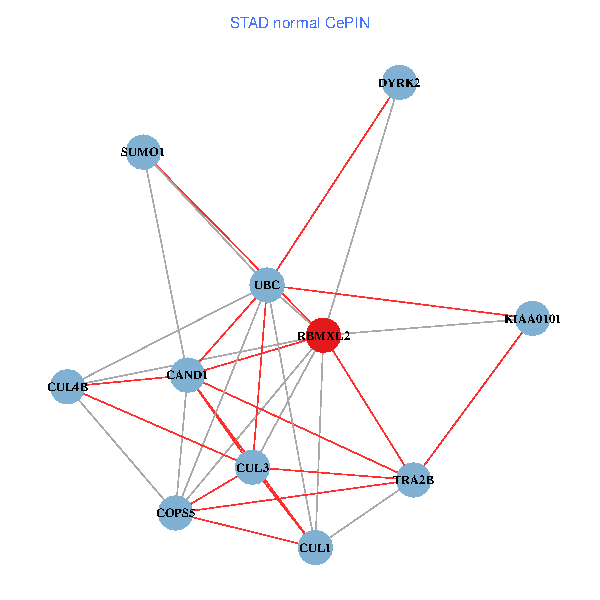
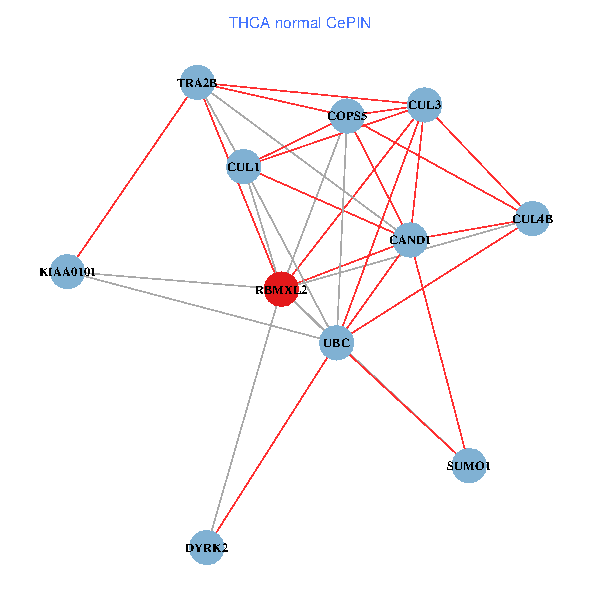
| TissGeneNet for RBMXL2 |
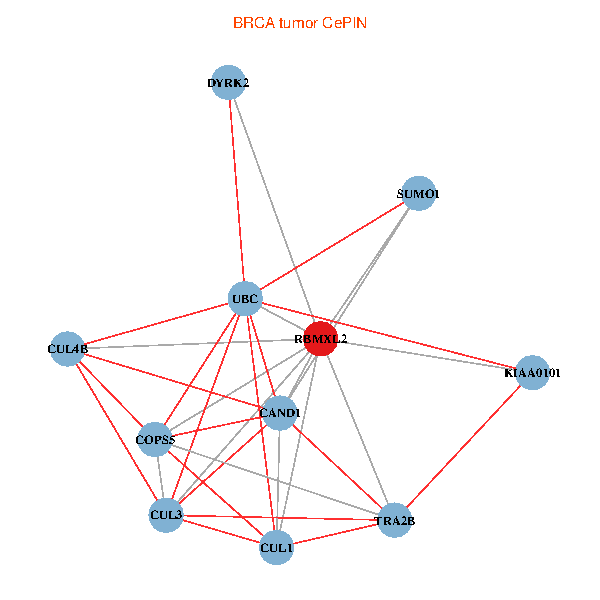
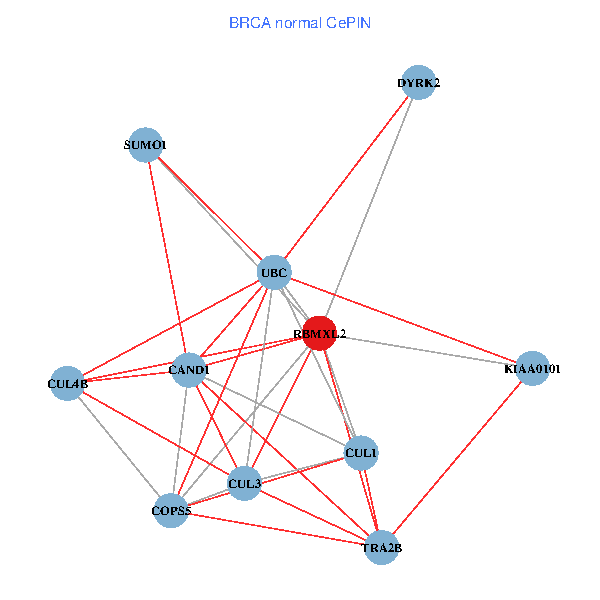
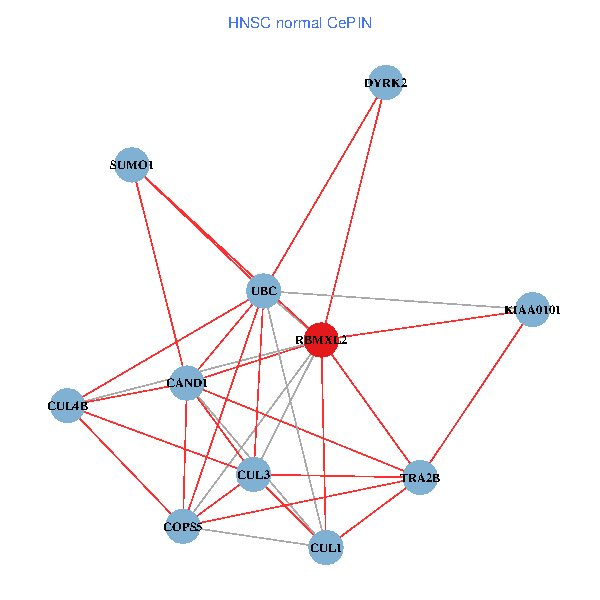
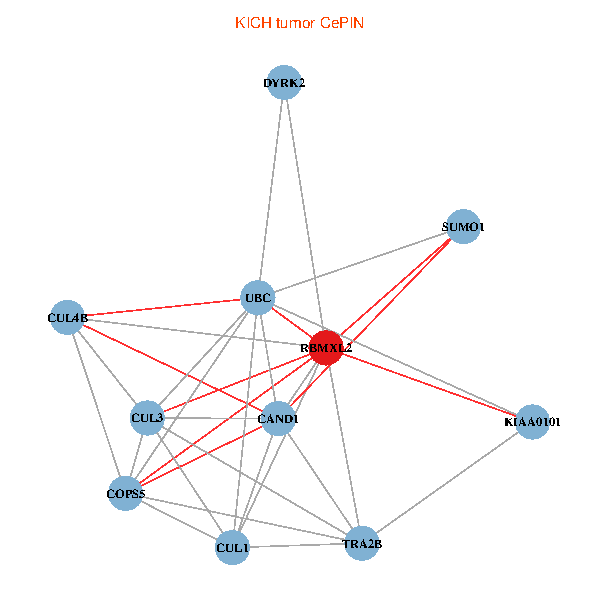
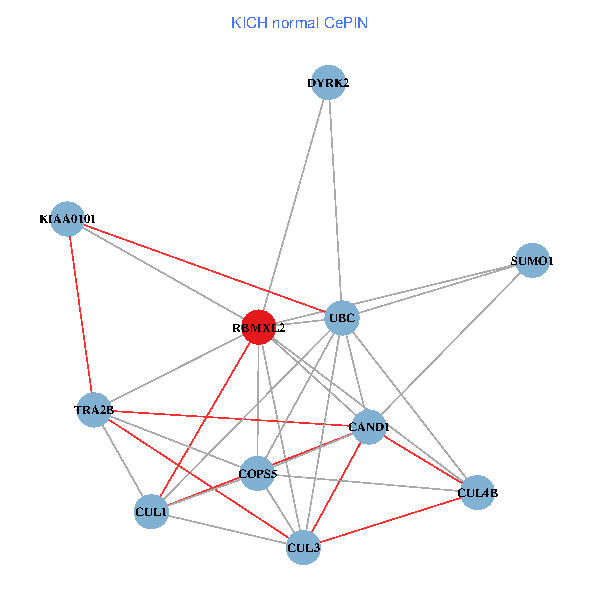
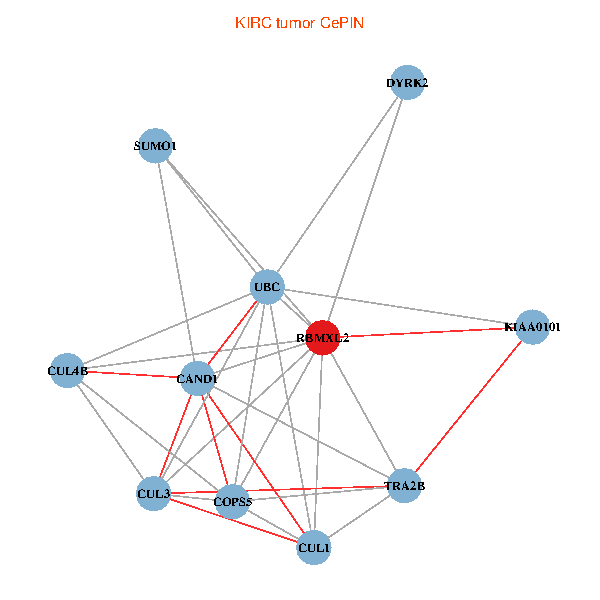
| Co-expressed gene networks based on protein-protein interaction data (CePIN) (TCGA IlluminaHiSeq_RNASeqV2, pan-cancer normalized log2(norm_counts+1) data, version 2016-08-16) (PINA2 ppi data) |
| BRCA (tumor) | BRCA (normal) |
| RBMXL2, CAND1, UBC, KIAA0101, CUL4B, CUL3, SUMO1, CUL1, COPS5, DYRK2, TRA2B (tumor) | RBMXL2, CAND1, UBC, KIAA0101, CUL4B, CUL3, SUMO1, CUL1, COPS5, DYRK2, TRA2B (normal) |
 |  |
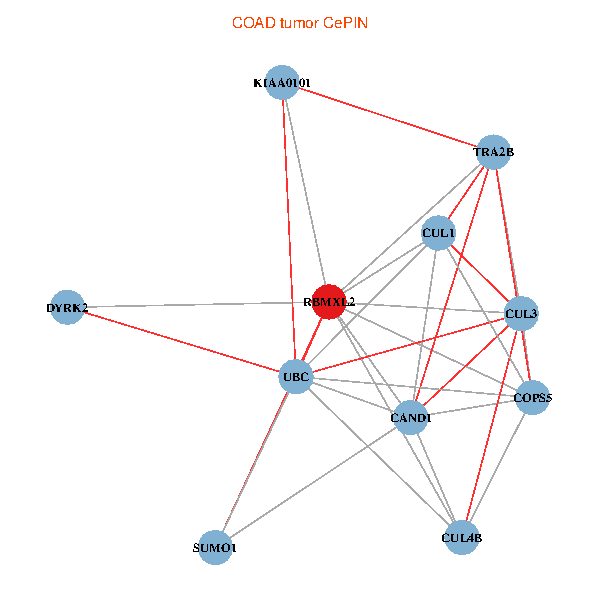
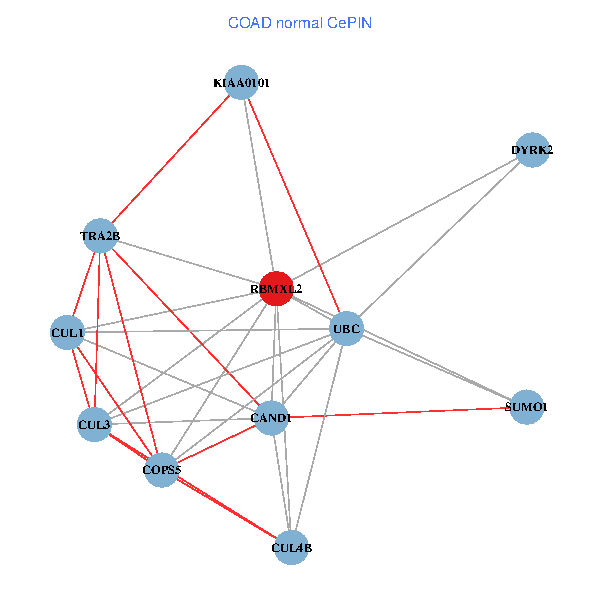
| COAD (tumor) | COAD (normal) |
| RBMXL2, CAND1, UBC, KIAA0101, CUL4B, CUL3, SUMO1, CUL1, COPS5, DYRK2, TRA2B (tumor) | RBMXL2, CAND1, UBC, KIAA0101, CUL4B, CUL3, SUMO1, CUL1, COPS5, DYRK2, TRA2B (normal) |
 |  |
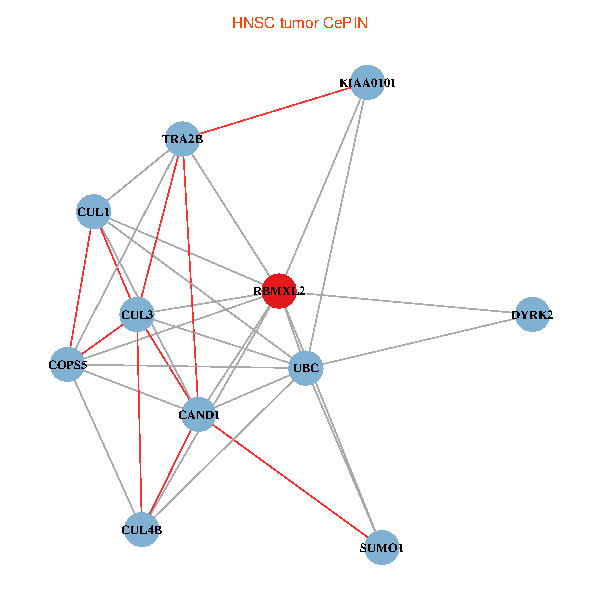
| HNSC (tumor) | HNSC (normal) |
| RBMXL2, CAND1, UBC, KIAA0101, CUL4B, CUL3, SUMO1, CUL1, COPS5, DYRK2, TRA2B (tumor) | RBMXL2, CAND1, UBC, KIAA0101, CUL4B, CUL3, SUMO1, CUL1, COPS5, DYRK2, TRA2B (normal) |
 |  |
| KICH (tumor) | KICH (normal) |
| RBMXL2, CAND1, UBC, KIAA0101, CUL4B, CUL3, SUMO1, CUL1, COPS5, DYRK2, TRA2B (tumor) | RBMXL2, CAND1, UBC, KIAA0101, CUL4B, CUL3, SUMO1, CUL1, COPS5, DYRK2, TRA2B (normal) |
 |  |
| KIRC (tumor) | KIRC (normal) |
| RBMXL2, CAND1, UBC, KIAA0101, CUL4B, CUL3, SUMO1, CUL1, COPS5, DYRK2, TRA2B (tumor) | RBMXL2, CAND1, UBC, KIAA0101, CUL4B, CUL3, SUMO1, CUL1, COPS5, DYRK2, TRA2B (normal) |
 |  |
| KIRP (tumor) | KIRP (normal) |
| RBMXL2, CAND1, UBC, KIAA0101, CUL4B, CUL3, SUMO1, CUL1, COPS5, DYRK2, TRA2B (tumor) | RBMXL2, CAND1, UBC, KIAA0101, CUL4B, CUL3, SUMO1, CUL1, COPS5, DYRK2, TRA2B (normal) |
 |  |
| LIHC (tumor) | LIHC (normal) |
| RBMXL2, CAND1, UBC, KIAA0101, CUL4B, CUL3, SUMO1, CUL1, COPS5, DYRK2, TRA2B (tumor) | RBMXL2, CAND1, UBC, KIAA0101, CUL4B, CUL3, SUMO1, CUL1, COPS5, DYRK2, TRA2B (normal) |
 |  |
| LUAD (tumor) | LUAD (normal) |
| RBMXL2, CAND1, UBC, KIAA0101, CUL4B, CUL3, SUMO1, CUL1, COPS5, DYRK2, TRA2B (tumor) | RBMXL2, CAND1, UBC, KIAA0101, CUL4B, CUL3, SUMO1, CUL1, COPS5, DYRK2, TRA2B (normal) |
 |  |
| LUSC (tumor) | LUSC (normal) |
| RBMXL2, CAND1, UBC, KIAA0101, CUL4B, CUL3, SUMO1, CUL1, COPS5, DYRK2, TRA2B (tumor) | RBMXL2, CAND1, UBC, KIAA0101, CUL4B, CUL3, SUMO1, CUL1, COPS5, DYRK2, TRA2B (normal) |
 |  |
| PRAD (tumor) | PRAD (normal) |
| RBMXL2, CAND1, UBC, KIAA0101, CUL4B, CUL3, SUMO1, CUL1, COPS5, DYRK2, TRA2B (tumor) | RBMXL2, CAND1, UBC, KIAA0101, CUL4B, CUL3, SUMO1, CUL1, COPS5, DYRK2, TRA2B (normal) |
 |  |
| STAD (tumor) | STAD (normal) |
| RBMXL2, CAND1, UBC, KIAA0101, CUL4B, CUL3, SUMO1, CUL1, COPS5, DYRK2, TRA2B (tumor) | RBMXL2, CAND1, UBC, KIAA0101, CUL4B, CUL3, SUMO1, CUL1, COPS5, DYRK2, TRA2B (normal) |
 |  |
| THCA (tumor) | THCA (normal) |
| RBMXL2, CAND1, UBC, KIAA0101, CUL4B, CUL3, SUMO1, CUL1, COPS5, DYRK2, TRA2B (tumor) | RBMXL2, CAND1, UBC, KIAA0101, CUL4B, CUL3, SUMO1, CUL1, COPS5, DYRK2, TRA2B (normal) |
 |  |
| Top |
| TissGeneProg for RBMXL2 |
| Kaplan-Meier plots with logrank tests of overall survival (OS) using 28 cancer types (TCGA IlluminaHiSeq_RNASeqV2, pan-cancer normalized log2(norm_counts+1) data, version 2016-08-16) (TCGA clinicalMatrix, phenotype data, version 2016-04-27) * Click on the image to enlarge it in a new window. |
 |
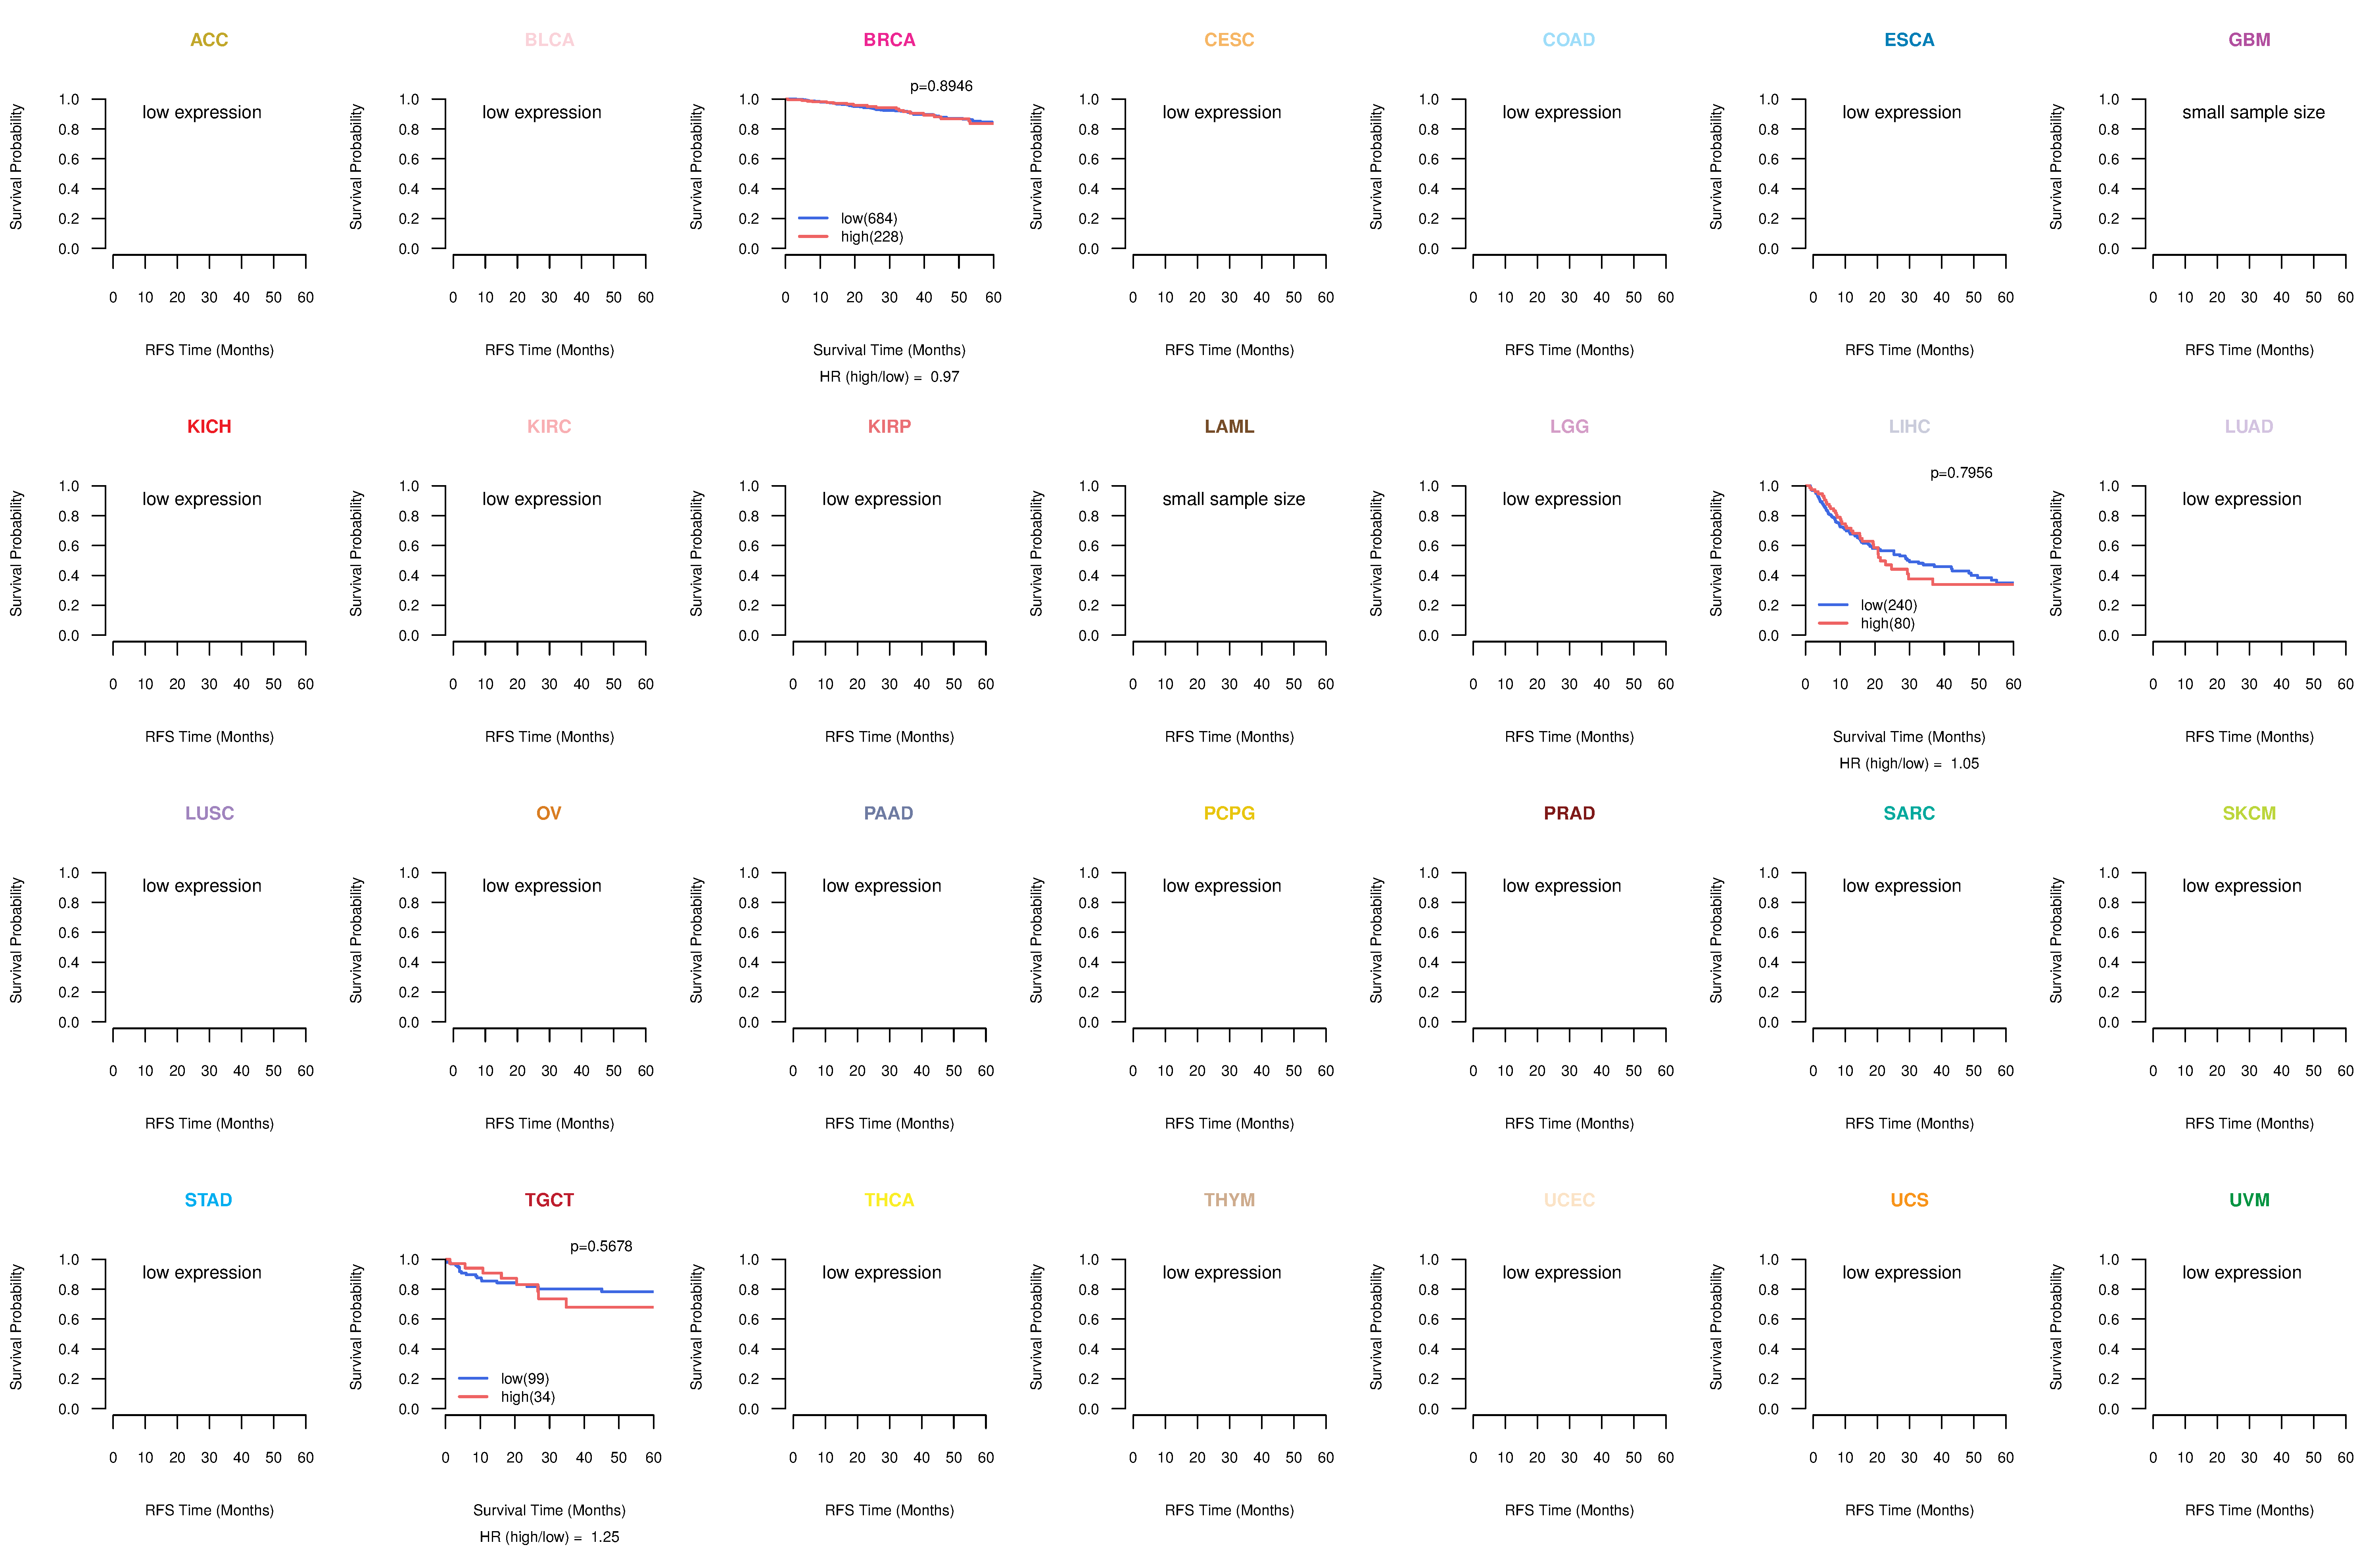
| Kaplan-Meier plots with logrank test of relapse free survival (RFS) using 28 cancer types (TCGA IlluminaHiSeq_RNASeqV2, pan-cancer normalized log2(norm_counts+1) data, version 2016-08-16) (TCGA clinicalMatrix, phenotype data, version 2016-04-27) * Click on the image enlarge it in a new window. |
 |
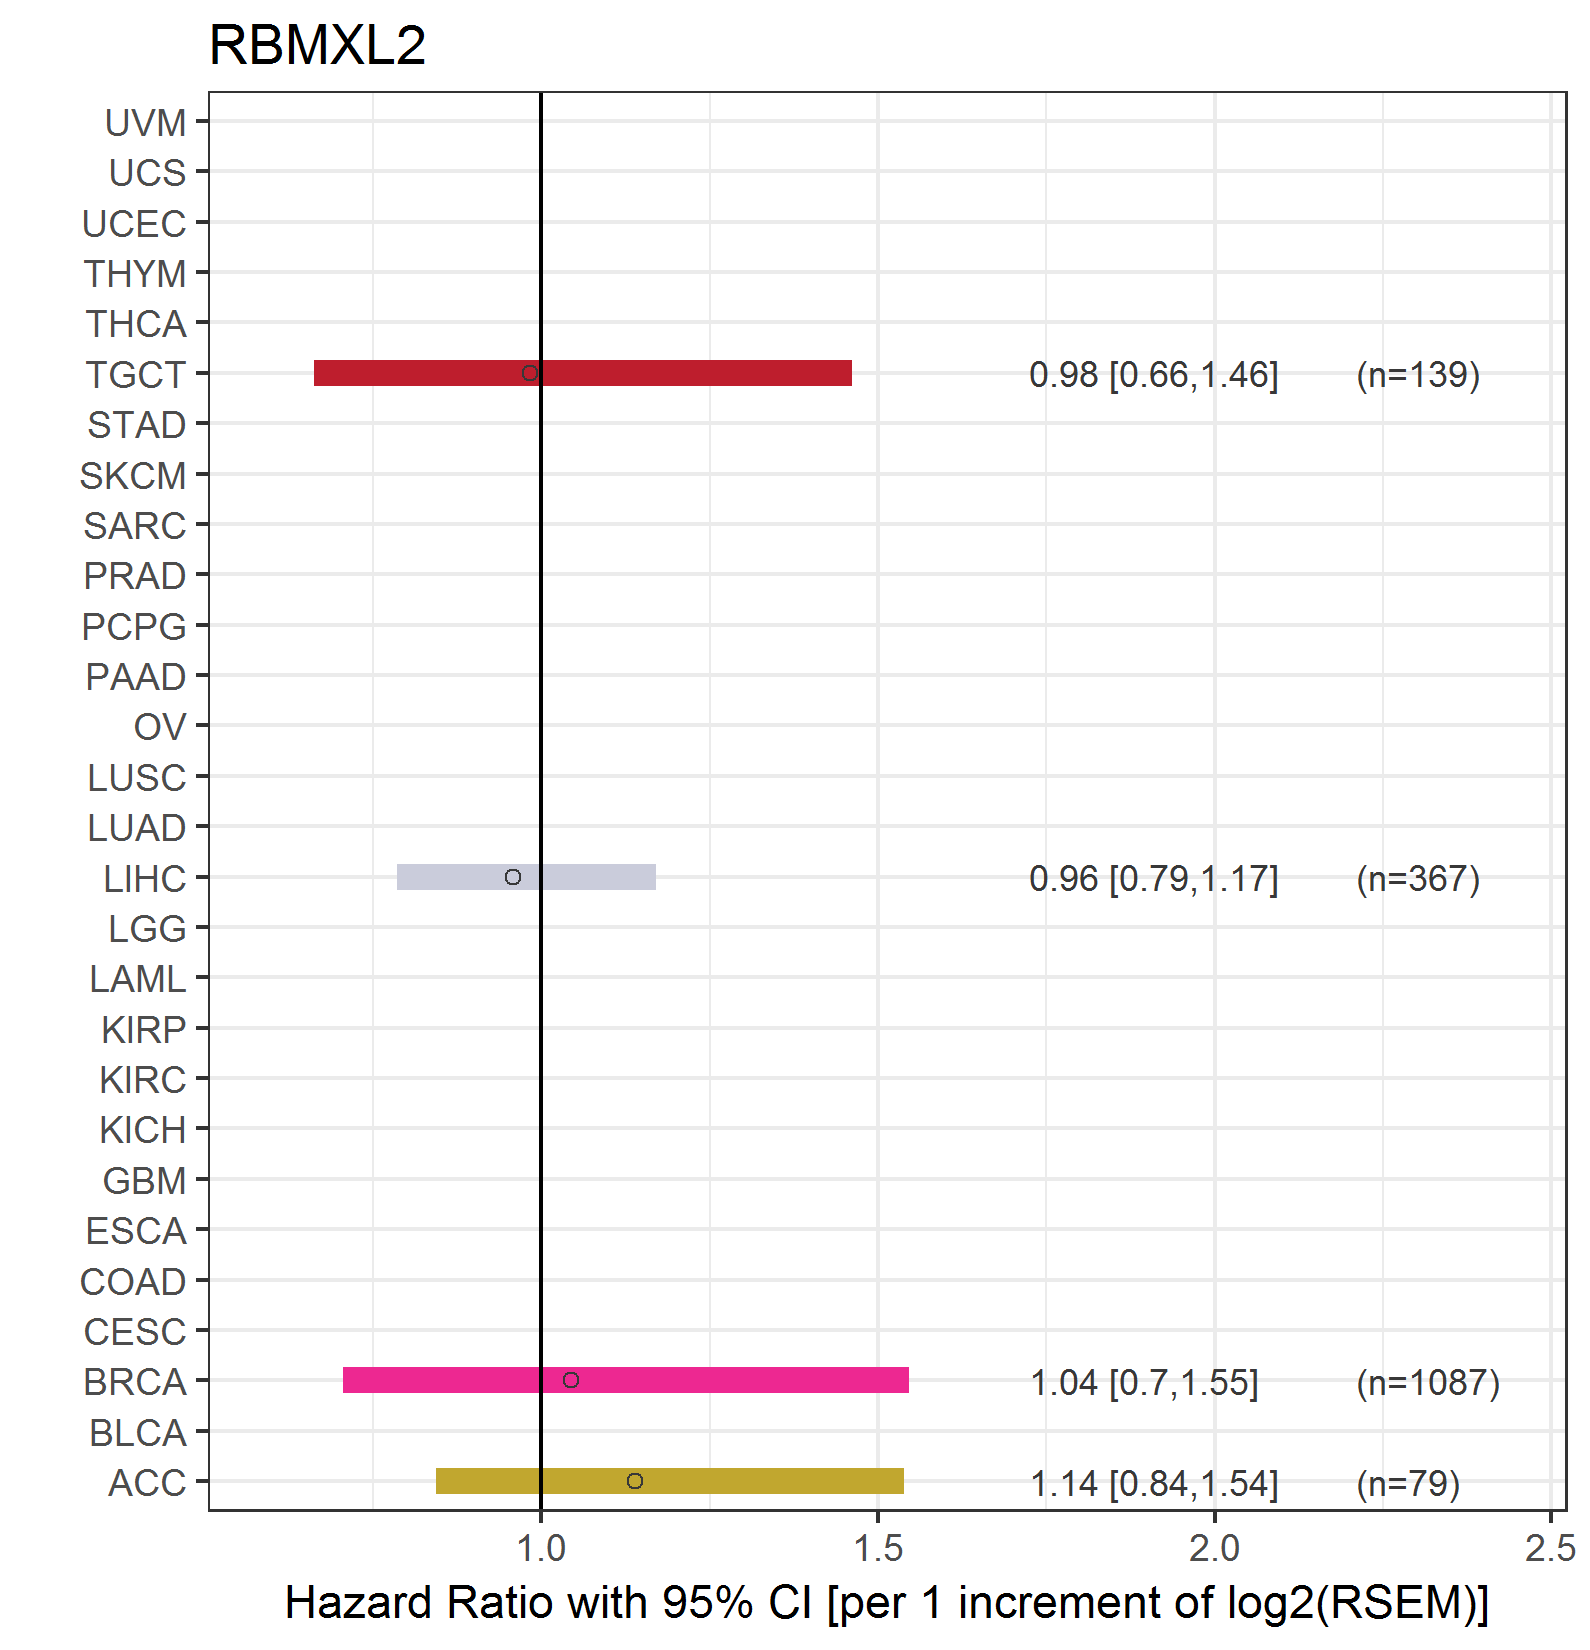
| Forest plot of Cox proportional hazard ratio (HR) and 95% CI of overall survival (OS) using 28 cancer types (TCGA IlluminaHiSeq_RNASeqV2, pan-cancer normalized log2(norm_counts+1) data, version 2016-08-16) (TCGA clinicalMatrix, phenotype data, version 2016-04-27) * Click on the image enlarge it in a new window. |
 |
| Forest plot of Cox proportional hazard ratio (HR) and 95% CI of relapse free survival (RFS) using 28 cancer types (TCGA IlluminaHiSeq_RNASeqV2, pan-cancer normalized log2(norm_counts+1) data, version 2016-08-16) (TCGA clinicalMatrix, phenotype data, version 2016-04-27) * Click on the image enlarge it in a new window. |
 |
| Top |
| TissGeneClin for RBMXL2 |
| TissGeneDrug for RBMXL2 |
| Drug information targeting TissGene (DrugBank Version 5.0.6, 2017-04-01) |
| DrugBank ID | Drug name | Drug activity | Drug type | Drug status |
| Top |
| TissGeneDisease for RBMXL2 |
| Disease information associated with TissGene (DisGeNet, 2016-06-01) |
| Disease ID | Disease name | # pubmeds | Source |
| umls:C0021364 | Male infertility | 1 | BeFree |
|
Copyright 2016-Present - The University of Texas Health Science Center at Houston (UTHealth) Web File Viewing | How to Report, Fraud, Waste and Abuse | State of Texas | Statewide Search | Texas Homeland Security | Site Policies |