 |
| |
| |
| |
| |
| |
| |
|

| TissGeneSummary for ANGPTL3 |
 Gene summary Gene summary |
| Basic gene information | Gene symbol | ANGPTL3 |
| Gene name | angiopoietin-like 3 | |
| Synonyms | ANG-5|ANGPT5|ANL3|FHBL2 | |
| Cytomap | UCSC genome browser: 1p31.3 | |
| Type of gene | protein-coding | |
| RefGenes | NM_014495.3, | |
| Description | angiopoietin 5angiopoietin-related protein 3 | |
| Modification date | 20141211 | |
| dbXrefs | MIM : 604774 | |
| HGNC : HGNC | ||
| Ensembl : ENSG00000132855 | ||
| HPRD : 10381 | ||
| Vega : OTTHUMG00000009146 | ||
| Protein | UniProt: go to UniProt's Cross Reference DB Table | |
| Expression | CleanEX: HS_ANGPTL3 | |
| BioGPS: 27329 | ||
| Pathway | NCI Pathway Interaction Database: ANGPTL3 | |
| KEGG: ANGPTL3 | ||
| REACTOME: ANGPTL3 | ||
| Pathway Commons: ANGPTL3 | ||
| Context | iHOP: ANGPTL3 | |
| ligand binding site mutation search in PubMed: ANGPTL3 | ||
| UCL Cancer Institute: ANGPTL3 | ||
| Assigned class in TissGDB* | B | |
| Included tissue-specific gene expression resources | HPA,TiGER,GTEx | |
| Specific-tissues in normal samples (assigned by TissGDB using HPA, TiGER, and GTEx) | KidneyLiver | |
| Cancer types related to the specific-tissues in cancer samples (assigned by TissGDB using TCGA) | KIRC,KIRP,KICHLIHC | |
| Reference showing the relevant tissue of ANGPTL3 | ||
| Description by TissGene annotations | TissgsKTS CNV gained TissGeneKTS | |
| * Class A consists of genes with literature evidence and is part of the cTissGenes. Class B consists of only cTissGenes without additional evidence. The remaining genes belong to Class C. |
| Gene ontology having evidence of Inferred from Direct Assay (IDA) from Entrez |
| GO ID | GO term | PubMed ID | GO:0006071 | glycerol metabolic process | 12565906 | GO:0006631 | fatty acid metabolic process | 12565906 | GO:0006644 | phospholipid metabolic process | 17110602 | GO:0007165 | signal transduction | 11877390 | GO:0008203 | cholesterol metabolic process | 17110602 | GO:0009395 | phospholipid catabolic process | 17110602 | GO:0010519 | negative regulation of phospholipase activity | 17110602 | GO:0019915 | lipid storage | 12565906 | GO:0030335 | positive regulation of cell migration | 11877390 | GO:0042632 | cholesterol homeostasis | 17110602 | GO:0045766 | positive regulation of angiogenesis | 11877390 | GO:0050996 | positive regulation of lipid catabolic process | 12565906 | GO:0051005 | negative regulation of lipoprotein lipase activity | 17110602 | GO:0055088 | lipid homeostasis | 17110602 | GO:0055090 | acylglycerol homeostasis | 17110602 | GO:0055091 | phospholipid homeostasis | 17110602 | GO:0006071 | glycerol metabolic process | 12565906 | GO:0006631 | fatty acid metabolic process | 12565906 | GO:0006644 | phospholipid metabolic process | 17110602 | GO:0007165 | signal transduction | 11877390 | GO:0008203 | cholesterol metabolic process | 17110602 | GO:0009395 | phospholipid catabolic process | 17110602 | GO:0010519 | negative regulation of phospholipase activity | 17110602 | GO:0019915 | lipid storage | 12565906 | GO:0030335 | positive regulation of cell migration | 11877390 | GO:0042632 | cholesterol homeostasis | 17110602 | GO:0045766 | positive regulation of angiogenesis | 11877390 | GO:0050996 | positive regulation of lipid catabolic process | 12565906 | GO:0051005 | negative regulation of lipoprotein lipase activity | 17110602 | GO:0055088 | lipid homeostasis | 17110602 | GO:0055090 | acylglycerol homeostasis | 17110602 | GO:0055091 | phospholipid homeostasis | 17110602 |
| Top |
| TissGeneExp for ANGPTL3 |
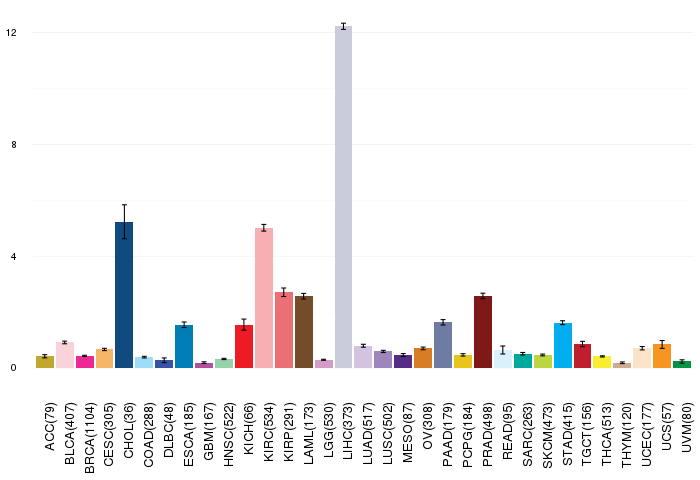
| Gene expressions across 28 cancer types (X-axis: cancer type and Y-axis: log2(norm_counts+1)) (TCGA IlluminaHiSeq_RNASeqV2, pan-cancer normalized log2(norm_counts+1) data, version 2016-08-16) |
 |
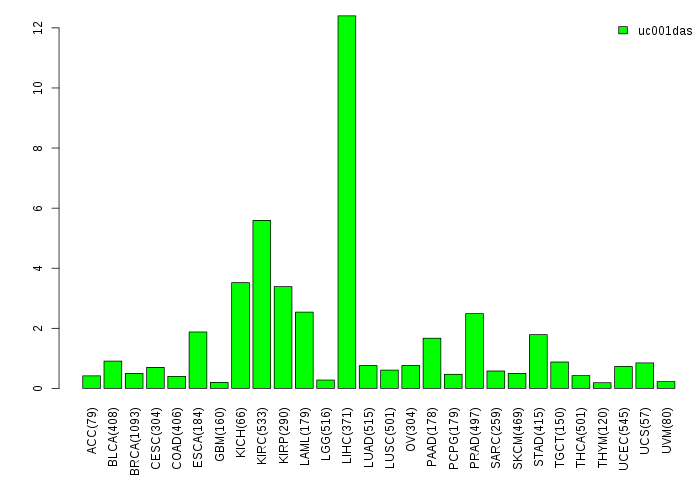
| Gene isoform expressions across 28 cancer types (X-axis: cancer type and Y-axis: log2(norm_counts+1)) (TCGA pan-cancer tcga_rsem_isoform_tpm, version 2016-09-01) |
 |
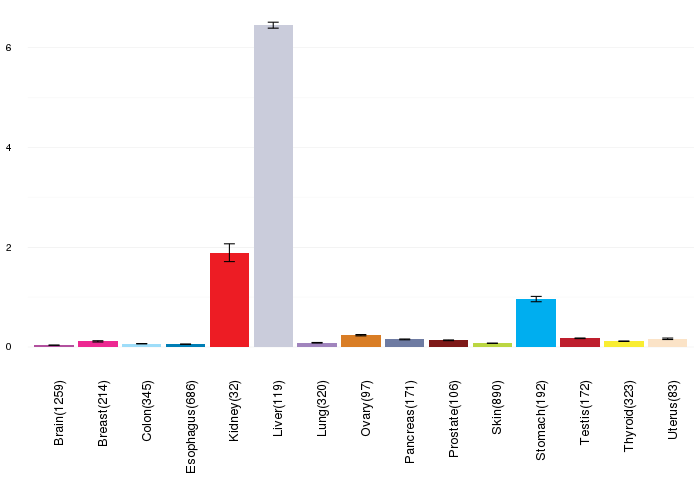
| Gene expressions across normal tissues of GTEx data (GTEx GTEx_Analysis_v6_RNA-seq_RNA-SeQCv1.1.8_gene_rpkm.gct) - Here, we shows the matched tissue types only among our 28 cancer types. |
 |
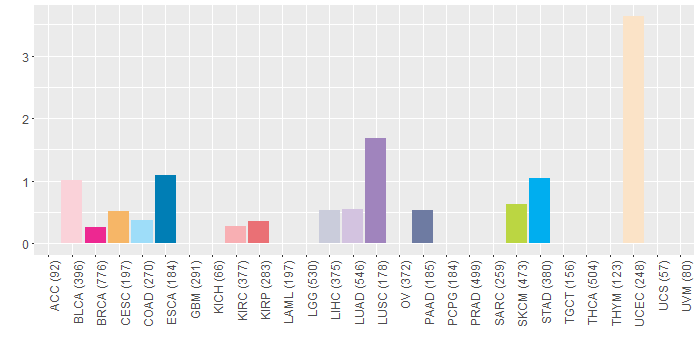
| Different expressions across 14 cancer types with more than 10 samples between matched tumors and normals (X-axis: cancer type and Y-axis: log2(norm_counts+1)) (TCGA IlluminaHiSeq_RNASeqV2, pan-cancer normalized log2(norm_counts+1) data, version 2016-08-16) |
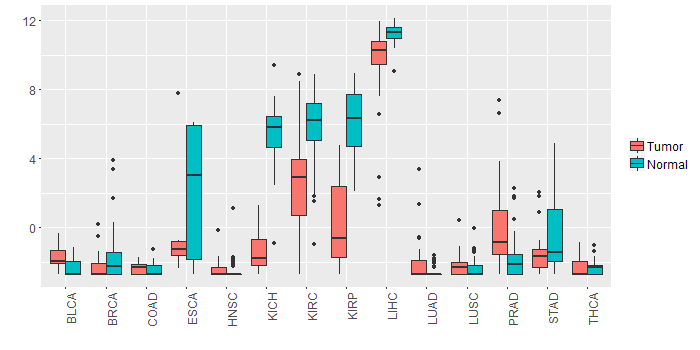 |
| - Significantly differentially expressed cancer types and information. (|Fold change|>1 and FDR<0.05) |
| Cancer type | Mean(exp) in tumor | Mean(exp) in matched normal | Log2FC | P-val. | FDR |
| KIRC | 2.676089566 | 5.999668733 | -3.323579167 | 1.81E-13 | 8.18E-13 |
| PRAD | -0.166740455 | -1.798328917 | 1.631588462 | 6.64E-06 | 3.92E-05 |
| LIHC | 9.645580622 | 11.27737462 | -1.631794 | 5.74E-06 | 2.58E-05 |
| KICH | -1.384497378 | 5.532242622 | -6.91674 | 5.18E-18 | 2.48E-16 |
| KIRP | 0.162551372 | 6.152882622 | -5.99033125 | 6.49E-16 | 2.11E-14 |
| STAD | -1.550711128 | -0.307408003 | -1.243303125 | 0.0106 | 0.036120303 |
| Top |
| TissGene-miRNA for ANGPTL3 |
| Significantly anti-correlated miRNAs of TissGene across 28 cancer types (Gene-miRNA relations from TargetScanHuman Relsease 7.1, Conserved_Site_Context_Scores.txt.zip, 06.01.2016) (TCGA IlluminaHiSeq_miRNASeq, log2(RPM+1) data, version 2016-11-21) (TCGA IlluminaHiSeq_RNASeqV2, log2(normalized_count+1) data, version 2016-08-16) (Spearman’s Rank Correlation (p-value<0.05 and coefficient<-0.25)) |
| Cancer type | miRNA id | miRNA accession | P-val. | Coeff. | # samples |
| Top |
| TissGeneMut for ANGPTL3 |
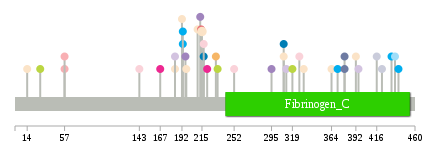
| TissGeneSNV for ANGPTL3 |
| nsSNV counts per each loci. Different colors of circles represent different cancer types. Circle size denotes number of samples. (TCGA somatic mutation (SNPs and small INDELs) data, version 2016-04-25) * Click on the image to enlarge it in a new window. |
 |
 |
| Somatic nucleotide variants of TissGene across 28 cancer types (X-axis: cancer type and Y-axis: % of mutated samples) The numbers in parentheses are numbers of samples with mutation (nsSNVs). (TCGA somatic mutation (SNPs and small INDELs) data, version 2016-04-25) |
 |
| - nsSNVs sorted by frequency. |
| AAchange | Cancer type | # samples |
| p.S215Y | UCEC | 2 |
| p.L231F | CESC | 1 |
| p.V14I | UCEC | 1 |
| p.I196K | LUSC | 1 |
| p.F167S | BRCA | 1 |
| p.F392L | UCEC | 1 |
| p.R221T | BRCA | 1 |
| p.L309F | UCEC | 1 |
| p.E210* | UCEC | 1 |
| p.D184E | UCEC | 1 |
| p.E143Q | BLCA | 1 |
| p.S327C | BLCA | 1 |
| p.S217C | BLCA | 1 |
| p.N371S | STAD | 1 |
| p.F295L | LUSC | 1 |
| p.Q192H | UCEC | 1 |
| p.L29I | SKCM | 1 |
| p.Q437K | COAD | 1 |
| p.A193T | STAD | 1 |
| p.E213* | LUSC | 1 |
| p.L309V | ESCA | 1 |
| p.D184E | LUAD | 1 |
| p.S433P | STAD | 1 |
| p.S217Y | ESCA | 1 |
| p.E312K | LUAD | 1 |
| p.L57H | KIRC | 1 |
| p.K319M | SKCM | 1 |
| p.K197Q | UCEC | 1 |
| p.R252T | BLCA | 1 |
| p.K416T | LIHC | 1 |
| p.L379V | PAAD | 1 |
| p.R332* | UCEC | 1 |
| p.I422M | LIHC | 1 |
| p.P57Q | KIRC | 1 |
| p.R332Q | READ | 1 |
| p.A364V | UCEC | 1 |
| p.I214N | KIRP | 1 |
| p.E233K | SKCM | 1 |
| p.H193N | STAD | 1 |
| p.H343Y | HNSC | 1 |
| p.D41N | HNSC | 1 |
| p.K379E | PAAD | 1 |
| p.D441H | STAD | 1 |
| p.Q195* | HNSC | 1 |
| p.P395S | LUAD | 1 |
| Top |
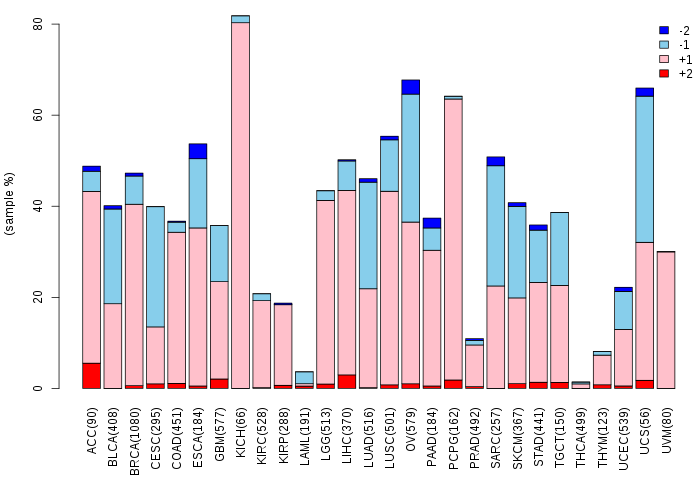
| TissGeneCNV for ANGPTL3 |
| Copy number variations of TissGene across 28 cancer types (X-axis: cancer type and Y-axis: % of CNV samples) (TCGA Gistic2_CopyNumber_Gistic2_all_data_by_genes, Gistic2 copy number data, version 2016-08-16) |
 |
| Top |
| TissGeneFusions for ANGPTL3 |
| Fusion genes including TissGene (ChimerDB 3.0, 2016-12-01 and TCGA fusion Portal 2015-12-01) |
| Database | Src | Cancer type | Sample | Fusion gene | ORF | 5'-gene BP | 3'-gene BP |
| Top |
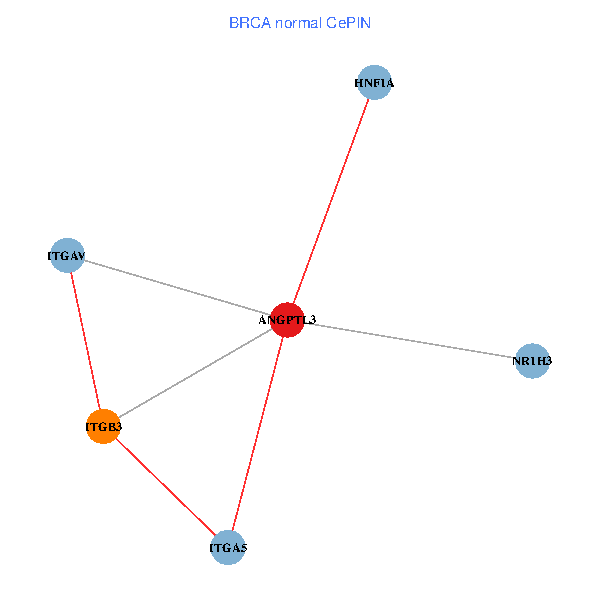
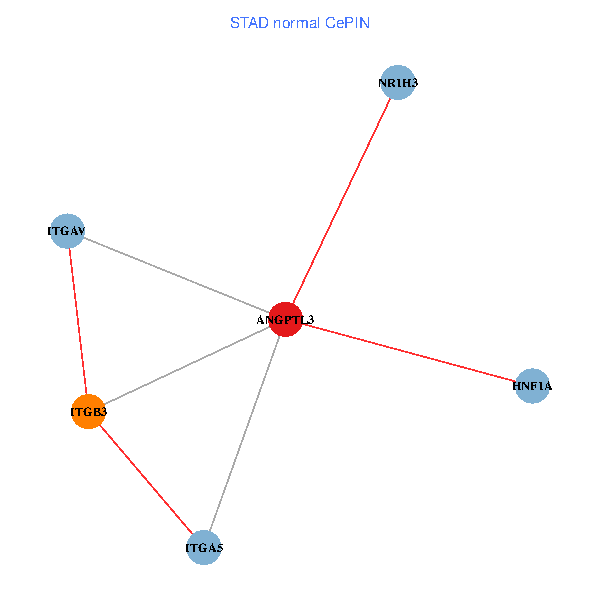
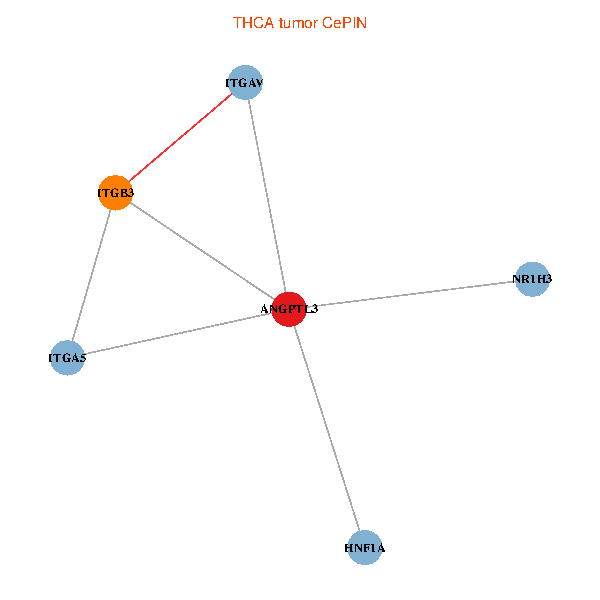
| TissGeneNet for ANGPTL3 |
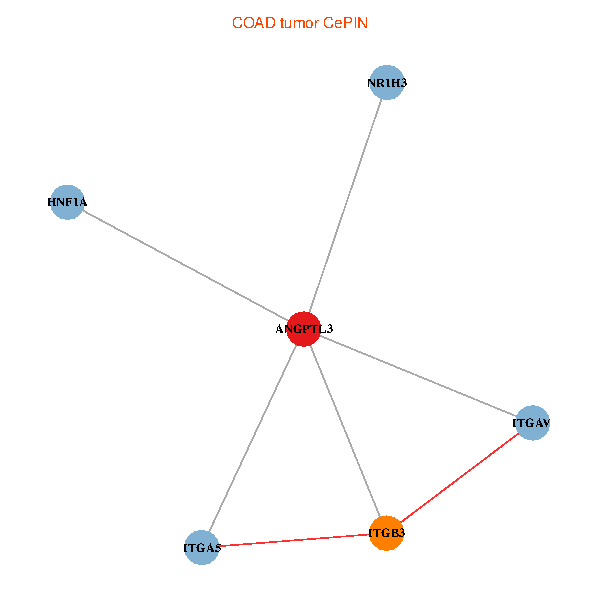
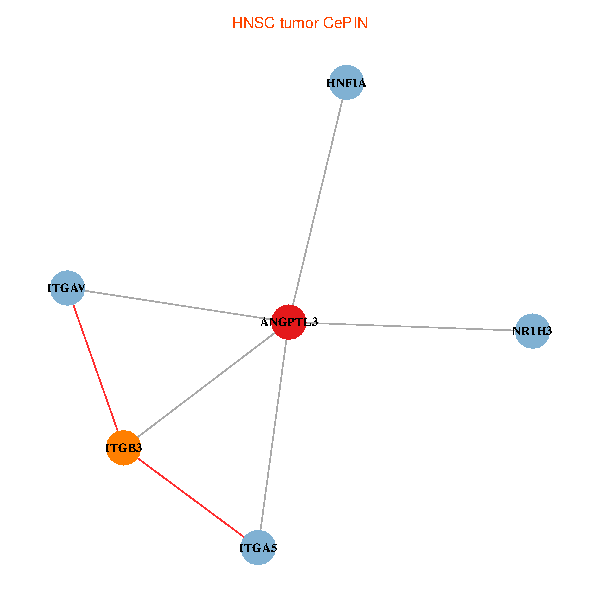
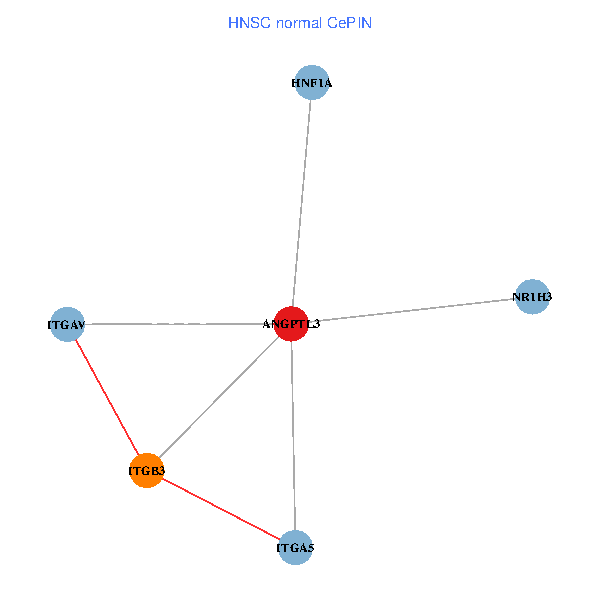
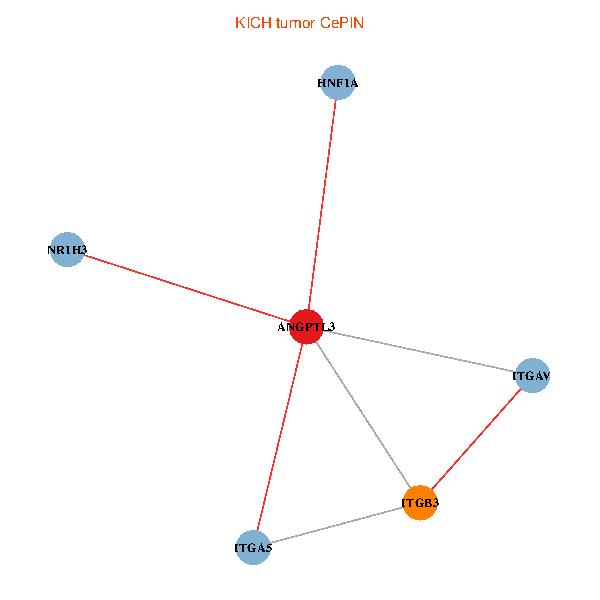
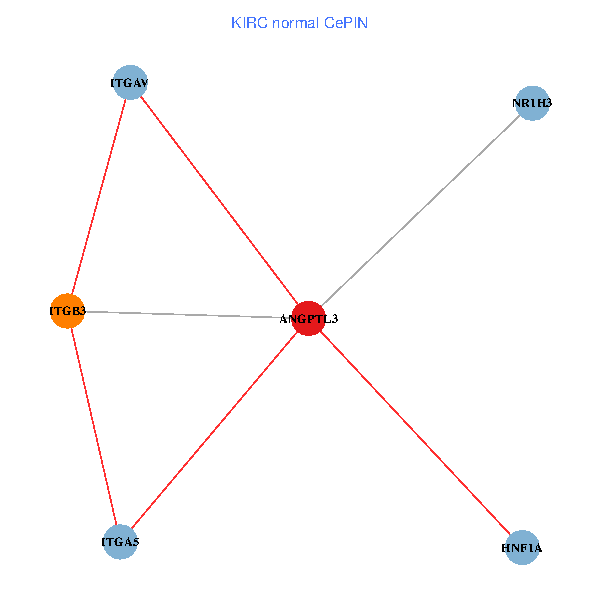
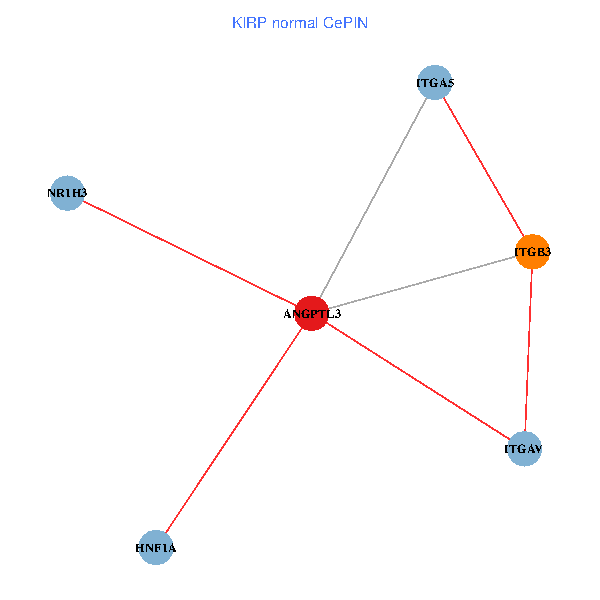
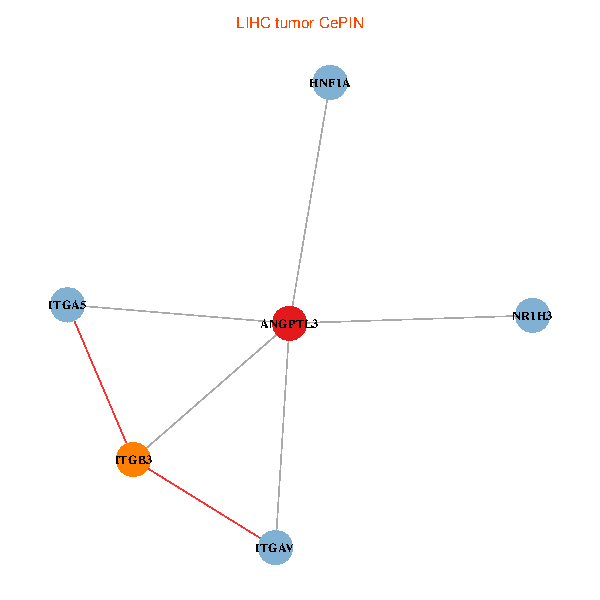
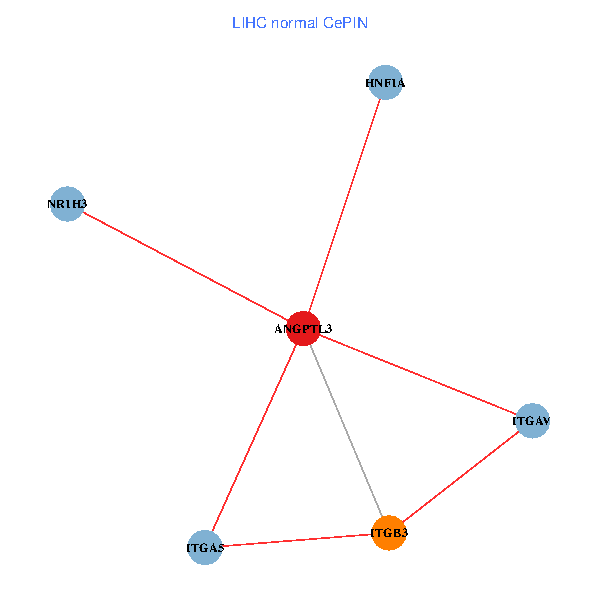
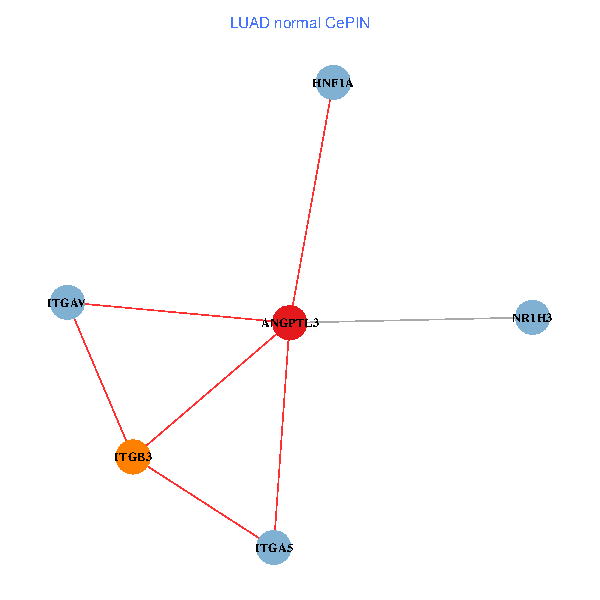
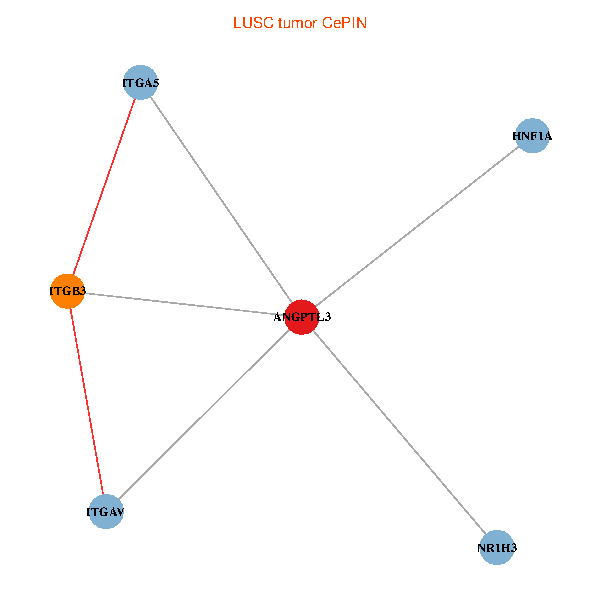
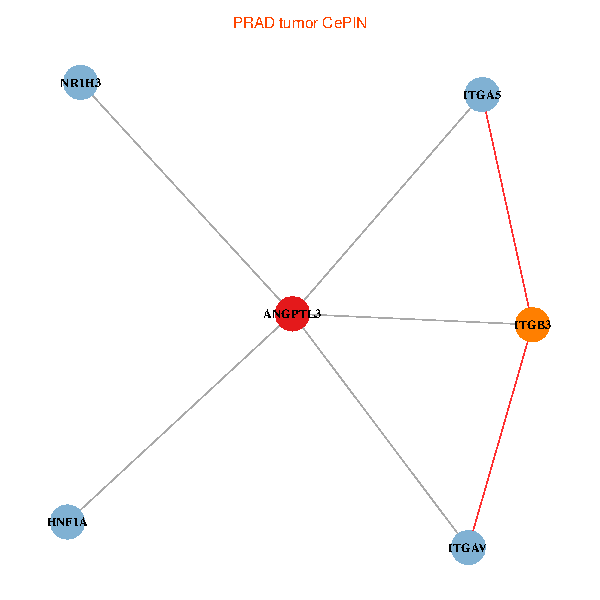
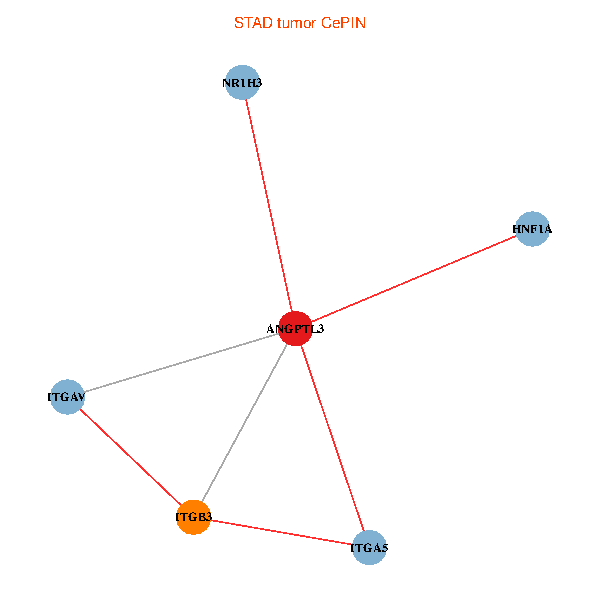
| Co-expressed gene networks based on protein-protein interaction data (CePIN) (TCGA IlluminaHiSeq_RNASeqV2, pan-cancer normalized log2(norm_counts+1) data, version 2016-08-16) (PINA2 ppi data) |
| BRCA (tumor) | BRCA (normal) |
| ANGPTL3, NR1H3, ITGAV, ITGB3, HNF1A, ITGA5 (tumor) | ANGPTL3, NR1H3, ITGAV, ITGB3, HNF1A, ITGA5 (normal) |
 |  |
| COAD (tumor) | COAD (normal) |
| ANGPTL3, NR1H3, ITGAV, ITGB3, HNF1A, ITGA5 (tumor) | ANGPTL3, NR1H3, ITGAV, ITGB3, HNF1A, ITGA5 (normal) |
 |  |
| HNSC (tumor) | HNSC (normal) |
| ANGPTL3, NR1H3, ITGAV, ITGB3, HNF1A, ITGA5 (tumor) | ANGPTL3, NR1H3, ITGAV, ITGB3, HNF1A, ITGA5 (normal) |
 |  |
| KICH (tumor) | KICH (normal) |
| ANGPTL3, NR1H3, ITGAV, ITGB3, HNF1A, ITGA5 (tumor) | ANGPTL3, NR1H3, ITGAV, ITGB3, HNF1A, ITGA5 (normal) |
 |  |
| KIRC (tumor) | KIRC (normal) |
| ANGPTL3, NR1H3, ITGAV, ITGB3, HNF1A, ITGA5 (tumor) | ANGPTL3, NR1H3, ITGAV, ITGB3, HNF1A, ITGA5 (normal) |
 |  |
| KIRP (tumor) | KIRP (normal) |
| ANGPTL3, NR1H3, ITGAV, ITGB3, HNF1A, ITGA5 (tumor) | ANGPTL3, NR1H3, ITGAV, ITGB3, HNF1A, ITGA5 (normal) |
 |  |
| LIHC (tumor) | LIHC (normal) |
| ANGPTL3, NR1H3, ITGAV, ITGB3, HNF1A, ITGA5 (tumor) | ANGPTL3, NR1H3, ITGAV, ITGB3, HNF1A, ITGA5 (normal) |
 |  |
| LUAD (tumor) | LUAD (normal) |
| ANGPTL3, NR1H3, ITGAV, ITGB3, HNF1A, ITGA5 (tumor) | ANGPTL3, NR1H3, ITGAV, ITGB3, HNF1A, ITGA5 (normal) |
 |  |
| LUSC (tumor) | LUSC (normal) |
| ANGPTL3, NR1H3, ITGAV, ITGB3, HNF1A, ITGA5 (tumor) | ANGPTL3, NR1H3, ITGAV, ITGB3, HNF1A, ITGA5 (normal) |
 |  |
| PRAD (tumor) | PRAD (normal) |
| ANGPTL3, NR1H3, ITGAV, ITGB3, HNF1A, ITGA5 (tumor) | ANGPTL3, NR1H3, ITGAV, ITGB3, HNF1A, ITGA5 (normal) |
 |  |
| STAD (tumor) | STAD (normal) |
| ANGPTL3, NR1H3, ITGAV, ITGB3, HNF1A, ITGA5 (tumor) | ANGPTL3, NR1H3, ITGAV, ITGB3, HNF1A, ITGA5 (normal) |
 |  |
| THCA (tumor) | THCA (normal) |
| ANGPTL3, NR1H3, ITGAV, ITGB3, HNF1A, ITGA5 (tumor) | ANGPTL3, NR1H3, ITGAV, ITGB3, HNF1A, ITGA5 (normal) |
 |  |
| Top |
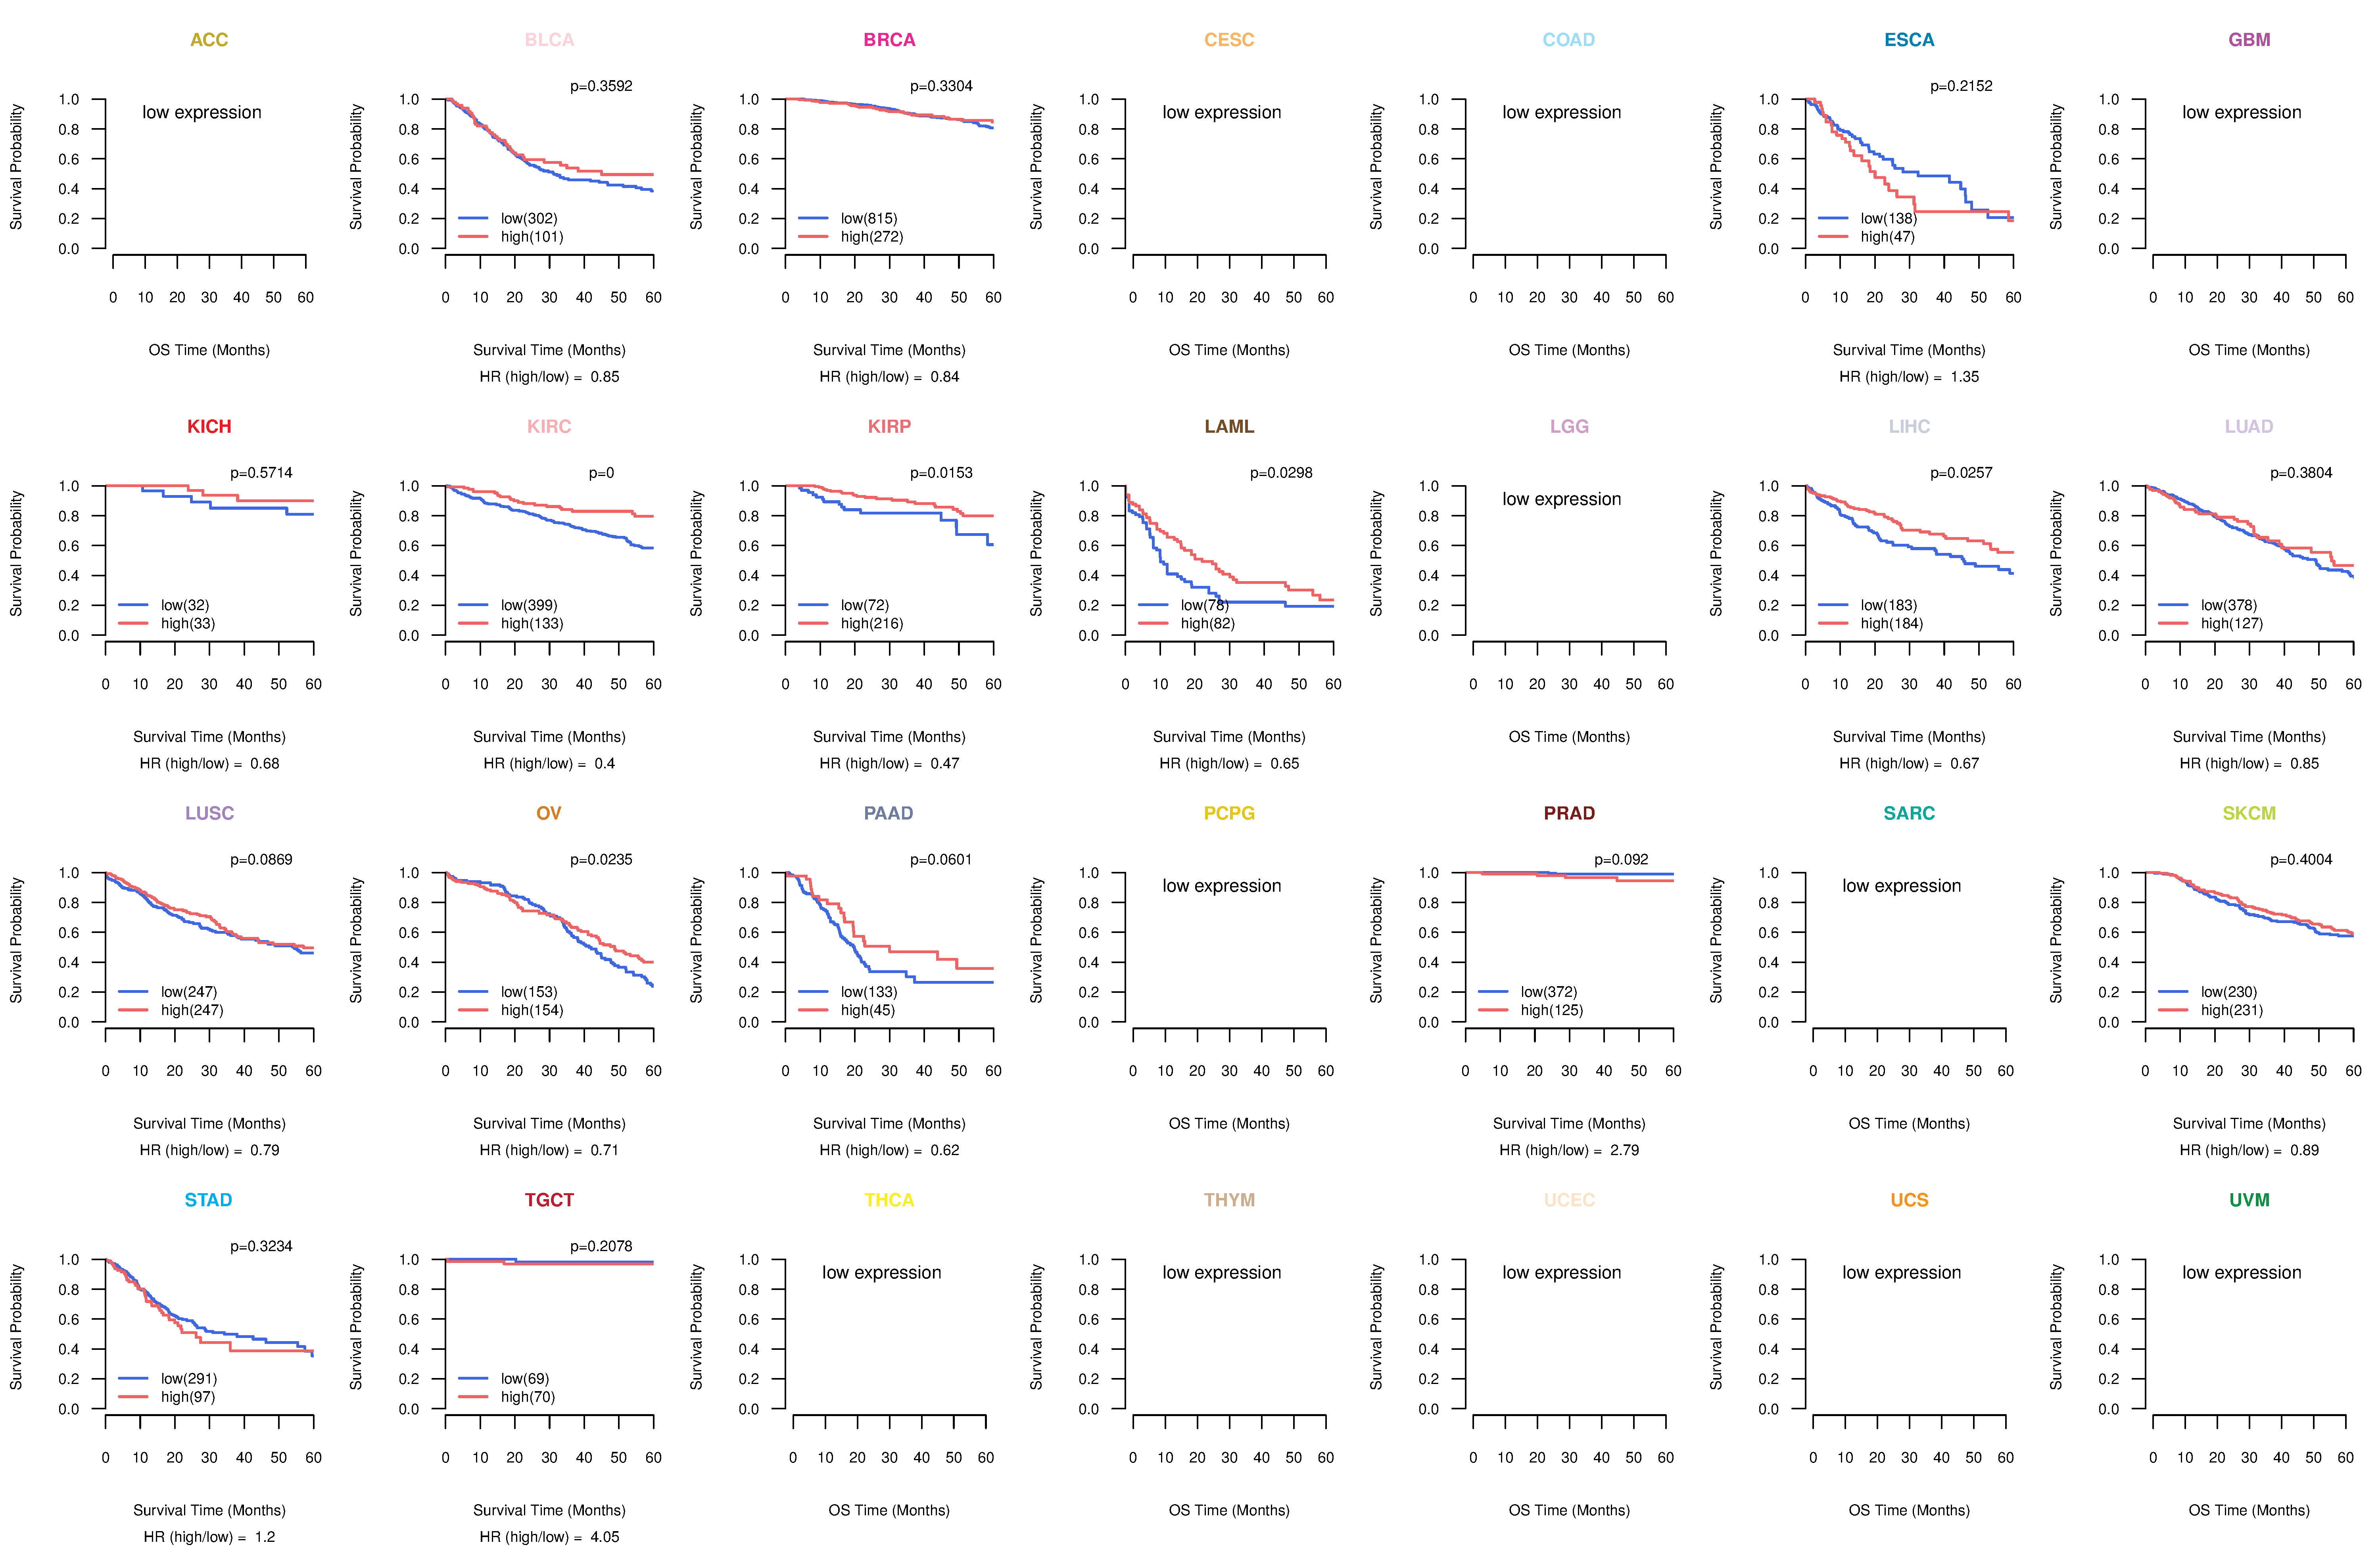
| TissGeneProg for ANGPTL3 |
| Kaplan-Meier plots with logrank tests of overall survival (OS) using 28 cancer types (TCGA IlluminaHiSeq_RNASeqV2, pan-cancer normalized log2(norm_counts+1) data, version 2016-08-16) (TCGA clinicalMatrix, phenotype data, version 2016-04-27) * Click on the image to enlarge it in a new window. |
 |
| Kaplan-Meier plots with logrank test of relapse free survival (RFS) using 28 cancer types (TCGA IlluminaHiSeq_RNASeqV2, pan-cancer normalized log2(norm_counts+1) data, version 2016-08-16) (TCGA clinicalMatrix, phenotype data, version 2016-04-27) * Click on the image enlarge it in a new window. |
 |
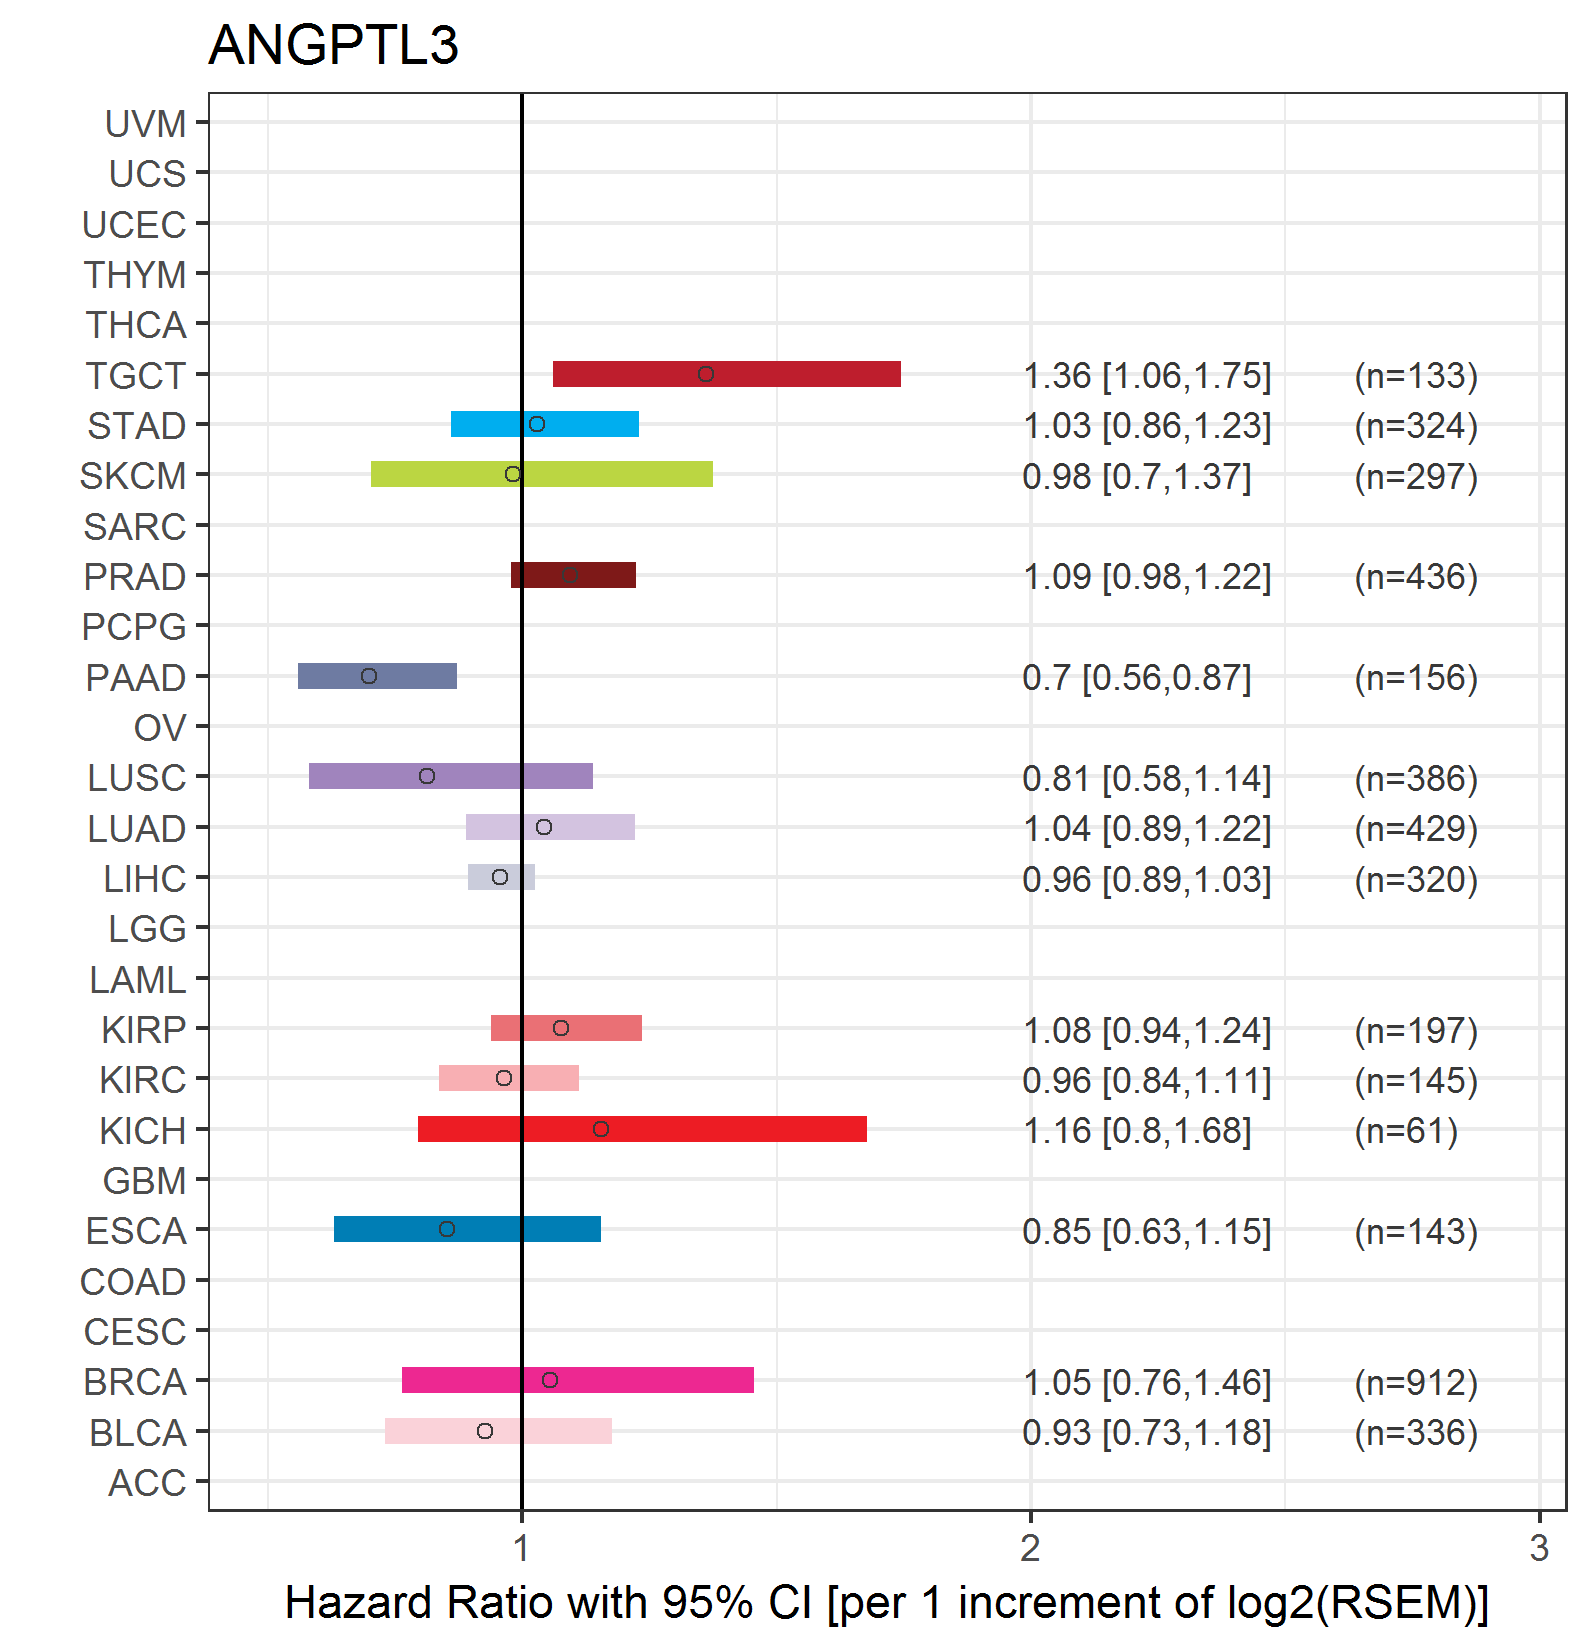
| Forest plot of Cox proportional hazard ratio (HR) and 95% CI of overall survival (OS) using 28 cancer types (TCGA IlluminaHiSeq_RNASeqV2, pan-cancer normalized log2(norm_counts+1) data, version 2016-08-16) (TCGA clinicalMatrix, phenotype data, version 2016-04-27) * Click on the image enlarge it in a new window. |
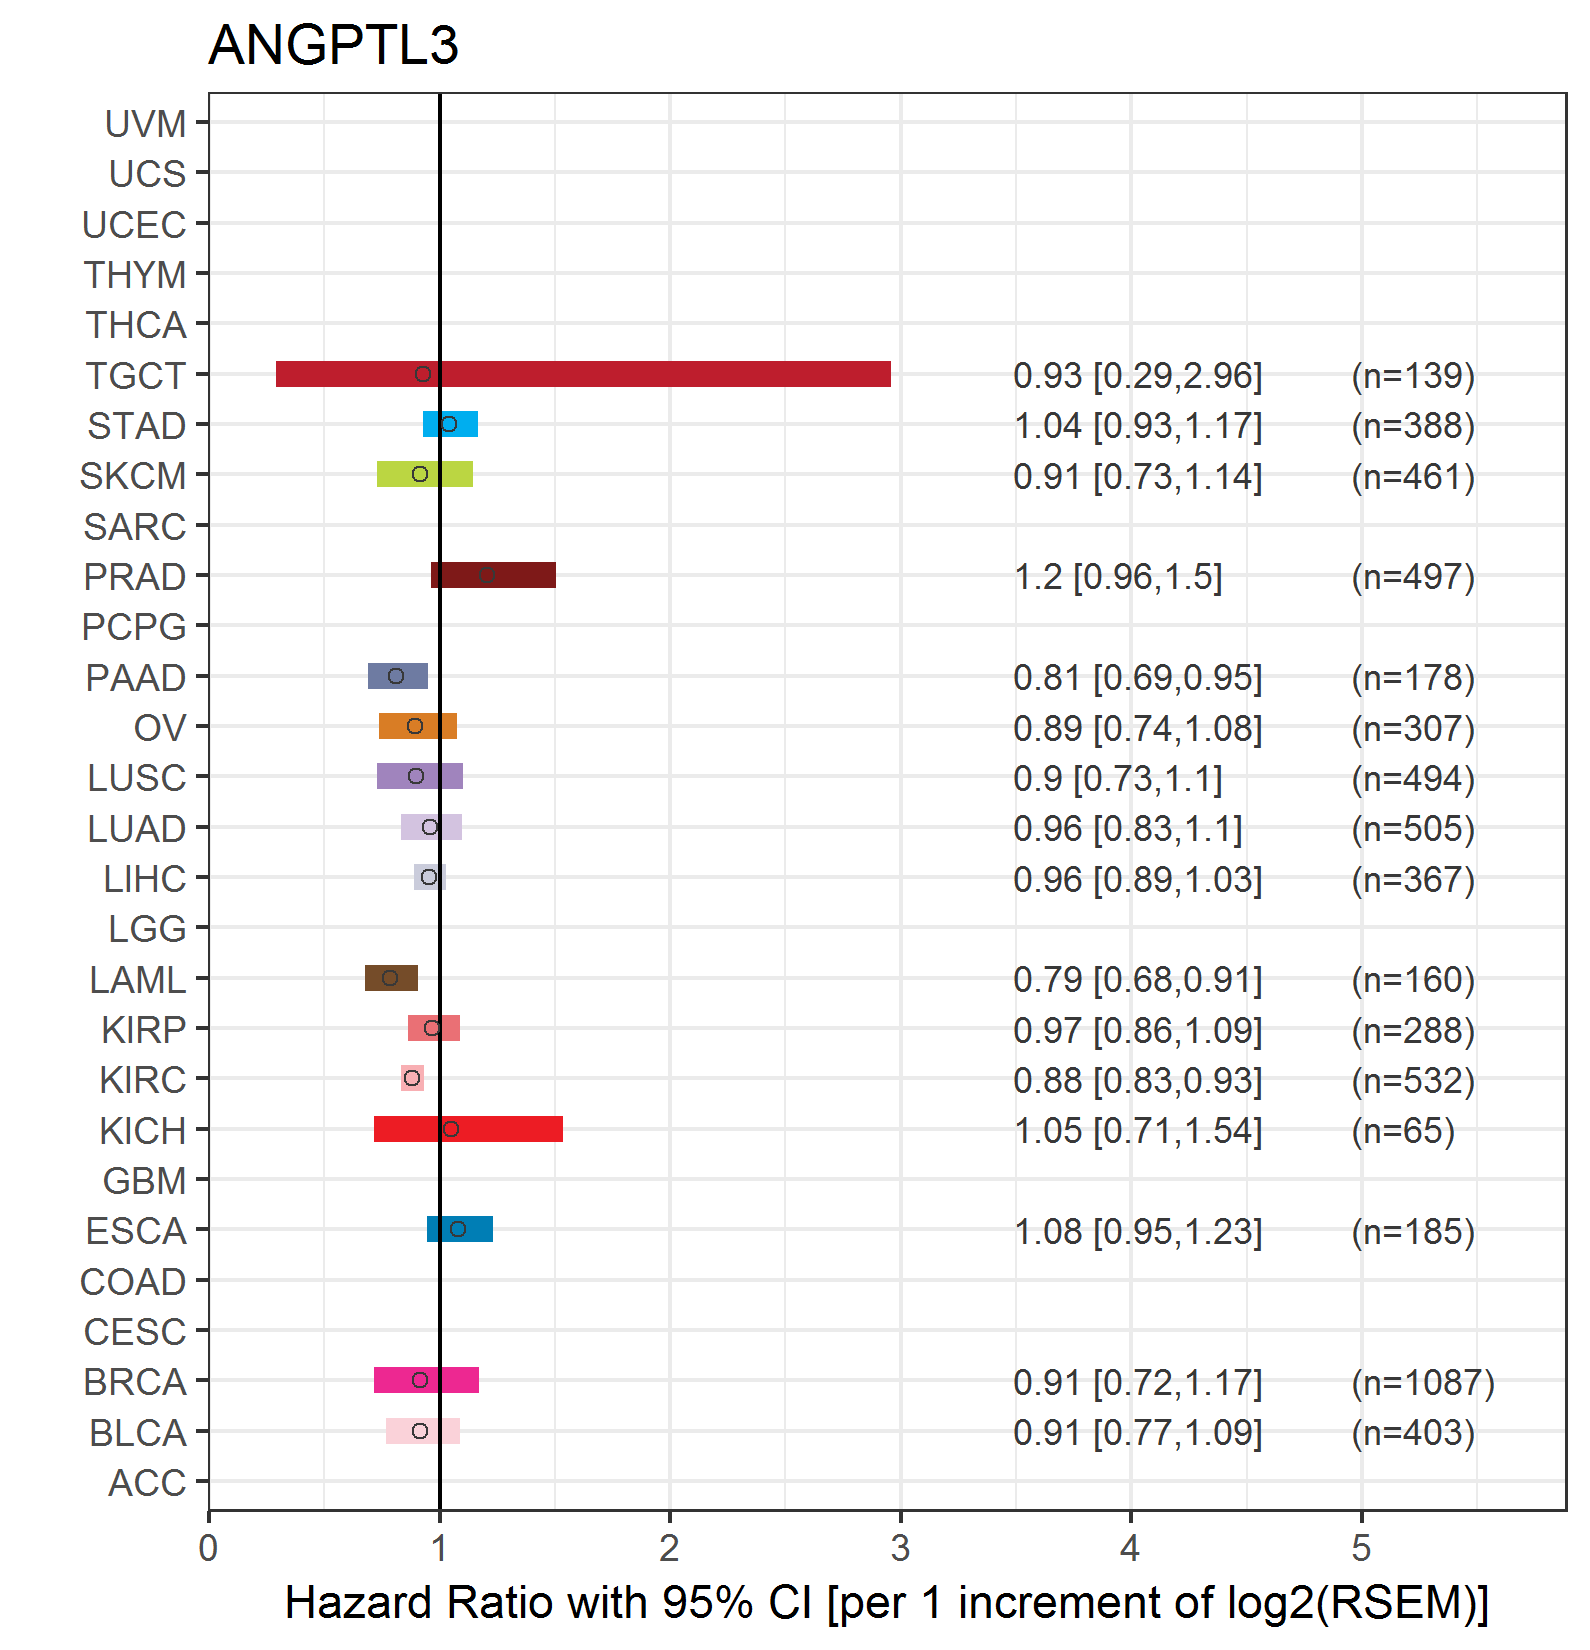 |
| Forest plot of Cox proportional hazard ratio (HR) and 95% CI of relapse free survival (RFS) using 28 cancer types (TCGA IlluminaHiSeq_RNASeqV2, pan-cancer normalized log2(norm_counts+1) data, version 2016-08-16) (TCGA clinicalMatrix, phenotype data, version 2016-04-27) * Click on the image enlarge it in a new window. |
 |
| Top |
| TissGeneClin for ANGPTL3 |
| TissGeneDrug for ANGPTL3 |
| Drug information targeting TissGene (DrugBank Version 5.0.6, 2017-04-01) |
| DrugBank ID | Drug name | Drug activity | Drug type | Drug status |
| Top |
| TissGeneDisease for ANGPTL3 |
| Disease information associated with TissGene (DisGeNet, 2016-06-01) |
| Disease ID | Disease name | # pubmeds | Source |
| umls:C0020597 | Hypobetalipoproteinemias | 5 | BeFree |
| umls:C1862596 | Familial hypobetalipoproteinemia | 3 | BeFree |
| umls:C0003850 | Arteriosclerosis | 2 | BeFree |
| umls:C0004153 | Atherosclerosis | 2 | BeFree |
| umls:C0010068 | Coronary heart disease | 2 | BeFree,GAD |
| umls:C0011847 | Diabetes | 2 | BeFree |
| umls:C0011849 | Diabetes Mellitus | 2 | BeFree |
| umls:C0011860 | Diabetes Mellitus, Non-Insulin-Dependent | 2 | GAD |
| umls:C0020473 | Hyperlipidemia | 2 | BeFree |
| umls:C0020557 | Hypertriglyceridemia | 2 | GAD |
| umls:C0028754 | Obesity | 2 | BeFree |
| umls:C0242339 | Dyslipidemias | 2 | BeFree,GAD |
| umls:C0524620 | Metabolic Syndrome X | 2 | BeFree |
| umls:C1522137 | Hypertriglyceridemia result | 2 | GAD |
| umls:C0007222 | Cardiovascular Diseases | 1 | BeFree |
| umls:C0015695 | Fatty Liver | 1 | BeFree |
| umls:C0020459 | Hyperinsulinism | 1 | BeFree |
| umls:C0021368 | Inflammation | 1 | GAD |
| umls:C0021655 | Insulin Resistance | 1 | GAD |
| umls:C0025517 | Metabolic Diseases | 1 | BeFree |
| umls:C0153381 | Malignant neoplasm of mouth | 1 | BeFree |
| umls:C0154251 | Lipid Metabolism Disorders | 1 | GAD |
| umls:C0220641 | Lip and Oral Cavity Carcinoma | 1 | BeFree |
| umls:C0542037 | Hypotriglyceridaemia | 1 | BeFree |
| umls:C0796095 | Opitz trigonocephaly syndrome | 1 | BeFree |
| umls:C0948008 | Ischemic stroke | 1 | BeFree |
| umls:C3272363 | Ischemic Cerebrovascular Accident | 1 | BeFree |
| umls:C1857970 | Hypobetalipoproteinemia, Familial, 2 | 0 | CTD_human |
|
Copyright 2016-Present - The University of Texas Health Science Center at Houston (UTHealth) Web File Viewing | How to Report, Fraud, Waste and Abuse | State of Texas | Statewide Search | Texas Homeland Security | Site Policies |