 |
| |
| |
| |
| |
| |
| |
|

| TissGeneSummary for GLUD2 |
 Gene summary Gene summary |
| Basic gene information | Gene symbol | GLUD2 |
| Gene name | glutamate dehydrogenase 2 | |
| Synonyms | GDH2|GLUDP1 | |
| Cytomap | UCSC genome browser: Xq24-q25 | |
| Type of gene | protein-coding | |
| RefGenes | NM_012084.3, | |
| Description | GDH 2glutamate dehydrogenase 2, mitochondrialglutamate dehydrogenase pseudogene 1 | |
| Modification date | 20141207 | |
| dbXrefs | MIM : 300144 | |
| HGNC : HGNC | ||
| Ensembl : ENSG00000182890 | ||
| HPRD : 02143 | ||
| Vega : OTTHUMG00000022320 | ||
| Protein | UniProt: go to UniProt's Cross Reference DB Table | |
| Expression | CleanEX: HS_GLUD2 | |
| BioGPS: 2747 | ||
| Pathway | NCI Pathway Interaction Database: GLUD2 | |
| KEGG: GLUD2 | ||
| REACTOME: GLUD2 | ||
| Pathway Commons: GLUD2 | ||
| Context | iHOP: GLUD2 | |
| ligand binding site mutation search in PubMed: GLUD2 | ||
| UCL Cancer Institute: GLUD2 | ||
| Assigned class in TissGDB* | C | |
| Included tissue-specific gene expression resources | HPA,GTEx | |
| Specific-tissues in normal samples (assigned by TissGDB using HPA, TiGER, and GTEx) | Testis | |
| Cancer types related to the specific-tissues in cancer samples (assigned by TissGDB using TCGA) | TGCT | |
| Reference showing the relevant tissue of GLUD2 | ||
| Description by TissGene annotations | Cancer gene TissgsLTS | |
| * Class A consists of genes with literature evidence and is part of the cTissGenes. Class B consists of only cTissGenes without additional evidence. The remaining genes belong to Class C. |
| Gene ontology having evidence of Inferred from Direct Assay (IDA) from Entrez |
| GO ID | GO term | PubMed ID | GO:0006536 | glutamate metabolic process | 8207021 | GO:0006537 | glutamate biosynthetic process | 11032875 | GO:0006538 | glutamate catabolic process | 11032875 | GO:0055114 | oxidation-reduction process | 8207021 | GO:0006536 | glutamate metabolic process | 8207021 | GO:0006537 | glutamate biosynthetic process | 11032875 | GO:0006538 | glutamate catabolic process | 11032875 | GO:0055114 | oxidation-reduction process | 8207021 |
| Top |
| TissGeneExp for GLUD2 |
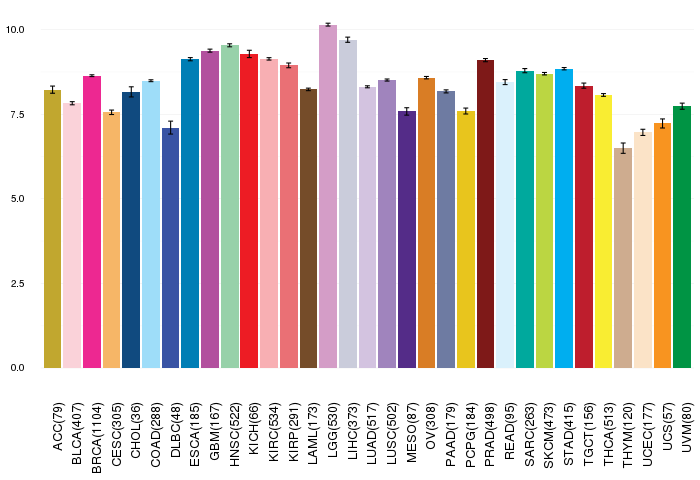
| Gene expressions across 28 cancer types (X-axis: cancer type and Y-axis: log2(norm_counts+1)) (TCGA IlluminaHiSeq_RNASeqV2, pan-cancer normalized log2(norm_counts+1) data, version 2016-08-16) |
 |
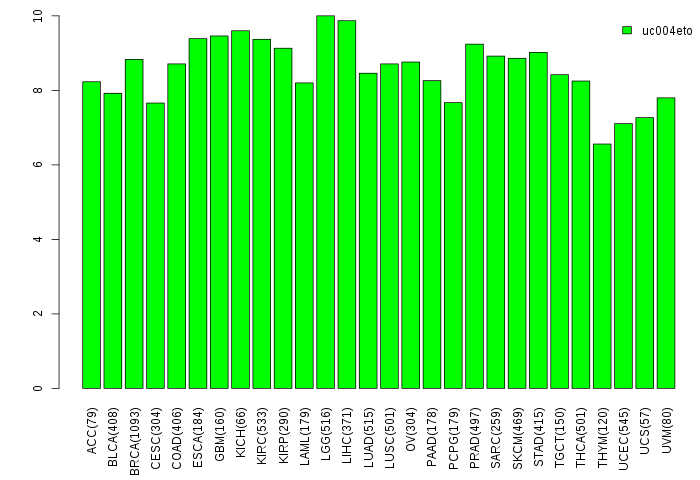
| Gene isoform expressions across 28 cancer types (X-axis: cancer type and Y-axis: log2(norm_counts+1)) (TCGA pan-cancer tcga_rsem_isoform_tpm, version 2016-09-01) |
 |
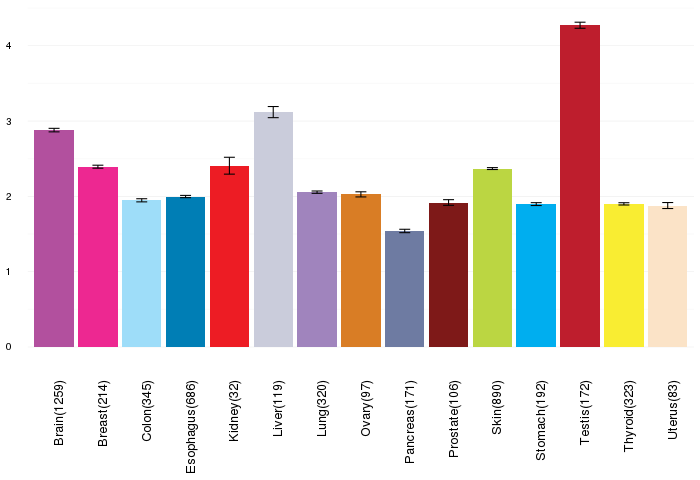
| Gene expressions across normal tissues of GTEx data (GTEx GTEx_Analysis_v6_RNA-seq_RNA-SeQCv1.1.8_gene_rpkm.gct) - Here, we shows the matched tissue types only among our 28 cancer types. |
 |
| Different expressions across 14 cancer types with more than 10 samples between matched tumors and normals (X-axis: cancer type and Y-axis: log2(norm_counts+1)) (TCGA IlluminaHiSeq_RNASeqV2, pan-cancer normalized log2(norm_counts+1) data, version 2016-08-16) |
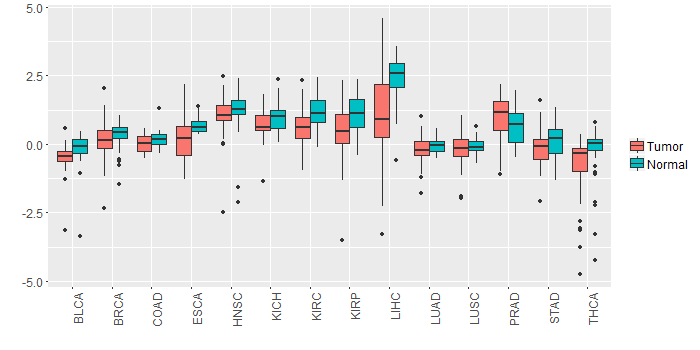 |
| - Significantly differentially expressed cancer types and information. (|Fold change|>1 and FDR<0.05) |
| Cancer type | Mean(exp) in tumor | Mean(exp) in matched normal | Log2FC | P-val. | FDR |
| LIHC | 1.035890236 | 2.425098236 | -1.389208 | 2.40E-07 | 1.52E-06 |
| Top |
| TissGene-miRNA for GLUD2 |
| Significantly anti-correlated miRNAs of TissGene across 28 cancer types (Gene-miRNA relations from TargetScanHuman Relsease 7.1, Conserved_Site_Context_Scores.txt.zip, 06.01.2016) (TCGA IlluminaHiSeq_miRNASeq, log2(RPM+1) data, version 2016-11-21) (TCGA IlluminaHiSeq_RNASeqV2, log2(normalized_count+1) data, version 2016-08-16) (Spearman’s Rank Correlation (p-value<0.05 and coefficient<-0.25)) |
| Cancer type | miRNA id | miRNA accession | P-val. | Coeff. | # samples |
| Top |
| TissGeneMut for GLUD2 |
| TissGeneSNV for GLUD2 |
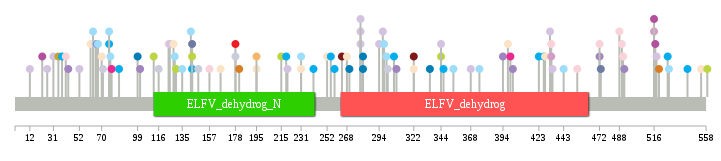
| nsSNV counts per each loci. Different colors of circles represent different cancer types. Circle size denotes number of samples. (TCGA somatic mutation (SNPs and small INDELs) data, version 2016-04-25) * Click on the image to enlarge it in a new window. |
 |
 |
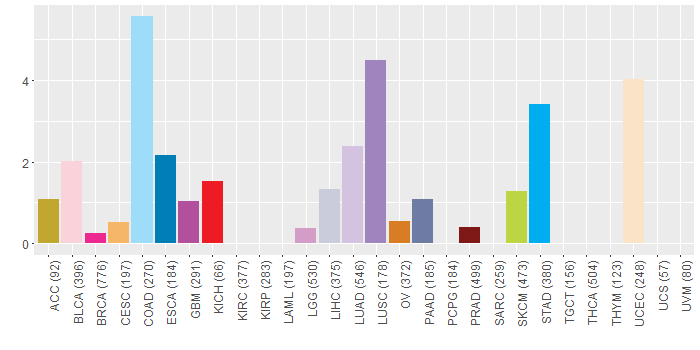
| Somatic nucleotide variants of TissGene across 28 cancer types (X-axis: cancer type and Y-axis: % of mutated samples) The numbers in parentheses are numbers of samples with mutation (nsSNVs). (TCGA somatic mutation (SNPs and small INDELs) data, version 2016-04-25) |
 |
| - nsSNVs sorted by frequency. |
| AAchange | Cancer type | # samples |
| p.X559L | SKCM | 1 |
| p.G279L | LUAD | 1 |
| p.A402D | LUSC | 1 |
| p.T490M | BLCA | 1 |
| p.F67S | COAD | 1 |
| p.D344G | SKCM | 1 |
| p.R322H | UCEC | 1 |
| p.E472Q | LUSC | 1 |
| p.Y152* | HNSC | 1 |
| p.S41W | BLCA | 1 |
| p.W129C | COAD | 1 |
| p.D375Y | COAD | 1 |
| p.A398T | UCEC | 1 |
| p.A78T | BRCA | 1 |
| p.D344E | LUAD | 1 |
| p.C112Y | SKCM | 1 |
| p.P297Q | LUAD | 1 |
| p.T455S | MESO | 1 |
| p.Q354H | COAD | 1 |
| p.R516H | GBM | 1 |
| p.A518D | LUAD | 1 |
| p.Y528H | COAD | 1 |
| p.P394H | LUSC | 1 |
| p.S473N | PAAD | 1 |
| p.R101W | LUSC | 1 |
| p.G279V | LUAD | 1 |
| p.G433A | BLCA | 1 |
| p.E195K | UCEC | 1 |
| p.I400V | BRCA | 1 |
| p.K527T | STAD | 1 |
| p.G335R | ESCA | 1 |
| p.A22V | GBM | 1 |
| p.K68N | HNSC | 1 |
| p.E71K | LIHC | 1 |
| p.A287S | READ | 1 |
| p.V70M | UCEC | 1 |
| p.R516H | LGG | 1 |
| p.G433E | LGG | 1 |
| p.S26* | LUAD | 1 |
| p.L423F | STAD | 1 |
| p.R300I | COAD | 1 |
| p.E492K | LUSC | 1 |
| p.G434V | LUAD | 1 |
| p.R231Q | COAD | 1 |
| p.S517Y | GBM | 1 |
| p.P178L | KICH | 1 |
| p.R136Q | HNSC | 1 |
| p.K84N | STAD | 1 |
| p.I215F | SKCM | 1 |
| p.H252N | UCEC | 1 |
| p.D220N | LUAD | 1 |
| p.G181R | OV | 1 |
| p.R99Q | ESCA | 1 |
| p.R76C | STAD | 1 |
| p.K346T | STAD | 1 |
| p.G298R | COAD | 1 |
| p.P486L | HNSC | 1 |
| p.H142N | COAD | 1 |
| p.D63N | HNSC | 1 |
| p.E61K | UCEC | 1 |
| p.A364E | HNSC | 1 |
| p.R143H | PAAD | 1 |
| p.D63N | COAD | 1 |
| p.S508C | HNSC | 1 |
| p.S128P | UCEC | 1 |
| p.L454F | BLCA | 1 |
| p.E368V | LUAD | 1 |
| p.A241T | STAD | 1 |
| p.G554V | UCEC | 1 |
| p.D427Y | STAD | 1 |
| p.R76H | COAD | 1 |
| p.G35R | ACC | 1 |
| p.E195K | CESC | 1 |
| p.V255G | STAD | 1 |
| p.G308* | LUSC | 1 |
| p.C146* | HNSC | 1 |
| p.Q520H | OV | 1 |
| p.G148E | LIHC | 1 |
| p.F66L | LUSC | 1 |
| p.K258N | STAD | 1 |
| p.E130K | SKCM | 1 |
| p.G77S | COAD | 1 |
| p.P178R | LIHC | 1 |
| p.G31V | LUAD | 1 |
| p.M168L | HNSC | 1 |
| p.E281* | ESCA | 1 |
| p.S270Y | ESCA | 1 |
| p.A432P | LUAD | 1 |
| p.Y135X | COAD | 1 |
| p.V488L | BLCA | 1 |
| p.D301N | LIHC | 1 |
| p.S12Y | LUAD | 1 |
| p.S157T | BLCA | 1 |
| p.S462F | READ | 1 |
| p.L116P | LIHC | 1 |
| p.G264E | PRAD | 1 |
| p.V306F | STAD | 1 |
| p.R268H | UCEC | 1 |
| p.S166Y | UCEC | 1 |
| p.G279W | LUAD | 1 |
| p.A491V | BLCA | 1 |
| p.R143H | STAD | 1 |
| p.P43L | LUSC | 1 |
| p.R322C | PRAD | 1 |
| p.I543V | STAD | 1 |
| p.R143H | SKCM | 1 |
| p.E281X | ESCA | 1 |
| p.R123W | HNSC | 1 |
| p.L443P | COAD | 1 |
| p.R124C | BLCA | 1 |
| p.R231Q | UCEC | 1 |
| p.V219I | STAD | 1 |
| p.D125G | LUAD | 1 |
| p.A38T | STAD | 1 |
| p.E472D | BLCA | 1 |
| p.L428I | UCEC | 1 |
| p.G294R | LUAD | 1 |
| p.N65K | COAD | 1 |
| p.H52N | LUAD | 1 |
| Top |
| TissGeneCNV for GLUD2 |
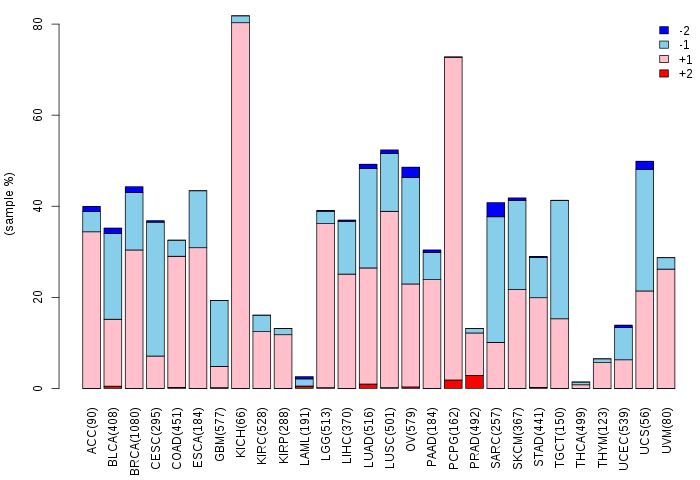
| Copy number variations of TissGene across 28 cancer types (X-axis: cancer type and Y-axis: % of CNV samples) (TCGA Gistic2_CopyNumber_Gistic2_all_data_by_genes, Gistic2 copy number data, version 2016-08-16) |
 |
| Top |
| TissGeneFusions for GLUD2 |
| Fusion genes including TissGene (ChimerDB 3.0, 2016-12-01 and TCGA fusion Portal 2015-12-01) |
| Database | Src | Cancer type | Sample | Fusion gene | ORF | 5'-gene BP | 3'-gene BP |
| Top |
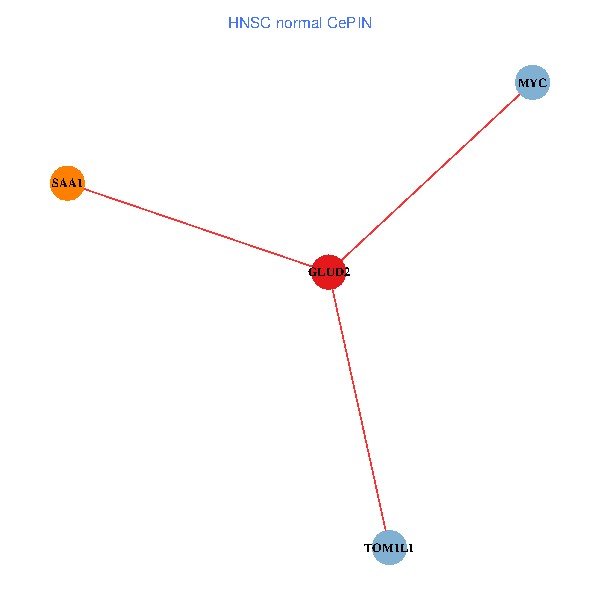
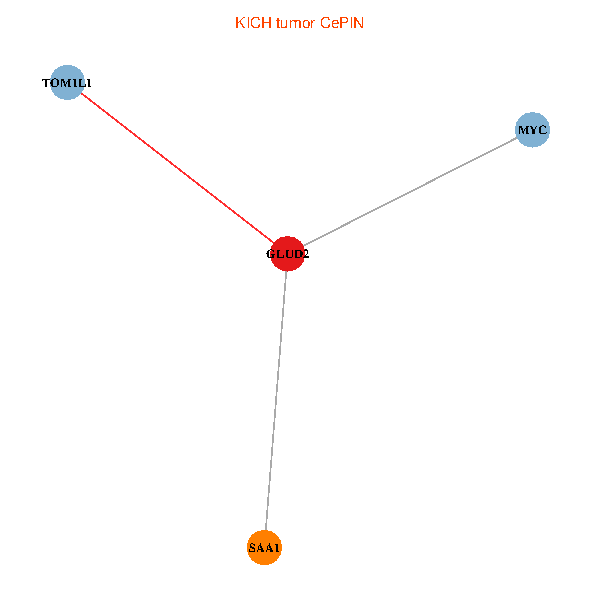
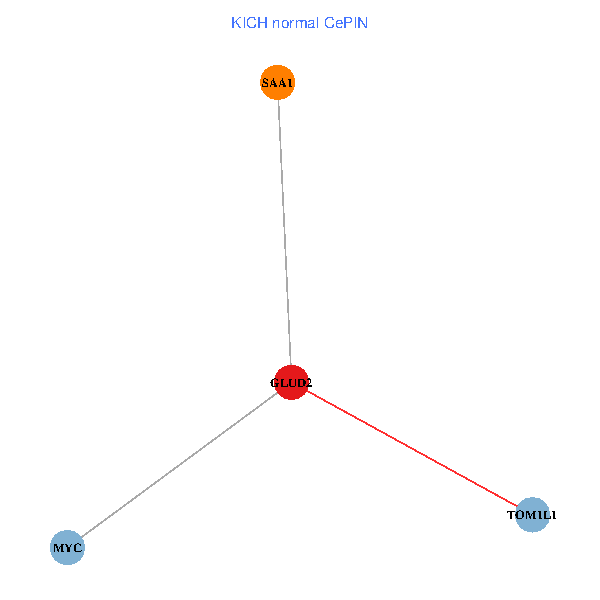
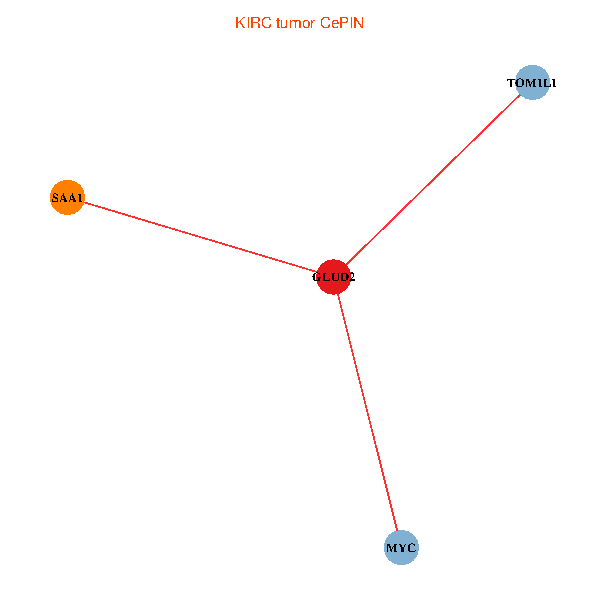
| TissGeneNet for GLUD2 |
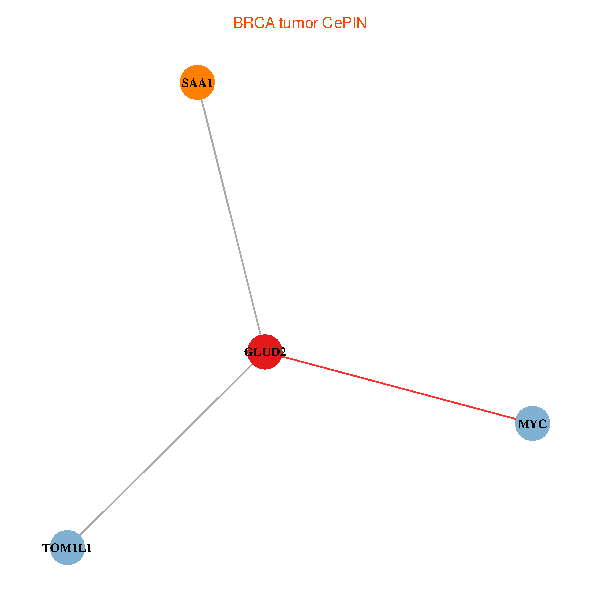
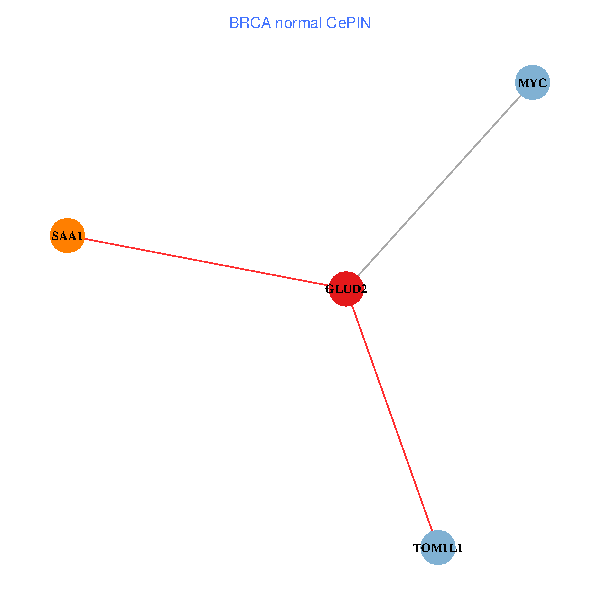
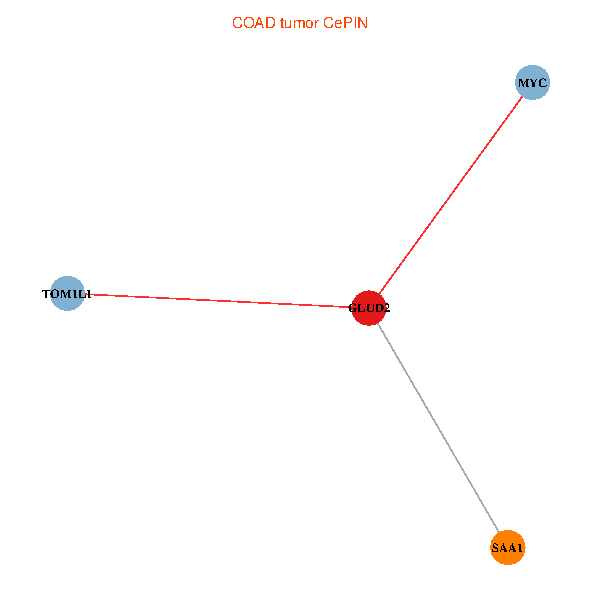
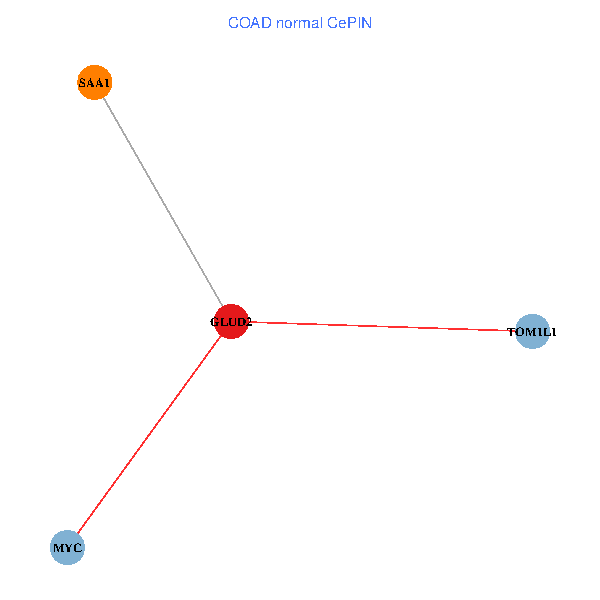
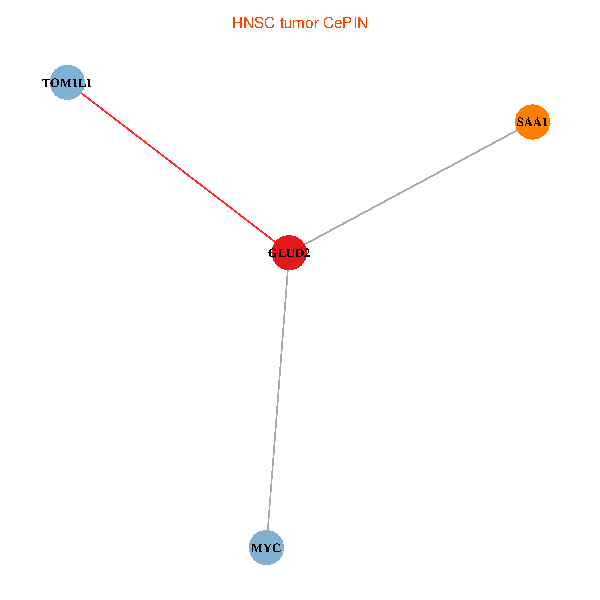
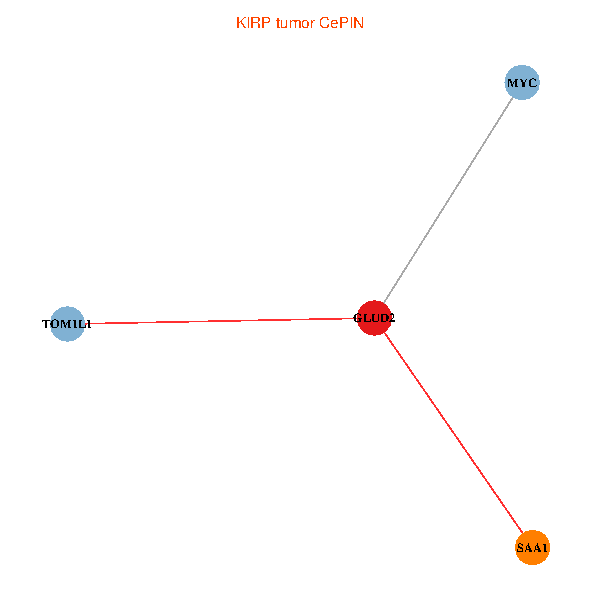
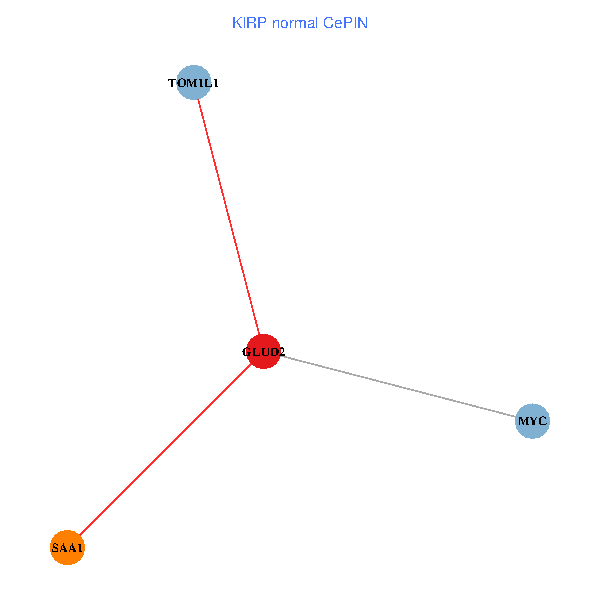
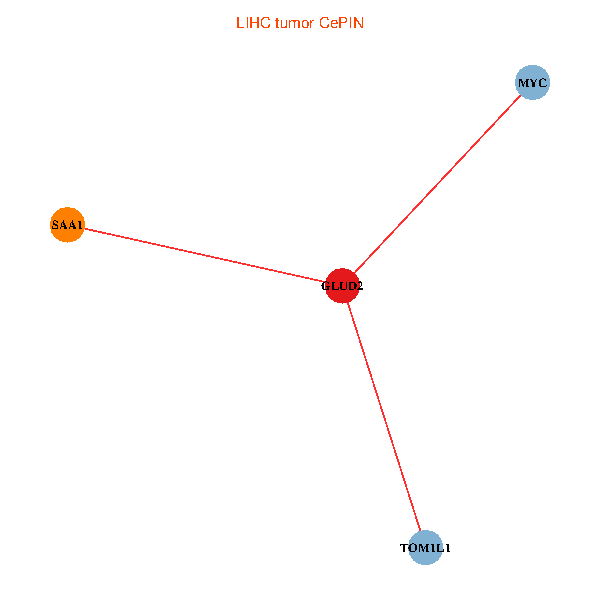
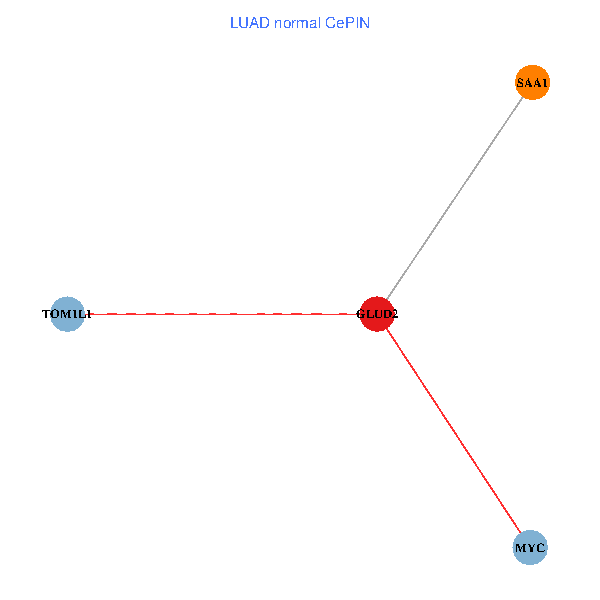
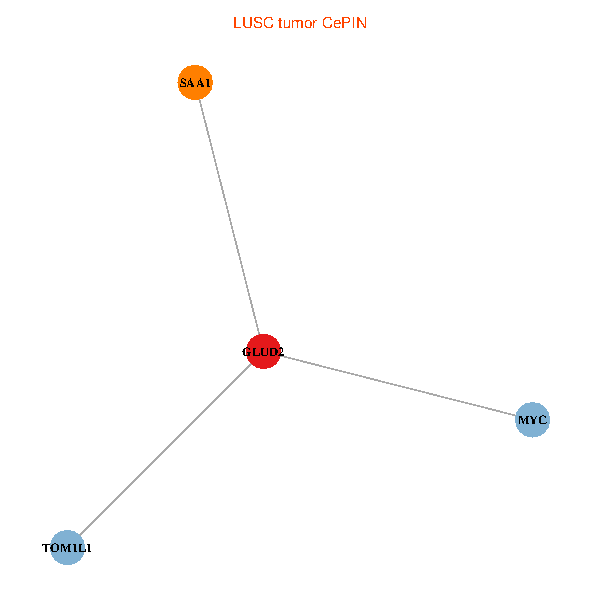
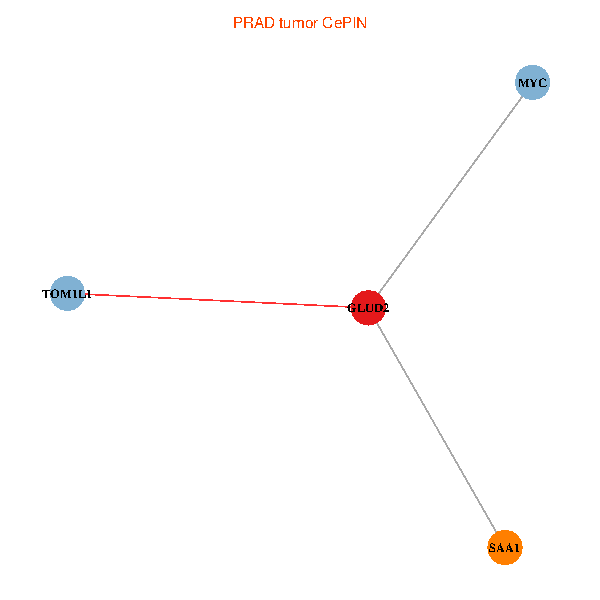
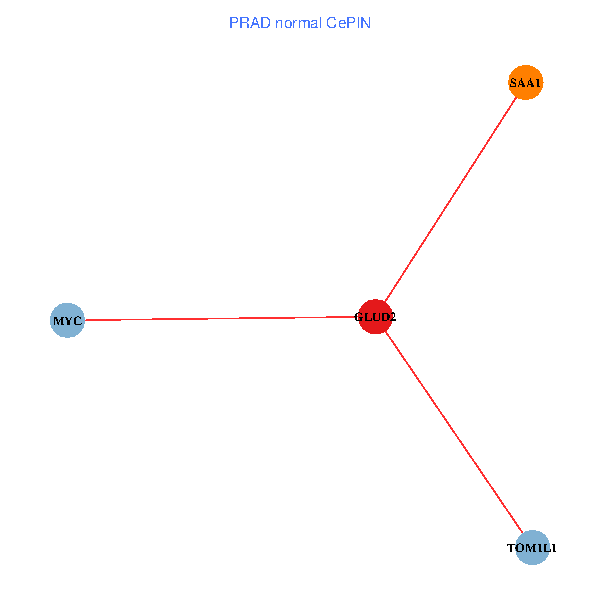
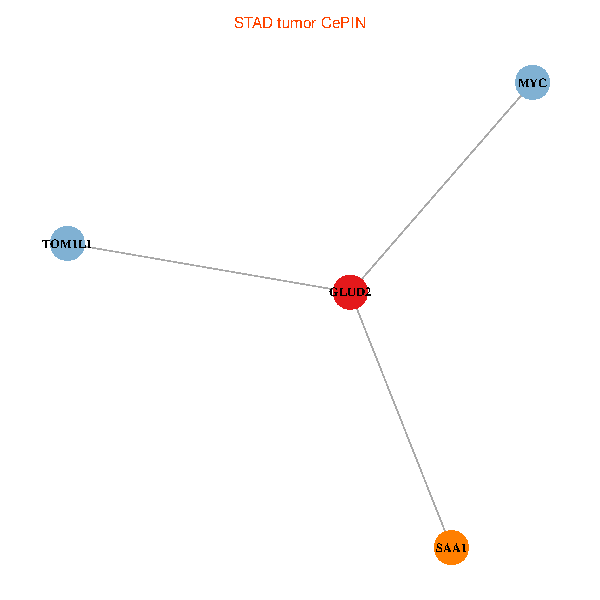
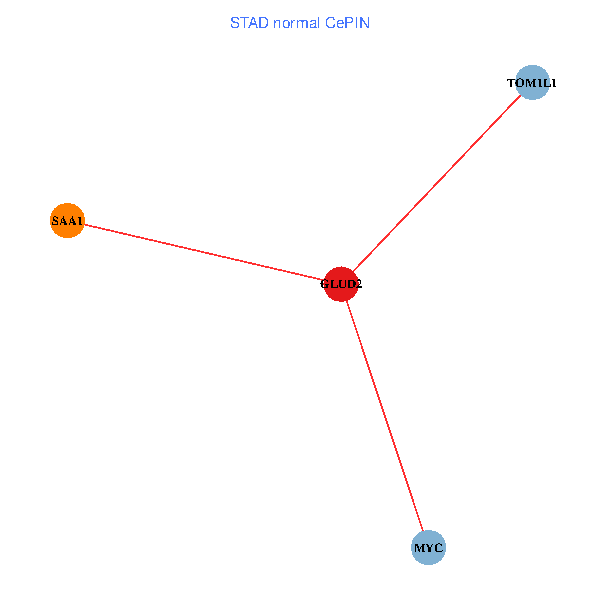
| Co-expressed gene networks based on protein-protein interaction data (CePIN) (TCGA IlluminaHiSeq_RNASeqV2, pan-cancer normalized log2(norm_counts+1) data, version 2016-08-16) (PINA2 ppi data) |
| BRCA (tumor) | BRCA (normal) |
| GLUD2, MYC, SAA1, TOM1L1 (tumor) | GLUD2, MYC, SAA1, TOM1L1 (normal) |
 |  |
| COAD (tumor) | COAD (normal) |
| GLUD2, MYC, SAA1, TOM1L1 (tumor) | GLUD2, MYC, SAA1, TOM1L1 (normal) |
 |  |
| HNSC (tumor) | HNSC (normal) |
| GLUD2, MYC, SAA1, TOM1L1 (tumor) | GLUD2, MYC, SAA1, TOM1L1 (normal) |
 |  |
| KICH (tumor) | KICH (normal) |
| GLUD2, MYC, SAA1, TOM1L1 (tumor) | GLUD2, MYC, SAA1, TOM1L1 (normal) |
 |  |
| KIRC (tumor) | KIRC (normal) |
| GLUD2, MYC, SAA1, TOM1L1 (tumor) | GLUD2, MYC, SAA1, TOM1L1 (normal) |
 |  |
| KIRP (tumor) | KIRP (normal) |
| GLUD2, MYC, SAA1, TOM1L1 (tumor) | GLUD2, MYC, SAA1, TOM1L1 (normal) |
 |  |
| LIHC (tumor) | LIHC (normal) |
| GLUD2, MYC, SAA1, TOM1L1 (tumor) | GLUD2, MYC, SAA1, TOM1L1 (normal) |
 |  |
| LUAD (tumor) | LUAD (normal) |
| GLUD2, MYC, SAA1, TOM1L1 (tumor) | GLUD2, MYC, SAA1, TOM1L1 (normal) |
 |  |
| LUSC (tumor) | LUSC (normal) |
| GLUD2, MYC, SAA1, TOM1L1 (tumor) | GLUD2, MYC, SAA1, TOM1L1 (normal) |
 |  |
| PRAD (tumor) | PRAD (normal) |
| GLUD2, MYC, SAA1, TOM1L1 (tumor) | GLUD2, MYC, SAA1, TOM1L1 (normal) |
 |  |
| STAD (tumor) | STAD (normal) |
| GLUD2, MYC, SAA1, TOM1L1 (tumor) | GLUD2, MYC, SAA1, TOM1L1 (normal) |
 |  |
| THCA (tumor) | THCA (normal) |
| GLUD2, MYC, SAA1, TOM1L1 (tumor) | GLUD2, MYC, SAA1, TOM1L1 (normal) |
 |  |
| Top |
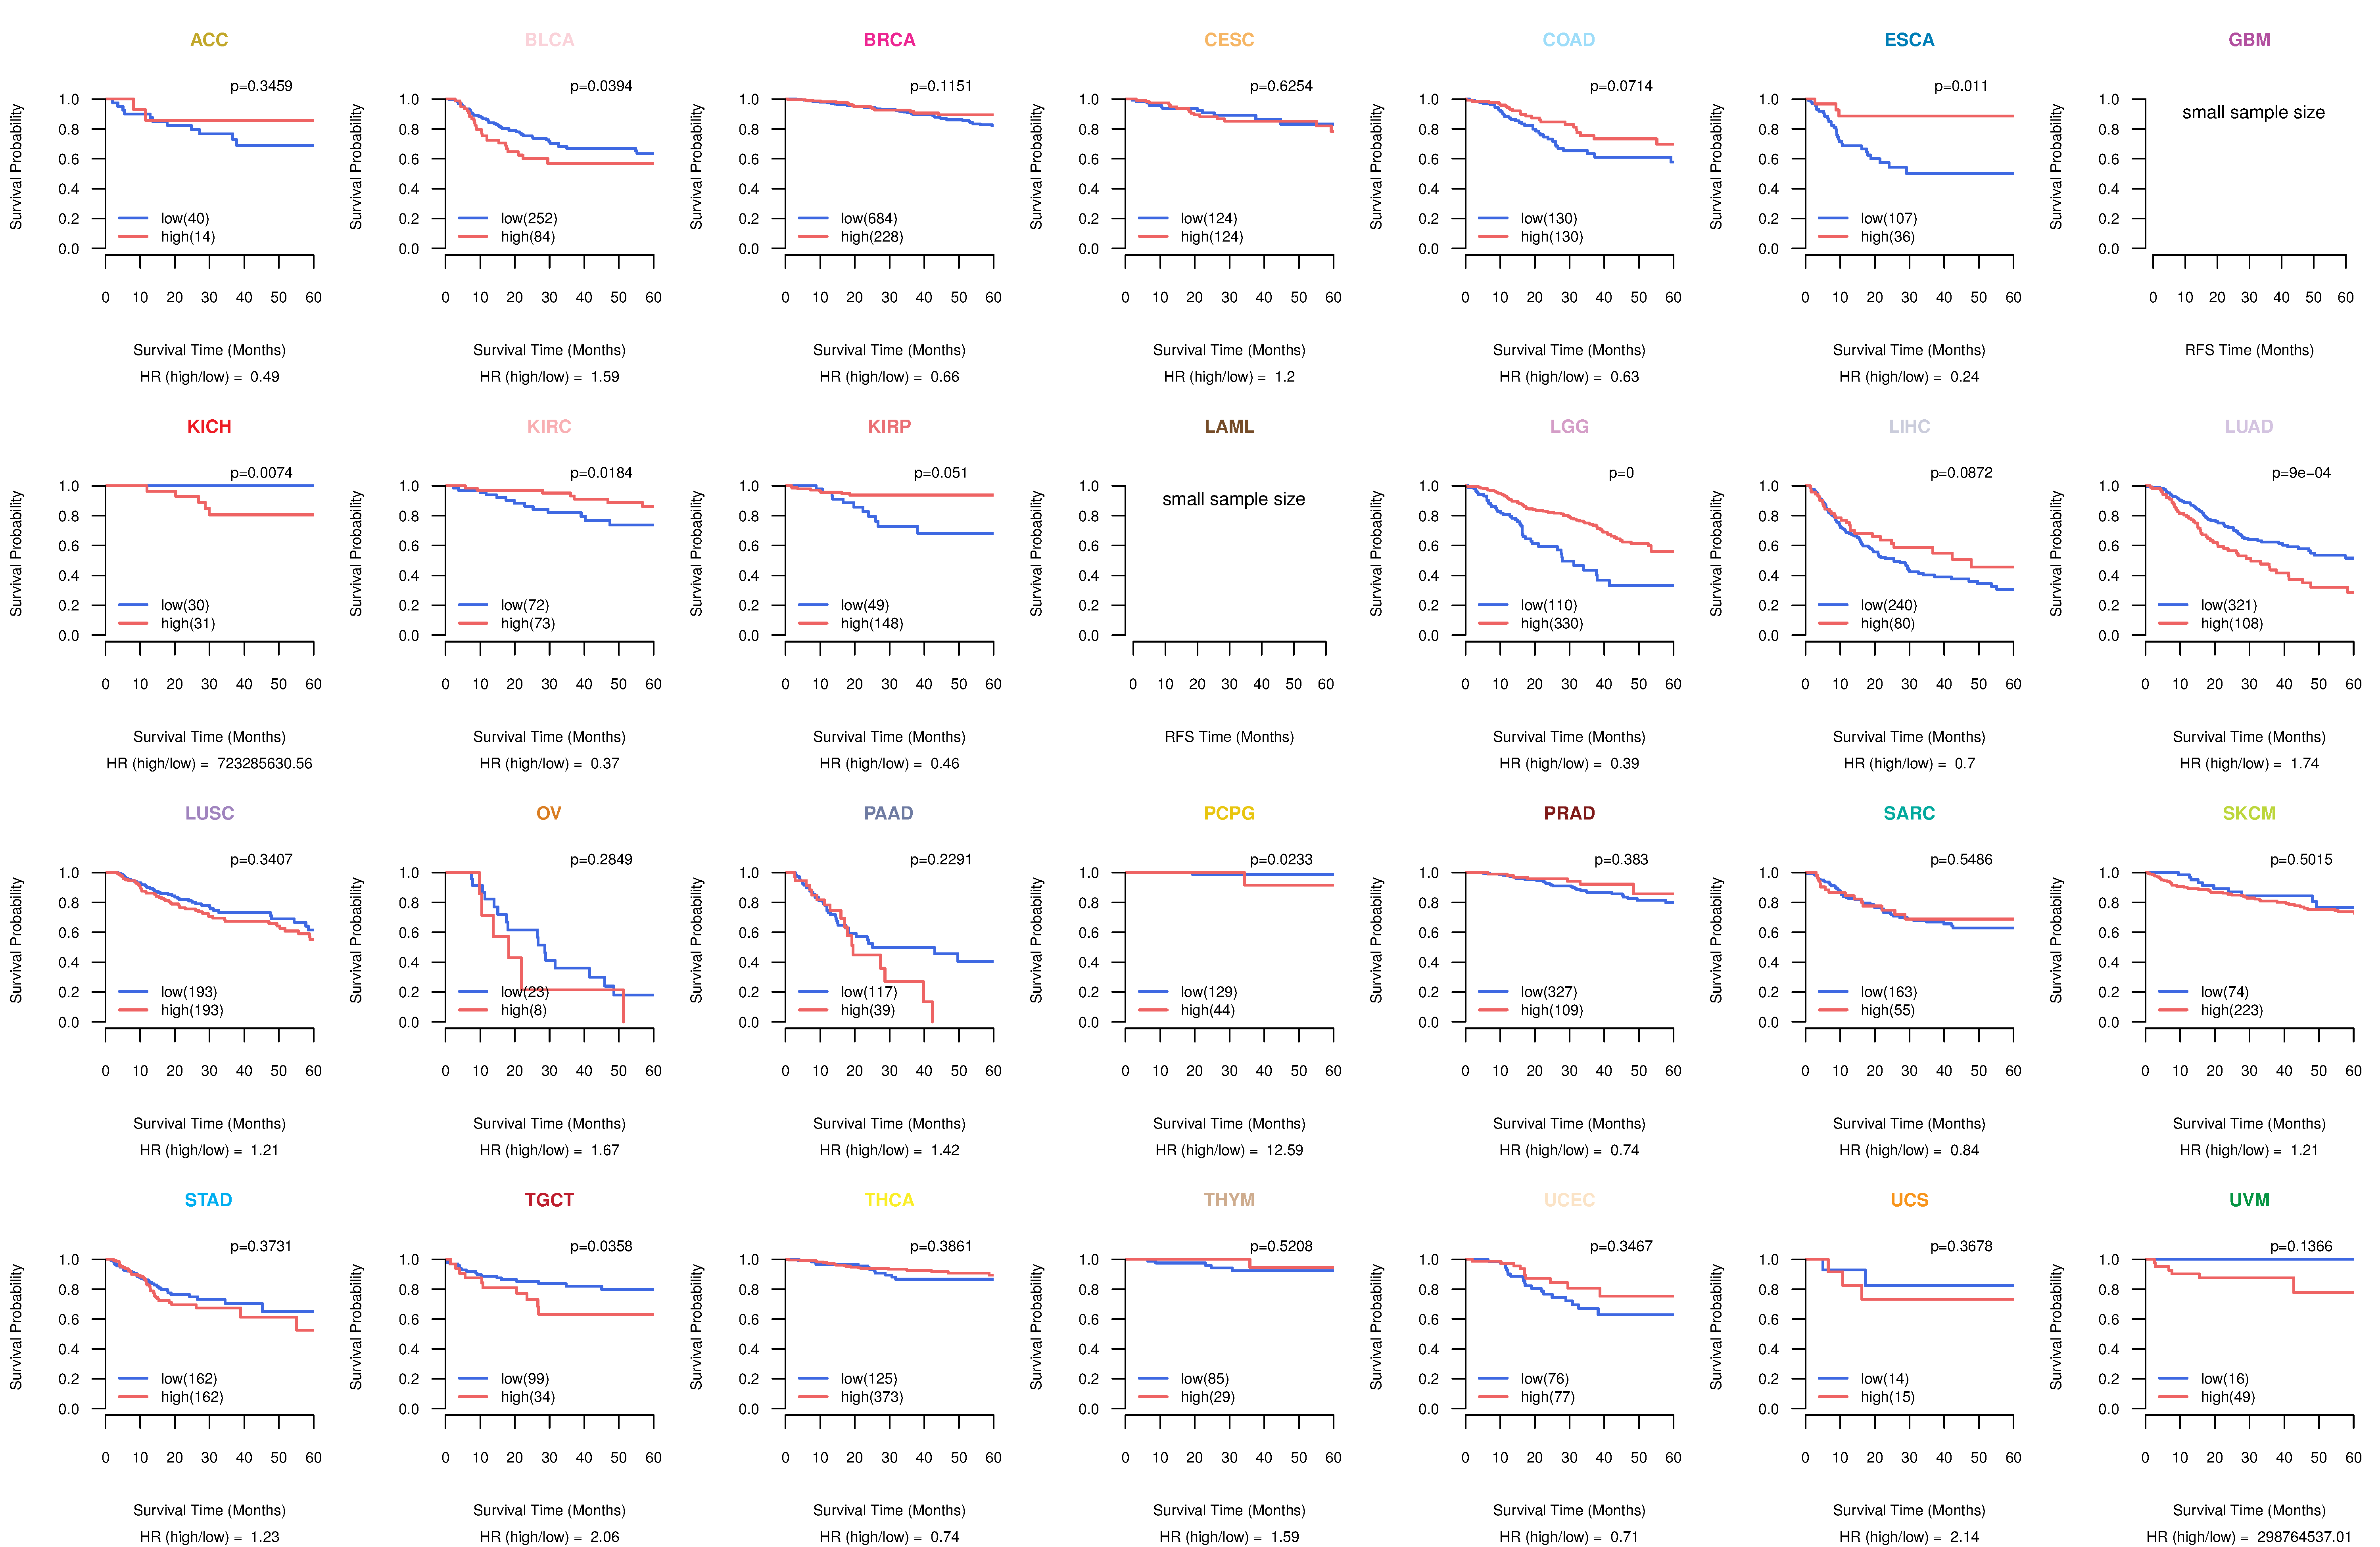
| TissGeneProg for GLUD2 |
| Kaplan-Meier plots with logrank tests of overall survival (OS) using 28 cancer types (TCGA IlluminaHiSeq_RNASeqV2, pan-cancer normalized log2(norm_counts+1) data, version 2016-08-16) (TCGA clinicalMatrix, phenotype data, version 2016-04-27) * Click on the image to enlarge it in a new window. |
 |
| Kaplan-Meier plots with logrank test of relapse free survival (RFS) using 28 cancer types (TCGA IlluminaHiSeq_RNASeqV2, pan-cancer normalized log2(norm_counts+1) data, version 2016-08-16) (TCGA clinicalMatrix, phenotype data, version 2016-04-27) * Click on the image enlarge it in a new window. |
 |
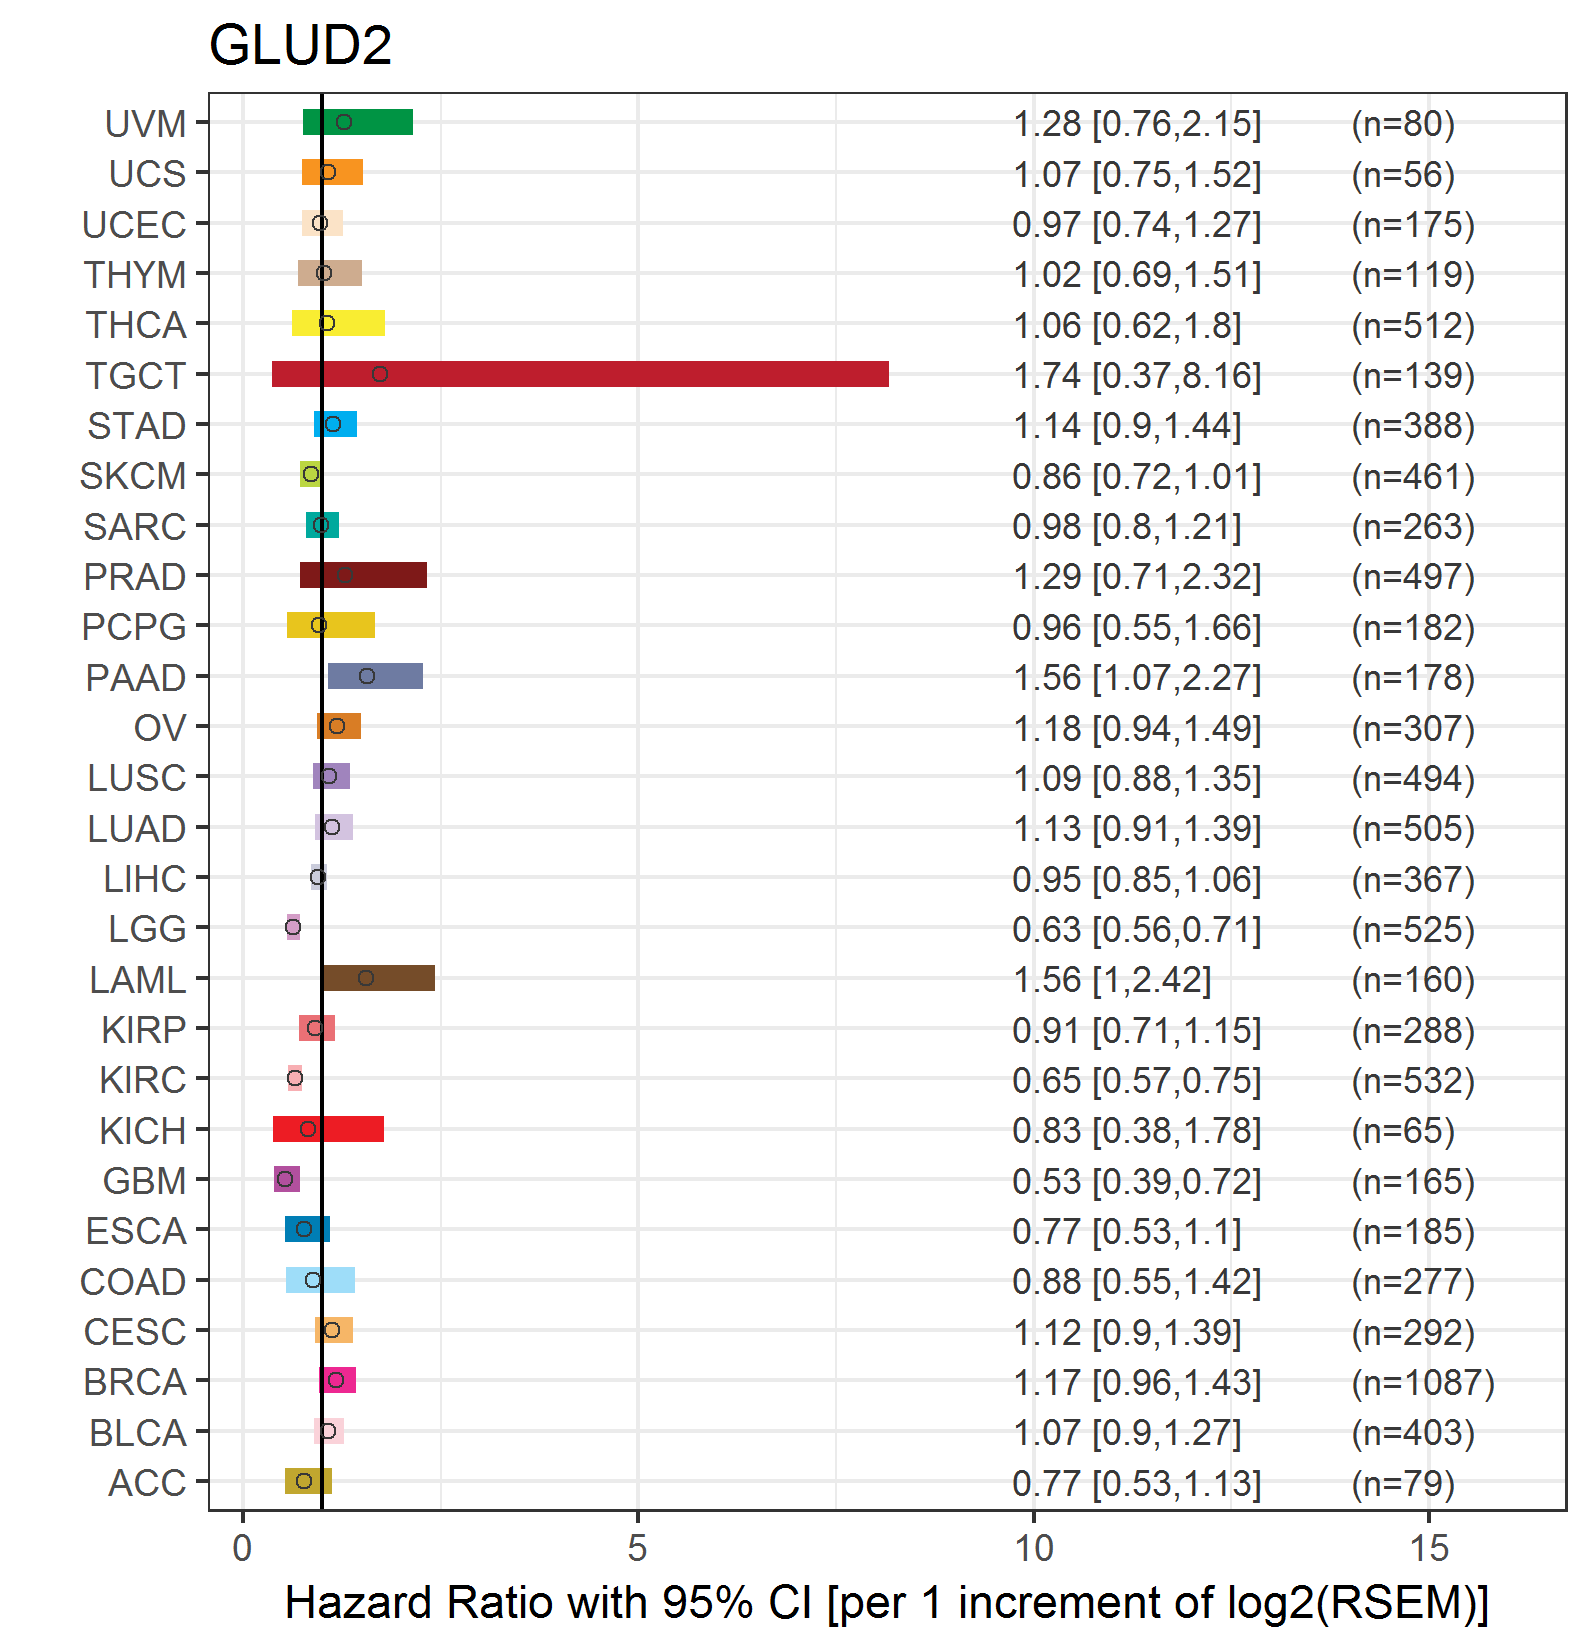
| Forest plot of Cox proportional hazard ratio (HR) and 95% CI of overall survival (OS) using 28 cancer types (TCGA IlluminaHiSeq_RNASeqV2, pan-cancer normalized log2(norm_counts+1) data, version 2016-08-16) (TCGA clinicalMatrix, phenotype data, version 2016-04-27) * Click on the image enlarge it in a new window. |
 |
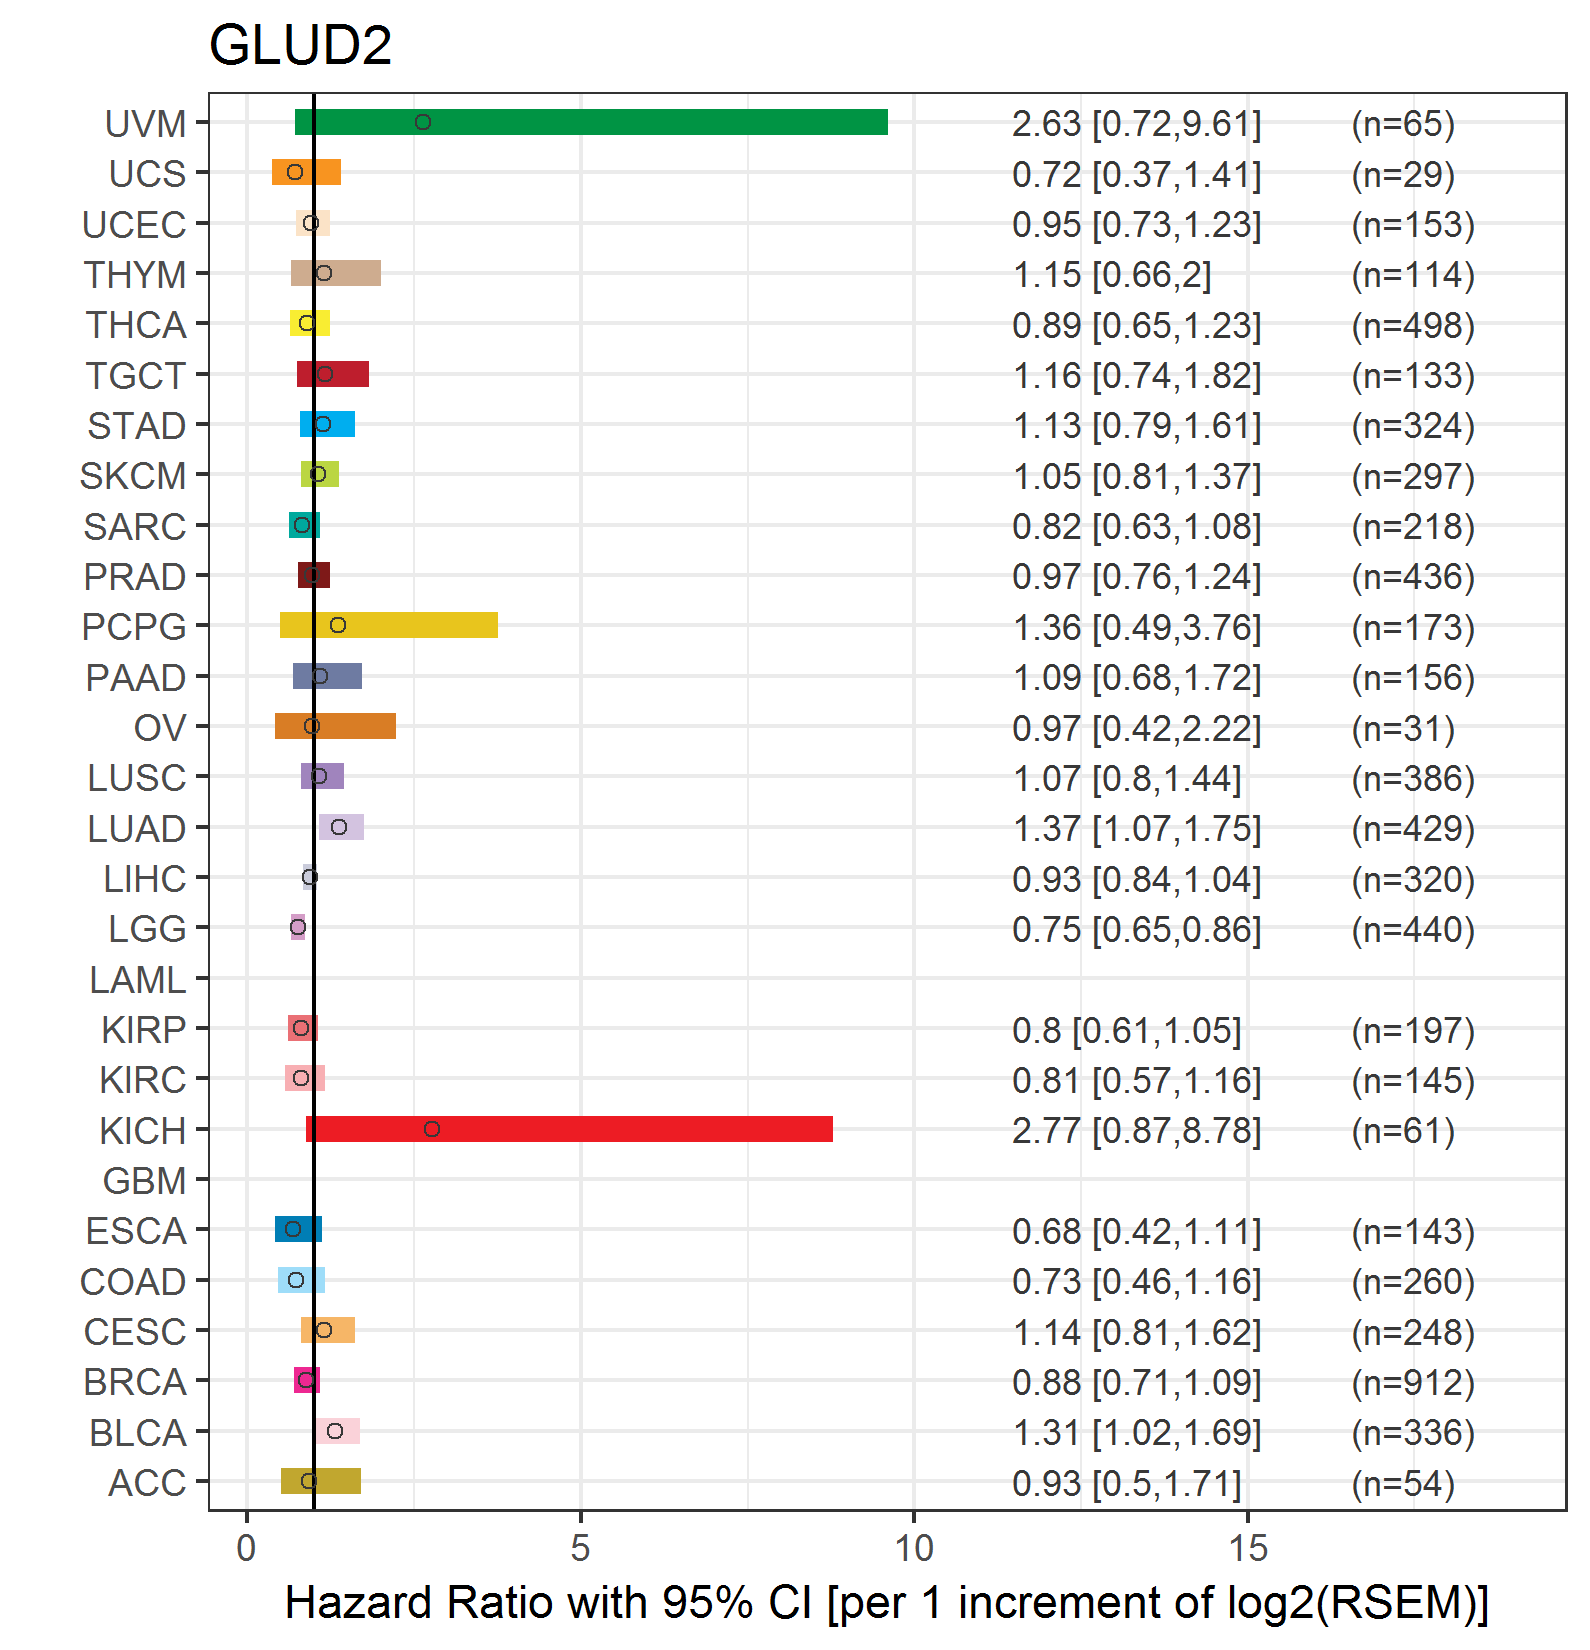
| Forest plot of Cox proportional hazard ratio (HR) and 95% CI of relapse free survival (RFS) using 28 cancer types (TCGA IlluminaHiSeq_RNASeqV2, pan-cancer normalized log2(norm_counts+1) data, version 2016-08-16) (TCGA clinicalMatrix, phenotype data, version 2016-04-27) * Click on the image enlarge it in a new window. |
 |
| Top |
| TissGeneClin for GLUD2 |
| TissGeneDrug for GLUD2 |
| Drug information targeting TissGene (DrugBank Version 5.0.6, 2017-04-01) |
| DrugBank ID | Drug name | Drug activity | Drug type | Drug status |
| Top |
| TissGeneDisease for GLUD2 |
| Disease information associated with TissGene (DisGeNet, 2016-06-01) |
| Disease ID | Disease name | # pubmeds | Source |
| umls:C0017638 | Glioma | 1 | BeFree |
| umls:C0030567 | Parkinson Disease | 1 | GAD |
| umls:C0043094 | Weight Gain | 1 | GAD |
| umls:C0520966 | Abnormal coordination | 1 | BeFree |
| umls:C2911647 | Weight Gain Adverse Event | 1 | GAD |
| umls:C3160718 | PARKINSON DISEASE, LATE-ONSET | 0 | CLINVAR |
|
Copyright 2016-Present - The University of Texas Health Science Center at Houston (UTHealth) Web File Viewing | How to Report, Fraud, Waste and Abuse | State of Texas | Statewide Search | Texas Homeland Security | Site Policies |