 |
| |
| |
| |
| |
| |
| |
|

| TissGeneSummary for AMY2A |
 Gene summary Gene summary |
| Basic gene information | Gene symbol | AMY2A |
| Gene name | amylase, alpha 2A (pancreatic) | |
| Synonyms | AMY2|AMY2B|PA | |
| Cytomap | UCSC genome browser: 1p21 | |
| Type of gene | protein-coding | |
| RefGenes | NM_000699.2, | |
| Description | 1,4-alpha-D-glucan glucanohydrolasealpha-amylaseamylase, pancreatic, alpha-2Afound in the pancreasglycogenasepancreatic alpha-amylasepancreatic amylase 2Apancreatic amylase alpha 2A | |
| Modification date | 20141207 | |
| dbXrefs | MIM : 104650 | |
| HGNC : HGNC | ||
| Ensembl : ENSG00000243480 | ||
| HPRD : 00094 | ||
| Vega : OTTHUMG00000011023 | ||
| Protein | UniProt: go to UniProt's Cross Reference DB Table | |
| Expression | CleanEX: HS_AMY2A | |
| BioGPS: 279 | ||
| Pathway | NCI Pathway Interaction Database: AMY2A | |
| KEGG: AMY2A | ||
| REACTOME: AMY2A | ||
| Pathway Commons: AMY2A | ||
| Context | iHOP: AMY2A | |
| ligand binding site mutation search in PubMed: AMY2A | ||
| UCL Cancer Institute: AMY2A | ||
| Assigned class in TissGDB* | B | |
| Included tissue-specific gene expression resources | HPA,TiGER,GTEx | |
| Specific-tissues in normal samples (assigned by TissGDB using HPA, TiGER, and GTEx) | Pancreas | |
| Cancer types related to the specific-tissues in cancer samples (assigned by TissGDB using TCGA) | PAAD | |
| Reference showing the relevant tissue of AMY2A | ||
| Description by TissGene annotations | TissgsKTS CNV gained TissGeneKTS | |
| * Class A consists of genes with literature evidence and is part of the cTissGenes. Class B consists of only cTissGenes without additional evidence. The remaining genes belong to Class C. |
| Gene ontology having evidence of Inferred from Direct Assay (IDA) from Entrez |
| GO ID | GO term | PubMed ID | GO:0016052 | carbohydrate catabolic process | 10769135 | GO:0016052 | carbohydrate catabolic process | 10769135 |
| Top |
| TissGeneExp for AMY2A |
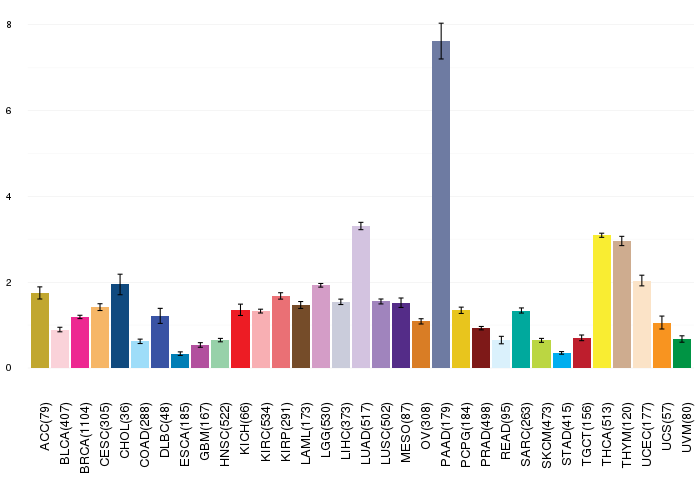
| Gene expressions across 28 cancer types (X-axis: cancer type and Y-axis: log2(norm_counts+1)) (TCGA IlluminaHiSeq_RNASeqV2, pan-cancer normalized log2(norm_counts+1) data, version 2016-08-16) |
 |
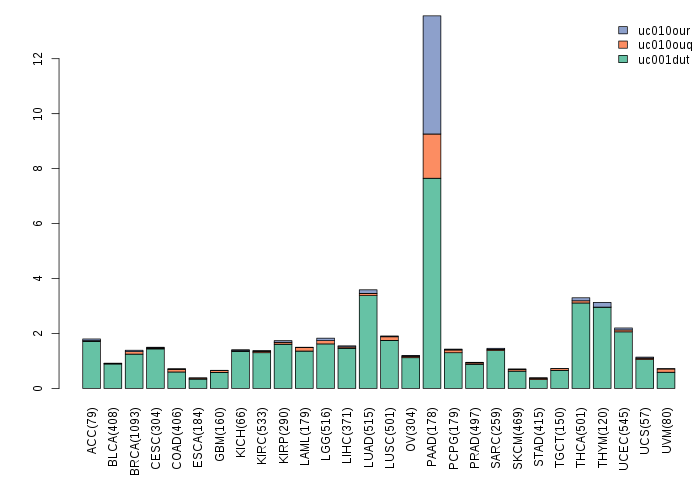
| Gene isoform expressions across 28 cancer types (X-axis: cancer type and Y-axis: log2(norm_counts+1)) (TCGA pan-cancer tcga_rsem_isoform_tpm, version 2016-09-01) |
 |
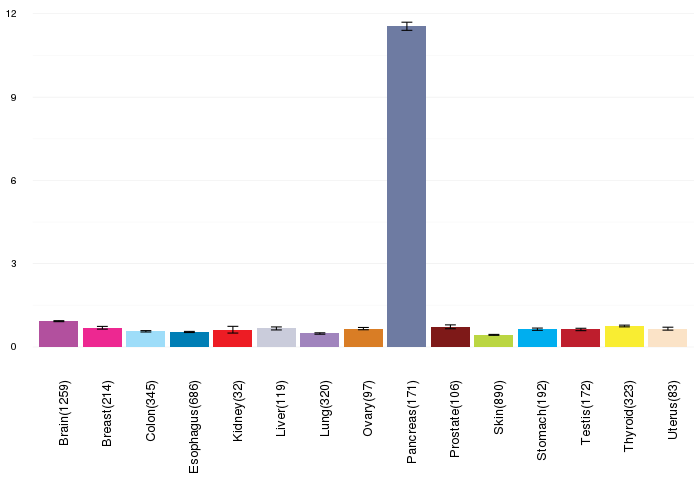
| Gene expressions across normal tissues of GTEx data (GTEx GTEx_Analysis_v6_RNA-seq_RNA-SeQCv1.1.8_gene_rpkm.gct) - Here, we shows the matched tissue types only among our 28 cancer types. |
 |
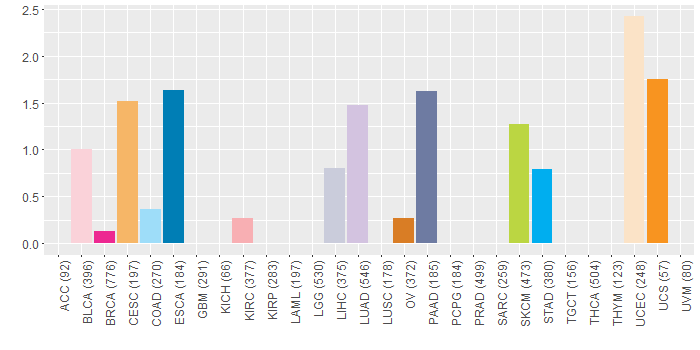
| Different expressions across 14 cancer types with more than 10 samples between matched tumors and normals (X-axis: cancer type and Y-axis: log2(norm_counts+1)) (TCGA IlluminaHiSeq_RNASeqV2, pan-cancer normalized log2(norm_counts+1) data, version 2016-08-16) |
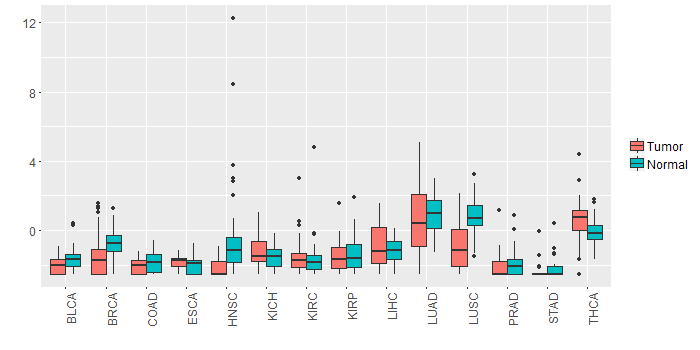 |
| - Significantly differentially expressed cancer types and information. (|Fold change|>1 and FDR<0.05) |
| Cancer type | Mean(exp) in tumor | Mean(exp) in matched normal | Log2FC | P-val. | FDR |
| LUSC | -0.895784895 | 0.815662164 | -1.711447059 | 6.08E-10 | 2.13E-09 |
| HNSC | -2.160415492 | -0.387436422 | -1.77297907 | 0.000233 | 0.000936161 |
| Top |
| TissGene-miRNA for AMY2A |
| Significantly anti-correlated miRNAs of TissGene across 28 cancer types (Gene-miRNA relations from TargetScanHuman Relsease 7.1, Conserved_Site_Context_Scores.txt.zip, 06.01.2016) (TCGA IlluminaHiSeq_miRNASeq, log2(RPM+1) data, version 2016-11-21) (TCGA IlluminaHiSeq_RNASeqV2, log2(normalized_count+1) data, version 2016-08-16) (Spearman’s Rank Correlation (p-value<0.05 and coefficient<-0.25)) |
| Cancer type | miRNA id | miRNA accession | P-val. | Coeff. | # samples |
| Top |
| TissGeneMut for AMY2A |
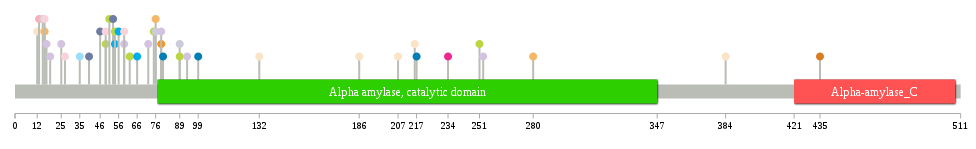
| TissGeneSNV for AMY2A |
| nsSNV counts per each loci. Different colors of circles represent different cancer types. Circle size denotes number of samples. (TCGA somatic mutation (SNPs and small INDELs) data, version 2016-04-25) * Click on the image to enlarge it in a new window. |
 |
 |
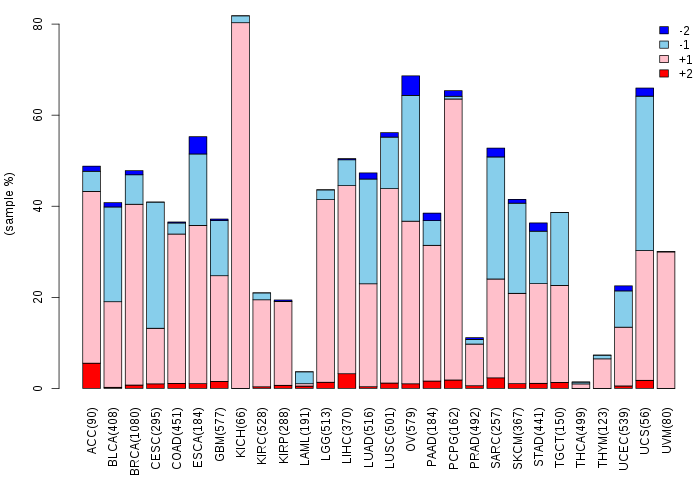
| Somatic nucleotide variants of TissGene across 28 cancer types (X-axis: cancer type and Y-axis: % of mutated samples) The numbers in parentheses are numbers of samples with mutation (nsSNVs). (TCGA somatic mutation (SNPs and small INDELs) data, version 2016-04-25) |
 |
| - nsSNVs sorted by frequency. |
| AAchange | Cancer type | # samples |
| p.R25W | HNSC | 1 |
| p.R25P | LUAD | 1 |
| p.Q56H | STAD | 1 |
| p.E75K | SKCM | 1 |
| p.G51E | SKCM | 1 |
| p.P19Q | LUAD | 1 |
| p.R76I | CESC | 1 |
| p.Q16* | BLCA | 1 |
| p.F12L | UCEC | 1 |
| p.P79A | LUAD | 1 |
| p.E384* | UCEC | 1 |
| p.G54E | SKCM | 1 |
| p.P59S | BLCA | 1 |
| p.V80G | ESCA | 1 |
| p.G435V | OV | 1 |
| p.R35Q | COAD | 1 |
| p.P49T | SKCM | 1 |
| p.G89A | LIHC | 1 |
| p.C13X | KIRC | 1 |
| p.P49S | BLCA | 1 |
| p.E93K | LUAD | 1 |
| p.A15T | LIHC | 1 |
| p.I66V | STAD | 1 |
| p.P79Q | UCS | 1 |
| p.E62X | READ | 1 |
| p.T99N | ESCA | 1 |
| p.R402G | DLBC | 1 |
| p.E62K | SKCM | 1 |
| p.V280I | CESC | 1 |
| p.M217T | ESCA | 1 |
| p.V64I | HNSC | 1 |
| p.G253C | LUAD | 1 |
| p.P72H | LUAD | 1 |
| p.Y46D | PAAD | 1 |
| p.A207T | UCEC | 1 |
| p.E186D | UCEC | 1 |
| p.G89E | SKCM | 1 |
| p.D251N | SKCM | 1 |
| p.G54E | STAD | 1 |
| p.A40V | PAAD | 1 |
| p.S27Y | BLCA | 1 |
| p.S234C | BRCA | 1 |
| p.Q16L | CESC | 1 |
| p.G53R | PAAD | 1 |
| p.R76I | LIHC | 1 |
| p.V80F | HNSC | 1 |
| p.Y17H | LUAD | 1 |
| p.S132R | UCEC | 1 |
| p.H216L | UCEC | 1 |
| p.P59Q | LUAD | 1 |
| Top |
| TissGeneCNV for AMY2A |
| Copy number variations of TissGene across 28 cancer types (X-axis: cancer type and Y-axis: % of CNV samples) (TCGA Gistic2_CopyNumber_Gistic2_all_data_by_genes, Gistic2 copy number data, version 2016-08-16) |
 |
| Top |
| TissGeneFusions for AMY2A |
| Fusion genes including TissGene (ChimerDB 3.0, 2016-12-01 and TCGA fusion Portal 2015-12-01) |
| Database | Src | Cancer type | Sample | Fusion gene | ORF | 5'-gene BP | 3'-gene BP |
| Top |
| TissGeneNet for AMY2A |
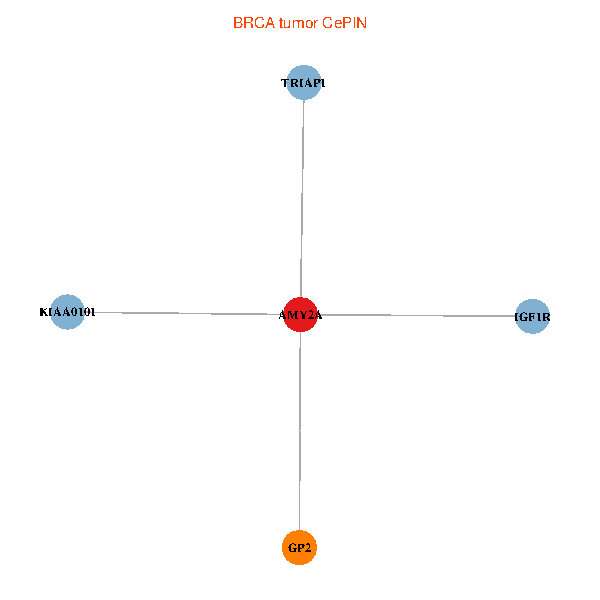
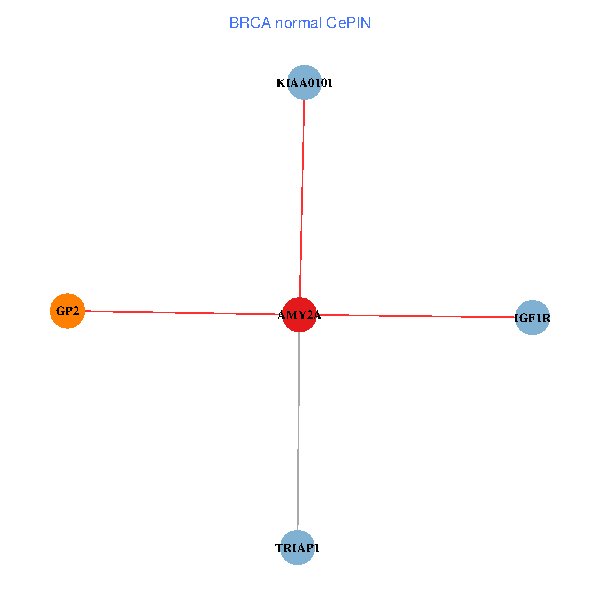
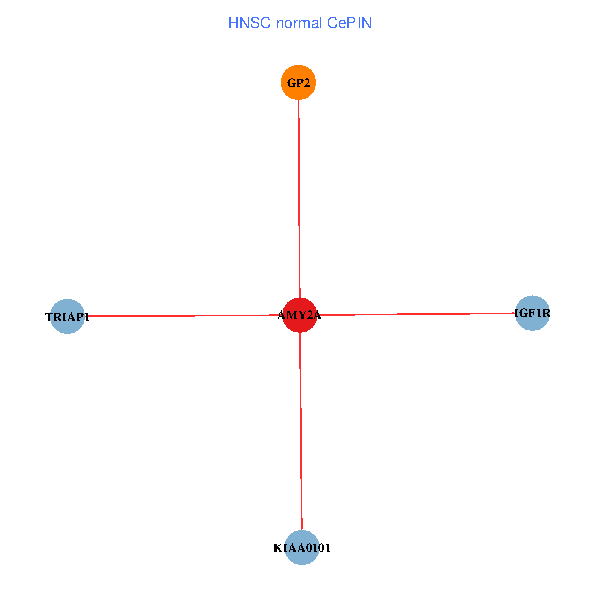
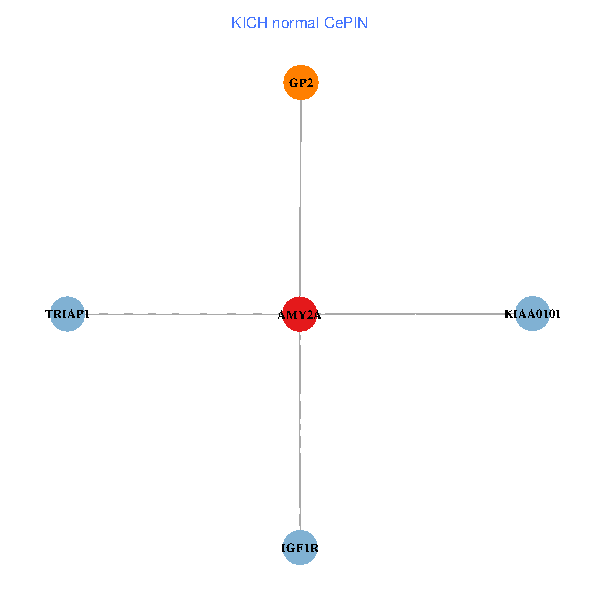
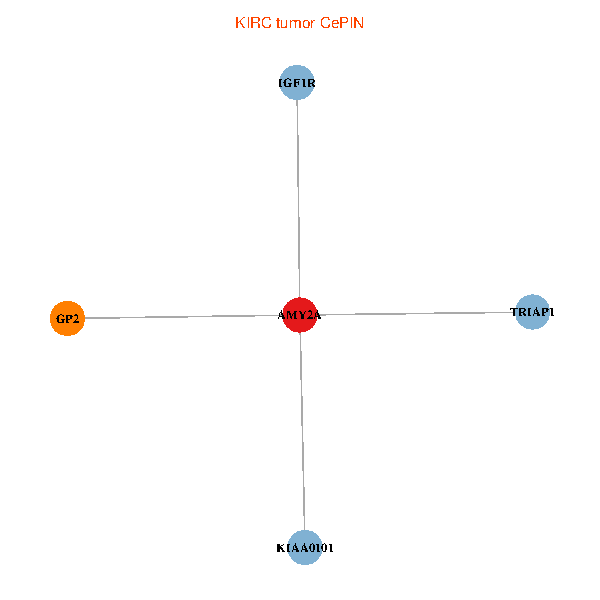
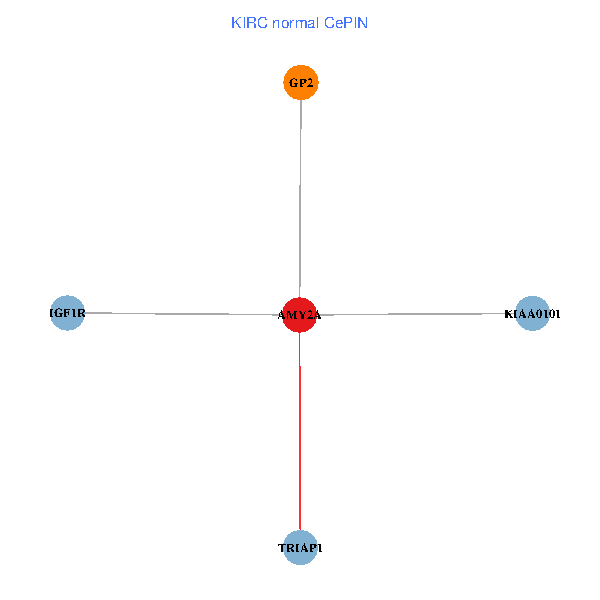
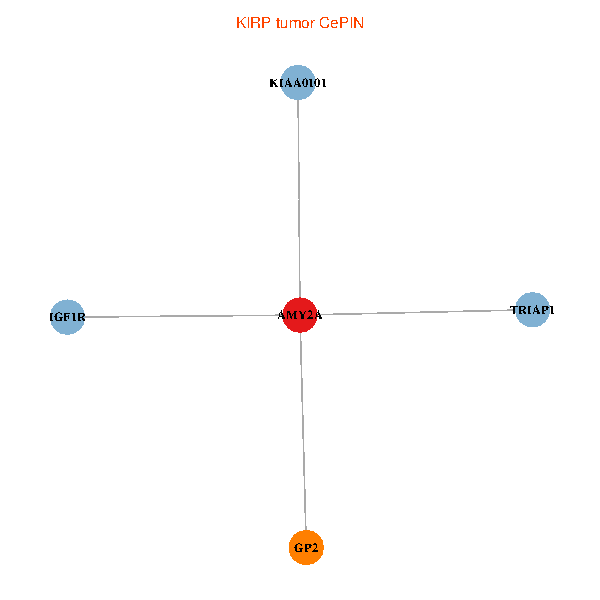
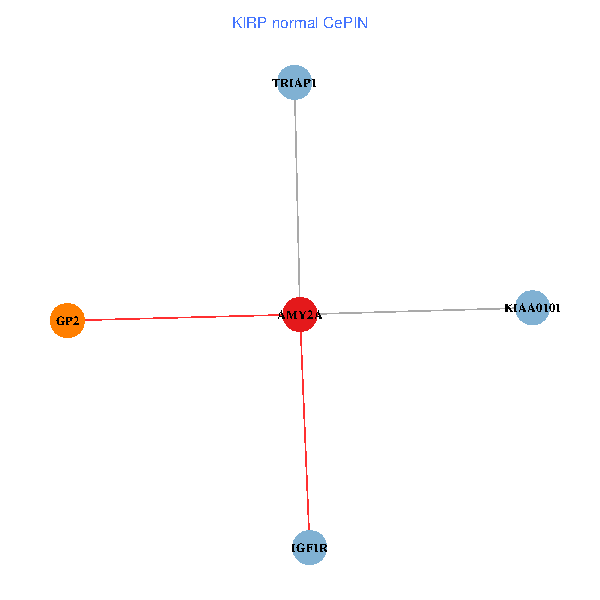
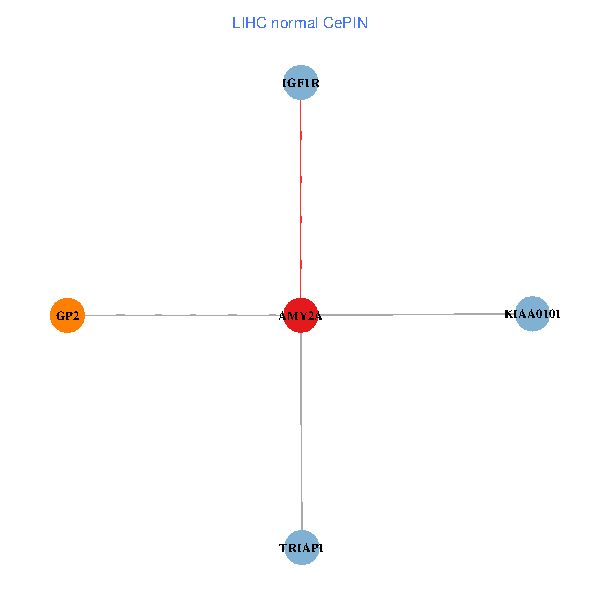
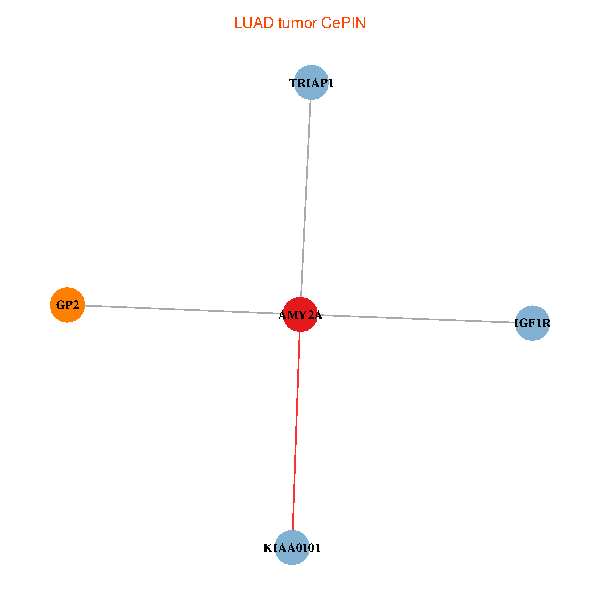
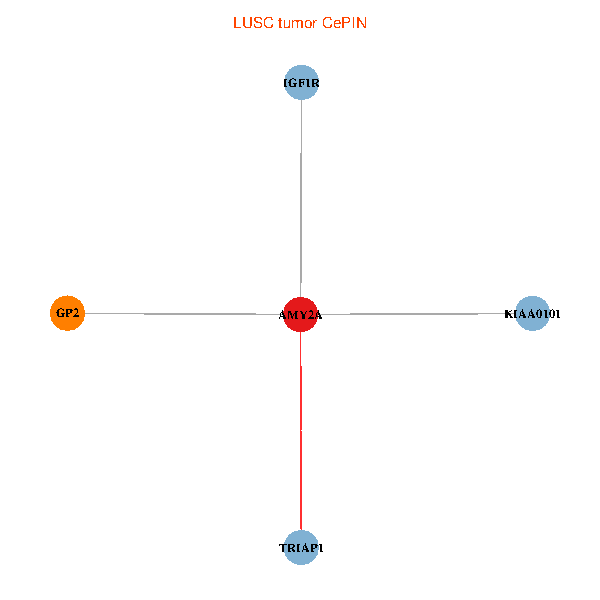
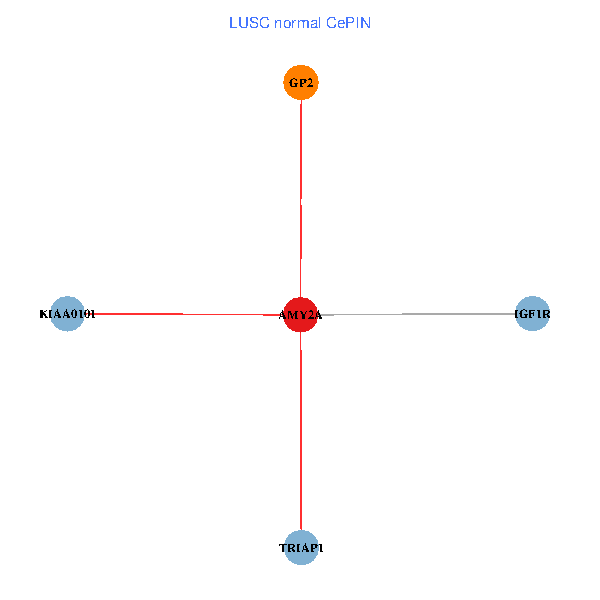
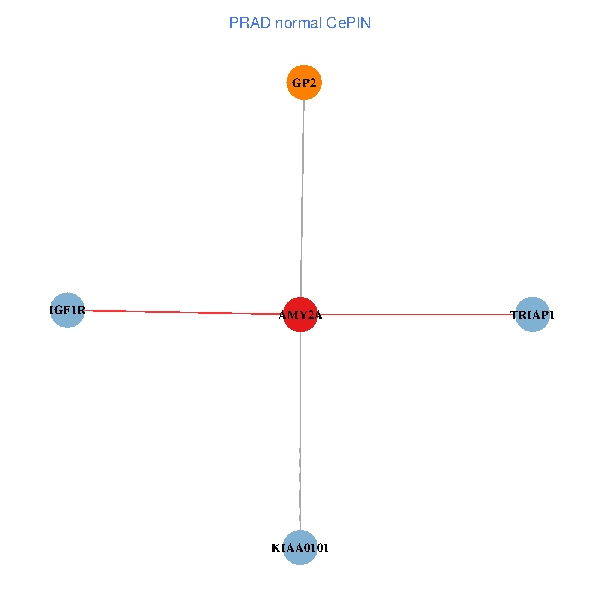
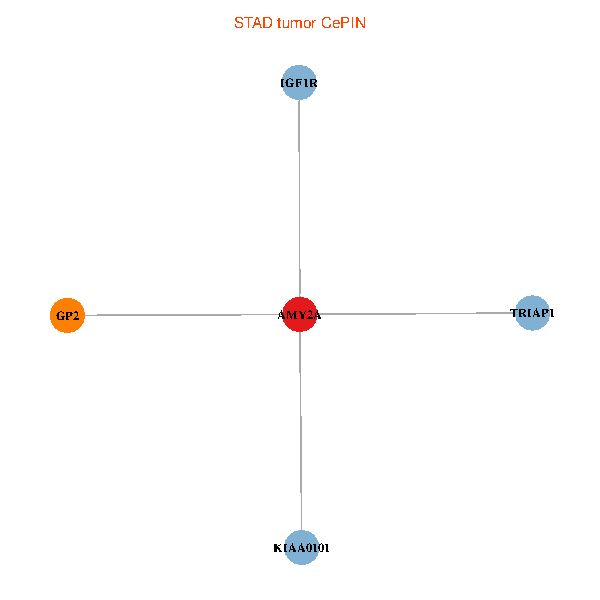
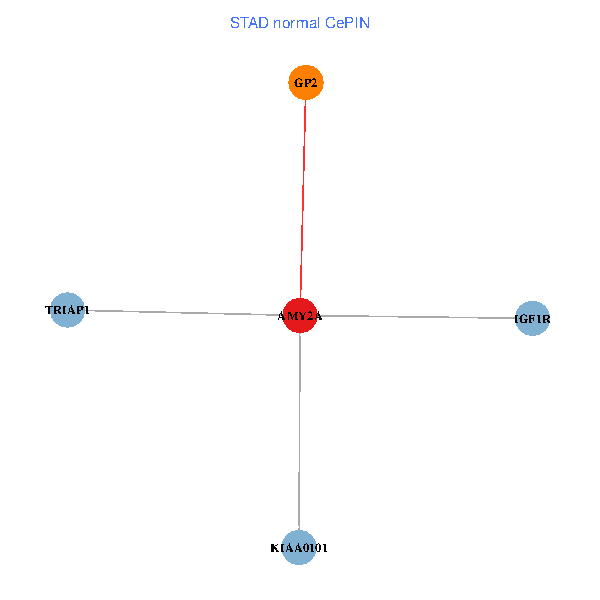
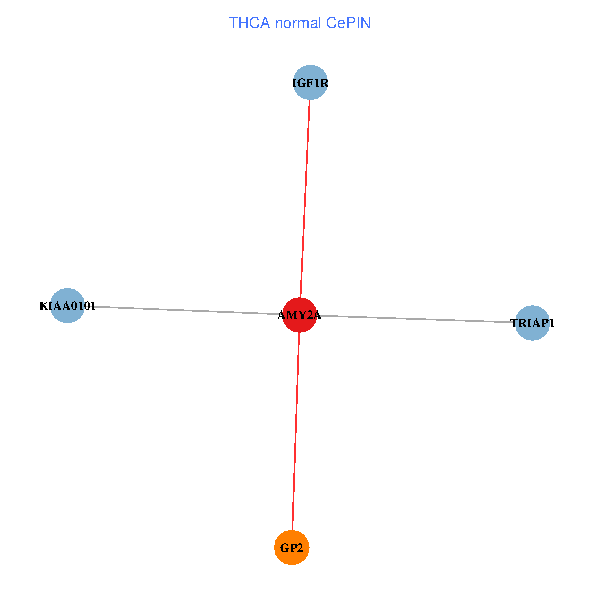
| Co-expressed gene networks based on protein-protein interaction data (CePIN) (TCGA IlluminaHiSeq_RNASeqV2, pan-cancer normalized log2(norm_counts+1) data, version 2016-08-16) (PINA2 ppi data) |
| BRCA (tumor) | BRCA (normal) |
| AMY2A, KIAA0101, IGF1R, TRIAP1, GP2 (tumor) | AMY2A, KIAA0101, IGF1R, TRIAP1, GP2 (normal) |
 |  |
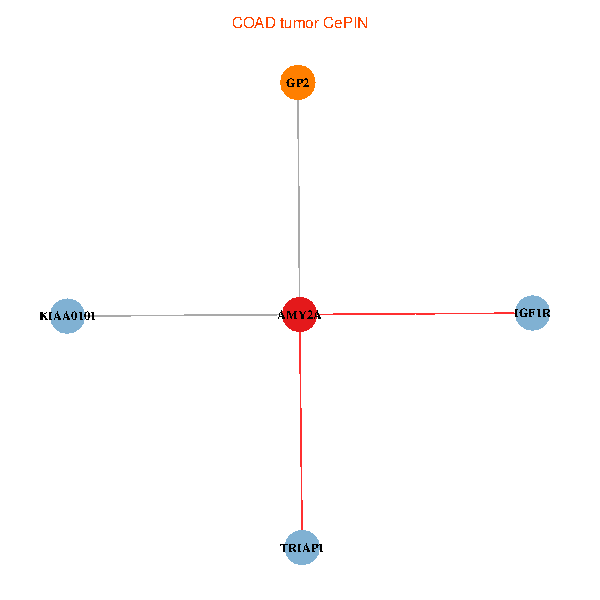
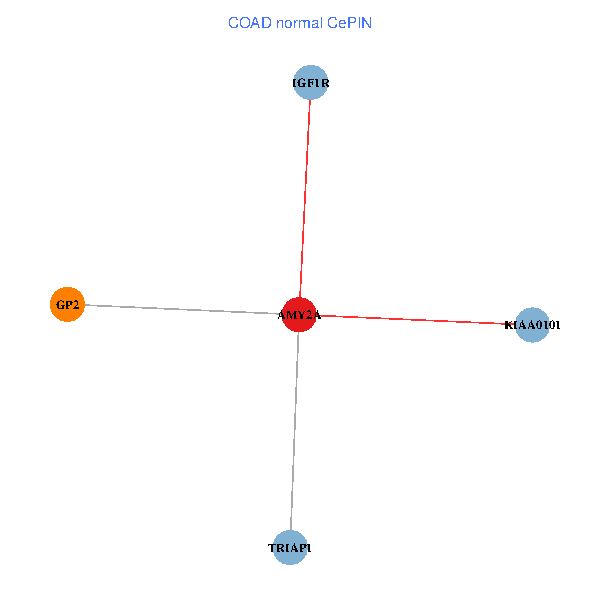
| COAD (tumor) | COAD (normal) |
| AMY2A, KIAA0101, IGF1R, TRIAP1, GP2 (tumor) | AMY2A, KIAA0101, IGF1R, TRIAP1, GP2 (normal) |
 |  |
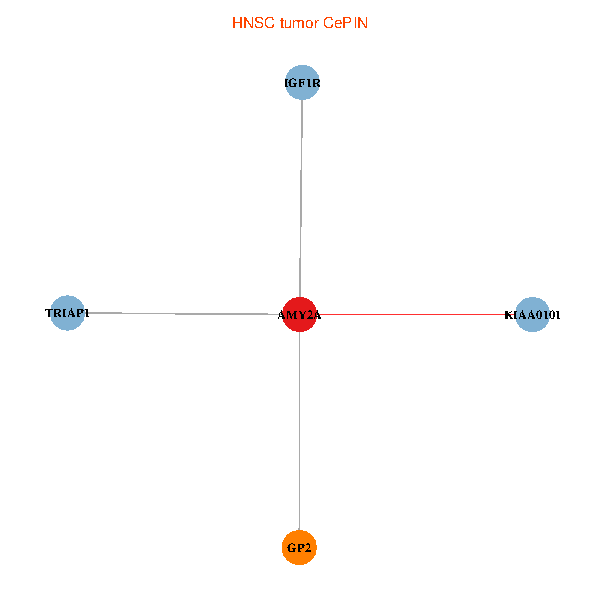
| HNSC (tumor) | HNSC (normal) |
| AMY2A, KIAA0101, IGF1R, TRIAP1, GP2 (tumor) | AMY2A, KIAA0101, IGF1R, TRIAP1, GP2 (normal) |
 |  |
| KICH (tumor) | KICH (normal) |
| AMY2A, KIAA0101, IGF1R, TRIAP1, GP2 (tumor) | AMY2A, KIAA0101, IGF1R, TRIAP1, GP2 (normal) |
 |  |
| KIRC (tumor) | KIRC (normal) |
| AMY2A, KIAA0101, IGF1R, TRIAP1, GP2 (tumor) | AMY2A, KIAA0101, IGF1R, TRIAP1, GP2 (normal) |
 |  |
| KIRP (tumor) | KIRP (normal) |
| AMY2A, KIAA0101, IGF1R, TRIAP1, GP2 (tumor) | AMY2A, KIAA0101, IGF1R, TRIAP1, GP2 (normal) |
 |  |
| LIHC (tumor) | LIHC (normal) |
| AMY2A, KIAA0101, IGF1R, TRIAP1, GP2 (tumor) | AMY2A, KIAA0101, IGF1R, TRIAP1, GP2 (normal) |
 |  |
| LUAD (tumor) | LUAD (normal) |
| AMY2A, KIAA0101, IGF1R, TRIAP1, GP2 (tumor) | AMY2A, KIAA0101, IGF1R, TRIAP1, GP2 (normal) |
 |  |
| LUSC (tumor) | LUSC (normal) |
| AMY2A, KIAA0101, IGF1R, TRIAP1, GP2 (tumor) | AMY2A, KIAA0101, IGF1R, TRIAP1, GP2 (normal) |
 |  |
| PRAD (tumor) | PRAD (normal) |
| AMY2A, KIAA0101, IGF1R, TRIAP1, GP2 (tumor) | AMY2A, KIAA0101, IGF1R, TRIAP1, GP2 (normal) |
 |  |
| STAD (tumor) | STAD (normal) |
| AMY2A, KIAA0101, IGF1R, TRIAP1, GP2 (tumor) | AMY2A, KIAA0101, IGF1R, TRIAP1, GP2 (normal) |
 |  |
| THCA (tumor) | THCA (normal) |
| AMY2A, KIAA0101, IGF1R, TRIAP1, GP2 (tumor) | AMY2A, KIAA0101, IGF1R, TRIAP1, GP2 (normal) |
 |  |
| Top |
| TissGeneProg for AMY2A |
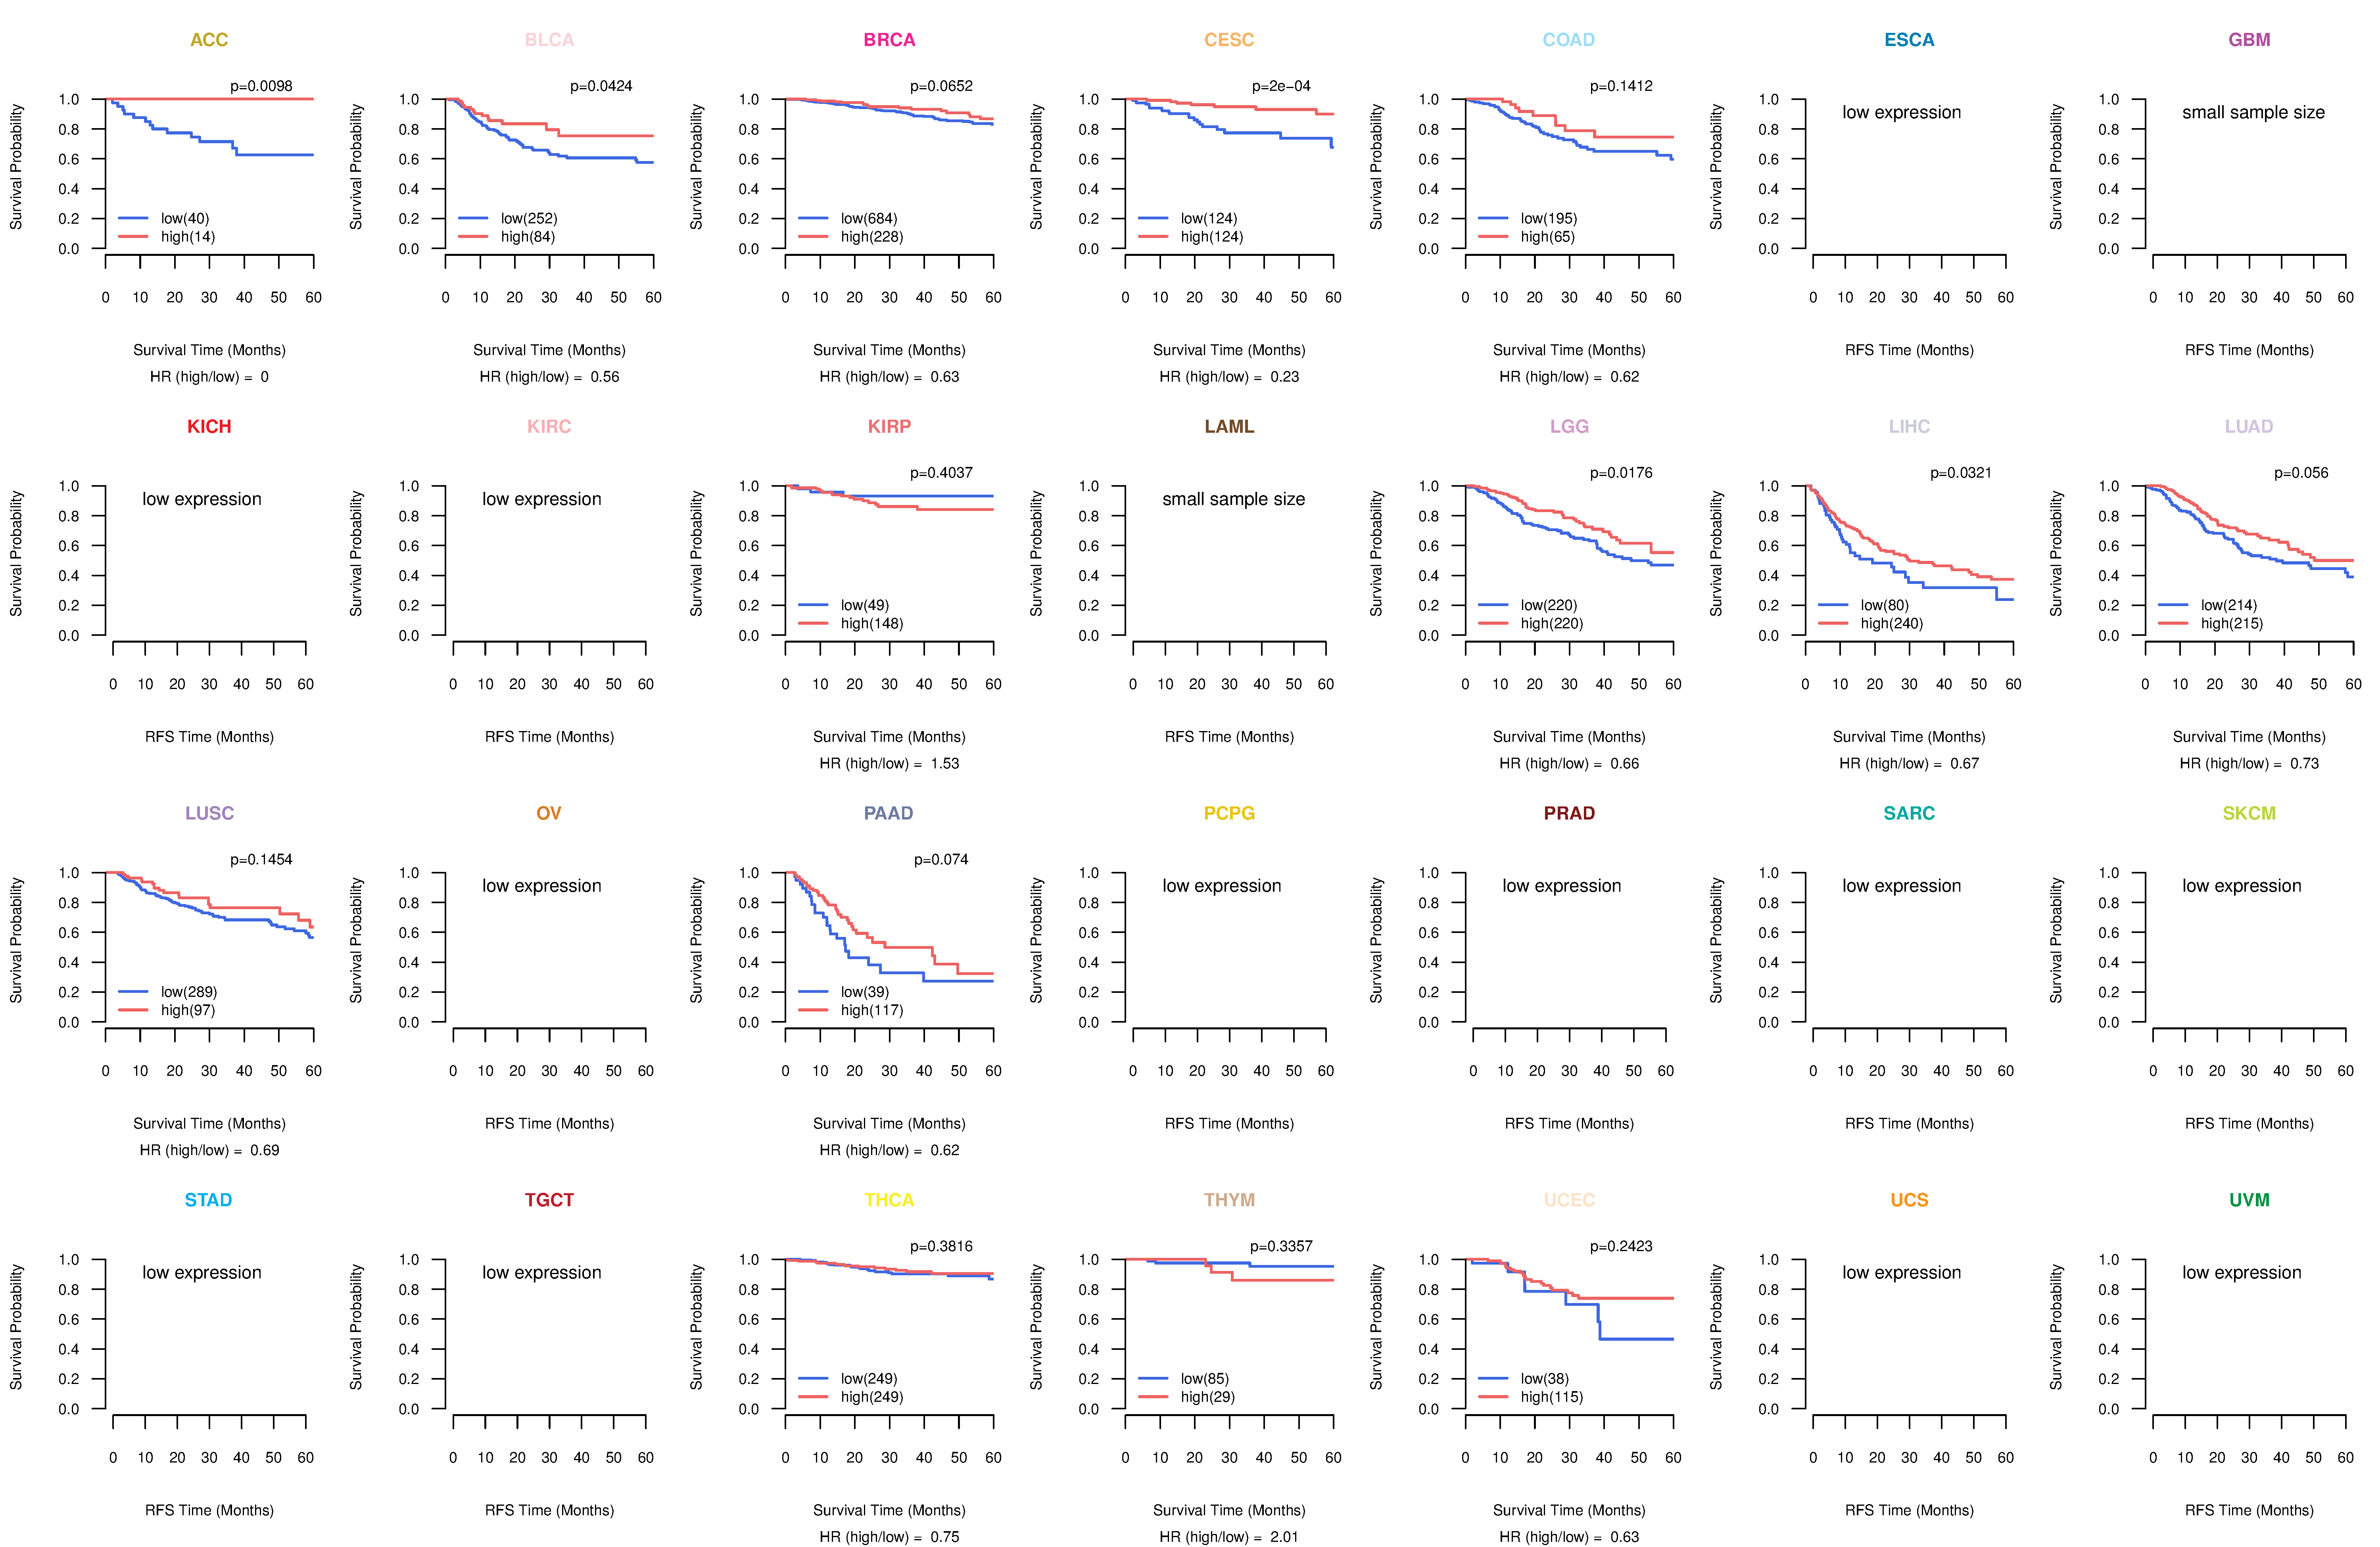
| Kaplan-Meier plots with logrank tests of overall survival (OS) using 28 cancer types (TCGA IlluminaHiSeq_RNASeqV2, pan-cancer normalized log2(norm_counts+1) data, version 2016-08-16) (TCGA clinicalMatrix, phenotype data, version 2016-04-27) * Click on the image to enlarge it in a new window. |
 |
| Kaplan-Meier plots with logrank test of relapse free survival (RFS) using 28 cancer types (TCGA IlluminaHiSeq_RNASeqV2, pan-cancer normalized log2(norm_counts+1) data, version 2016-08-16) (TCGA clinicalMatrix, phenotype data, version 2016-04-27) * Click on the image enlarge it in a new window. |
 |
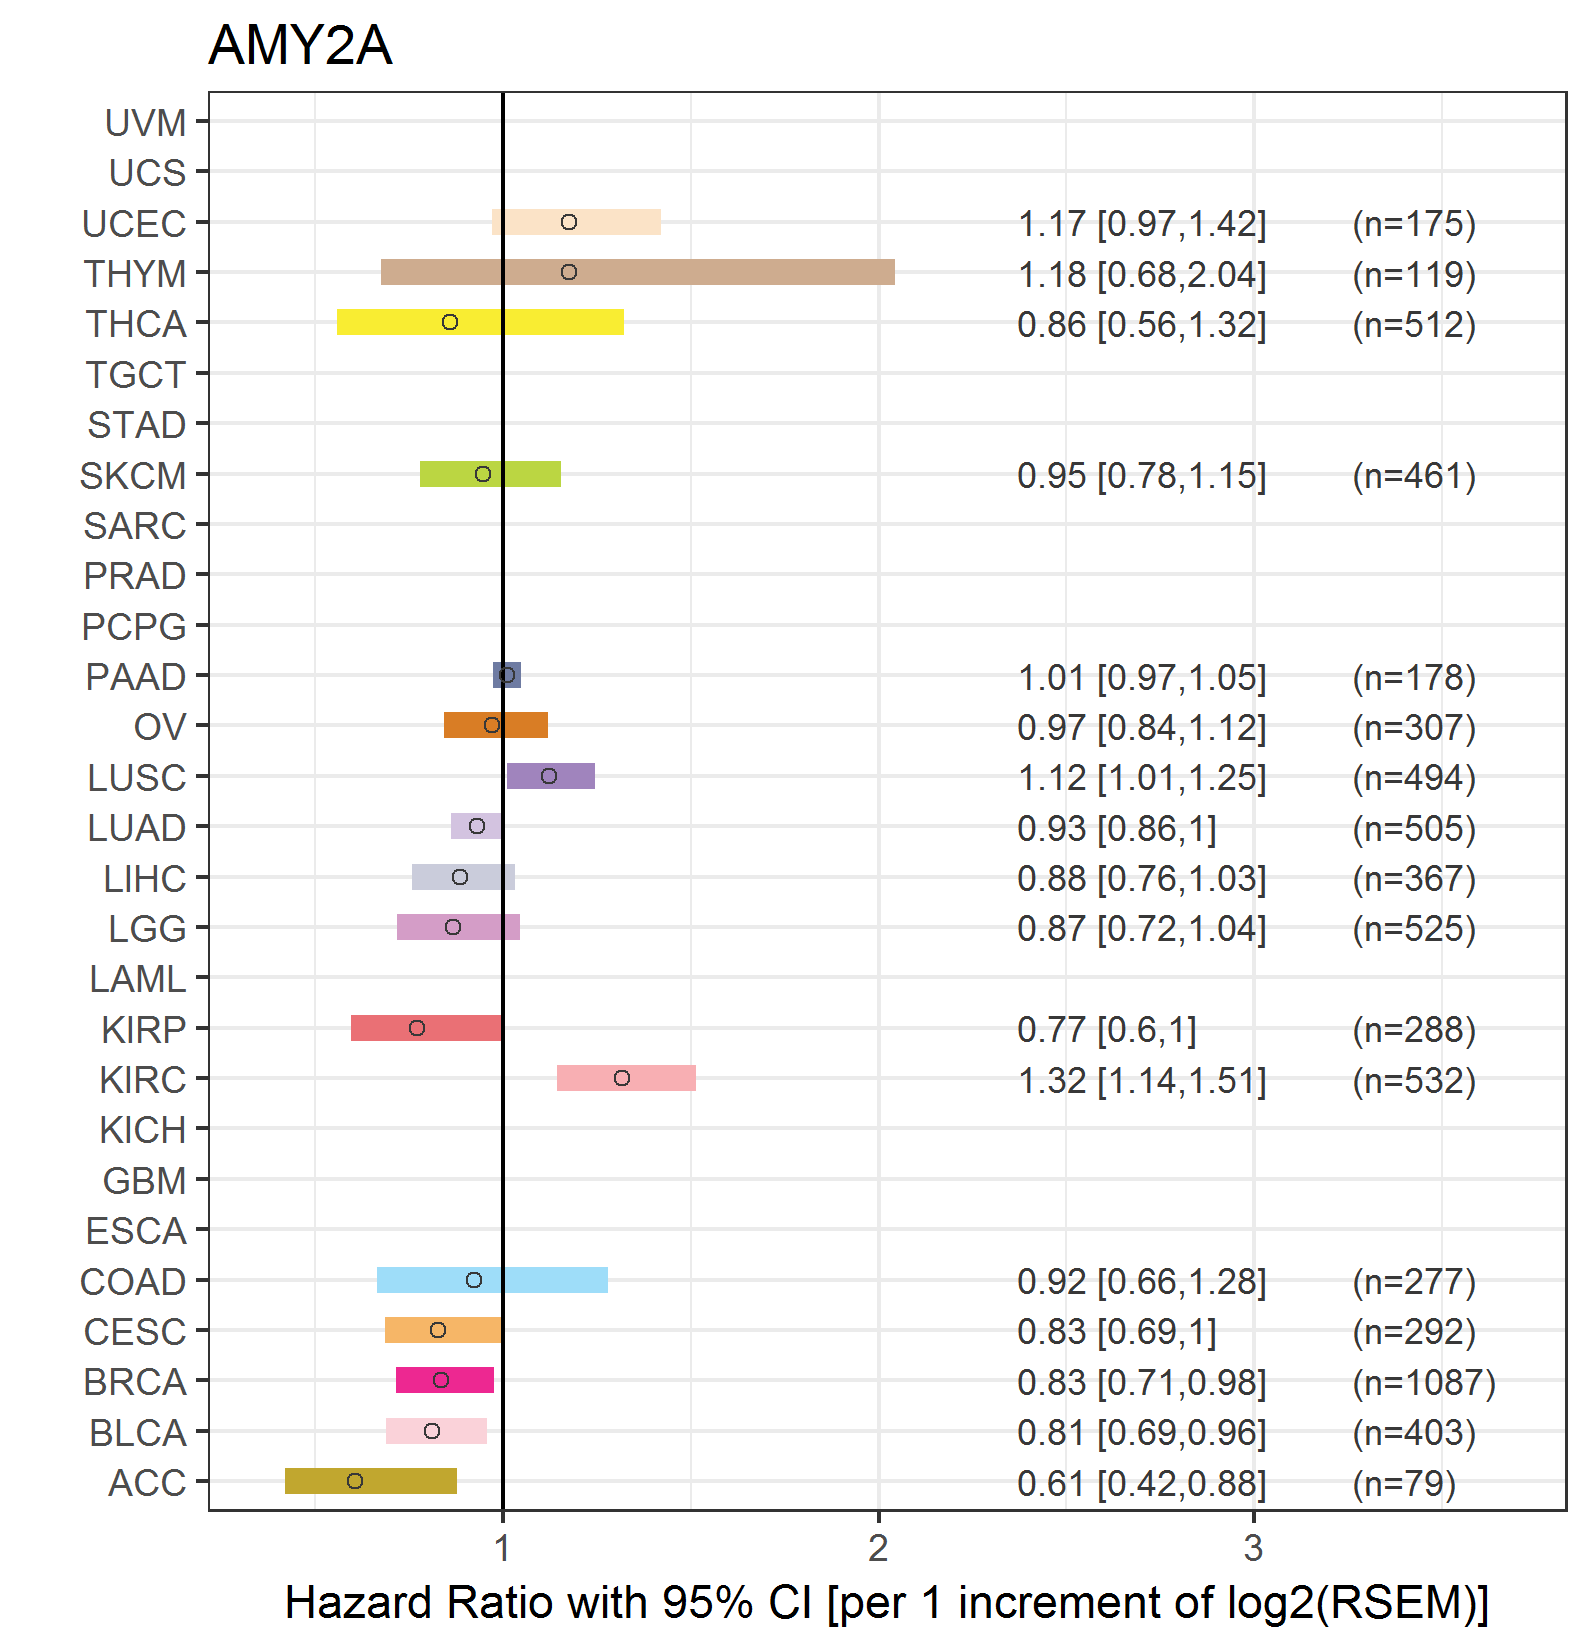
| Forest plot of Cox proportional hazard ratio (HR) and 95% CI of overall survival (OS) using 28 cancer types (TCGA IlluminaHiSeq_RNASeqV2, pan-cancer normalized log2(norm_counts+1) data, version 2016-08-16) (TCGA clinicalMatrix, phenotype data, version 2016-04-27) * Click on the image enlarge it in a new window. |
 |
| Forest plot of Cox proportional hazard ratio (HR) and 95% CI of relapse free survival (RFS) using 28 cancer types (TCGA IlluminaHiSeq_RNASeqV2, pan-cancer normalized log2(norm_counts+1) data, version 2016-08-16) (TCGA clinicalMatrix, phenotype data, version 2016-04-27) * Click on the image enlarge it in a new window. |
 |
| Top |
| TissGeneClin for AMY2A |
| TissGeneDrug for AMY2A |
| Drug information targeting TissGene (DrugBank Version 5.0.6, 2017-04-01) |
| DrugBank ID | Drug name | Drug activity | Drug type | Drug status |
| DB00284 | Acarbose | Inhibitor | Small molecule | Approved|Investigational |
| Top |
| TissGeneDisease for AMY2A |
| Disease information associated with TissGene (DisGeNet, 2016-06-01) |
| Disease ID | Disease name | # pubmeds | Source |
| umls:C0002395 | Alzheimer's Disease | 1 | GAD |
| umls:C0011570 | Mental Depression | 1 | GAD |
| umls:C0011860 | Diabetes Mellitus, Non-Insulin-Dependent | 1 | BeFree |
| umls:C0028754 | Obesity | 1 | BeFree |
| umls:C0030305 | Pancreatitis | 1 | LHGDN |
| umls:C0030567 | Parkinson Disease | 1 | GAD |
| umls:C0699791 | Stomach Carcinoma | 1 | BeFree |
|
Copyright 2016-Present - The University of Texas Health Science Center at Houston (UTHealth) Web File Viewing | How to Report, Fraud, Waste and Abuse | State of Texas | Statewide Search | Texas Homeland Security | Site Policies |