 |
| |
| |
| |
| |
| |
| |
|

| TissGeneSummary for AMY2B |
 Gene summary Gene summary |
| Basic gene information | Gene symbol | AMY2B |
| Gene name | amylase, alpha 2B (pancreatic) | |
| Synonyms | AMY2|AMY3|HXA | |
| Cytomap | UCSC genome browser: 1p21 | |
| Type of gene | protein-coding | |
| RefGenes | NM_020978.4, | |
| Description | 1,4-alpha-D-glucan glucanohydrolase 2Balpha-amylase 2Bcarcinoid alpha-amylaseglycogenase | |
| Modification date | 20141207 | |
| dbXrefs | MIM : 104660 | |
| HGNC : HGNC | ||
| Ensembl : ENSG00000240038 | ||
| HPRD : 00095 | ||
| Vega : OTTHUMG00000011024 | ||
| Protein | UniProt: go to UniProt's Cross Reference DB Table | |
| Expression | CleanEX: HS_AMY2B | |
| BioGPS: 280 | ||
| Pathway | NCI Pathway Interaction Database: AMY2B | |
| KEGG: AMY2B | ||
| REACTOME: AMY2B | ||
| Pathway Commons: AMY2B | ||
| Context | iHOP: AMY2B | |
| ligand binding site mutation search in PubMed: AMY2B | ||
| UCL Cancer Institute: AMY2B | ||
| Assigned class in TissGDB* | B | |
| Included tissue-specific gene expression resources | HPA,TiGER,GTEx | |
| Specific-tissues in normal samples (assigned by TissGDB using HPA, TiGER, and GTEx) | PancreasUterus | |
| Cancer types related to the specific-tissues in cancer samples (assigned by TissGDB using TCGA) | PAADUCEC,UCS | |
| Reference showing the relevant tissue of AMY2B | ||
| Description by TissGene annotations | ||
| * Class A consists of genes with literature evidence and is part of the cTissGenes. Class B consists of only cTissGenes without additional evidence. The remaining genes belong to Class C. |
| Gene ontology having evidence of Inferred from Direct Assay (IDA) from Entrez |
| GO ID | GO term | PubMed ID |
| Top |
| TissGeneExp for AMY2B |
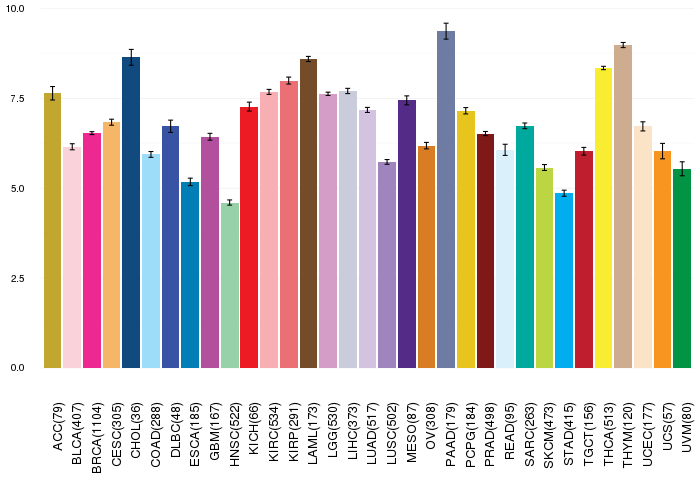
| Gene expressions across 28 cancer types (X-axis: cancer type and Y-axis: log2(norm_counts+1)) (TCGA IlluminaHiSeq_RNASeqV2, pan-cancer normalized log2(norm_counts+1) data, version 2016-08-16) |
 |
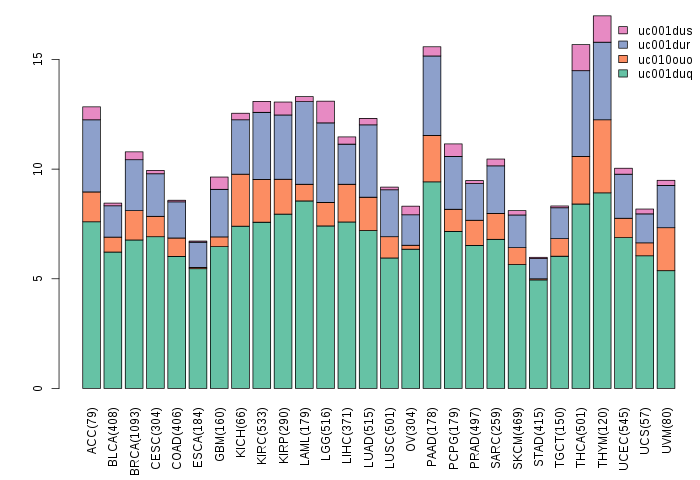
| Gene isoform expressions across 28 cancer types (X-axis: cancer type and Y-axis: log2(norm_counts+1)) (TCGA pan-cancer tcga_rsem_isoform_tpm, version 2016-09-01) |
 |
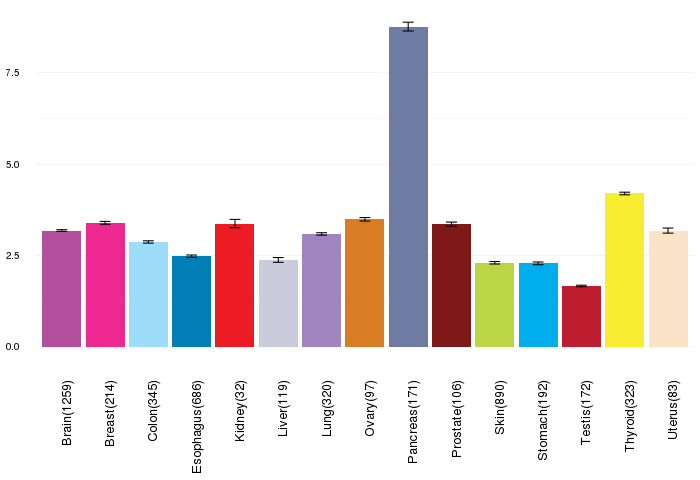
| Gene expressions across normal tissues of GTEx data (GTEx GTEx_Analysis_v6_RNA-seq_RNA-SeQCv1.1.8_gene_rpkm.gct) - Here, we shows the matched tissue types only among our 28 cancer types. |
 |
| Different expressions across 14 cancer types with more than 10 samples between matched tumors and normals (X-axis: cancer type and Y-axis: log2(norm_counts+1)) (TCGA IlluminaHiSeq_RNASeqV2, pan-cancer normalized log2(norm_counts+1) data, version 2016-08-16) |
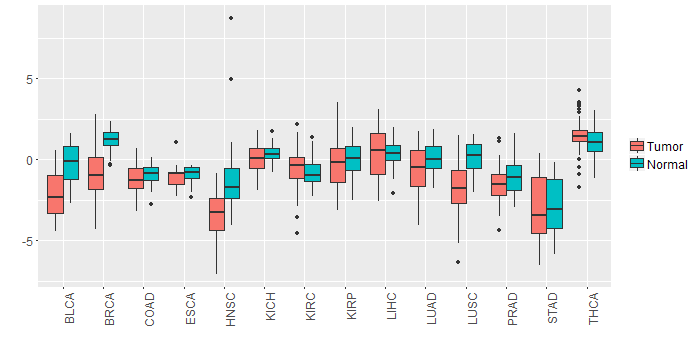 |
| - Significantly differentially expressed cancer types and information. (|Fold change|>1 and FDR<0.05) |
| Cancer type | Mean(exp) in tumor | Mean(exp) in matched normal | Log2FC | P-val. | FDR |
| HNSC | -3.355229716 | -1.189432041 | -2.165797674 | 1.06E-06 | 8.00E-06 |
| BRCA | -0.950197871 | 1.240121427 | -2.190319298 | 2.43E-32 | 3.65E-31 |
| LUSC | -1.776885849 | 0.156941602 | -1.933827451 | 9.41E-11 | 3.57E-10 |
| BLCA | -2.086746117 | -0.253125064 | -1.833621053 | 0.000416 | 0.003478135 |
| Top |
| TissGene-miRNA for AMY2B |
| Significantly anti-correlated miRNAs of TissGene across 28 cancer types (Gene-miRNA relations from TargetScanHuman Relsease 7.1, Conserved_Site_Context_Scores.txt.zip, 06.01.2016) (TCGA IlluminaHiSeq_miRNASeq, log2(RPM+1) data, version 2016-11-21) (TCGA IlluminaHiSeq_RNASeqV2, log2(normalized_count+1) data, version 2016-08-16) (Spearman’s Rank Correlation (p-value<0.05 and coefficient<-0.25)) |
| Cancer type | miRNA id | miRNA accession | P-val. | Coeff. | # samples |
| Top |
| TissGeneMut for AMY2B |
| TissGeneSNV for AMY2B |
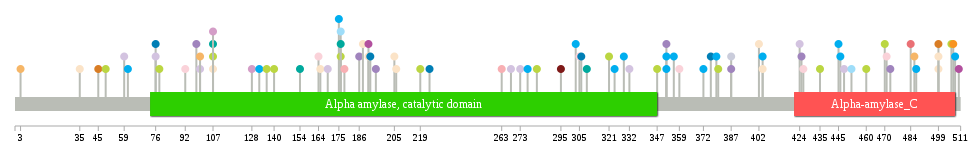
| nsSNV counts per each loci. Different colors of circles represent different cancer types. Circle size denotes number of samples. (TCGA somatic mutation (SNPs and small INDELs) data, version 2016-04-25) * Click on the image to enlarge it in a new window. |
 |
 |
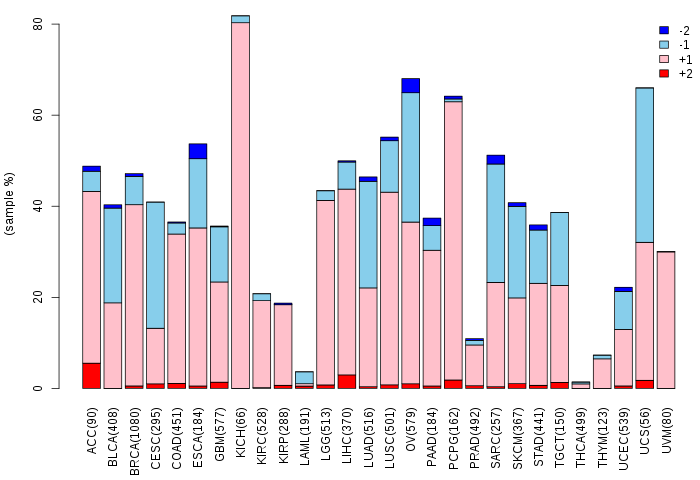
| Somatic nucleotide variants of TissGene across 28 cancer types (X-axis: cancer type and Y-axis: % of mutated samples) The numbers in parentheses are numbers of samples with mutation (nsSNVs). (TCGA somatic mutation (SNPs and small INDELs) data, version 2016-04-25) |
 |
| - nsSNVs sorted by frequency. |
| AAchange | Cancer type | # samples |
| p.D188E | UCEC | 1 |
| p.S192C | ESCA | 1 |
| p.R176H | SKCM | 1 |
| p.W295C | PRAD | 1 |
| p.R191H | GBM | 1 |
| p.W372C | STAD | 1 |
| p.V484I | KIRP | 1 |
| p.G321E | SKCM | 1 |
| p.R35Q | UCEC | 1 |
| p.P376T | ESCA | 1 |
| p.R176H | COAD | 1 |
| p.R402* | UCEC | 1 |
| p.S58C | HNSC | 1 |
| p.P219L | SKCM | 1 |
| p.G324* | STAD | 1 |
| p.G435E | SKCM | 1 |
| p.N445S | STAD | 1 |
| p.D487N | STAD | 1 |
| p.S132R | STAD | 1 |
| p.E164D | BLCA | 1 |
| p.R404C | UCEC | 1 |
| p.L277P | STAD | 1 |
| p.R76G | ESCA | 1 |
| p.G205V | UCEC | 1 |
| p.P49S | SKCM | 1 |
| p.R45X | READ | 1 |
| p.R404H | STAD | 1 |
| p.I473V | LUSC | 1 |
| p.R107C | SARC | 1 |
| p.I387V | LIHC | 1 |
| p.P136L | SKCM | 1 |
| p.C156W | READ | 1 |
| p.G119V | HNSC | 1 |
| p.A507D | UCS | 1 |
| p.G154A | HNSC | 1 |
| p.V98L | LUSC | 1 |
| p.D140N | SKCM | 1 |
| p.A224E | ESCA | 1 |
| p.R100T | CESC | 1 |
| p.E508K | STAD | 1 |
| p.R76I | LUAD | 1 |
| p.E499D | UCEC | 1 |
| p.V309A | DLBC | 1 |
| p.Y425* | LUSC | 1 |
| p.R107C | SKCM | 1 |
| p.G380E | SKCM | 1 |
| p.E186D | LUSC | 1 |
| p.T129I | HNSC | 1 |
| p.D332Y | LUAD | 1 |
| p.G470R | SKCM | 1 |
| p.G154C | SARC | 1 |
| p.E499* | OV | 1 |
| p.N165K | UCEC | 1 |
| p.S356N | STAD | 1 |
| p.D471H | BLCA | 1 |
| p.R45* | OV | 1 |
| p.P460L | SKCM | 1 |
| p.N120K | HNSC | 1 |
| p.Y273C | LUAD | 1 |
| p.R191C | UCEC | 1 |
| p.V268L | LUAD | 1 |
| p.R352Q | STAD | 1 |
| p.R107H | LGG | 1 |
| p.I387F | LUSC | 1 |
| p.P303S | STAD | 1 |
| p.F263L | KIRC | 1 |
| p.N411H | HNSC | 1 |
| p.S452Y | COAD | 1 |
| p.R306K | ESCA | 1 |
| p.P59S | LUAD | 1 |
| p.D305E | BLCA | 1 |
| p.P347L | SKCM | 1 |
| p.N446S | STAD | 1 |
| p.N231I | DLBC | 1 |
| p.H506Y | SKCM | 1 |
| p.R358H | READ | 1 |
| p.A169S | LUAD | 1 |
| p.K510Q | GBM | 1 |
| p.F3L | CESC | 1 |
| p.R282C | SKCM | 1 |
| p.N61Y | STAD | 1 |
| p.E499V | UCEC | 1 |
| p.R352* | STAD | 1 |
| p.V206F | UCEC | 1 |
| p.D92N | BLCA | 1 |
| p.N167S | HNSC | 1 |
| p.R352L | LUSC | 1 |
| p.R100G | LUAD | 1 |
| p.V309G | SARC | 1 |
| p.Q78* | SKCM | 1 |
| p.A195S | LUSC | 1 |
| p.W359* | BLCA | 1 |
| p.T329A | STAD | 1 |
| p.C175W | STAD | 1 |
| p.V178I | KIRC | 1 |
| p.N379D | STAD | 1 |
| p.W424L | LUAD | 1 |
| p.S128I | LGG | 1 |
| p.D486V | CESC | 1 |
| p.D426N | BLCA | 1 |
| p.D448Y | LUAD | 1 |
| p.R439K | HNSC | 1 |
| p.R107H | UCEC | 1 |
| p.R176H | SARC | 1 |
| Top |
| TissGeneCNV for AMY2B |
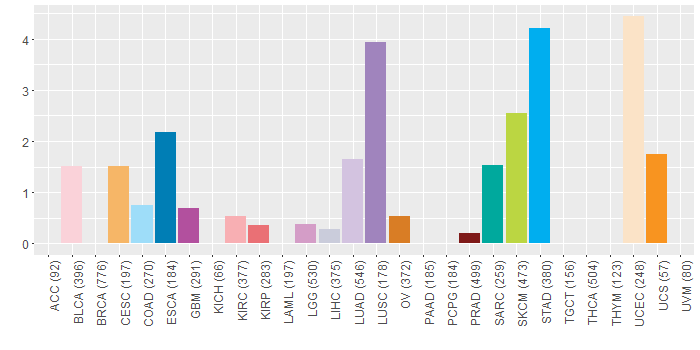
| Copy number variations of TissGene across 28 cancer types (X-axis: cancer type and Y-axis: % of CNV samples) (TCGA Gistic2_CopyNumber_Gistic2_all_data_by_genes, Gistic2 copy number data, version 2016-08-16) |
 |
| Top |
| TissGeneFusions for AMY2B |
| Fusion genes including TissGene (ChimerDB 3.0, 2016-12-01 and TCGA fusion Portal 2015-12-01) |
| Database | Src | Cancer type | Sample | Fusion gene | ORF | 5'-gene BP | 3'-gene BP |
| Chimerdb3.0 | ChiTaRs | NA | AW583683 | CADPS-AMY2B | chr3:62631434 | chr1:104122016 | |
| Chimerdb3.0 | ChiTaRs | NA | DB221809 | SMEK2-AMY2B | chr2:55843732 | chr1:104114175 |
| Top |
| TissGeneNet for AMY2B |
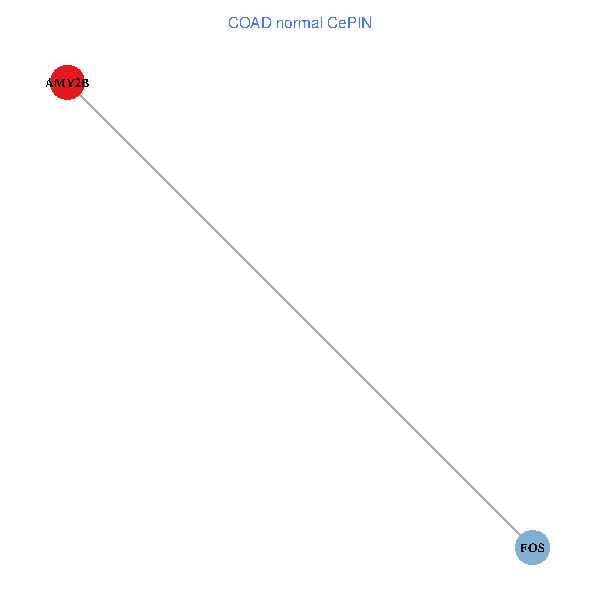
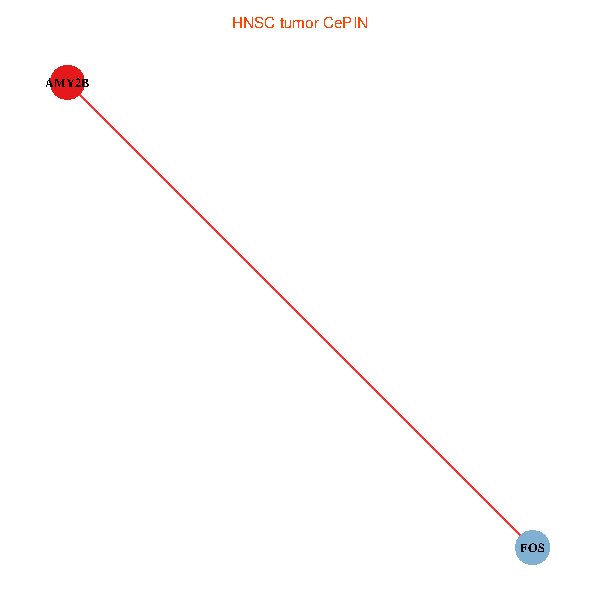
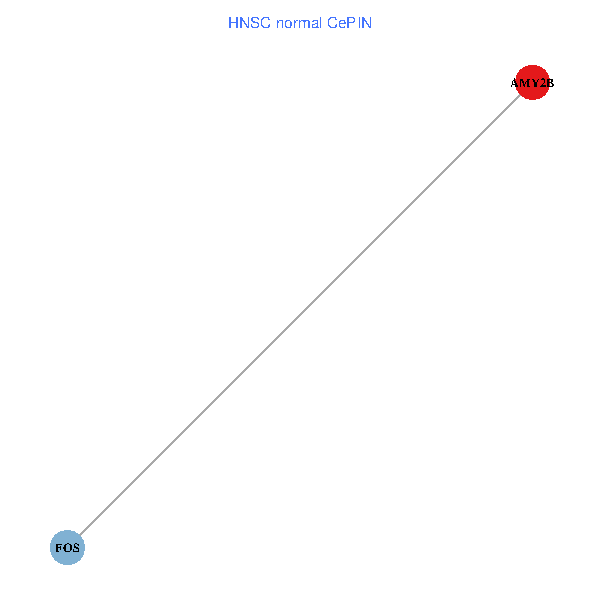
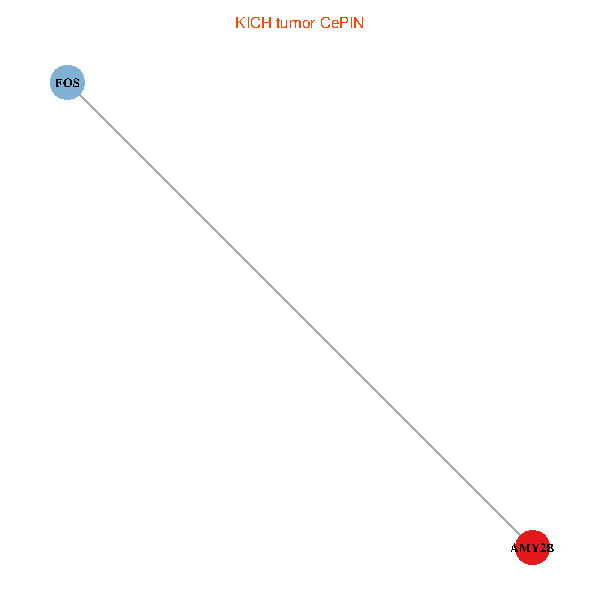
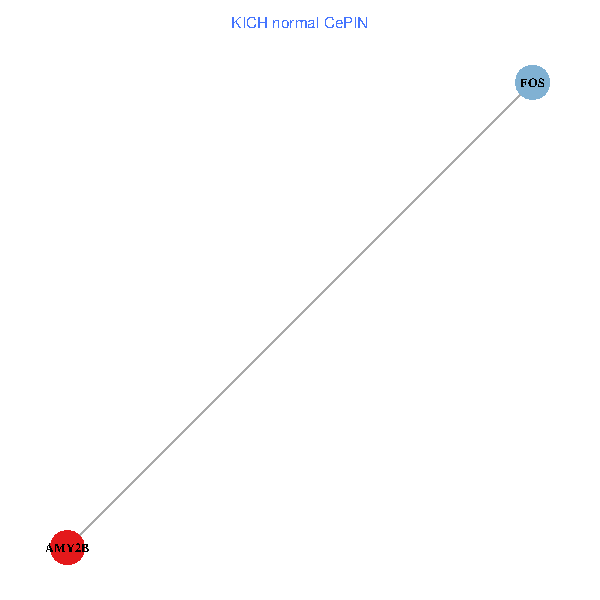
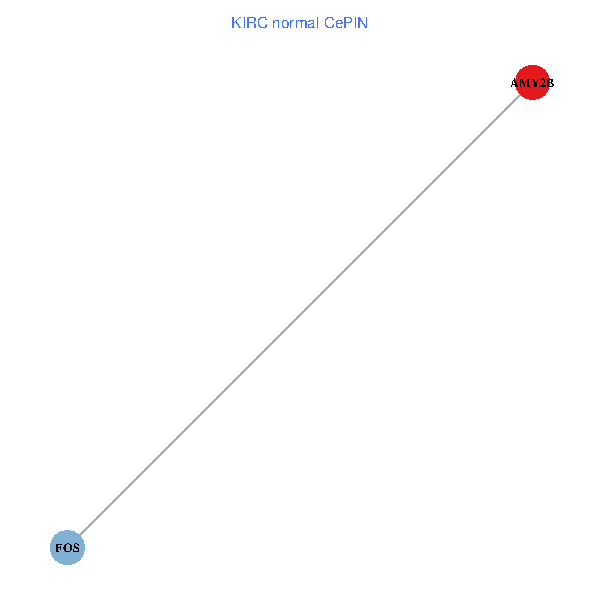
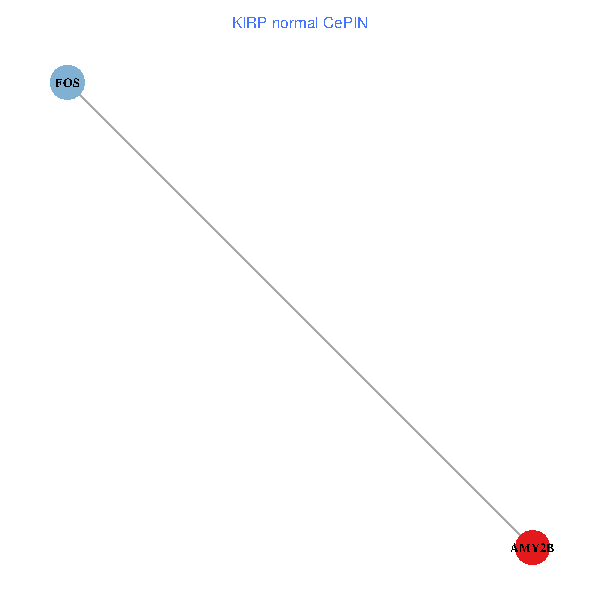
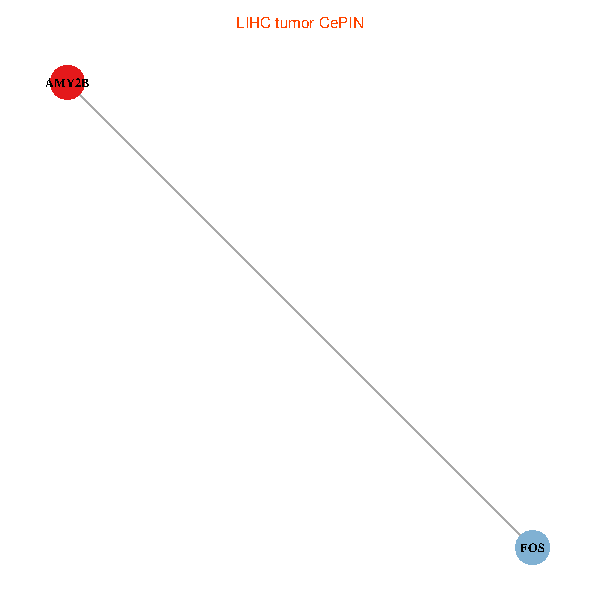
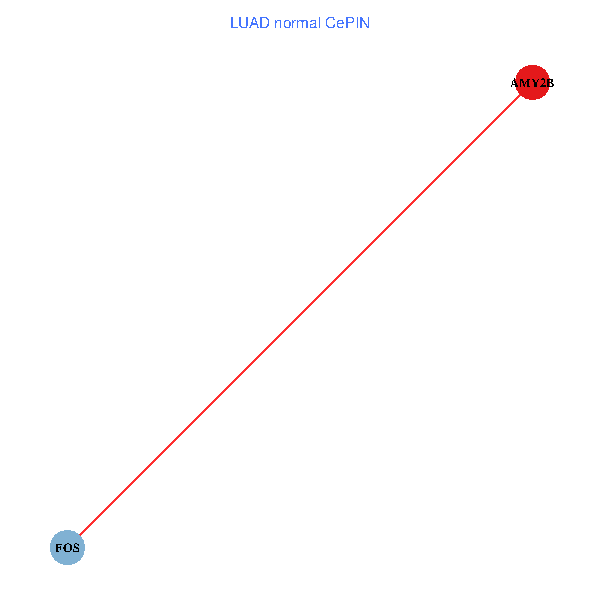
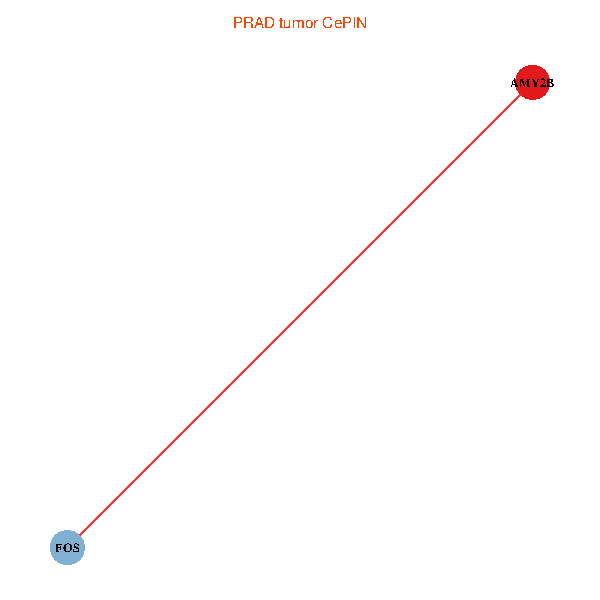
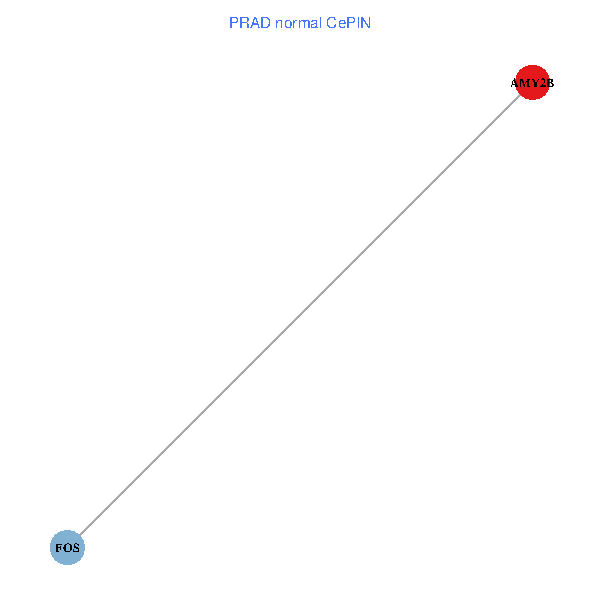
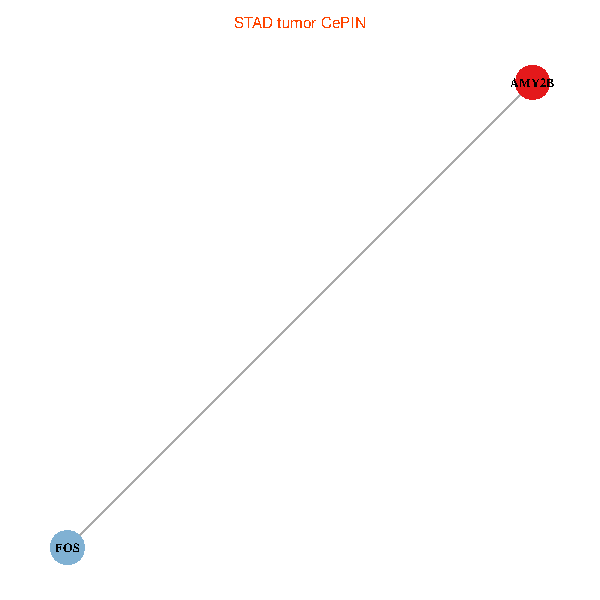
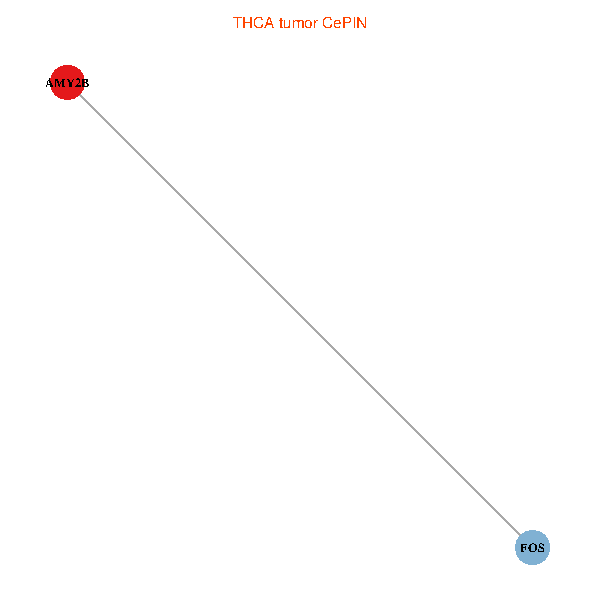
| Co-expressed gene networks based on protein-protein interaction data (CePIN) (TCGA IlluminaHiSeq_RNASeqV2, pan-cancer normalized log2(norm_counts+1) data, version 2016-08-16) (PINA2 ppi data) |
| BRCA (tumor) | BRCA (normal) |
| AMY2B, FOS (tumor) | AMY2B, FOS (normal) |
 |  |
| COAD (tumor) | COAD (normal) |
| AMY2B, FOS (tumor) | AMY2B, FOS (normal) |
 |  |
| HNSC (tumor) | HNSC (normal) |
| AMY2B, FOS (tumor) | AMY2B, FOS (normal) |
 |  |
| KICH (tumor) | KICH (normal) |
| AMY2B, FOS (tumor) | AMY2B, FOS (normal) |
 |  |
| KIRC (tumor) | KIRC (normal) |
| AMY2B, FOS (tumor) | AMY2B, FOS (normal) |
 |  |
| KIRP (tumor) | KIRP (normal) |
| AMY2B, FOS (tumor) | AMY2B, FOS (normal) |
 |  |
| LIHC (tumor) | LIHC (normal) |
| AMY2B, FOS (tumor) | AMY2B, FOS (normal) |
 |  |
| LUAD (tumor) | LUAD (normal) |
| AMY2B, FOS (tumor) | AMY2B, FOS (normal) |
 |  |
| LUSC (tumor) | LUSC (normal) |
| AMY2B, FOS (tumor) | AMY2B, FOS (normal) |
 |  |
| PRAD (tumor) | PRAD (normal) |
| AMY2B, FOS (tumor) | AMY2B, FOS (normal) |
 |  |
| STAD (tumor) | STAD (normal) |
| AMY2B, FOS (tumor) | AMY2B, FOS (normal) |
 |  |
| THCA (tumor) | THCA (normal) |
| AMY2B, FOS (tumor) | AMY2B, FOS (normal) |
 |  |
| Top |
| TissGeneProg for AMY2B |
| Kaplan-Meier plots with logrank tests of overall survival (OS) using 28 cancer types (TCGA IlluminaHiSeq_RNASeqV2, pan-cancer normalized log2(norm_counts+1) data, version 2016-08-16) (TCGA clinicalMatrix, phenotype data, version 2016-04-27) * Click on the image to enlarge it in a new window. |
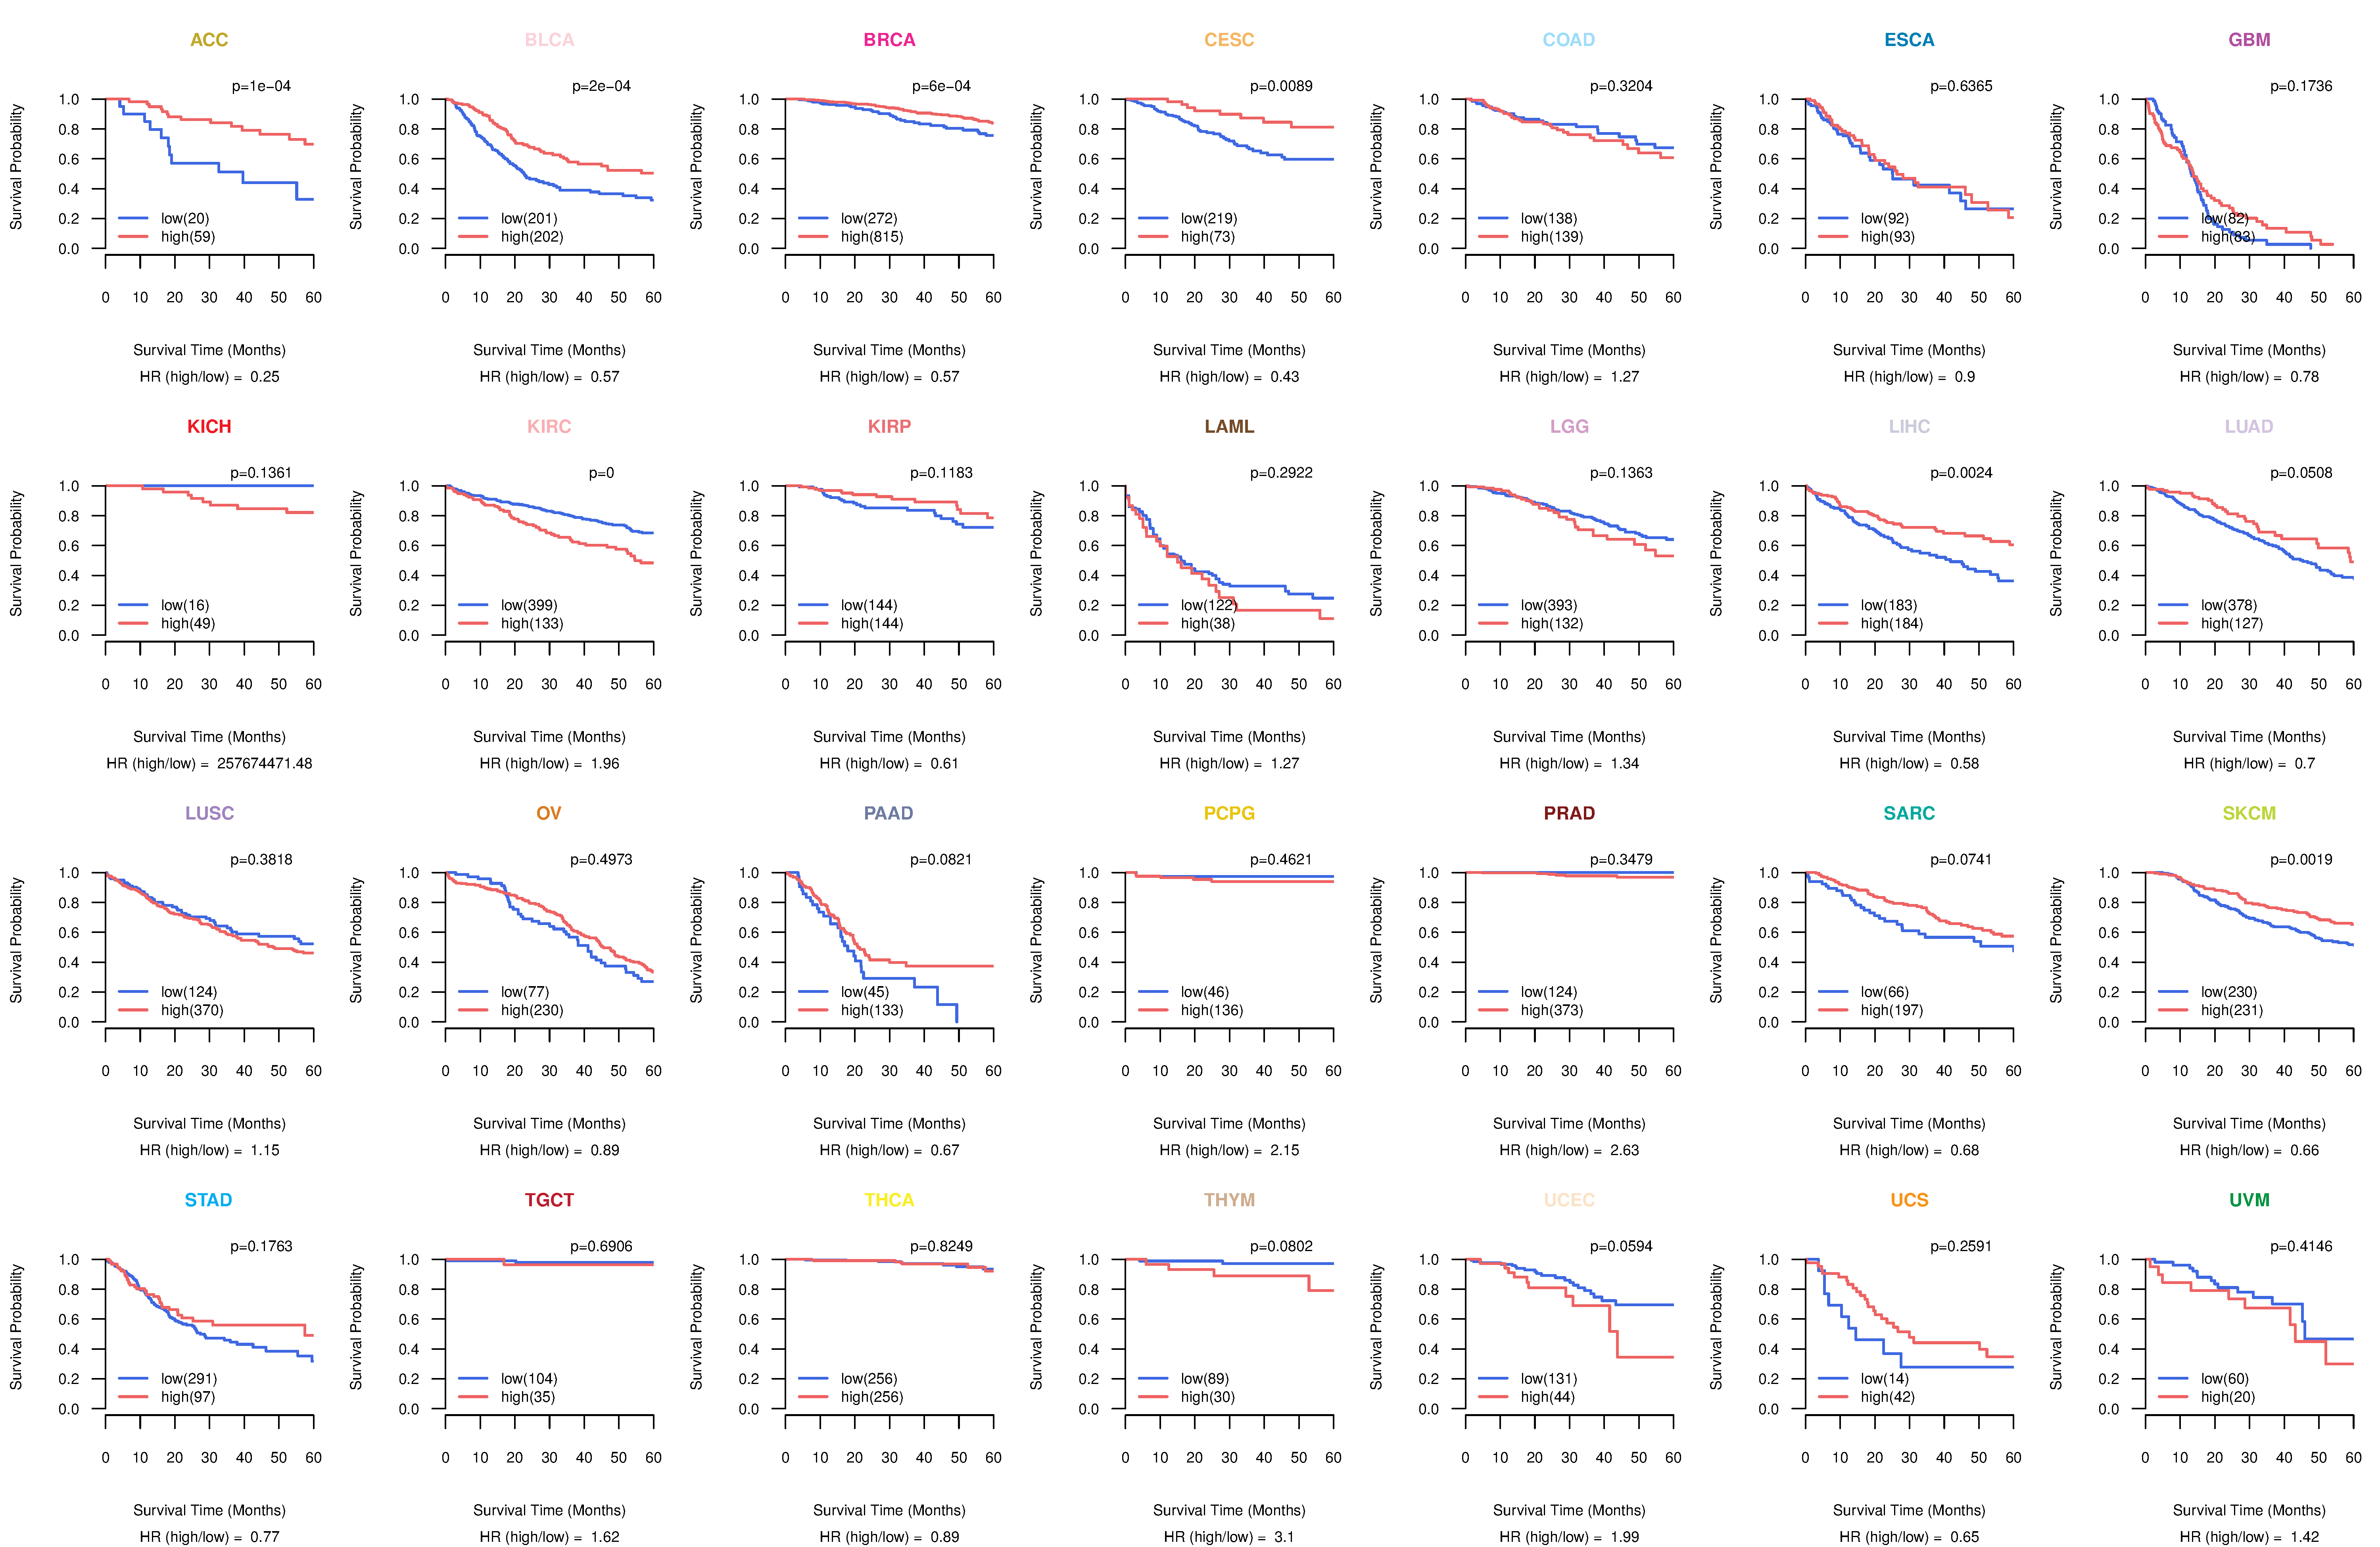 |
| Kaplan-Meier plots with logrank test of relapse free survival (RFS) using 28 cancer types (TCGA IlluminaHiSeq_RNASeqV2, pan-cancer normalized log2(norm_counts+1) data, version 2016-08-16) (TCGA clinicalMatrix, phenotype data, version 2016-04-27) * Click on the image enlarge it in a new window. |
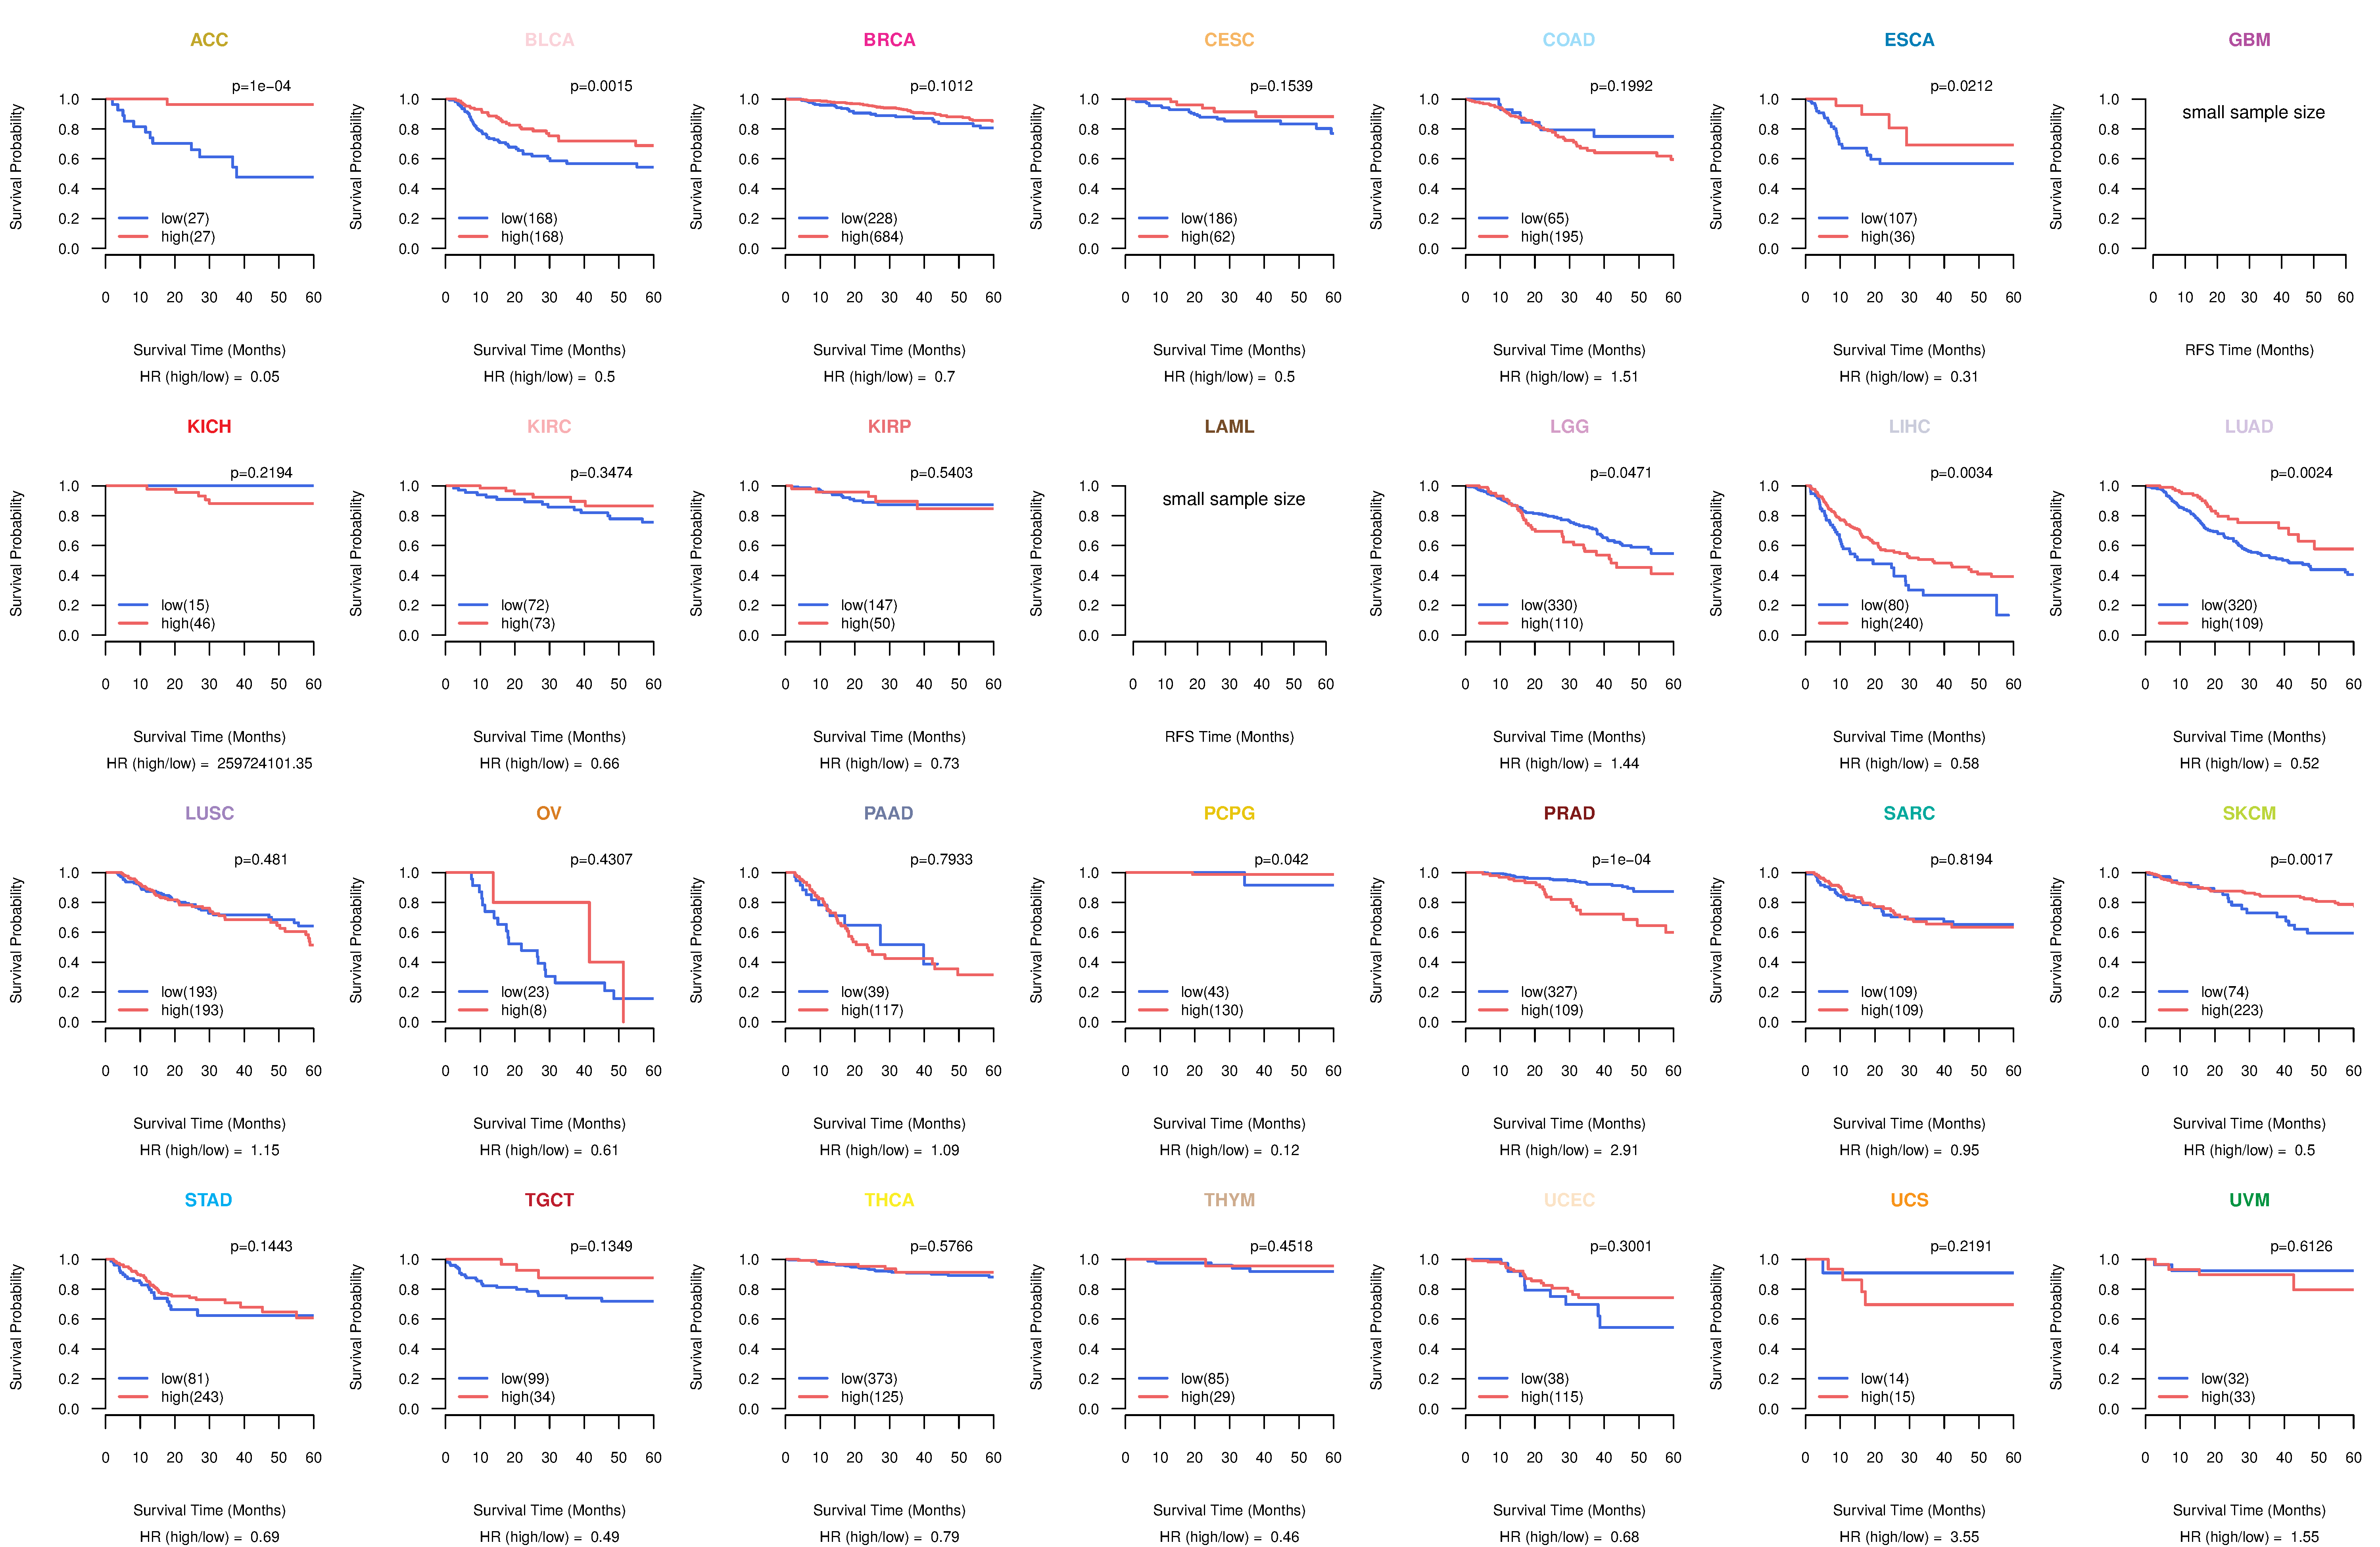 |
| Forest plot of Cox proportional hazard ratio (HR) and 95% CI of overall survival (OS) using 28 cancer types (TCGA IlluminaHiSeq_RNASeqV2, pan-cancer normalized log2(norm_counts+1) data, version 2016-08-16) (TCGA clinicalMatrix, phenotype data, version 2016-04-27) * Click on the image enlarge it in a new window. |
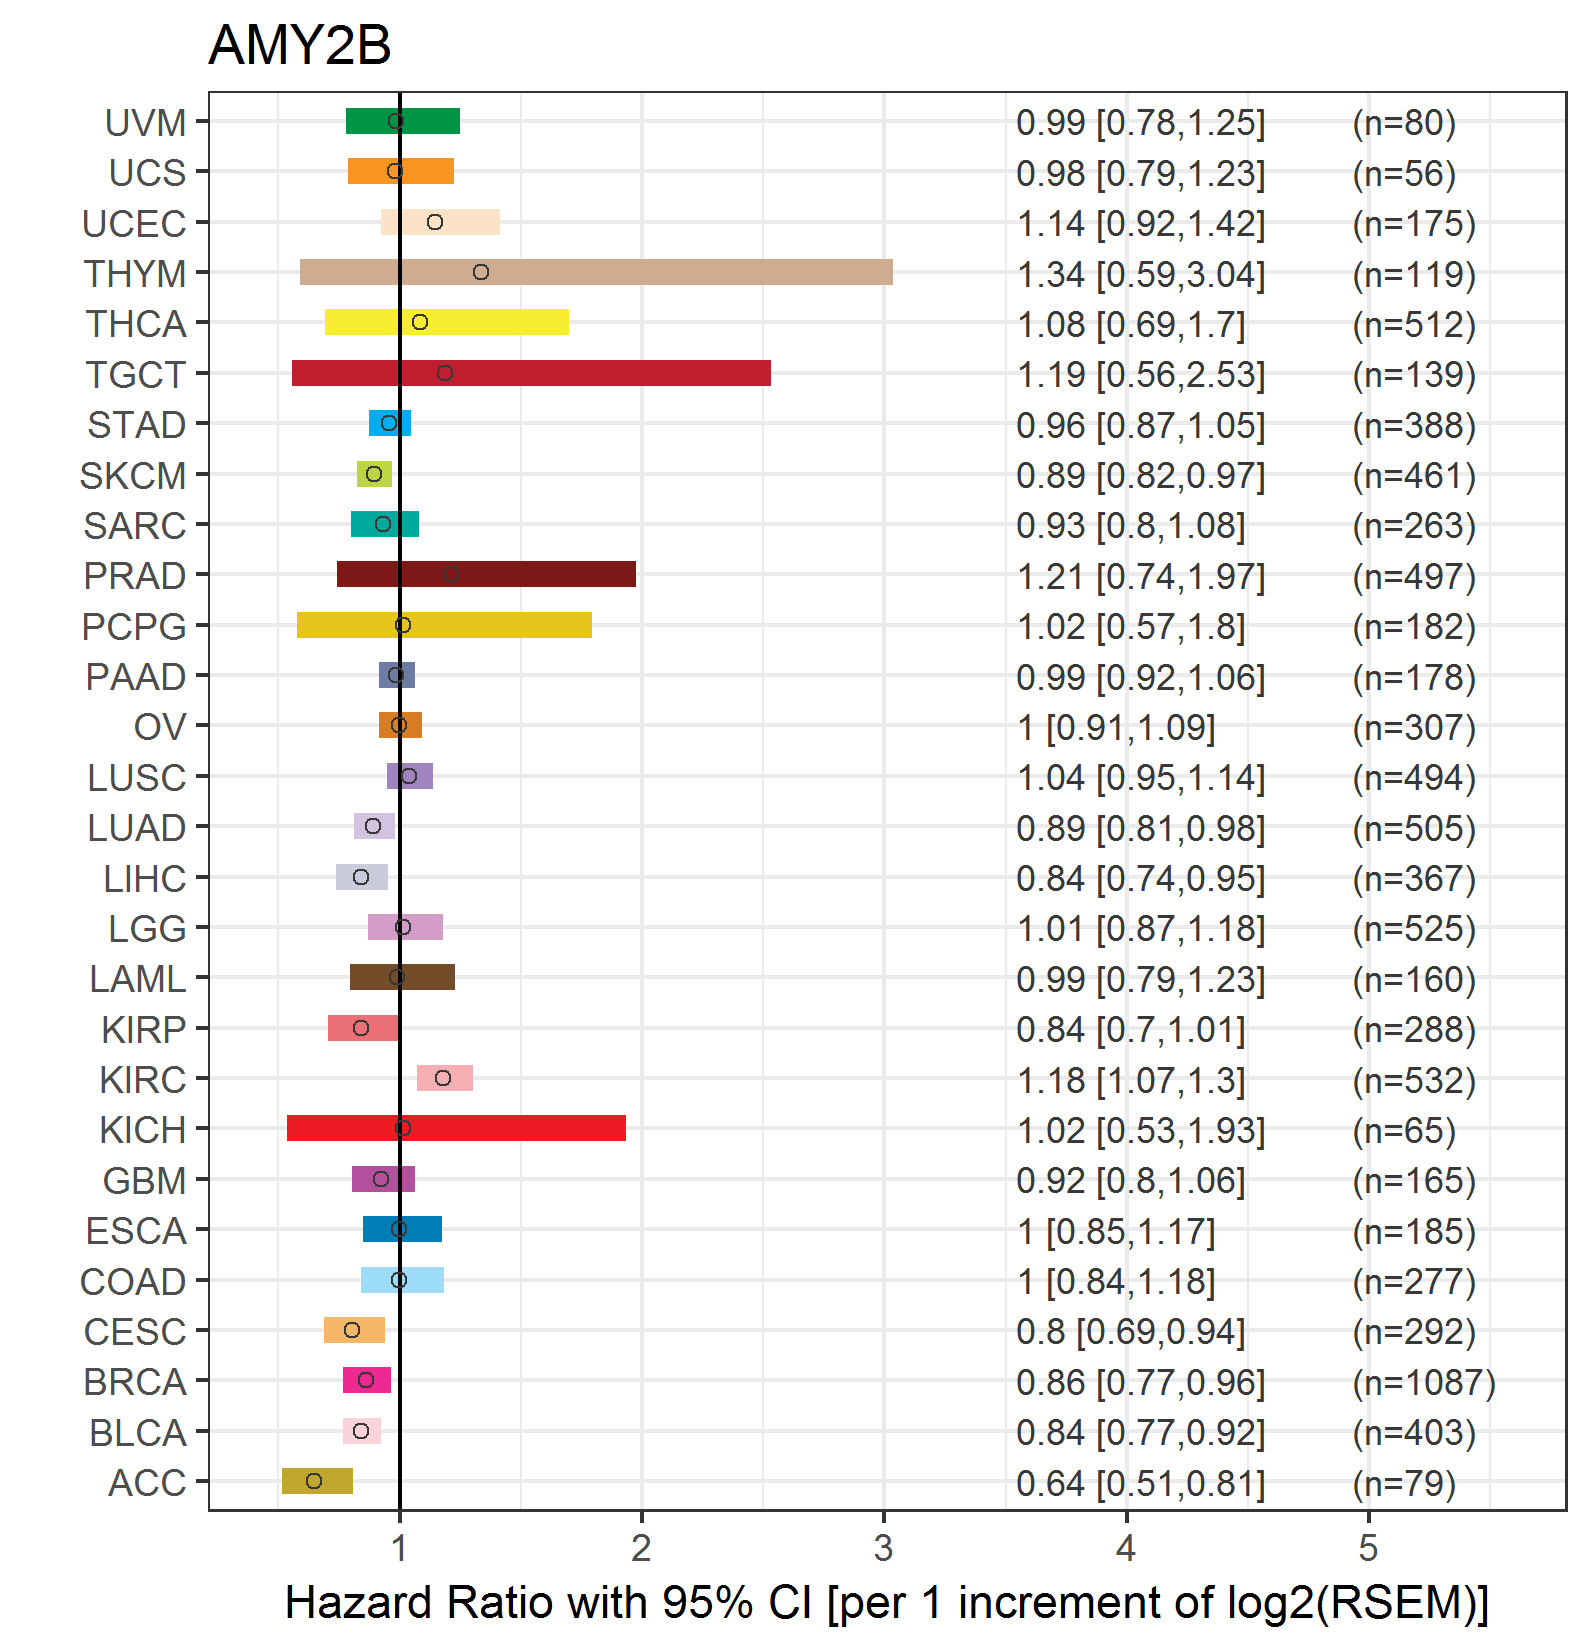 |
| Forest plot of Cox proportional hazard ratio (HR) and 95% CI of relapse free survival (RFS) using 28 cancer types (TCGA IlluminaHiSeq_RNASeqV2, pan-cancer normalized log2(norm_counts+1) data, version 2016-08-16) (TCGA clinicalMatrix, phenotype data, version 2016-04-27) * Click on the image enlarge it in a new window. |
 |
| Top |
| TissGeneClin for AMY2B |
| TissGeneDrug for AMY2B |
| Drug information targeting TissGene (DrugBank Version 5.0.6, 2017-04-01) |
| DrugBank ID | Drug name | Drug activity | Drug type | Drug status |
| Top |
| TissGeneDisease for AMY2B |
| Disease information associated with TissGene (DisGeNet, 2016-06-01) |
| Disease ID | Disease name | # pubmeds | Source |
| umls:C0020757 | Ichthyoses | 1 | BeFree |
| umls:C0020758 | Congenital ichthyosis | 1 | BeFree |
| umls:C0028754 | Obesity | 1 | BeFree |
|
Copyright 2016-Present - The University of Texas Health Science Center at Houston (UTHealth) Web File Viewing | How to Report, Fraud, Waste and Abuse | State of Texas | Statewide Search | Texas Homeland Security | Site Policies |