 |
| |
| |
| |
| |
| |
| |
|

| TissGeneSummary for STK32C |
 Gene summary Gene summary |
| Basic gene information | Gene symbol | STK32C |
| Gene name | serine/threonine kinase 32C | |
| Synonyms | PKE|YANK3 | |
| Cytomap | UCSC genome browser: 10q26.3 | |
| Type of gene | protein-coding | |
| RefGenes | NM_173575.2, | |
| Description | PKE protein kinaseprotein kinase (PKE)serine/threonine-protein kinase 32Cyet another novel kinase 3 | |
| Modification date | 20141207 | |
| dbXrefs | HGNC : HGNC | |
| Ensembl : ENSG00000165752 | ||
| HPRD : 18119 | ||
| Vega : OTTHUMG00000019285 | ||
| Protein | UniProt: go to UniProt's Cross Reference DB Table | |
| Expression | CleanEX: HS_STK32C | |
| BioGPS: 282974 | ||
| Pathway | NCI Pathway Interaction Database: STK32C | |
| KEGG: STK32C | ||
| REACTOME: STK32C | ||
| Pathway Commons: STK32C | ||
| Context | iHOP: STK32C | |
| ligand binding site mutation search in PubMed: STK32C | ||
| UCL Cancer Institute: STK32C | ||
| Assigned class in TissGDB* | C | |
| Included tissue-specific gene expression resources | TiGER,GTEx | |
| Specific-tissues in normal samples (assigned by TissGDB using HPA, TiGER, and GTEx) | CervixTestis | |
| Cancer types related to the specific-tissues in cancer samples (assigned by TissGDB using TCGA) | CESCTGCT | |
| Reference showing the relevant tissue of STK32C | ||
| Description by TissGene annotations | Cancer gene TissgsLTS | |
| * Class A consists of genes with literature evidence and is part of the cTissGenes. Class B consists of only cTissGenes without additional evidence. The remaining genes belong to Class C. |
| Gene ontology having evidence of Inferred from Direct Assay (IDA) from Entrez |
| GO ID | GO term | PubMed ID |
| Top |
| TissGeneExp for STK32C |
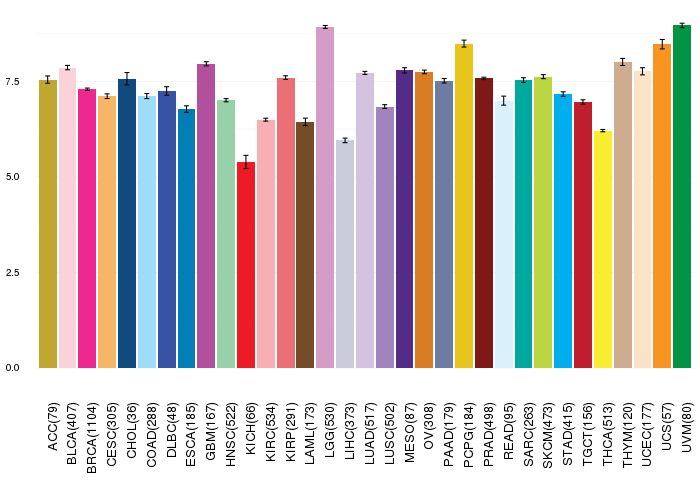
| Gene expressions across 28 cancer types (X-axis: cancer type and Y-axis: log2(norm_counts+1)) (TCGA IlluminaHiSeq_RNASeqV2, pan-cancer normalized log2(norm_counts+1) data, version 2016-08-16) |
 |
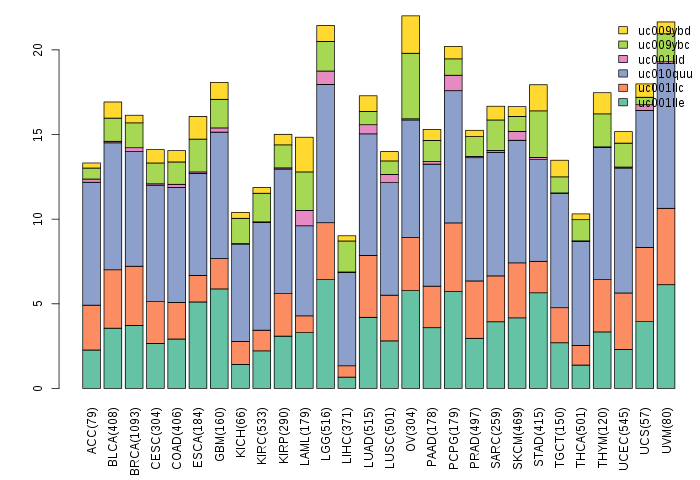
| Gene isoform expressions across 28 cancer types (X-axis: cancer type and Y-axis: log2(norm_counts+1)) (TCGA pan-cancer tcga_rsem_isoform_tpm, version 2016-09-01) |
 |
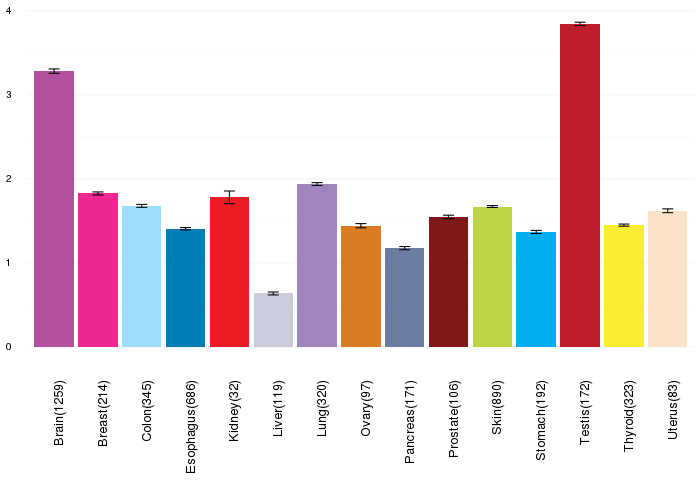
| Gene expressions across normal tissues of GTEx data (GTEx GTEx_Analysis_v6_RNA-seq_RNA-SeQCv1.1.8_gene_rpkm.gct) - Here, we shows the matched tissue types only among our 28 cancer types. |
 |
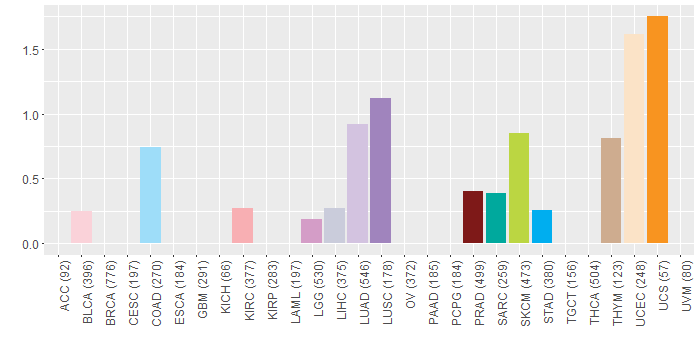
| Different expressions across 14 cancer types with more than 10 samples between matched tumors and normals (X-axis: cancer type and Y-axis: log2(norm_counts+1)) (TCGA IlluminaHiSeq_RNASeqV2, pan-cancer normalized log2(norm_counts+1) data, version 2016-08-16) |
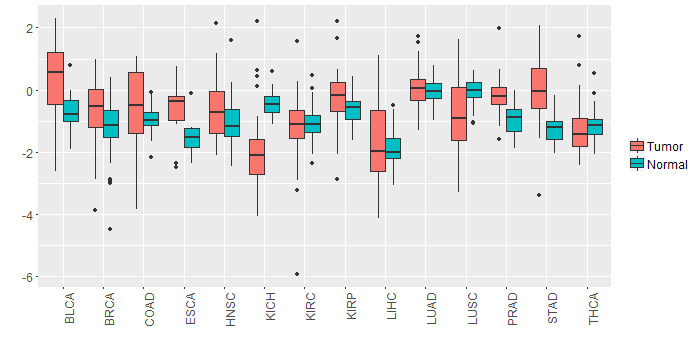 |
| - Significantly differentially expressed cancer types and information. (|Fold change|>1 and FDR<0.05) |
| Cancer type | Mean(exp) in tumor | Mean(exp) in matched normal | Log2FC | P-val. | FDR |
| STAD | -0.085687673 | -1.236343923 | 1.15065625 | 1.29E-06 | 2.03E-05 |
| BLCA | 0.305744728 | -0.719628956 | 1.025373684 | 0.00314 | 0.018474497 |
| KICH | -1.919729798 | -0.412329798 | -1.5074 | 3.98E-05 | 0.000112461 |
| Top |
| TissGene-miRNA for STK32C |
| Significantly anti-correlated miRNAs of TissGene across 28 cancer types (Gene-miRNA relations from TargetScanHuman Relsease 7.1, Conserved_Site_Context_Scores.txt.zip, 06.01.2016) (TCGA IlluminaHiSeq_miRNASeq, log2(RPM+1) data, version 2016-11-21) (TCGA IlluminaHiSeq_RNASeqV2, log2(normalized_count+1) data, version 2016-08-16) (Spearman’s Rank Correlation (p-value<0.05 and coefficient<-0.25)) |
| Cancer type | miRNA id | miRNA accession | P-val. | Coeff. | # samples |
| Top |
| TissGeneMut for STK32C |
| TissGeneSNV for STK32C |
| nsSNV counts per each loci. Different colors of circles represent different cancer types. Circle size denotes number of samples. (TCGA somatic mutation (SNPs and small INDELs) data, version 2016-04-25) * Click on the image to enlarge it in a new window. |
 |
 |
| Somatic nucleotide variants of TissGene across 28 cancer types (X-axis: cancer type and Y-axis: % of mutated samples) The numbers in parentheses are numbers of samples with mutation (nsSNVs). (TCGA somatic mutation (SNPs and small INDELs) data, version 2016-04-25) |
 |
| - nsSNVs sorted by frequency. |
| AAchange | Cancer type | # samples |
| p.K114* | SARC | 1 |
| p.A315T | UCEC | 1 |
| p.V154A | HNSC | 1 |
| p.R353Q | UCEC | 1 |
| p.G174V | LUAD | 1 |
| p.Q94L | LUAD | 1 |
| p.Q187K | UCS | 1 |
| p.G291V | LUAD | 1 |
| p.R97W | BLCA | 1 |
| p.H112Q | CHOL | 1 |
| p.L32F | PRAD | 1 |
| p.K65N | UCEC | 1 |
| p.Q70K | UCS | 1 |
| p.M271L | HNSC | 1 |
| p.L90M | SKCM | 1 |
| p.A366V | SKCM | 1 |
| p.G165W | LUAD | 1 |
| p.D205Y | LUAD | 1 |
| p.V37A | HNSC | 1 |
| p.H59Y | MESO | 1 |
| p.M388L | HNSC | 1 |
| p.A483V | SKCM | 1 |
| p.R340Q | UCEC | 1 |
| p.D88Y | LUAD | 1 |
| p.V315I | THYM | 1 |
| p.S172F | LUSC | 1 |
| p.A72V | KIRC | 1 |
| p.A302T | UCEC | 1 |
| p.V266I | DLBC | 1 |
| p.S273P | COAD | 1 |
| p.Q313* | SKCM | 1 |
| p.G282W | LUAD | 1 |
| p.M124T | STAD | 1 |
| p.R173* | HNSC | 1 |
| p.D91Y | LUAD | 1 |
| p.D349G | LGG | 1 |
| p.N185D | PRAD | 1 |
| p.Y421C | LIHC | 1 |
| p.N68D | PRAD | 1 |
| p.G486S | COAD | 1 |
| p.S70W | SKCM | 1 |
| p.V434M | UCEC | 1 |
| p.R110W | BLCA | 1 |
| p.Q107L | LUAD | 1 |
| p.S356I | LUSC | 1 |
| p.H229Q | CHOL | 1 |
| p.D104Y | LUAD | 1 |
| Top |
| TissGeneCNV for STK32C |
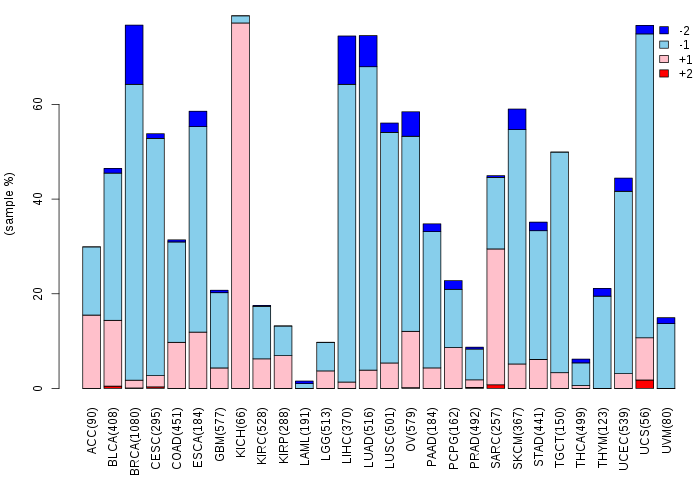
| Copy number variations of TissGene across 28 cancer types (X-axis: cancer type and Y-axis: % of CNV samples) (TCGA Gistic2_CopyNumber_Gistic2_all_data_by_genes, Gistic2 copy number data, version 2016-08-16) |
 |
| Top |
| TissGeneFusions for STK32C |
| Fusion genes including TissGene (ChimerDB 3.0, 2016-12-01 and TCGA fusion Portal 2015-12-01) |
| Database | Src | Cancer type | Sample | Fusion gene | ORF | 5'-gene BP | 3'-gene BP |
| TCGAfusionPortal | PRADA | HNSC | TCGA-DQ-5624-01A | MYO19-STK32C | NA | Chr17:34881059 | Chr10:134137877 |
| TCGAfusionPortal | PRADA | SKCM | TCGA-EB-A51B-01A | STK32C-PWWP2B | CDS-3UTR | Chr10:134022538 | Chr10:134230565 |
| Top |
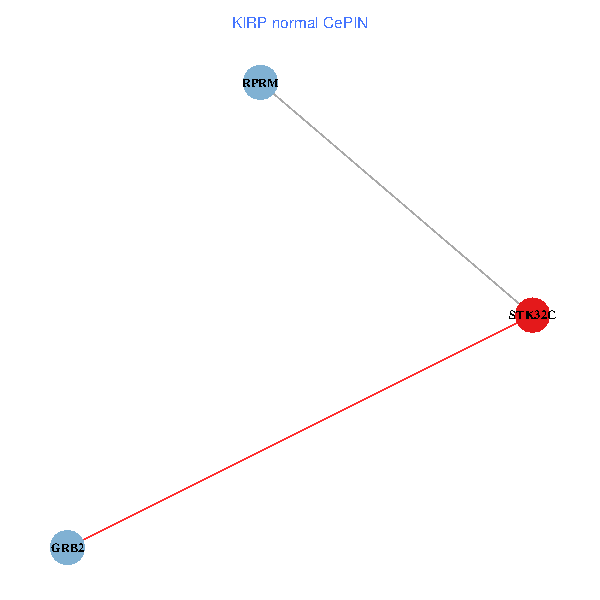
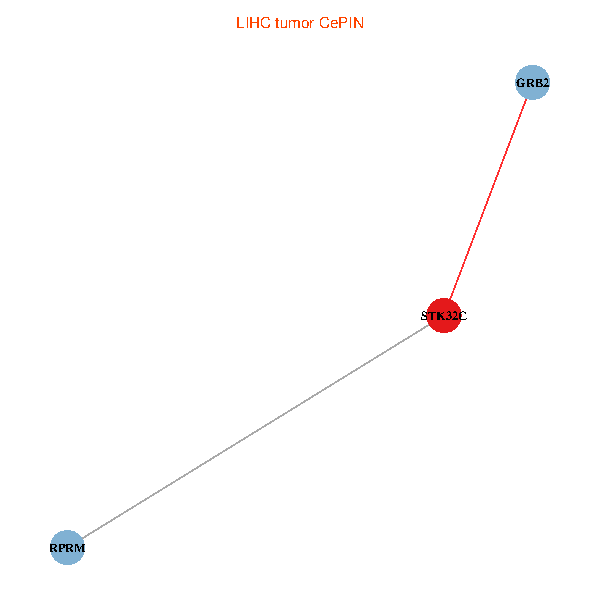
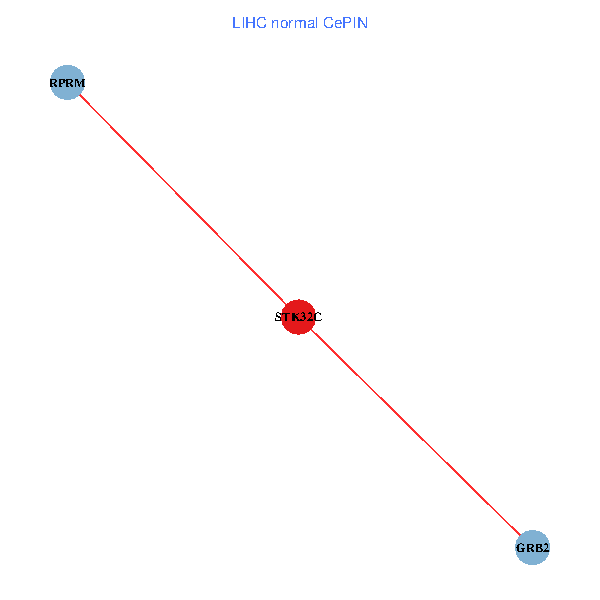
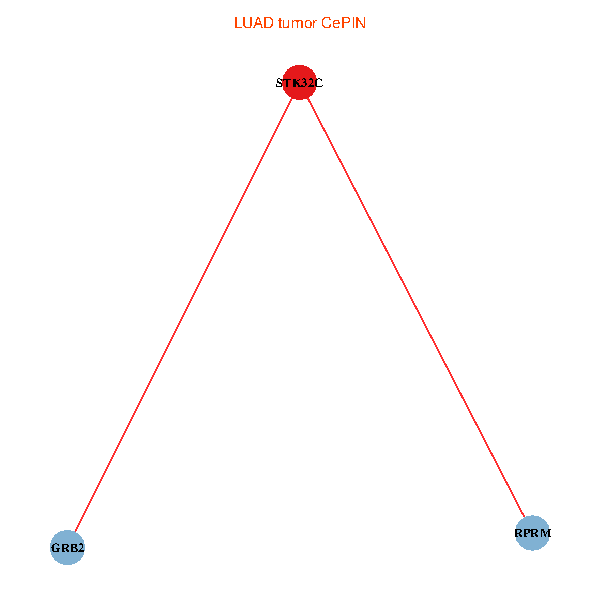
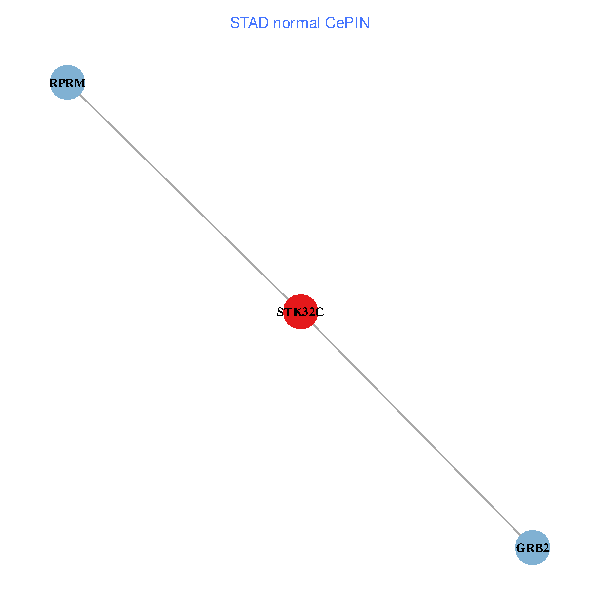
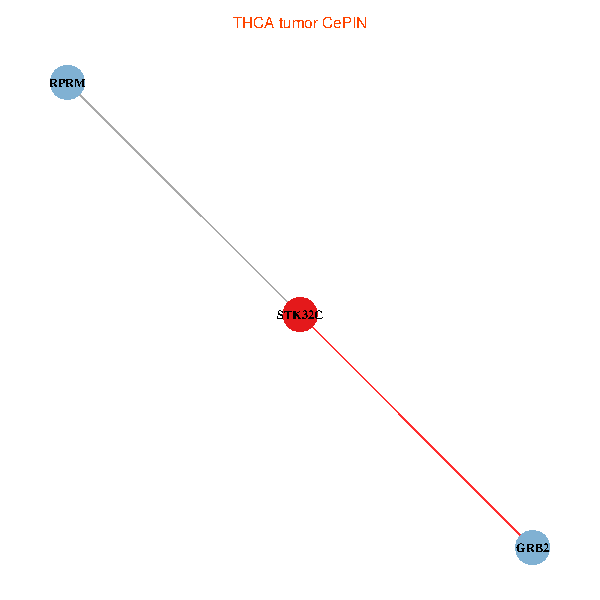
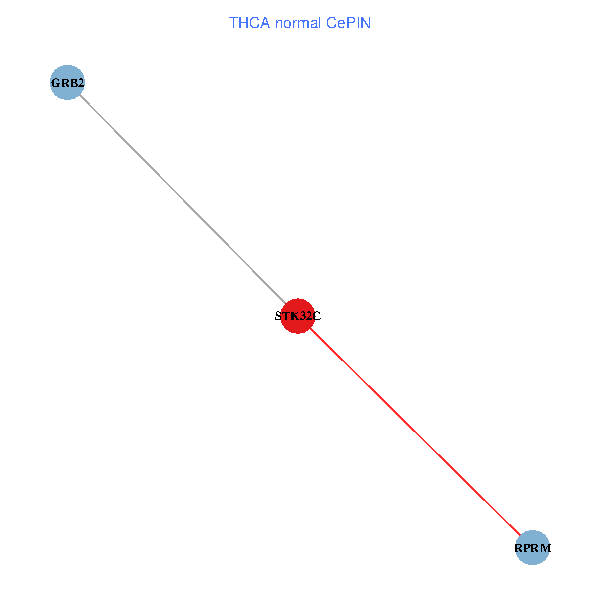
| TissGeneNet for STK32C |
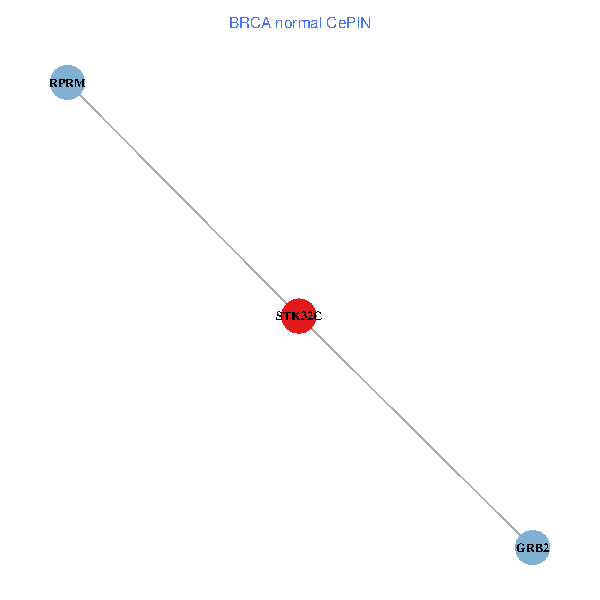
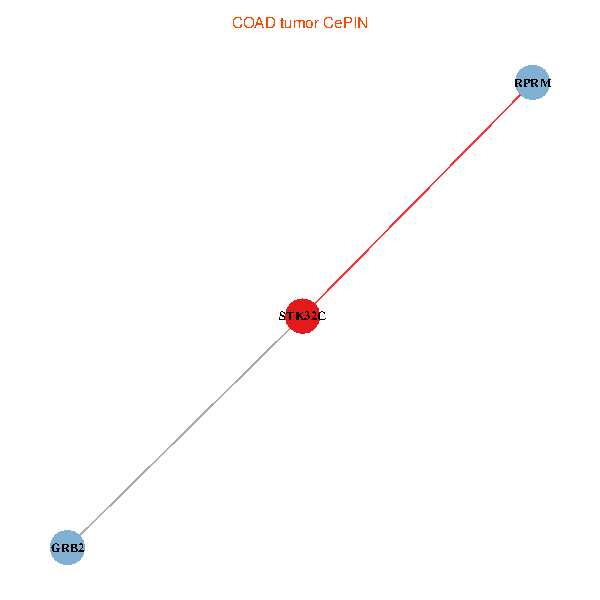
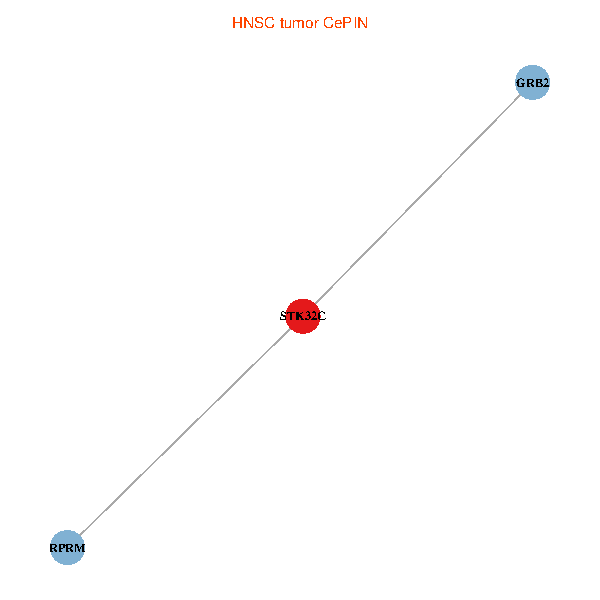
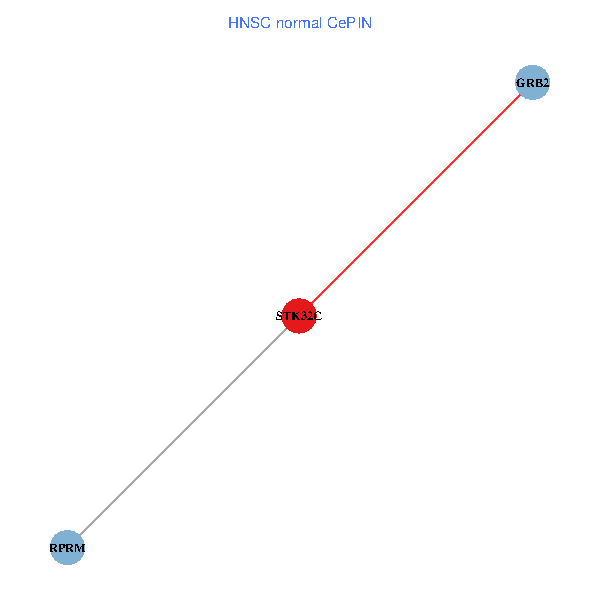
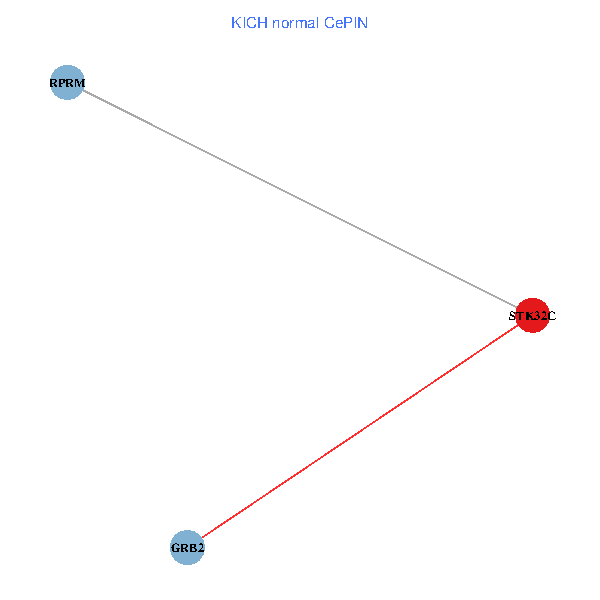
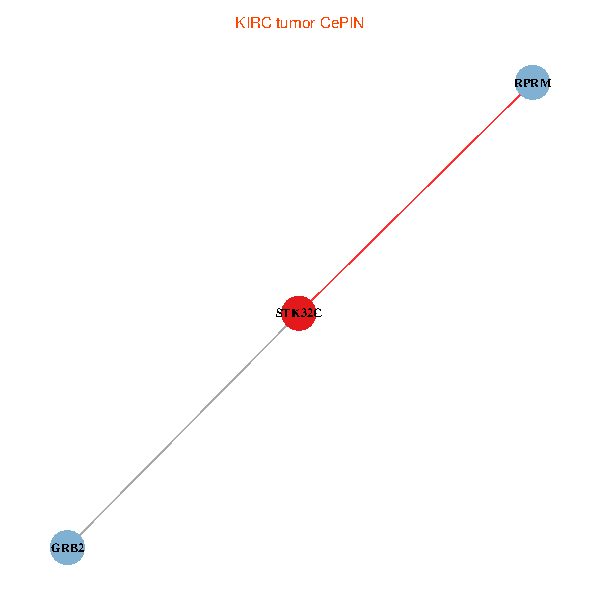
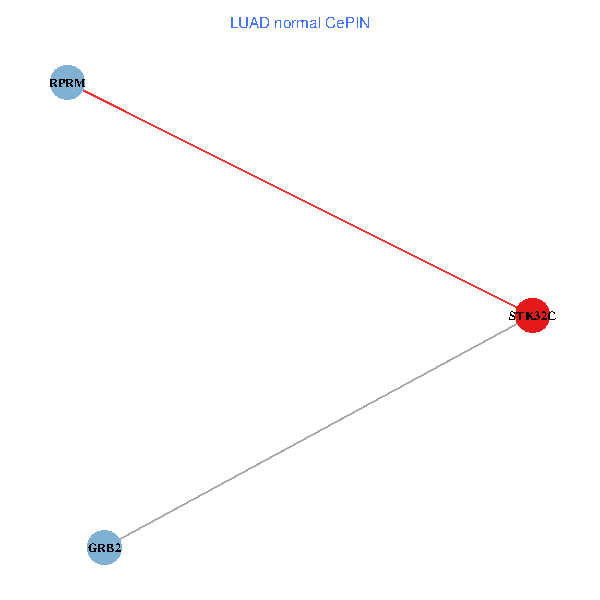
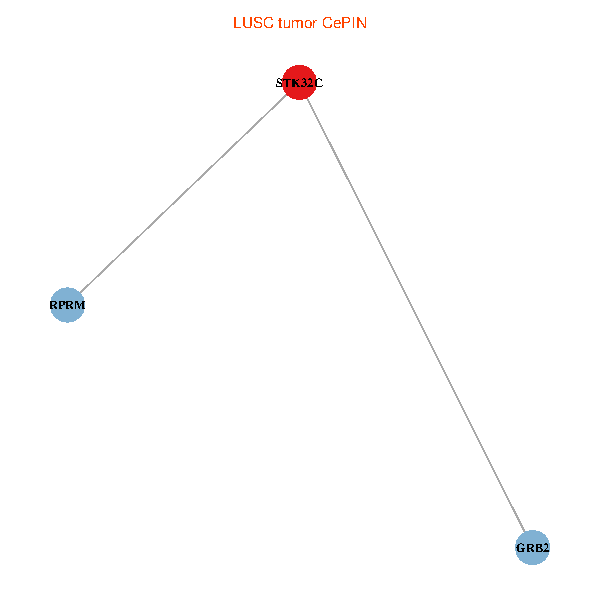
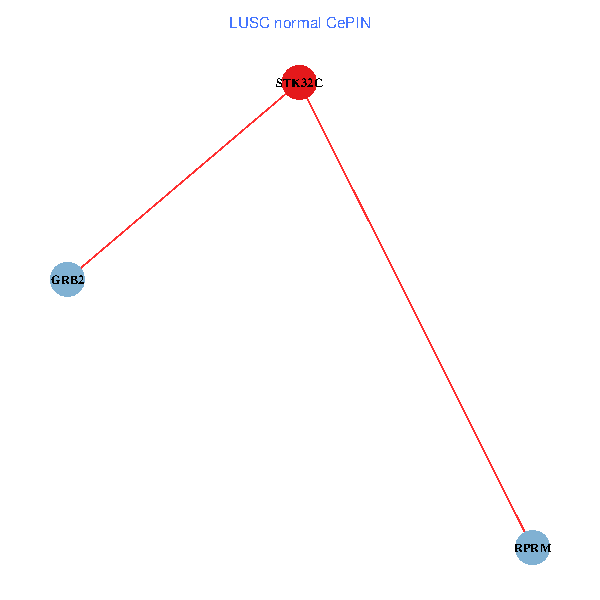
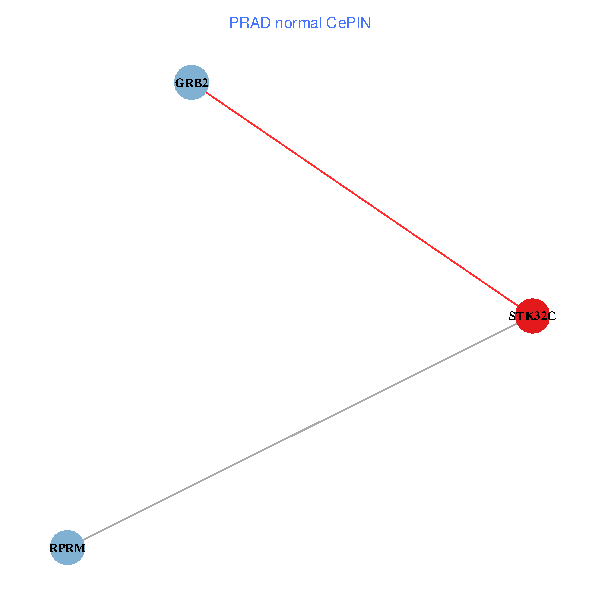
| Co-expressed gene networks based on protein-protein interaction data (CePIN) (TCGA IlluminaHiSeq_RNASeqV2, pan-cancer normalized log2(norm_counts+1) data, version 2016-08-16) (PINA2 ppi data) |
| BRCA (tumor) | BRCA (normal) |
| STK32C, GRB2, RPRM (tumor) | STK32C, GRB2, RPRM (normal) |
 |  |
| COAD (tumor) | COAD (normal) |
| STK32C, GRB2, RPRM (tumor) | STK32C, GRB2, RPRM (normal) |
 |  |
| HNSC (tumor) | HNSC (normal) |
| STK32C, GRB2, RPRM (tumor) | STK32C, GRB2, RPRM (normal) |
 |  |
| KICH (tumor) | KICH (normal) |
| STK32C, GRB2, RPRM (tumor) | STK32C, GRB2, RPRM (normal) |
 |  |
| KIRC (tumor) | KIRC (normal) |
| STK32C, GRB2, RPRM (tumor) | STK32C, GRB2, RPRM (normal) |
 |  |
| KIRP (tumor) | KIRP (normal) |
| STK32C, GRB2, RPRM (tumor) | STK32C, GRB2, RPRM (normal) |
 |  |
| LIHC (tumor) | LIHC (normal) |
| STK32C, GRB2, RPRM (tumor) | STK32C, GRB2, RPRM (normal) |
 |  |
| LUAD (tumor) | LUAD (normal) |
| STK32C, GRB2, RPRM (tumor) | STK32C, GRB2, RPRM (normal) |
 |  |
| LUSC (tumor) | LUSC (normal) |
| STK32C, GRB2, RPRM (tumor) | STK32C, GRB2, RPRM (normal) |
 |  |
| PRAD (tumor) | PRAD (normal) |
| STK32C, GRB2, RPRM (tumor) | STK32C, GRB2, RPRM (normal) |
 |  |
| STAD (tumor) | STAD (normal) |
| STK32C, GRB2, RPRM (tumor) | STK32C, GRB2, RPRM (normal) |
 |  |
| THCA (tumor) | THCA (normal) |
| STK32C, GRB2, RPRM (tumor) | STK32C, GRB2, RPRM (normal) |
 |  |
| Top |
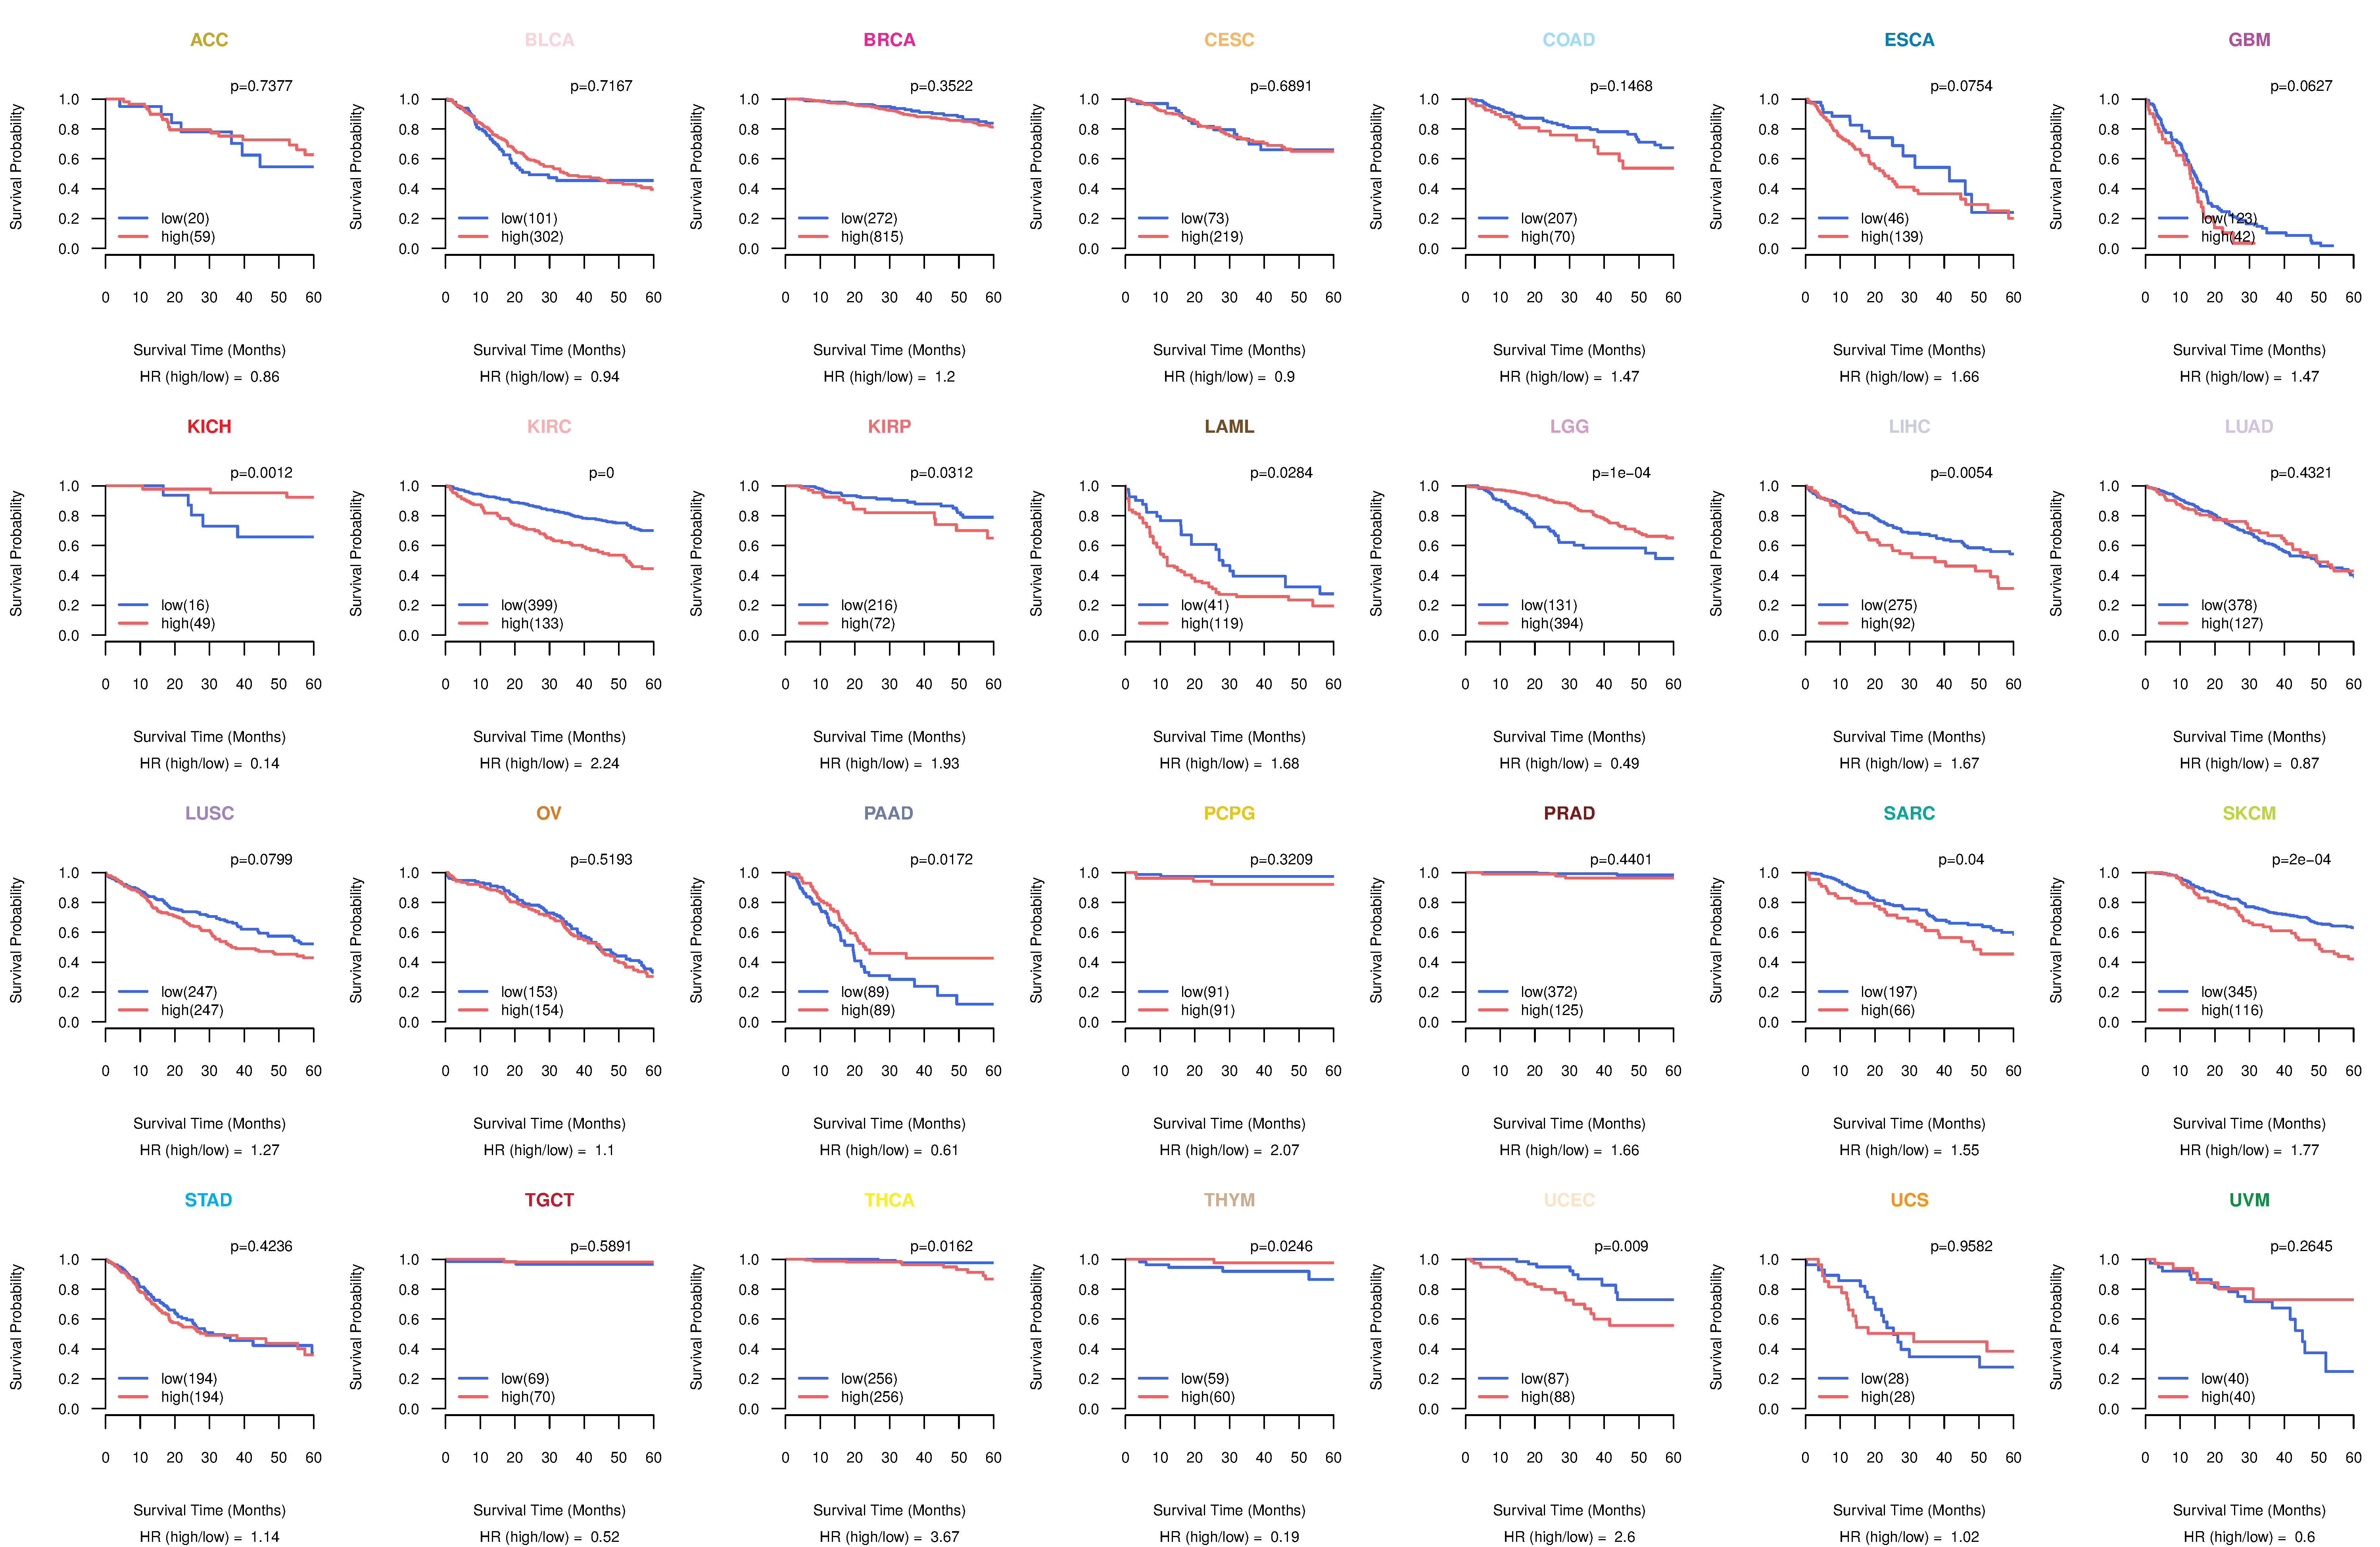
| TissGeneProg for STK32C |
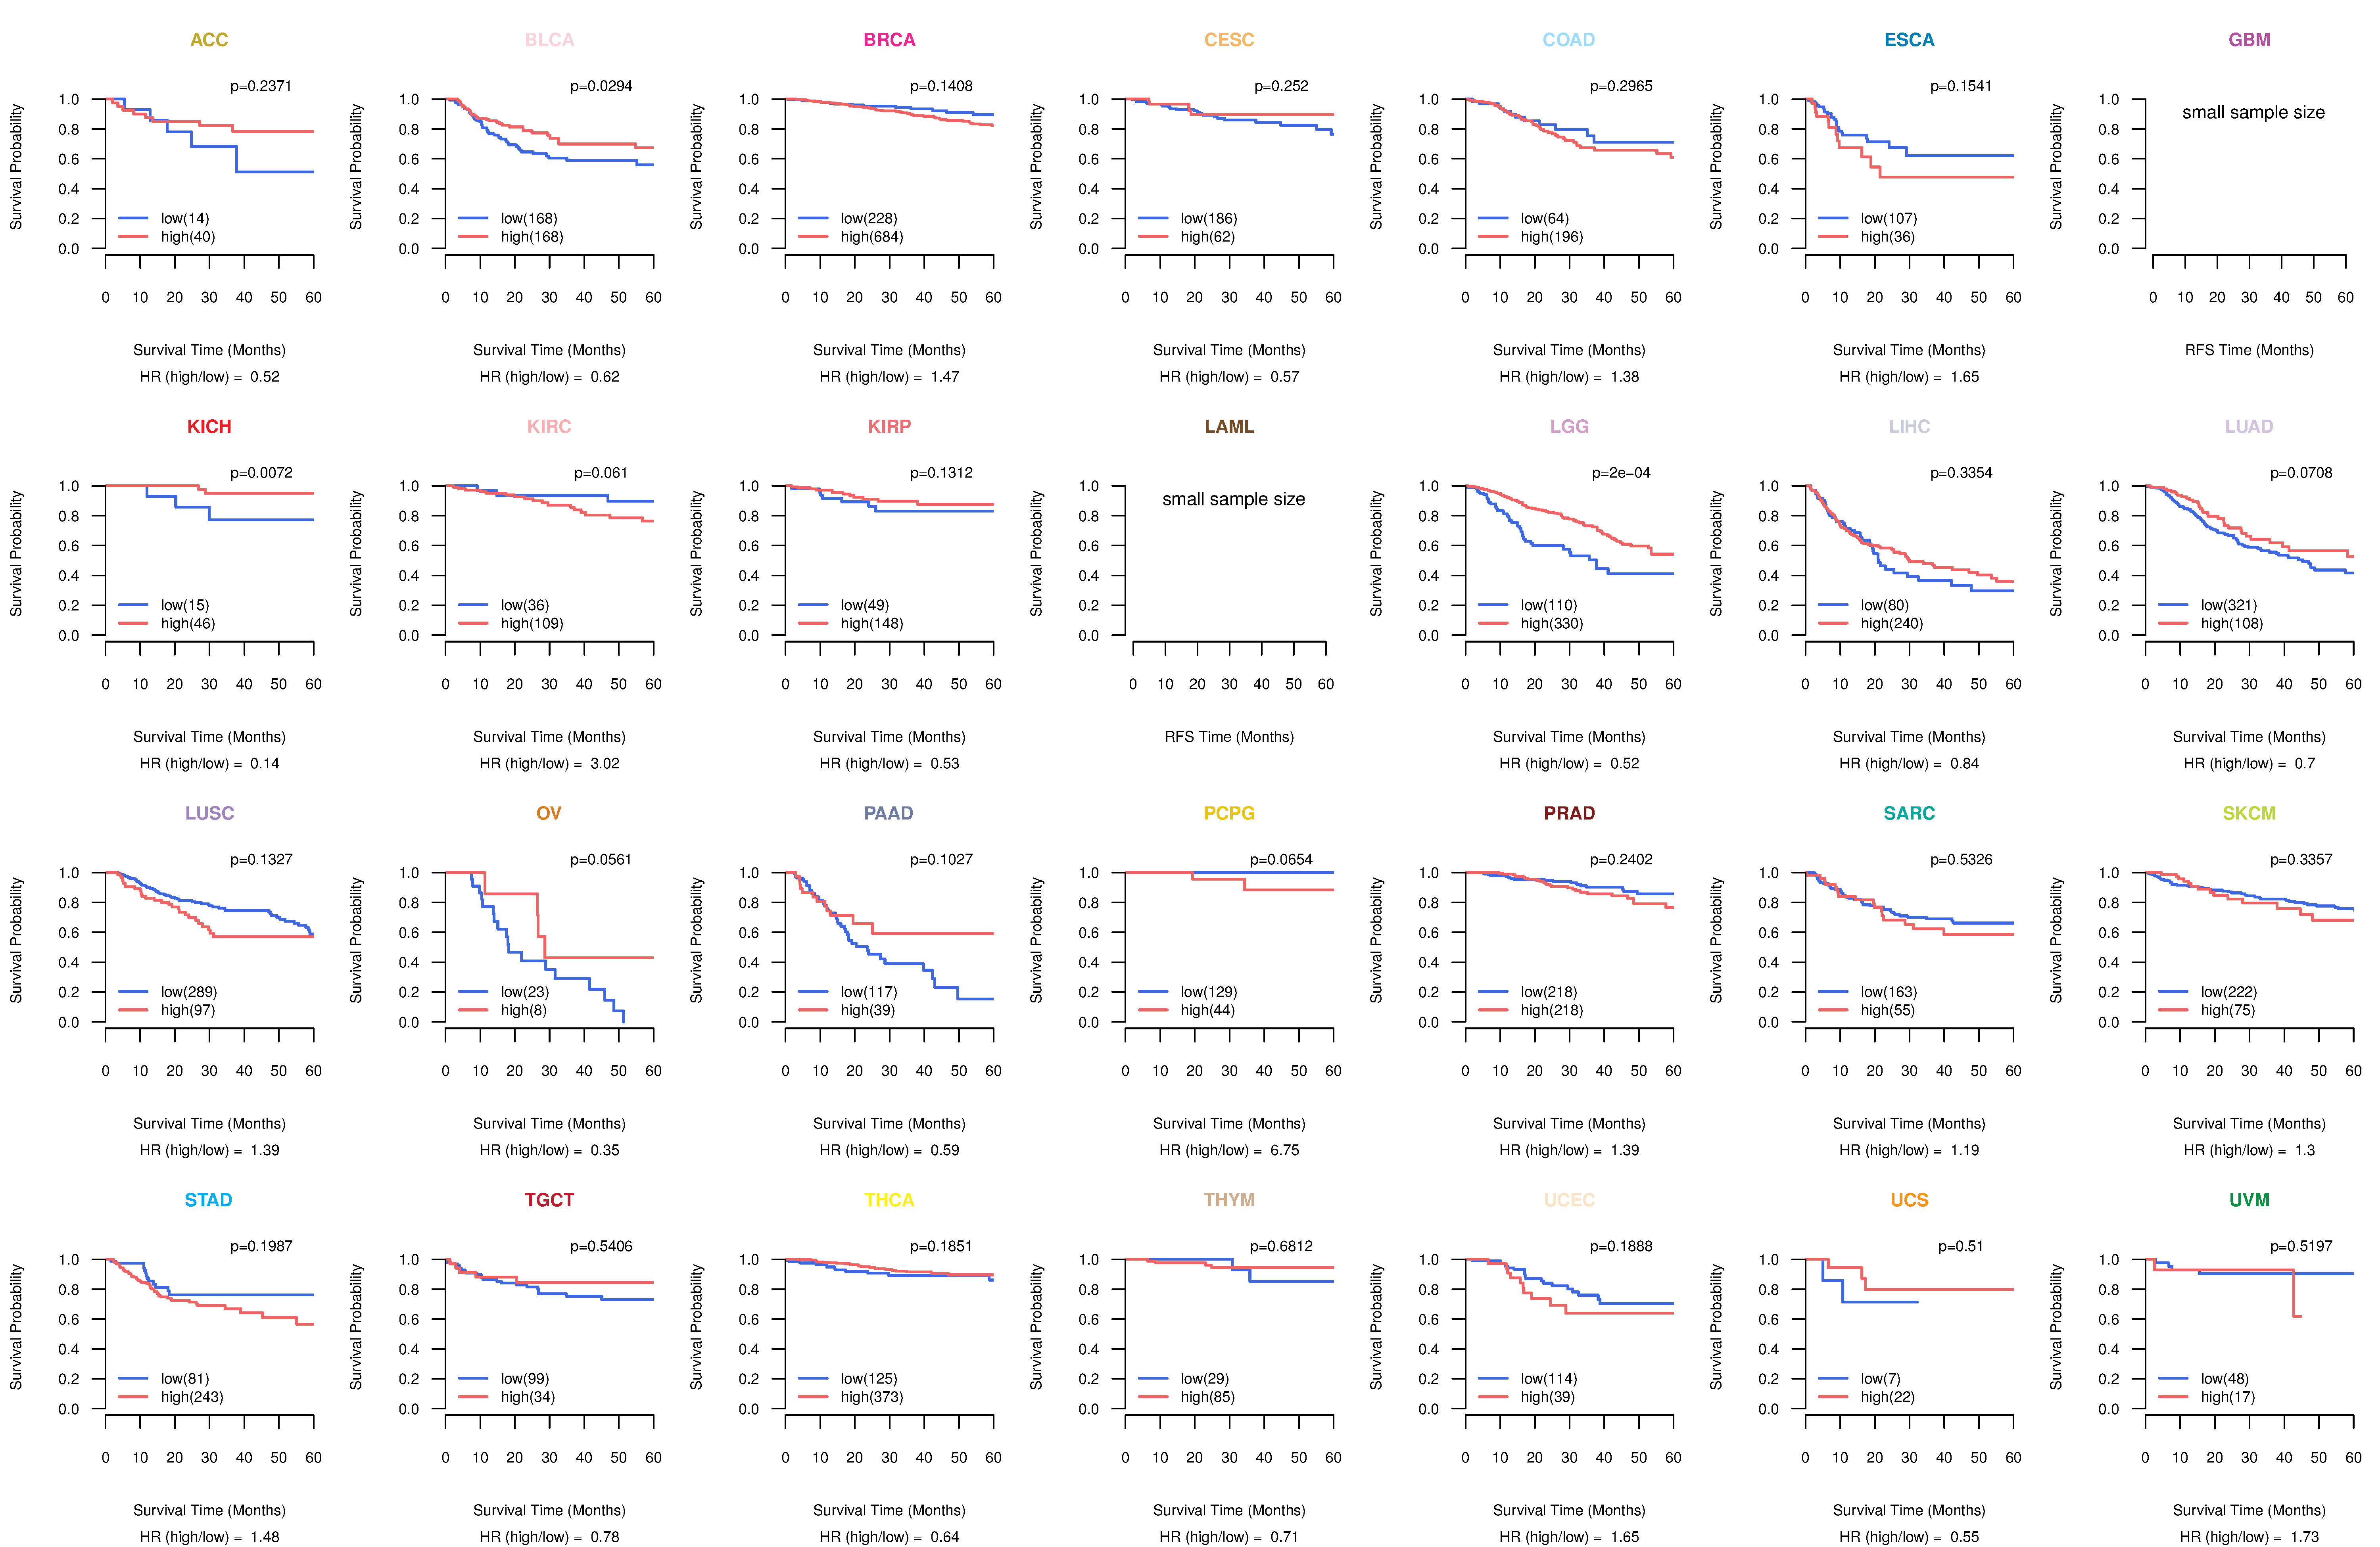
| Kaplan-Meier plots with logrank tests of overall survival (OS) using 28 cancer types (TCGA IlluminaHiSeq_RNASeqV2, pan-cancer normalized log2(norm_counts+1) data, version 2016-08-16) (TCGA clinicalMatrix, phenotype data, version 2016-04-27) * Click on the image to enlarge it in a new window. |
 |
| Kaplan-Meier plots with logrank test of relapse free survival (RFS) using 28 cancer types (TCGA IlluminaHiSeq_RNASeqV2, pan-cancer normalized log2(norm_counts+1) data, version 2016-08-16) (TCGA clinicalMatrix, phenotype data, version 2016-04-27) * Click on the image enlarge it in a new window. |
 |
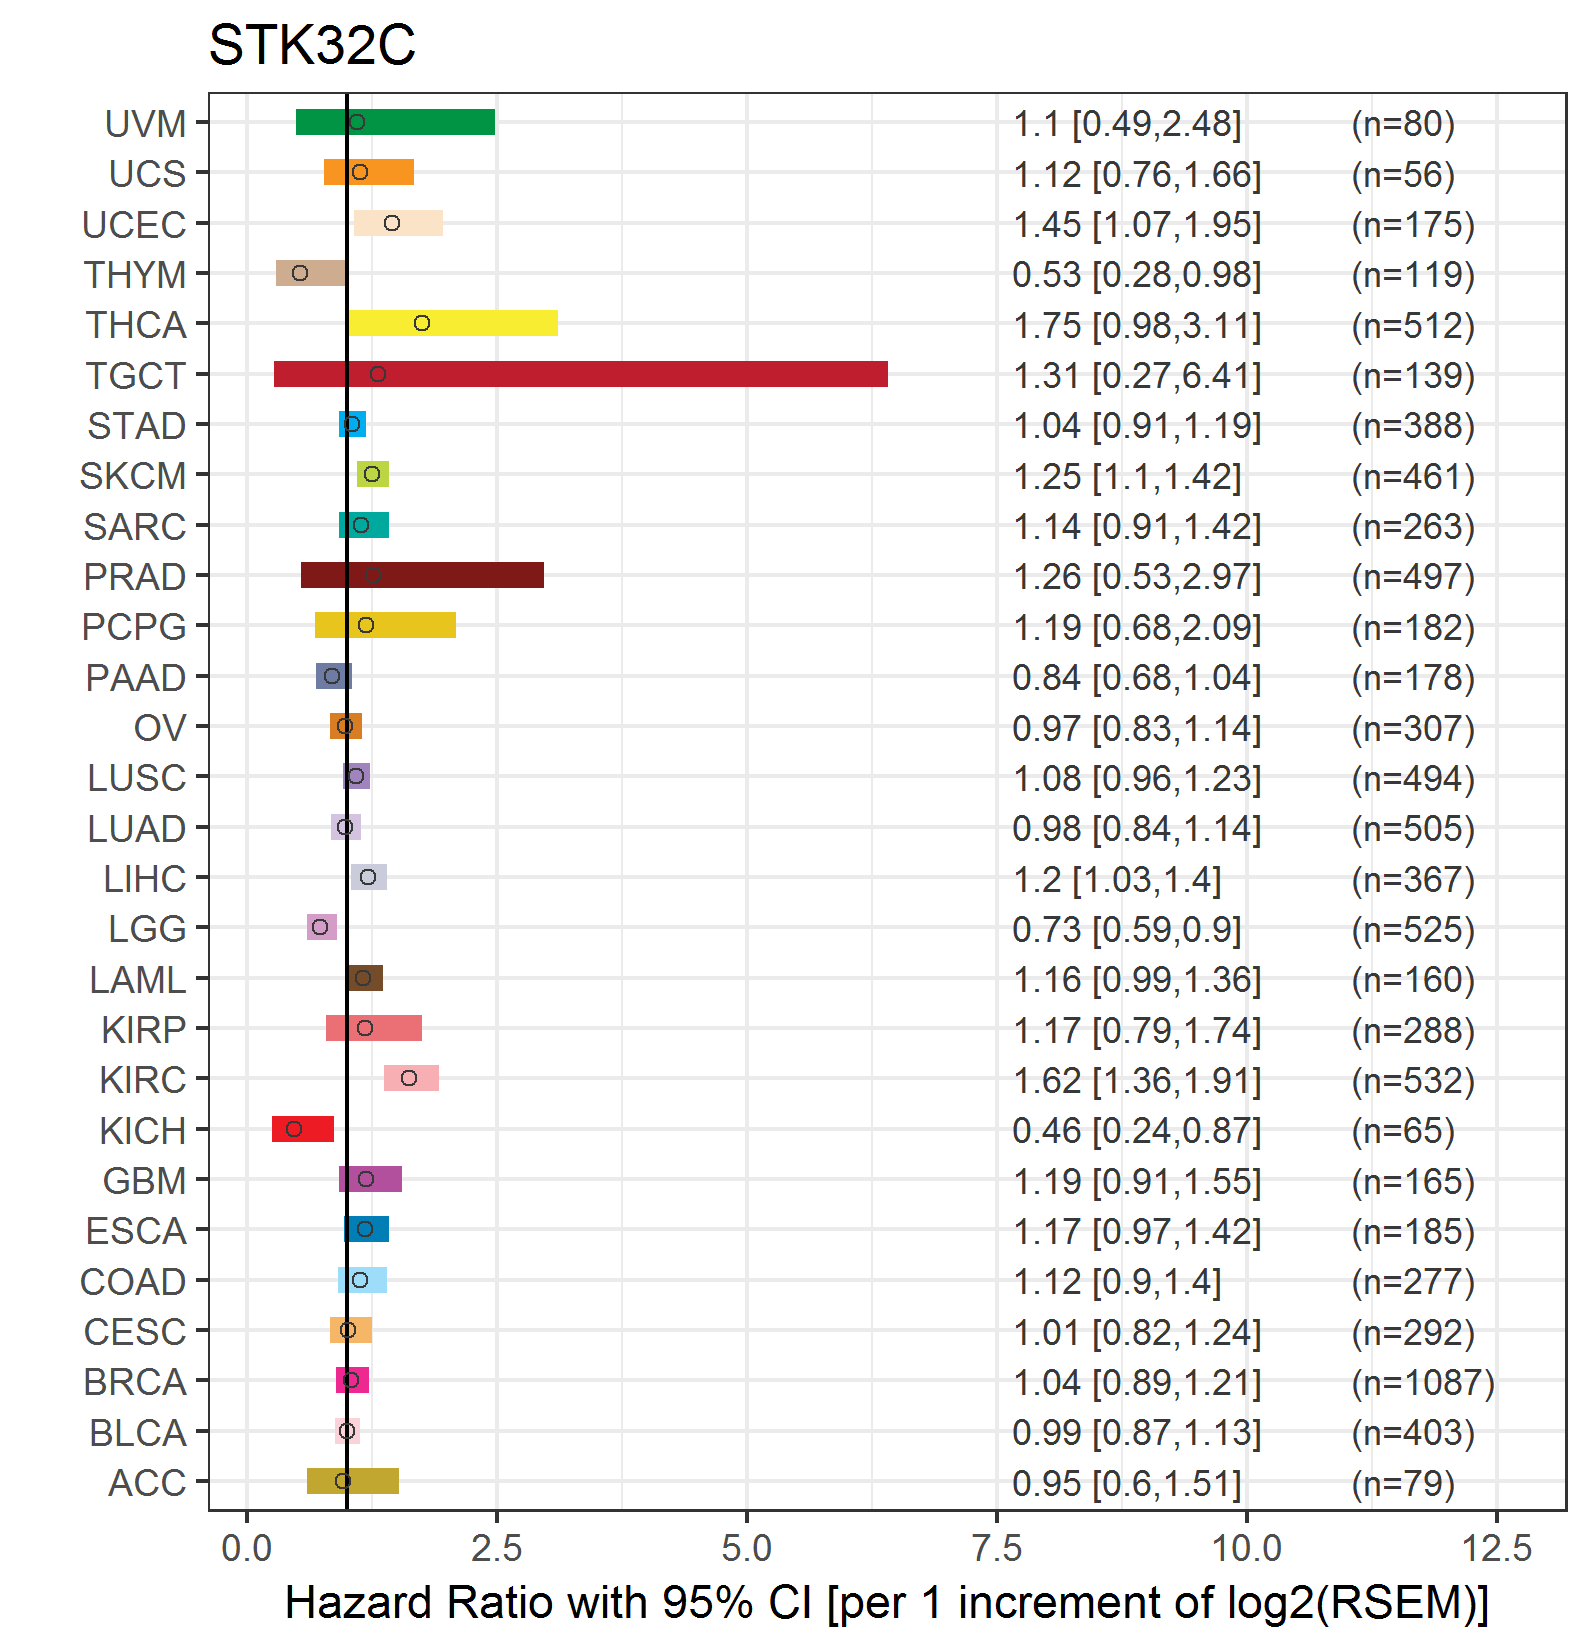
| Forest plot of Cox proportional hazard ratio (HR) and 95% CI of overall survival (OS) using 28 cancer types (TCGA IlluminaHiSeq_RNASeqV2, pan-cancer normalized log2(norm_counts+1) data, version 2016-08-16) (TCGA clinicalMatrix, phenotype data, version 2016-04-27) * Click on the image enlarge it in a new window. |
 |
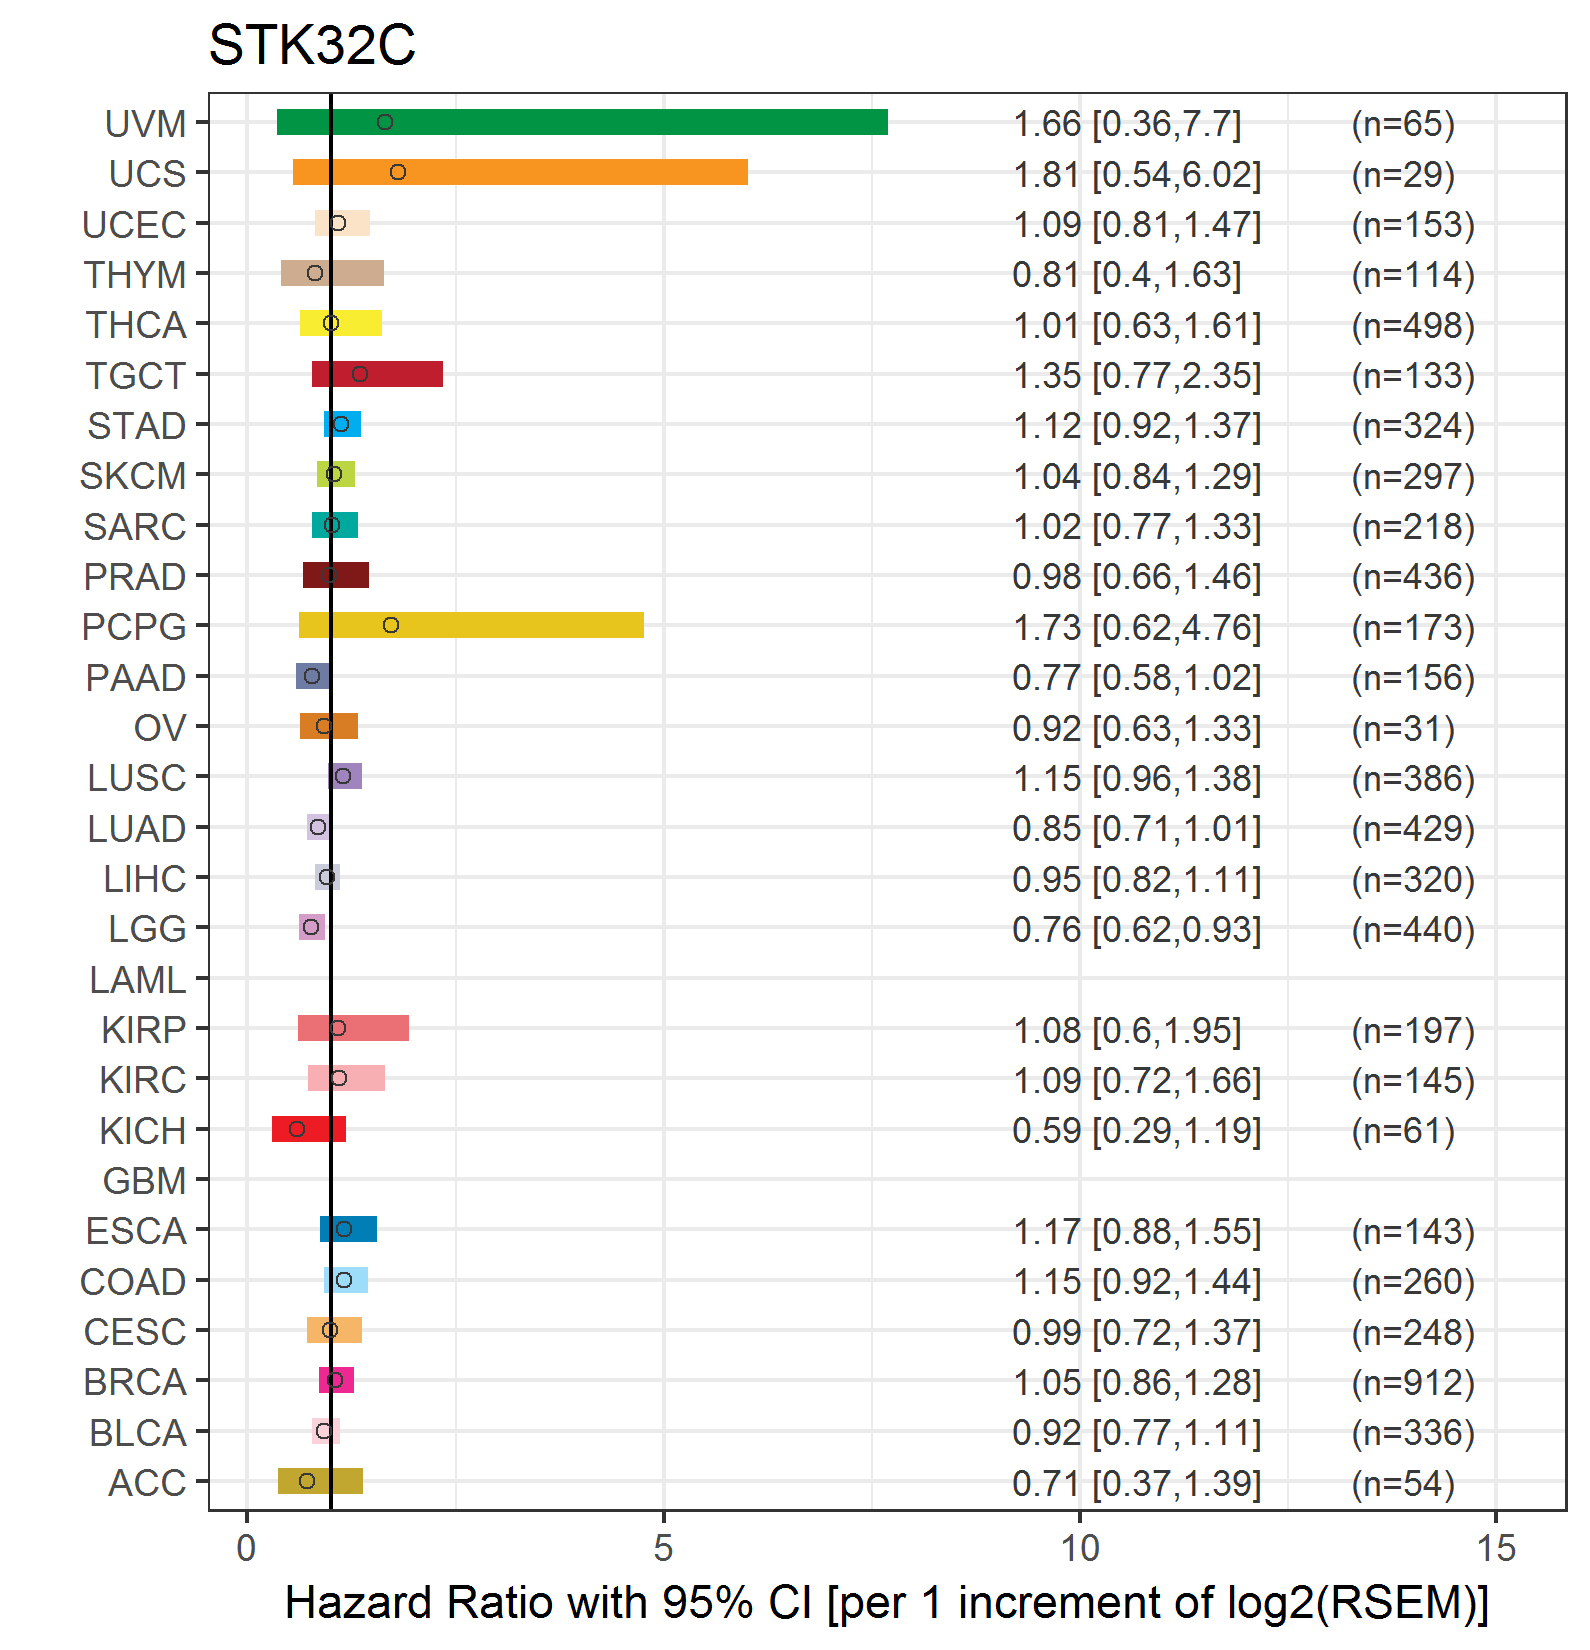
| Forest plot of Cox proportional hazard ratio (HR) and 95% CI of relapse free survival (RFS) using 28 cancer types (TCGA IlluminaHiSeq_RNASeqV2, pan-cancer normalized log2(norm_counts+1) data, version 2016-08-16) (TCGA clinicalMatrix, phenotype data, version 2016-04-27) * Click on the image enlarge it in a new window. |
 |
| Top |
| TissGeneClin for STK32C |
| TissGeneDrug for STK32C |
| Drug information targeting TissGene (DrugBank Version 5.0.6, 2017-04-01) |
| DrugBank ID | Drug name | Drug activity | Drug type | Drug status |
| Top |
| TissGeneDisease for STK32C |
| Disease information associated with TissGene (DisGeNet, 2016-06-01) |
| Disease ID | Disease name | # pubmeds | Source |
| umls:C0011570 | Mental Depression | 1 | BeFree |
| umls:C0011581 | Depressive disorder | 1 | BeFree |
| umls:C0011860 | Diabetes Mellitus, Non-Insulin-Dependent | 1 | GAD |
|
Copyright 2016-Present - The University of Texas Health Science Center at Houston (UTHealth) Web File Viewing | How to Report, Fraud, Waste and Abuse | State of Texas | Statewide Search | Texas Homeland Security | Site Policies |