 |
| |
| |
| |
| |
| |
| |
|

| TissGeneSummary for DPY19L2 |
 Gene summary Gene summary |
| Basic gene information | Gene symbol | DPY19L2 |
| Gene name | dpy-19-like 2 (C. elegans) | |
| Synonyms | SPATA34|SPGF9 | |
| Cytomap | UCSC genome browser: 12q14.2 | |
| Type of gene | protein-coding | |
| RefGenes | NM_173812.4, | |
| Description | probable C-mannosyltransferase DPY19L2protein dpy-19 homolog 2spermatogenesis associated 34 | |
| Modification date | 20141207 | |
| dbXrefs | MIM : 613893 | |
| HGNC : HGNC | ||
| Ensembl : ENSG00000177990 | ||
| HPRD : 08151 | ||
| Vega : OTTHUMG00000168712 | ||
| Protein | UniProt: go to UniProt's Cross Reference DB Table | |
| Expression | CleanEX: HS_DPY19L2 | |
| BioGPS: 283417 | ||
| Pathway | NCI Pathway Interaction Database: DPY19L2 | |
| KEGG: DPY19L2 | ||
| REACTOME: DPY19L2 | ||
| Pathway Commons: DPY19L2 | ||
| Context | iHOP: DPY19L2 | |
| ligand binding site mutation search in PubMed: DPY19L2 | ||
| UCL Cancer Institute: DPY19L2 | ||
| Assigned class in TissGDB* | B | |
| Included tissue-specific gene expression resources | HPA,TiGER,GTEx | |
| Specific-tissues in normal samples (assigned by TissGDB using HPA, TiGER, and GTEx) | Testis | |
| Cancer types related to the specific-tissues in cancer samples (assigned by TissGDB using TCGA) | TGCT | |
| Reference showing the relevant tissue of DPY19L2 | ||
| Description by TissGene annotations | ||
| * Class A consists of genes with literature evidence and is part of the cTissGenes. Class B consists of only cTissGenes without additional evidence. The remaining genes belong to Class C. |
| Gene ontology having evidence of Inferred from Direct Assay (IDA) from Entrez |
| GO ID | GO term | PubMed ID |
| Top |
| TissGeneExp for DPY19L2 |
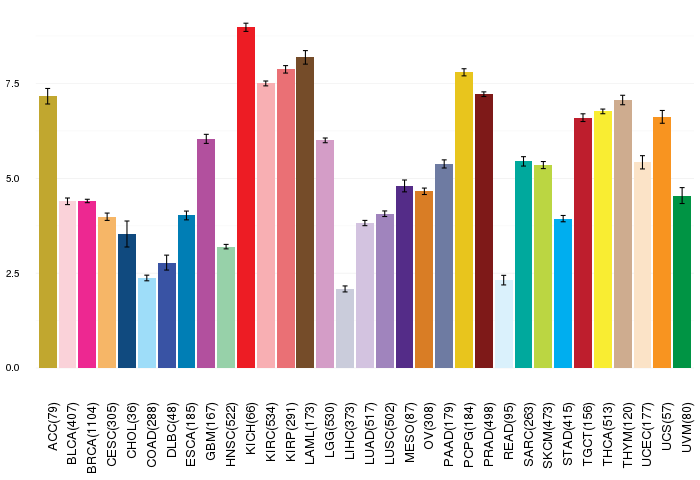
| Gene expressions across 28 cancer types (X-axis: cancer type and Y-axis: log2(norm_counts+1)) (TCGA IlluminaHiSeq_RNASeqV2, pan-cancer normalized log2(norm_counts+1) data, version 2016-08-16) |
 |
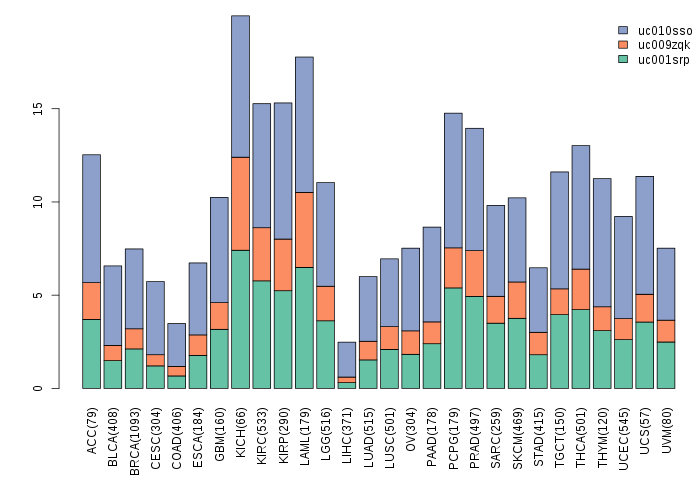
| Gene isoform expressions across 28 cancer types (X-axis: cancer type and Y-axis: log2(norm_counts+1)) (TCGA pan-cancer tcga_rsem_isoform_tpm, version 2016-09-01) |
 |
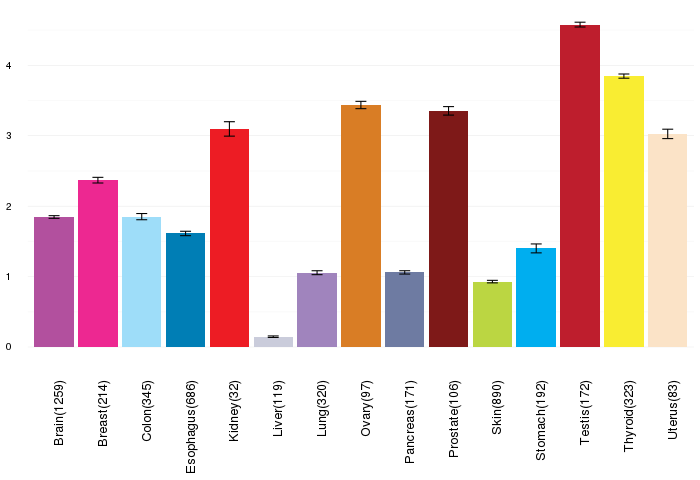
| Gene expressions across normal tissues of GTEx data (GTEx GTEx_Analysis_v6_RNA-seq_RNA-SeQCv1.1.8_gene_rpkm.gct) - Here, we shows the matched tissue types only among our 28 cancer types. |
 |
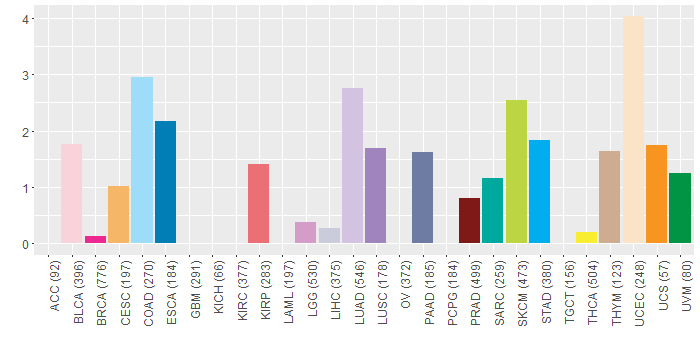
| Different expressions across 14 cancer types with more than 10 samples between matched tumors and normals (X-axis: cancer type and Y-axis: log2(norm_counts+1)) (TCGA IlluminaHiSeq_RNASeqV2, pan-cancer normalized log2(norm_counts+1) data, version 2016-08-16) |
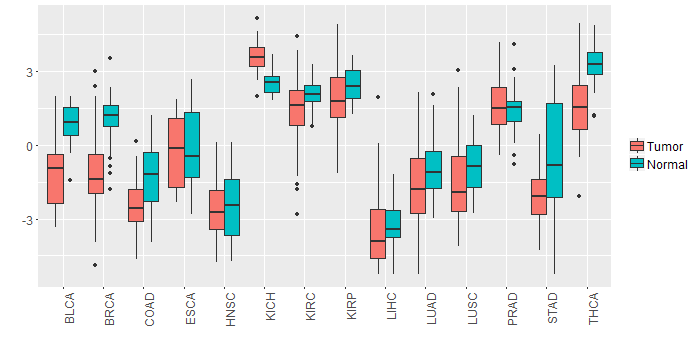 |
| - Significantly differentially expressed cancer types and information. (|Fold change|>1 and FDR<0.05) |
| Cancer type | Mean(exp) in tumor | Mean(exp) in matched normal | Log2FC | P-val. | FDR |
| KICH | 3.592585074 | 2.555733074 | 1.036852 | 1.53E-07 | 6.78E-07 |
| BRCA | -1.150688014 | 1.135955846 | -2.28664386 | 3.35E-34 | 5.90E-33 |
| THCA | 1.591741142 | 3.282803853 | -1.691062712 | 3.10E-13 | 3.05E-12 |
| STAD | -1.968293551 | -0.468890426 | -1.499403125 | 0.00216 | 0.009619485 |
| COAD | -2.535672157 | -1.38499908 | -1.150673077 | 0.00254 | 0.006585964 |
| BLCA | -1.206566084 | 0.840602337 | -2.047168421 | 9.89E-06 | 0.000192231 |
| Top |
| TissGene-miRNA for DPY19L2 |
| Significantly anti-correlated miRNAs of TissGene across 28 cancer types (Gene-miRNA relations from TargetScanHuman Relsease 7.1, Conserved_Site_Context_Scores.txt.zip, 06.01.2016) (TCGA IlluminaHiSeq_miRNASeq, log2(RPM+1) data, version 2016-11-21) (TCGA IlluminaHiSeq_RNASeqV2, log2(normalized_count+1) data, version 2016-08-16) (Spearman’s Rank Correlation (p-value<0.05 and coefficient<-0.25)) |
| Cancer type | miRNA id | miRNA accession | P-val. | Coeff. | # samples |
| Top |
| TissGeneMut for DPY19L2 |
| TissGeneSNV for DPY19L2 |
| nsSNV counts per each loci. Different colors of circles represent different cancer types. Circle size denotes number of samples. (TCGA somatic mutation (SNPs and small INDELs) data, version 2016-04-25) * Click on the image to enlarge it in a new window. |
 |
 |
| Somatic nucleotide variants of TissGene across 28 cancer types (X-axis: cancer type and Y-axis: % of mutated samples) The numbers in parentheses are numbers of samples with mutation (nsSNVs). (TCGA somatic mutation (SNPs and small INDELs) data, version 2016-04-25) |
 |
| - nsSNVs sorted by frequency. |
| AAchange | Cancer type | # samples |
| p.E149K | PAAD | 2 |
| p.F281L | UCEC | 2 |
| p.R585C | SKCM | 2 |
| p.G601S | SKCM | 1 |
| p.A640V | PRAD | 1 |
| p.L110V | BLCA | 1 |
| p.R514C | COAD | 1 |
| p.Q608E | UCS | 1 |
| p.L317I | UCEC | 1 |
| p.R93Q | LUSC | 1 |
| p.A739T | STAD | 1 |
| p.M210V | ESCA | 1 |
| p.M210L | SKCM | 1 |
| p.E480K | UCEC | 1 |
| p.I590M | UCS | 1 |
| p.E149K | DLBC | 1 |
| p.G80D | COAD | 1 |
| p.R86C | STAD | 1 |
| p.R514C | UCEC | 1 |
| p.R142W | LIHC | 1 |
| p.R290H | PRAD | 1 |
| p.E227X | COAD | 1 |
| p.L42I | COAD | 1 |
| p.I590M | HNSC | 1 |
| p.A548V | SKCM | 1 |
| p.L541F | THCA | 1 |
| p.V685E | SARC | 1 |
| p.P228L | LUAD | 1 |
| p.R147H | COAD | 1 |
| p.T468I | STAD | 1 |
| p.G613* | UCEC | 1 |
| p.Y661* | HNSC | 1 |
| p.Q271H | LUAD | 1 |
| p.R412I | UCEC | 1 |
| p.S395C | SKCM | 1 |
| p.P81T | LUAD | 1 |
| p.K75T | CESC | 1 |
| p.A90V | STAD | 1 |
| p.F538L | STAD | 1 |
| p.W171* | BRCA | 1 |
| p.C204R | THYM | 1 |
| p.C280W | LGG | 1 |
| p.F206L | LUAD | 1 |
| p.N253Y | LUAD | 1 |
| p.F104L | HNSC | 1 |
| p.S51F | STAD | 1 |
| p.T437K | KIRP | 1 |
| p.F157L | BLCA | 1 |
| p.L549F | SKCM | 1 |
| p.R455C | SKCM | 1 |
| p.R190C | HNSC | 1 |
| p.Q429E | BLCA | 1 |
| p.R679* | SKCM | 1 |
| p.S139Y | UCEC | 1 |
| p.M644I | LUSC | 1 |
| p.Q97H | UCEC | 1 |
| p.P241L | SKCM | 1 |
| p.R514C | BLCA | 1 |
| p.R686I | LUAD | 1 |
| p.T522R | LUAD | 1 |
| p.G430C | COAD | 1 |
| p.D722Y | UCEC | 1 |
| p.E485K | SKCM | 1 |
| p.Y467* | SKCM | 1 |
| p.V223I | HNSC | 1 |
| p.M210V | PRAD | 1 |
| p.G430V | LUAD | 1 |
| p.I199K | KIRP | 1 |
| p.R574* | UCEC | 1 |
| p.I593V | COAD | 1 |
| p.R707T | BLCA | 1 |
| p.G80D | PRAD | 1 |
| p.W171C | LUAD | 1 |
| p.I428T | COAD | 1 |
| p.R29W | ESCA | 1 |
| p.S675C | HNSC | 1 |
| p.L560F | BLCA | 1 |
| p.C204R | PRAD | 1 |
| p.V545A | STAD | 1 |
| p.K628N | LUAD | 1 |
| p.D719Y | LUAD | 1 |
| p.P479S | KIRP | 1 |
| p.M210V | THYM | 1 |
| p.E149K | LGG | 1 |
| p.I647V | UVM | 1 |
| p.L459V | HNSC | 1 |
| p.S302F | SKCM | 1 |
| p.S105C | BLCA | 1 |
| p.R23L | LUAD | 1 |
| p.A242V | PAAD | 1 |
| p.K557N | COAD | 1 |
| p.T126I | LUSC | 1 |
| p.I627M | UCS | 1 |
| p.K756N | PRAD | 1 |
| p.L89M | LUAD | 1 |
| p.P228A | LUAD | 1 |
| p.M404I | READ | 1 |
| p.E480* | UCEC | 1 |
| p.R606C | SARC | 1 |
| p.T670A | ESCA | 1 |
| p.G208R | LUAD | 1 |
| p.D722Y | COAD | 1 |
| p.Y697C | ESCA | 1 |
| p.L79F | KIRP | 1 |
| p.S302Y | STAD | 1 |
| p.R669L | LUAD | 1 |
| p.P619S | SKCM | 1 |
| p.T219I | CESC | 1 |
| p.S201F | SKCM | 1 |
| p.A163V | STAD | 1 |
| p.R455C | SARC | 1 |
| Top |
| TissGeneCNV for DPY19L2 |
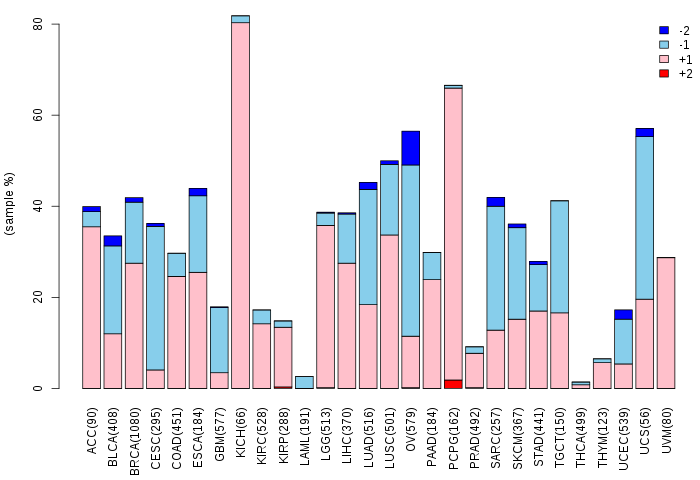
| Copy number variations of TissGene across 28 cancer types (X-axis: cancer type and Y-axis: % of CNV samples) (TCGA Gistic2_CopyNumber_Gistic2_all_data_by_genes, Gistic2 copy number data, version 2016-08-16) |
 |
| Top |
| TissGeneFusions for DPY19L2 |
| Fusion genes including TissGene (ChimerDB 3.0, 2016-12-01 and TCGA fusion Portal 2015-12-01) |
| Database | Src | Cancer type | Sample | Fusion gene | ORF | 5'-gene BP | 3'-gene BP |
| TCGAfusionPortal | PRADA | GBM | TCGA-06-0129-01A | PPFIA2-DPY19L2 | Out-of-frame | Chr12:82070570 | Chr12:63954442 |
| Top |
| TissGeneNet for DPY19L2 |
| Co-expressed gene networks based on protein-protein interaction data (CePIN) (TCGA IlluminaHiSeq_RNASeqV2, pan-cancer normalized log2(norm_counts+1) data, version 2016-08-16) (PINA2 ppi data) |
| Top |
| TissGeneProg for DPY19L2 |
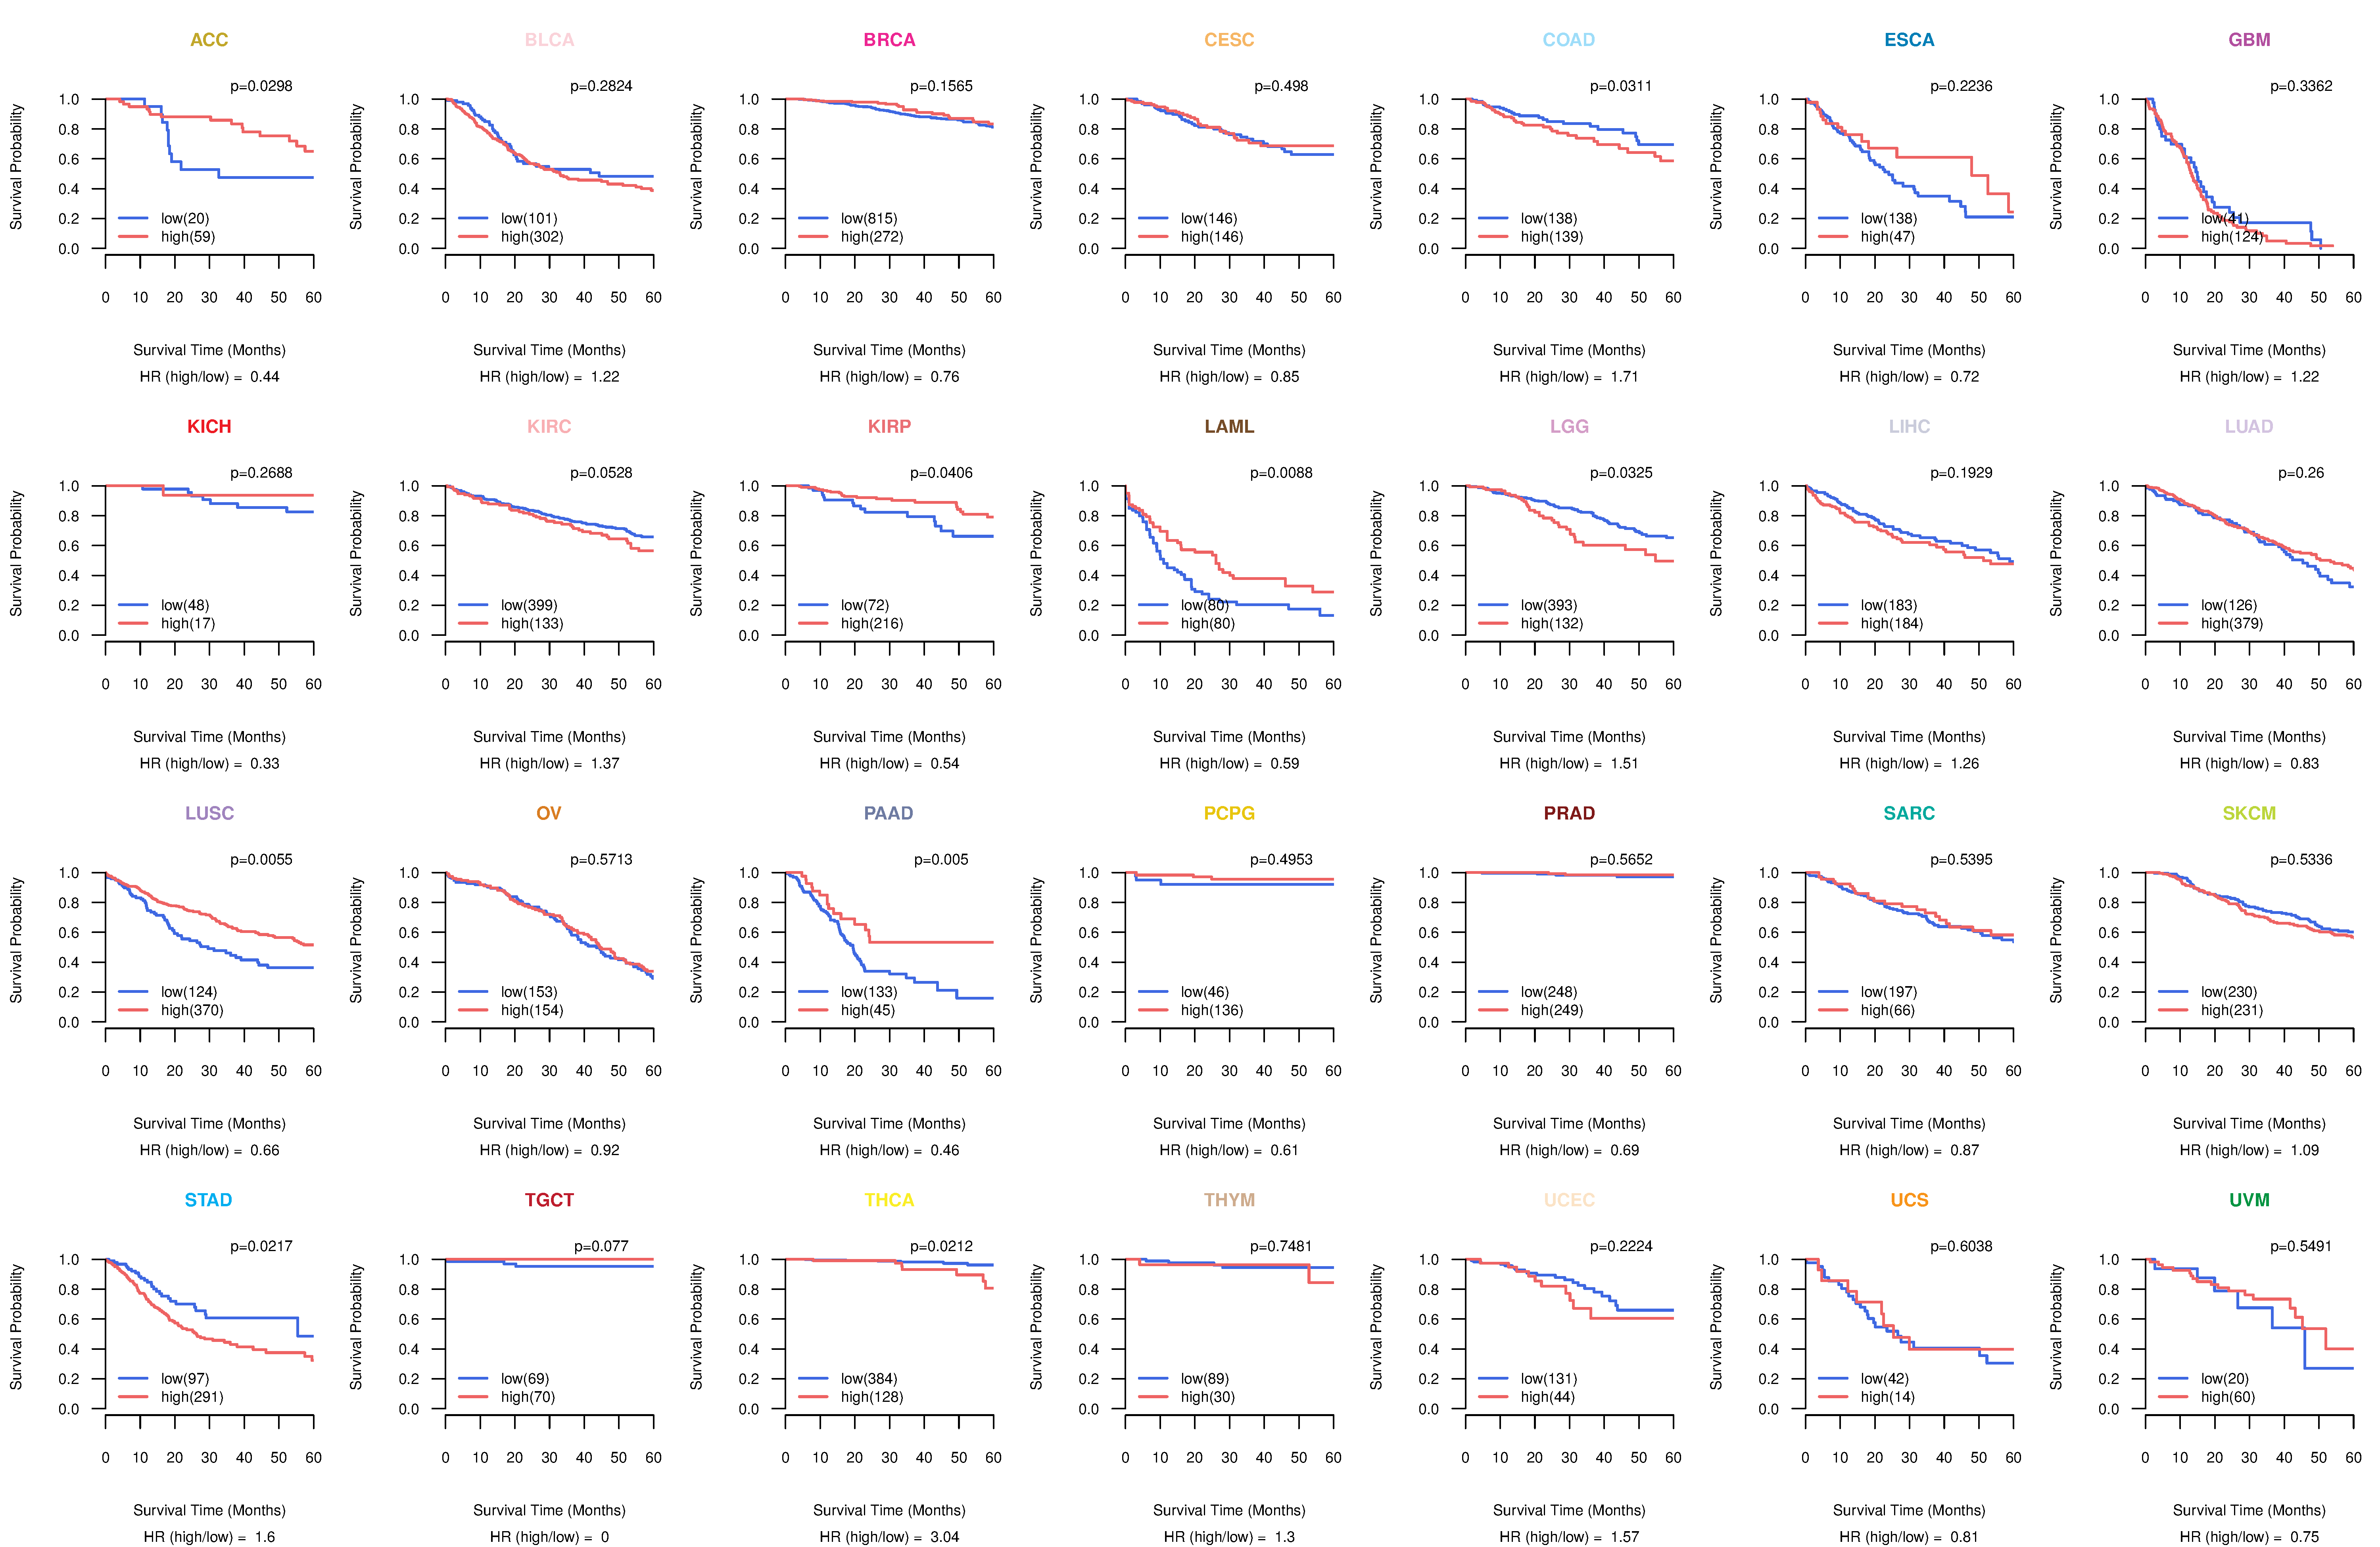
| Kaplan-Meier plots with logrank tests of overall survival (OS) using 28 cancer types (TCGA IlluminaHiSeq_RNASeqV2, pan-cancer normalized log2(norm_counts+1) data, version 2016-08-16) (TCGA clinicalMatrix, phenotype data, version 2016-04-27) * Click on the image to enlarge it in a new window. |
 |
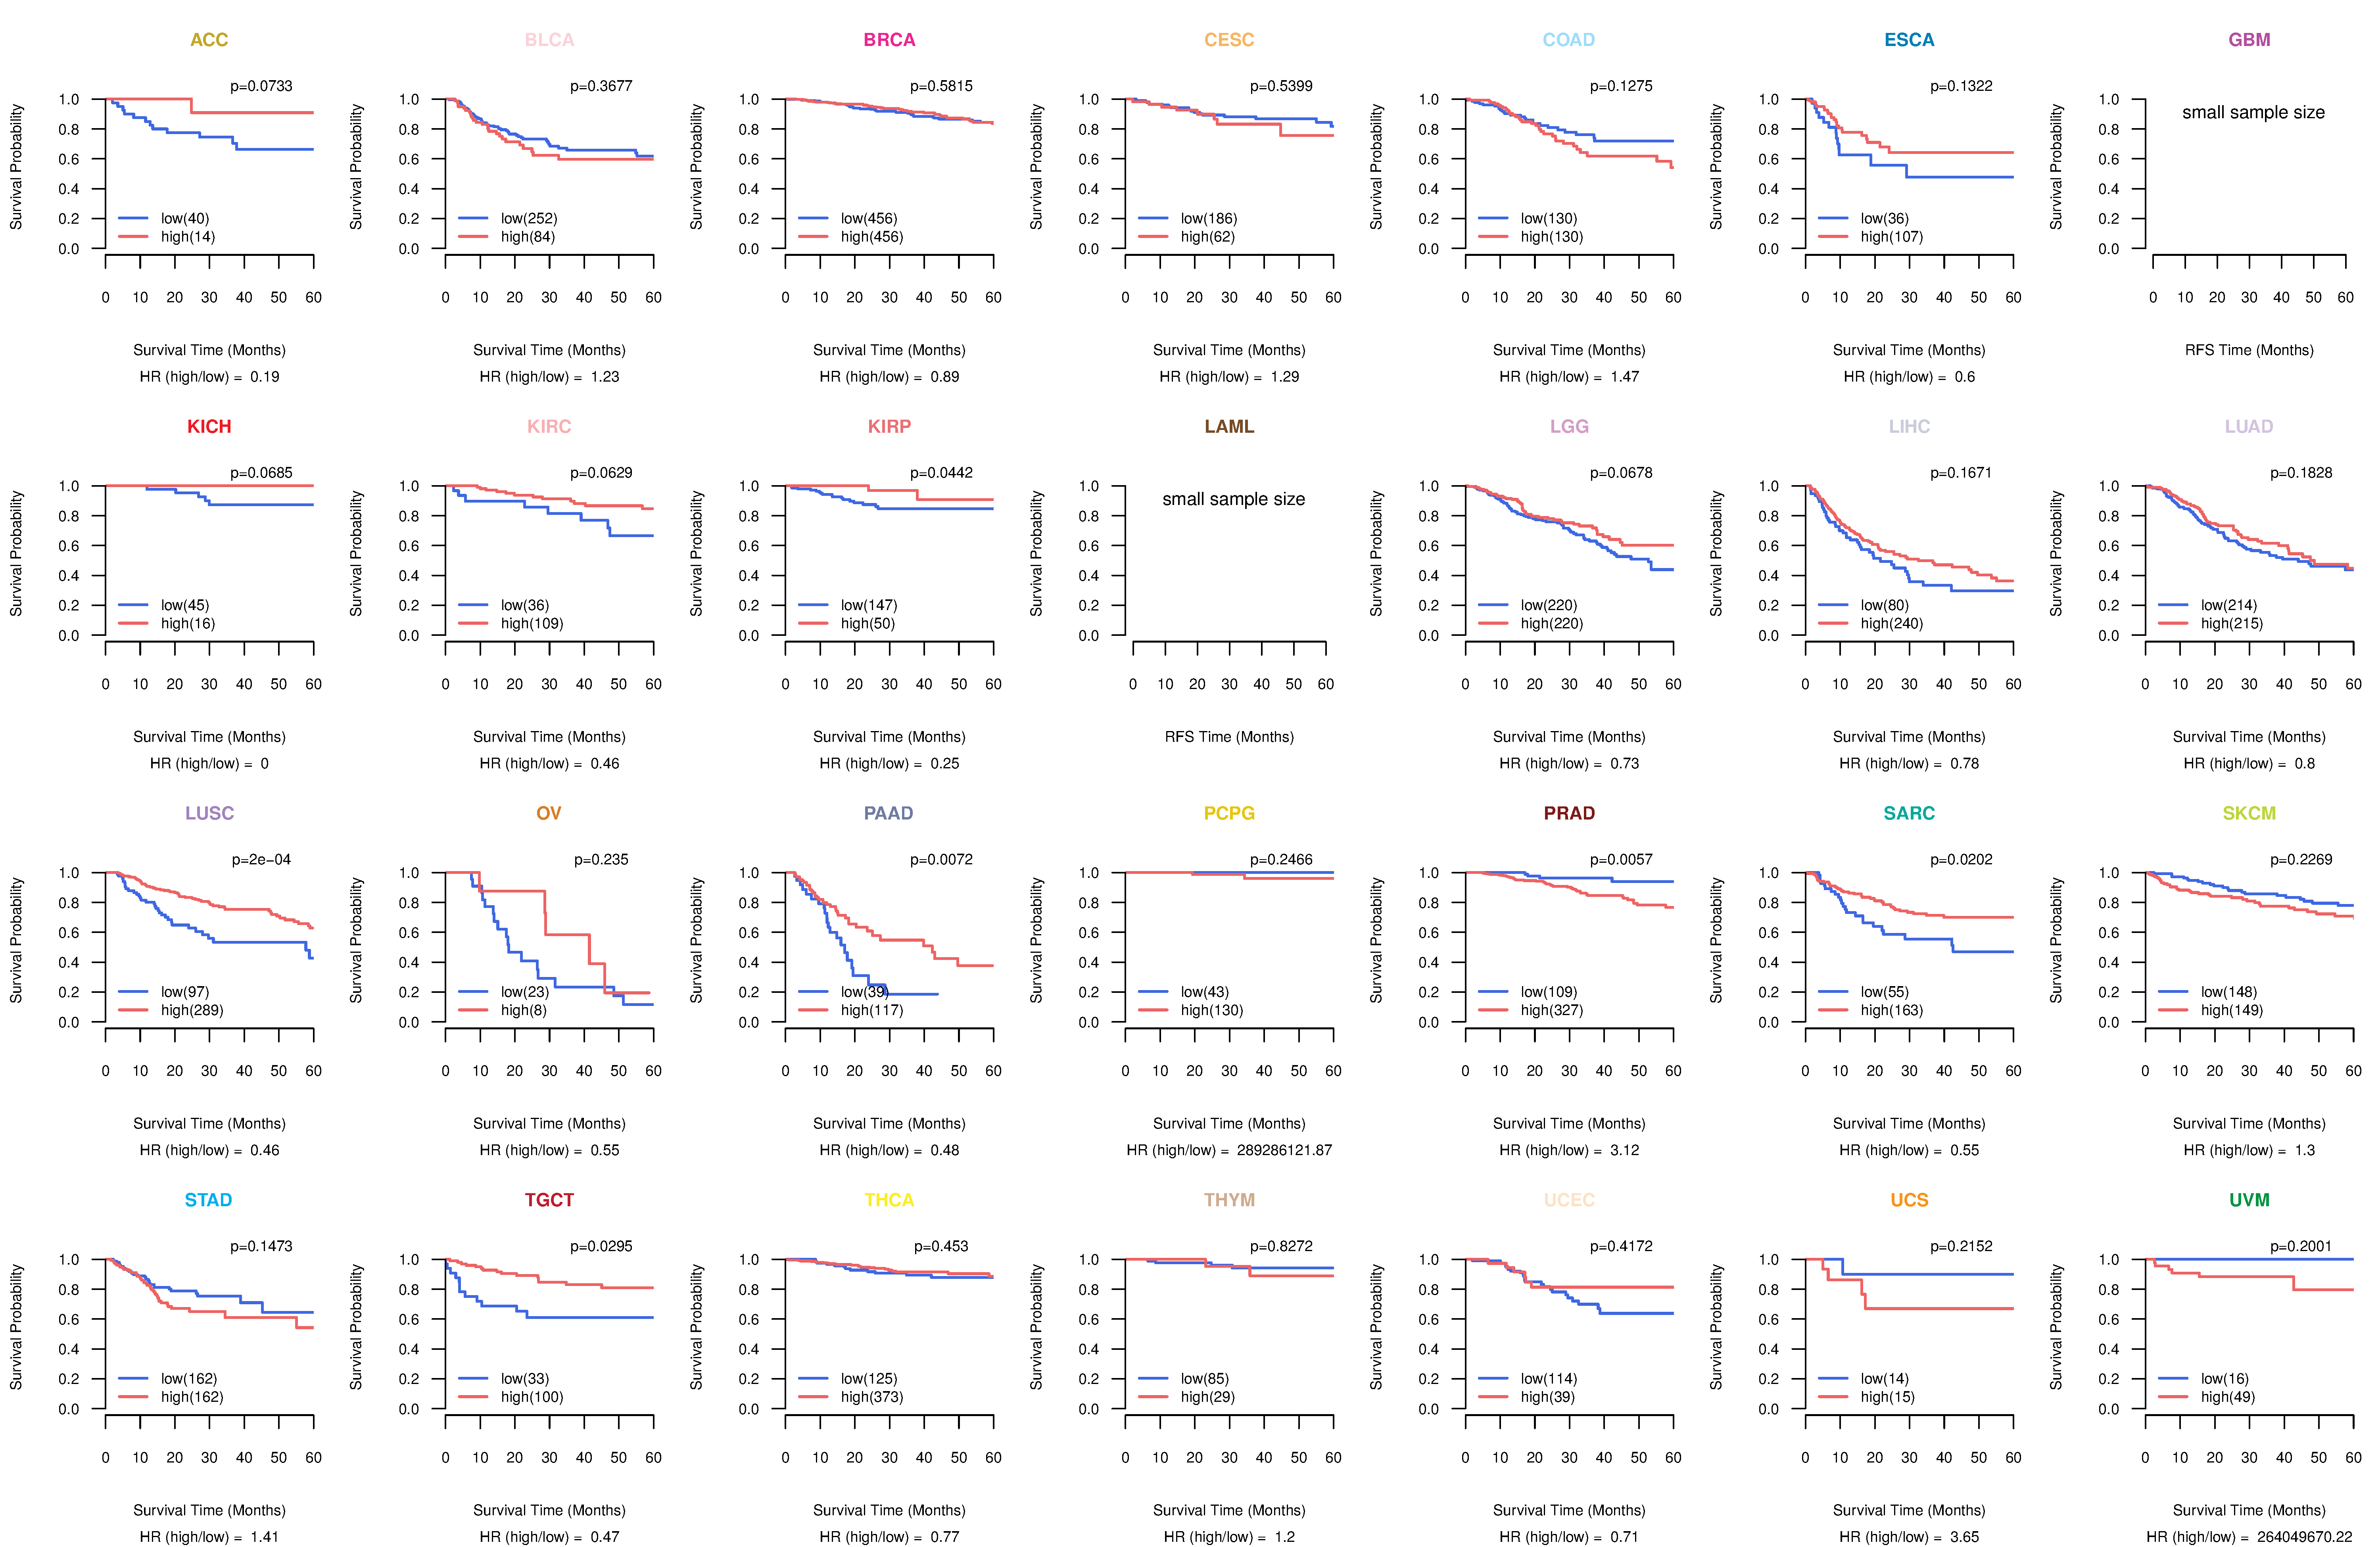
| Kaplan-Meier plots with logrank test of relapse free survival (RFS) using 28 cancer types (TCGA IlluminaHiSeq_RNASeqV2, pan-cancer normalized log2(norm_counts+1) data, version 2016-08-16) (TCGA clinicalMatrix, phenotype data, version 2016-04-27) * Click on the image enlarge it in a new window. |
 |
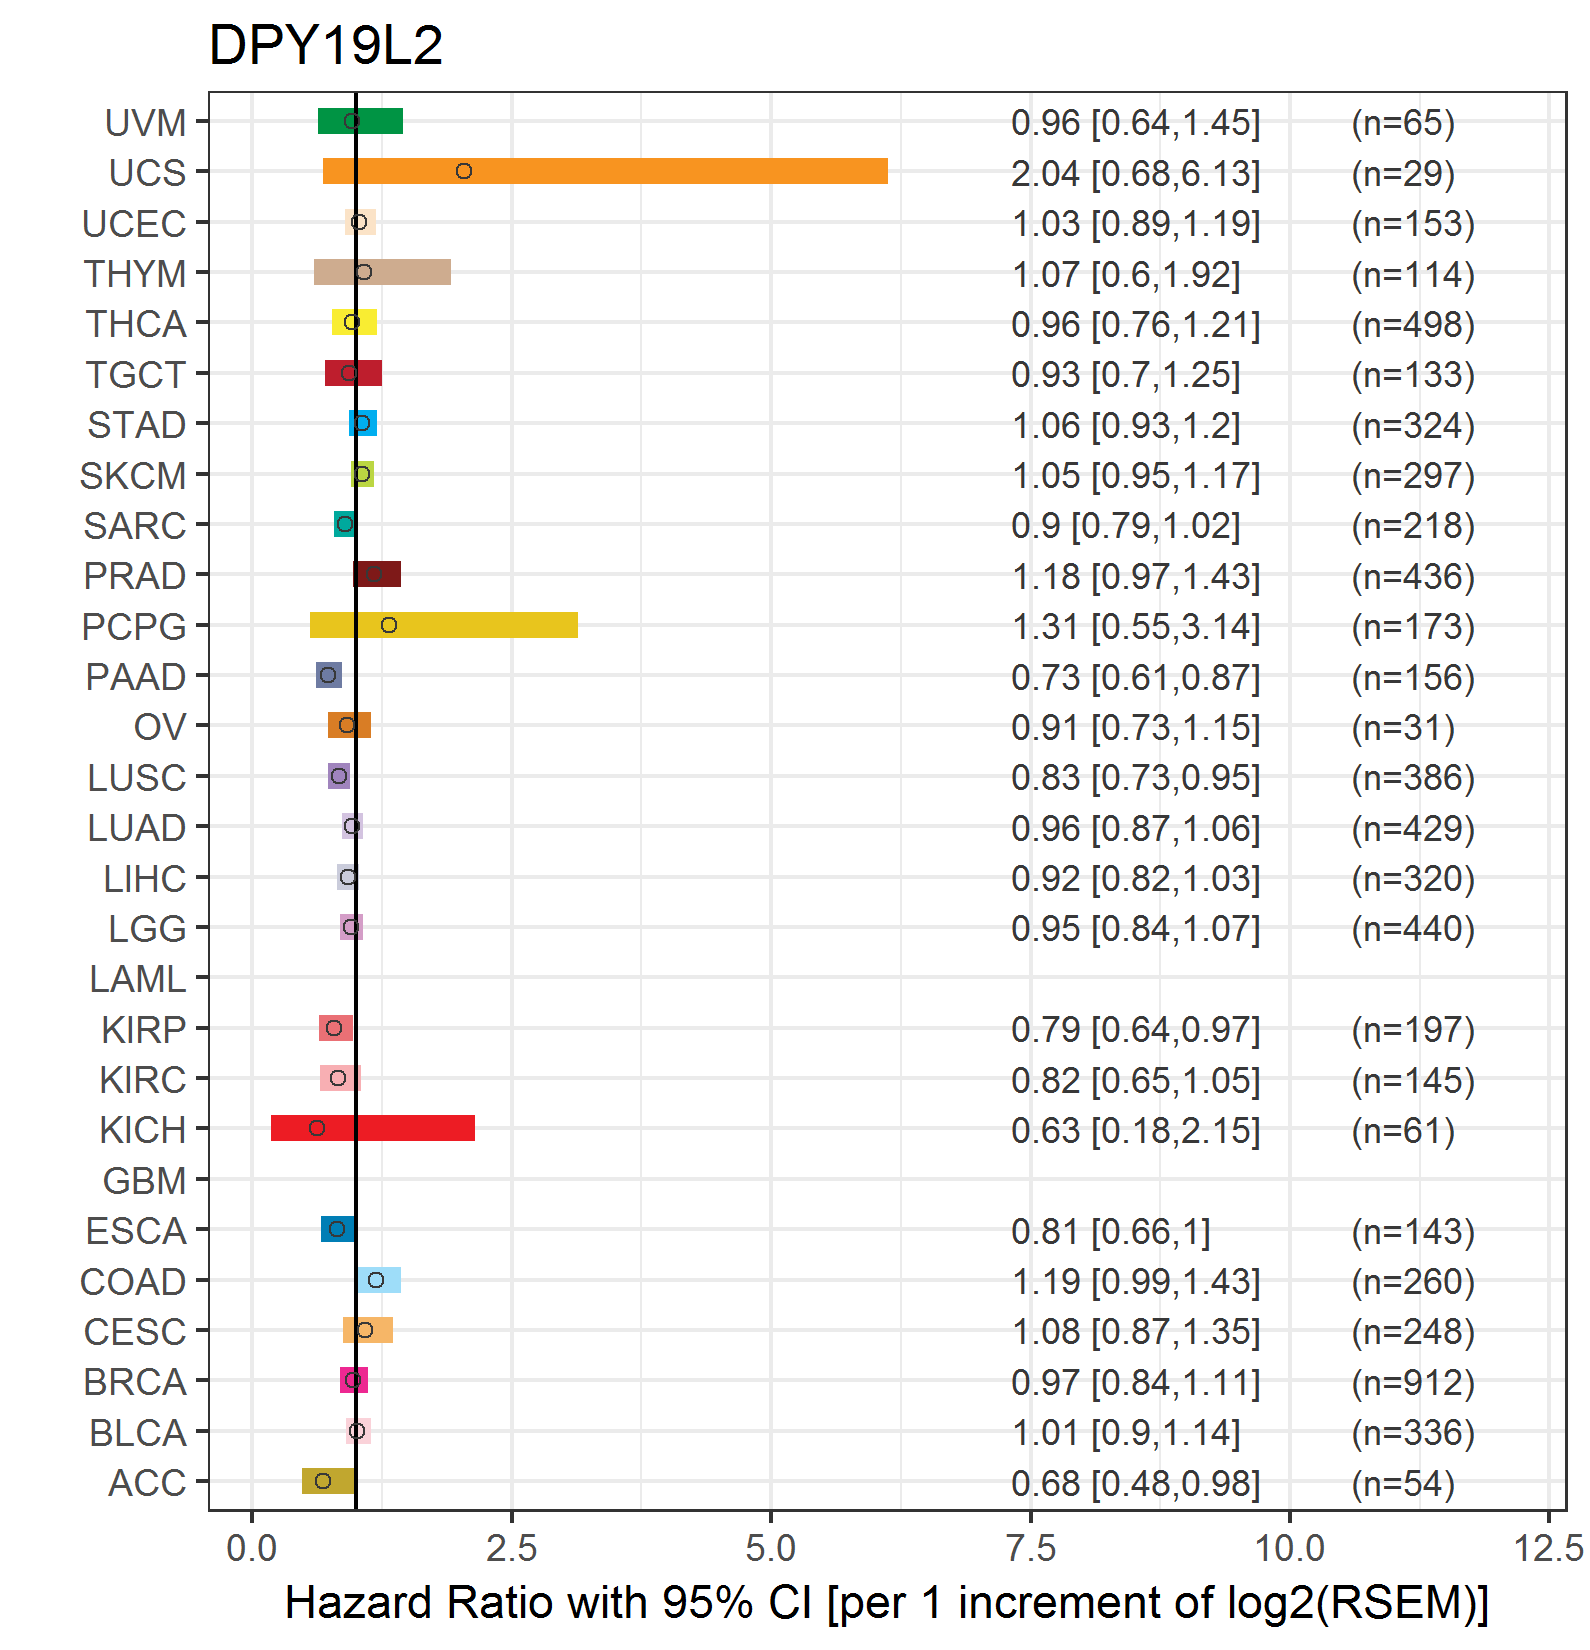
| Forest plot of Cox proportional hazard ratio (HR) and 95% CI of overall survival (OS) using 28 cancer types (TCGA IlluminaHiSeq_RNASeqV2, pan-cancer normalized log2(norm_counts+1) data, version 2016-08-16) (TCGA clinicalMatrix, phenotype data, version 2016-04-27) * Click on the image enlarge it in a new window. |
 |
| Forest plot of Cox proportional hazard ratio (HR) and 95% CI of relapse free survival (RFS) using 28 cancer types (TCGA IlluminaHiSeq_RNASeqV2, pan-cancer normalized log2(norm_counts+1) data, version 2016-08-16) (TCGA clinicalMatrix, phenotype data, version 2016-04-27) * Click on the image enlarge it in a new window. |
 |
| Top |
| TissGeneClin for DPY19L2 |
| TissGeneDrug for DPY19L2 |
| Drug information targeting TissGene (DrugBank Version 5.0.6, 2017-04-01) |
| DrugBank ID | Drug name | Drug activity | Drug type | Drug status |
| Top |
| TissGeneDisease for DPY19L2 |
| Disease information associated with TissGene (DisGeNet, 2016-06-01) |
| Disease ID | Disease name | # pubmeds | Source |
| umls:C0002690 | Amputation Stumps | 1 | BeFree |
| umls:C0021364 | Male infertility | 1 | BeFree |
| umls:C3151407 | SPERMATOGENIC FAILURE 9 | 0 | CLINVAR |
|
Copyright 2016-Present - The University of Texas Health Science Center at Houston (UTHealth) Web File Viewing | How to Report, Fraud, Waste and Abuse | State of Texas | Statewide Search | Texas Homeland Security | Site Policies |