 |
| |
| |
| |
| |
| |
| |
|

| TissGeneSummary for EPHA10 |
 Gene summary Gene summary |
| Basic gene information | Gene symbol | EPHA10 |
| Gene name | EPH receptor A10 | |
| Synonyms | - | |
| Cytomap | UCSC genome browser: 1p34.3 | |
| Type of gene | protein-coding | |
| RefGenes | NM_001004338.2, NM_001099439.1,NM_173641.2, | |
| Description | EphA10s proteinephrin type-A receptor 10 | |
| Modification date | 20141207 | |
| dbXrefs | MIM : 611123 | |
| HGNC : HGNC | ||
| Ensembl : ENSG00000183317 | ||
| HPRD : 08163 | ||
| Vega : OTTHUMG00000004325 | ||
| Protein | UniProt: go to UniProt's Cross Reference DB Table | |
| Expression | CleanEX: HS_EPHA10 | |
| BioGPS: 284656 | ||
| Pathway | NCI Pathway Interaction Database: EPHA10 | |
| KEGG: EPHA10 | ||
| REACTOME: EPHA10 | ||
| Pathway Commons: EPHA10 | ||
| Context | iHOP: EPHA10 | |
| ligand binding site mutation search in PubMed: EPHA10 | ||
| UCL Cancer Institute: EPHA10 | ||
| Assigned class in TissGDB* | C | |
| Included tissue-specific gene expression resources | ||
| Specific-tissues in normal samples (assigned by TissGDB using HPA, TiGER, and GTEx) | Testis | |
| Cancer types related to the specific-tissues in cancer samples (assigned by TissGDB using TCGA) | TGCT | |
| Reference showing the relevant tissue of EPHA10 | ||
| Description by TissGene annotations | Cancer gene | |
| * Class A consists of genes with literature evidence and is part of the cTissGenes. Class B consists of only cTissGenes without additional evidence. The remaining genes belong to Class C. |
| Gene ontology having evidence of Inferred from Direct Assay (IDA) from Entrez |
| GO ID | GO term | PubMed ID | GO:0048013 | ephrin receptor signaling pathway | 15777695 | GO:0048013 | ephrin receptor signaling pathway | 15777695 |
| Top |
| TissGeneExp for EPHA10 |
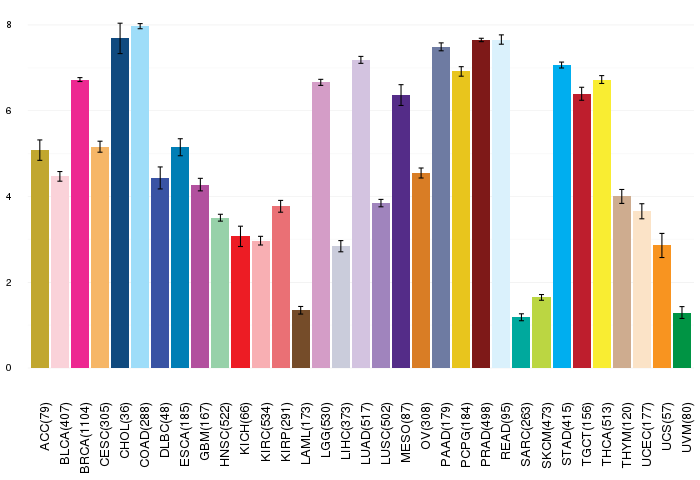
| Gene expressions across 28 cancer types (X-axis: cancer type and Y-axis: log2(norm_counts+1)) (TCGA IlluminaHiSeq_RNASeqV2, pan-cancer normalized log2(norm_counts+1) data, version 2016-08-16) |
 |
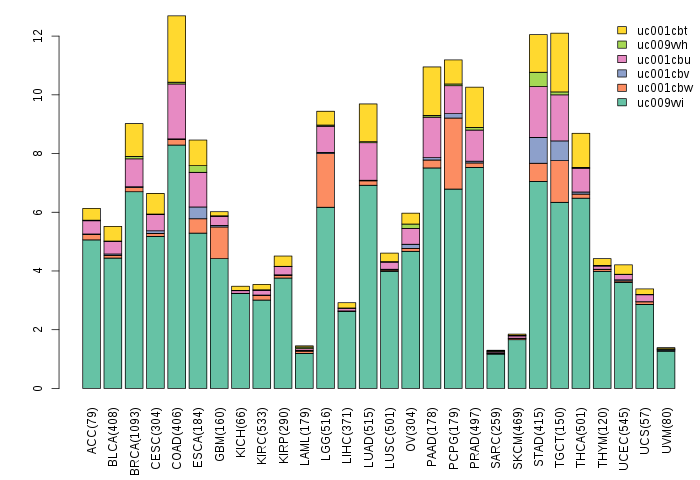
| Gene isoform expressions across 28 cancer types (X-axis: cancer type and Y-axis: log2(norm_counts+1)) (TCGA pan-cancer tcga_rsem_isoform_tpm, version 2016-09-01) |
 |
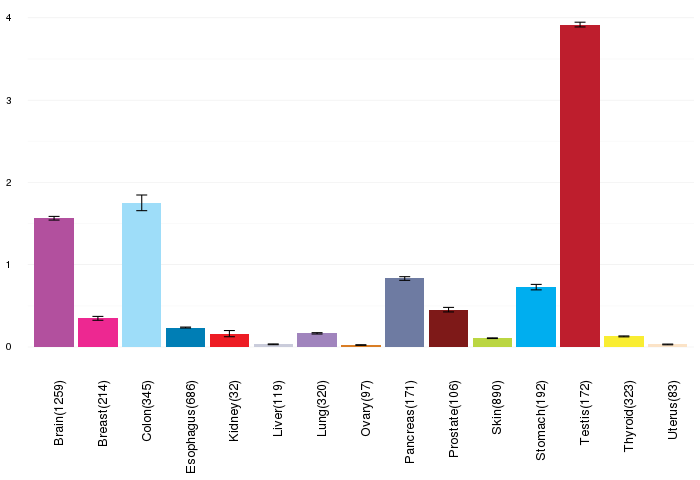
| Gene expressions across normal tissues of GTEx data (GTEx GTEx_Analysis_v6_RNA-seq_RNA-SeQCv1.1.8_gene_rpkm.gct) - Here, we shows the matched tissue types only among our 28 cancer types. |
 |
| Different expressions across 14 cancer types with more than 10 samples between matched tumors and normals (X-axis: cancer type and Y-axis: log2(norm_counts+1)) (TCGA IlluminaHiSeq_RNASeqV2, pan-cancer normalized log2(norm_counts+1) data, version 2016-08-16) |
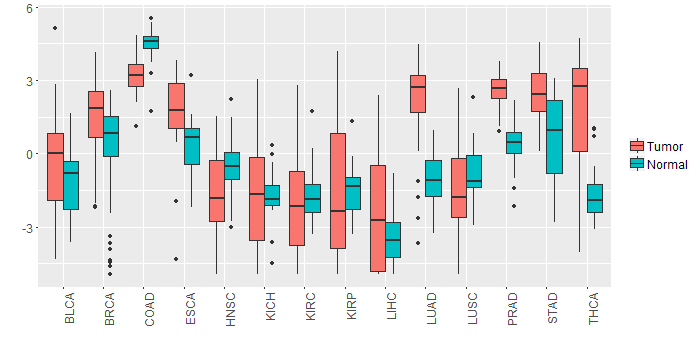 |
| - Significantly differentially expressed cancer types and information. (|Fold change|>1 and FDR<0.05) |
| Cancer type | Mean(exp) in tumor | Mean(exp) in matched normal | Log2FC | P-val. | FDR |
| THCA | 1.808113808 | -1.738418395 | 3.546532203 | 2.66E-19 | 8.41E-18 |
| STAD | 2.480199772 | 0.657015397 | 1.823184375 | 5.38E-06 | 6.80E-05 |
| BRCA | 1.579653446 | 0.267069235 | 1.312584211 | 1.69E-08 | 5.43E-08 |
| COAD | 3.206353378 | 4.45884184 | -1.252488462 | 2.87E-07 | 1.84E-06 |
| PRAD | 2.594414917 | 0.496947609 | 2.097467308 | 1.51E-23 | 1.69E-20 |
| LUAD | 2.250685872 | -1.046979646 | 3.297665517 | 3.28E-24 | 1.27E-22 |
| HNSC | -1.65271469 | -0.553440271 | -1.099274419 | 0.000999 | 0.003359865 |
| LIHC | -2.231521853 | -3.554845853 | 1.323324 | 0.000899 | 0.002489625 |
| Top |
| TissGene-miRNA for EPHA10 |
| Significantly anti-correlated miRNAs of TissGene across 28 cancer types (Gene-miRNA relations from TargetScanHuman Relsease 7.1, Conserved_Site_Context_Scores.txt.zip, 06.01.2016) (TCGA IlluminaHiSeq_miRNASeq, log2(RPM+1) data, version 2016-11-21) (TCGA IlluminaHiSeq_RNASeqV2, log2(normalized_count+1) data, version 2016-08-16) (Spearman’s Rank Correlation (p-value<0.05 and coefficient<-0.25)) |
| Cancer type | miRNA id | miRNA accession | P-val. | Coeff. | # samples |
| Top |
| TissGeneMut for EPHA10 |
| TissGeneSNV for EPHA10 |
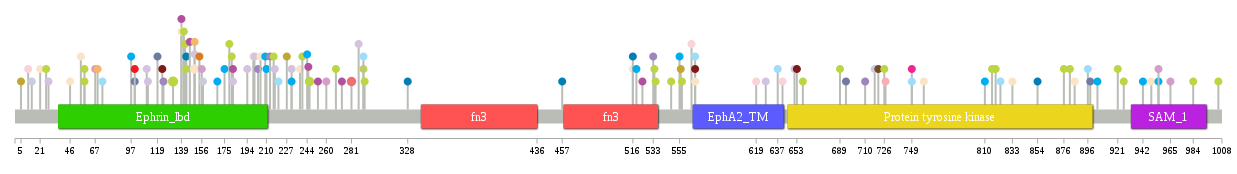
| nsSNV counts per each loci. Different colors of circles represent different cancer types. Circle size denotes number of samples. (TCGA somatic mutation (SNPs and small INDELs) data, version 2016-04-25) * Click on the image to enlarge it in a new window. |
 |
 |
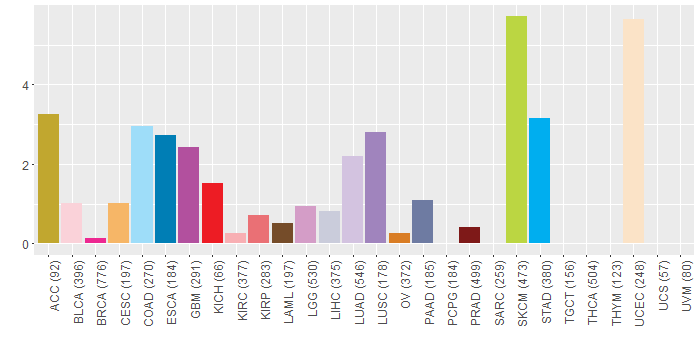
| Somatic nucleotide variants of TissGene across 28 cancer types (X-axis: cancer type and Y-axis: % of mutated samples) The numbers in parentheses are numbers of samples with mutation (nsSNVs). (TCGA somatic mutation (SNPs and small INDELs) data, version 2016-04-25) |
 |
| - nsSNVs sorted by frequency. |
| AAchange | Cancer type | # samples |
| p.E132K | SKCM | 3 |
| p.F281I | KIRP | 2 |
| p.R150H | UCEC | 2 |
| p.G246R | SKCM | 2 |
| p.T718A | LIHC | 1 |
| p.R72C | HNSC | 1 |
| p.A555T | STAD | 1 |
| p.G181R | SKCM | 1 |
| p.L942M | STAD | 1 |
| p.D111Y | LUAD | 1 |
| p.G749E | COAD | 1 |
| p.E245K | GBM | 1 |
| p.A556T | ACC | 1 |
| p.H876R | SKCM | 1 |
| p.G217C | LUAD | 1 |
| p.R11C | BLCA | 1 |
| p.P142L | SKCM | 1 |
| p.E457K | ESCA | 1 |
| p.D328N | ESCA | 1 |
| p.R169C | STAD | 1 |
| p.W58* | SKCM | 1 |
| p.P921L | SKCM | 1 |
| p.V568I | COAD | 1 |
| p.G260S | LGG | 1 |
| p.G833S | UCEC | 1 |
| p.P182L | GBM | 1 |
| p.R216Q | SKCM | 1 |
| p.W28* | LUAD | 1 |
| p.S244L | STAD | 1 |
| p.R100C | KICH | 1 |
| p.E694K | HNSC | 1 |
| p.G146S | GBM | 1 |
| p.D641H | BLCA | 1 |
| p.R141C | SKCM | 1 |
| p.L287F | LUAD | 1 |
| p.A5P | ACC | 1 |
| p.A511V | DLBC | 1 |
| p.S231F | STAD | 1 |
| p.T646M | DLBC | 1 |
| p.R139H | GBM | 1 |
| p.E694D | PAAD | 1 |
| p.H67R | LGG | 1 |
| p.S55I | UCEC | 1 |
| p.R100H | PAAD | 1 |
| p.A119V | PAAD | 1 |
| p.R253C | GBM | 1 |
| p.V904A | STAD | 1 |
| p.S727N | KIRC | 1 |
| p.M726I | SKCM | 1 |
| p.E124K | LUSC | 1 |
| p.I896M | COAD | 1 |
| p.V516I | UCEC | 1 |
| p.R150H | CESC | 1 |
| p.D926N | SKCM | 1 |
| p.S203* | LUSC | 1 |
| p.E710* | LUSC | 1 |
| p.V199M | UCEC | 1 |
| p.E227K | HNSC | 1 |
| p.T154K | OV | 1 |
| p.R150H | LUAD | 1 |
| p.V965M | LGG | 1 |
| p.L689P | SKCM | 1 |
| p.L21I | UCEC | 1 |
| p.V568I | UCEC | 1 |
| p.R110L | LUAD | 1 |
| p.G238R | UCEC | 1 |
| p.G246R | HNSC | 1 |
| p.G535E | SKCM | 1 |
| p.R143S | ESCA | 1 |
| p.T220K | COAD | 1 |
| p.R143S | SKCM | 1 |
| p.G1005E | SKCM | 1 |
| p.R143C | HNSC | 1 |
| p.E548K | SKCM | 1 |
| p.I721V | LAML | 1 |
| p.L651P | LUAD | 1 |
| p.R949H | UCEC | 1 |
| p.A312T | READ | 1 |
| p.D854E | ESCA | 1 |
| p.A156T | LGG | 1 |
| p.R927H | HNSC | 1 |
| p.C240* | SKCM | 1 |
| p.T175I | STAD | 1 |
| p.E739K | HNSC | 1 |
| p.S533Y | LUSC | 1 |
| p.E227D | ACC | 1 |
| p.T73M | COAD | 1 |
| p.R97H | STAD | 1 |
| p.R268C | SKCM | 1 |
| p.A565T | BLCA | 1 |
| p.T619K | BLCA | 1 |
| p.E816K | SKCM | 1 |
| p.W58X | SKCM | 1 |
| p.F281I | READ | 1 |
| p.A955V | LGG | 1 |
| p.R984Q | SKCM | 1 |
| p.R524H | GBM | 1 |
| p.A273V | GBM | 1 |
| p.M968V | DLBC | 1 |
| p.S898I | PAAD | 1 |
| p.K209N | STAD | 1 |
| p.G749E | BRCA | 1 |
| p.K123N | PRAD | 1 |
| p.S231Y | LUAD | 1 |
| p.S534L | SKCM | 1 |
| p.G627V | LUAD | 1 |
| p.A955T | STAD | 1 |
| p.A213D | LUSC | 1 |
| p.S557L | SKCM | 1 |
| p.D194Y | LUAD | 1 |
| p.E179K | SKCM | 1 |
| p.D881N | SKCM | 1 |
| p.P182S | LUAD | 1 |
| p.L519P | STAD | 1 |
| p.R69H | CESC | 1 |
| p.Q528E | HNSC | 1 |
| p.A637T | COAD | 1 |
| p.L14H | LIHC | 1 |
| p.V195M | HNSC | 1 |
| p.Q210P | STAD | 1 |
| p.V568A | PRAD | 1 |
| p.K759T | UCEC | 1 |
| p.E658K | SKCM | 1 |
| p.K291N | COAD | 1 |
| p.A810V | STAD | 1 |
| p.K885N | UCEC | 1 |
| p.V516I | ESCA | 1 |
| p.A46V | UCEC | 1 |
| p.E66Q | HNSC | 1 |
| p.A200V | LUAD | 1 |
| p.G26E | SKCM | 1 |
| p.A157V | LIHC | 1 |
| p.G292W | SKCM | 1 |
| p.G653* | PRAD | 1 |
| p.Q819* | SKCM | 1 |
| p.R139H | UCEC | 1 |
| p.R291C | SKCM | 1 |
| p.R205H | UCEC | 1 |
| p.F823Y | COAD | 1 |
| Top |
| TissGeneCNV for EPHA10 |
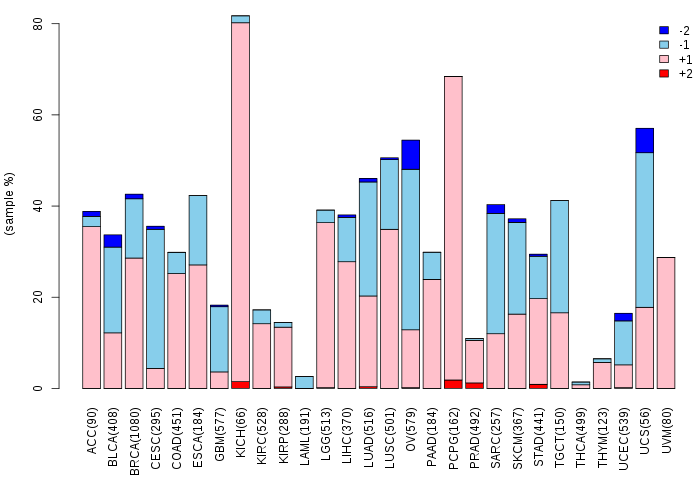
| Copy number variations of TissGene across 28 cancer types (X-axis: cancer type and Y-axis: % of CNV samples) (TCGA Gistic2_CopyNumber_Gistic2_all_data_by_genes, Gistic2 copy number data, version 2016-08-16) |
 |
| Top |
| TissGeneFusions for EPHA10 |
| Fusion genes including TissGene (ChimerDB 3.0, 2016-12-01 and TCGA fusion Portal 2015-12-01) |
| Database | Src | Cancer type | Sample | Fusion gene | ORF | 5'-gene BP | 3'-gene BP |
| Chimerdb3.0 | ChiTaRs | NA | BQ344001 | EPHA10-KRT7 | chr1:38222276 | chr12:52636869 | |
| TCGAfusionPortal | PRADA | LUAD | TCGA-J2-A4AD-01A | EPHA10-COL8A2 | CDS-5UTR | Chr1:38192774 | Chr1:36581353 |
| Top |
| TissGeneNet for EPHA10 |
| Co-expressed gene networks based on protein-protein interaction data (CePIN) (TCGA IlluminaHiSeq_RNASeqV2, pan-cancer normalized log2(norm_counts+1) data, version 2016-08-16) (PINA2 ppi data) |
| Top |
| TissGeneProg for EPHA10 |
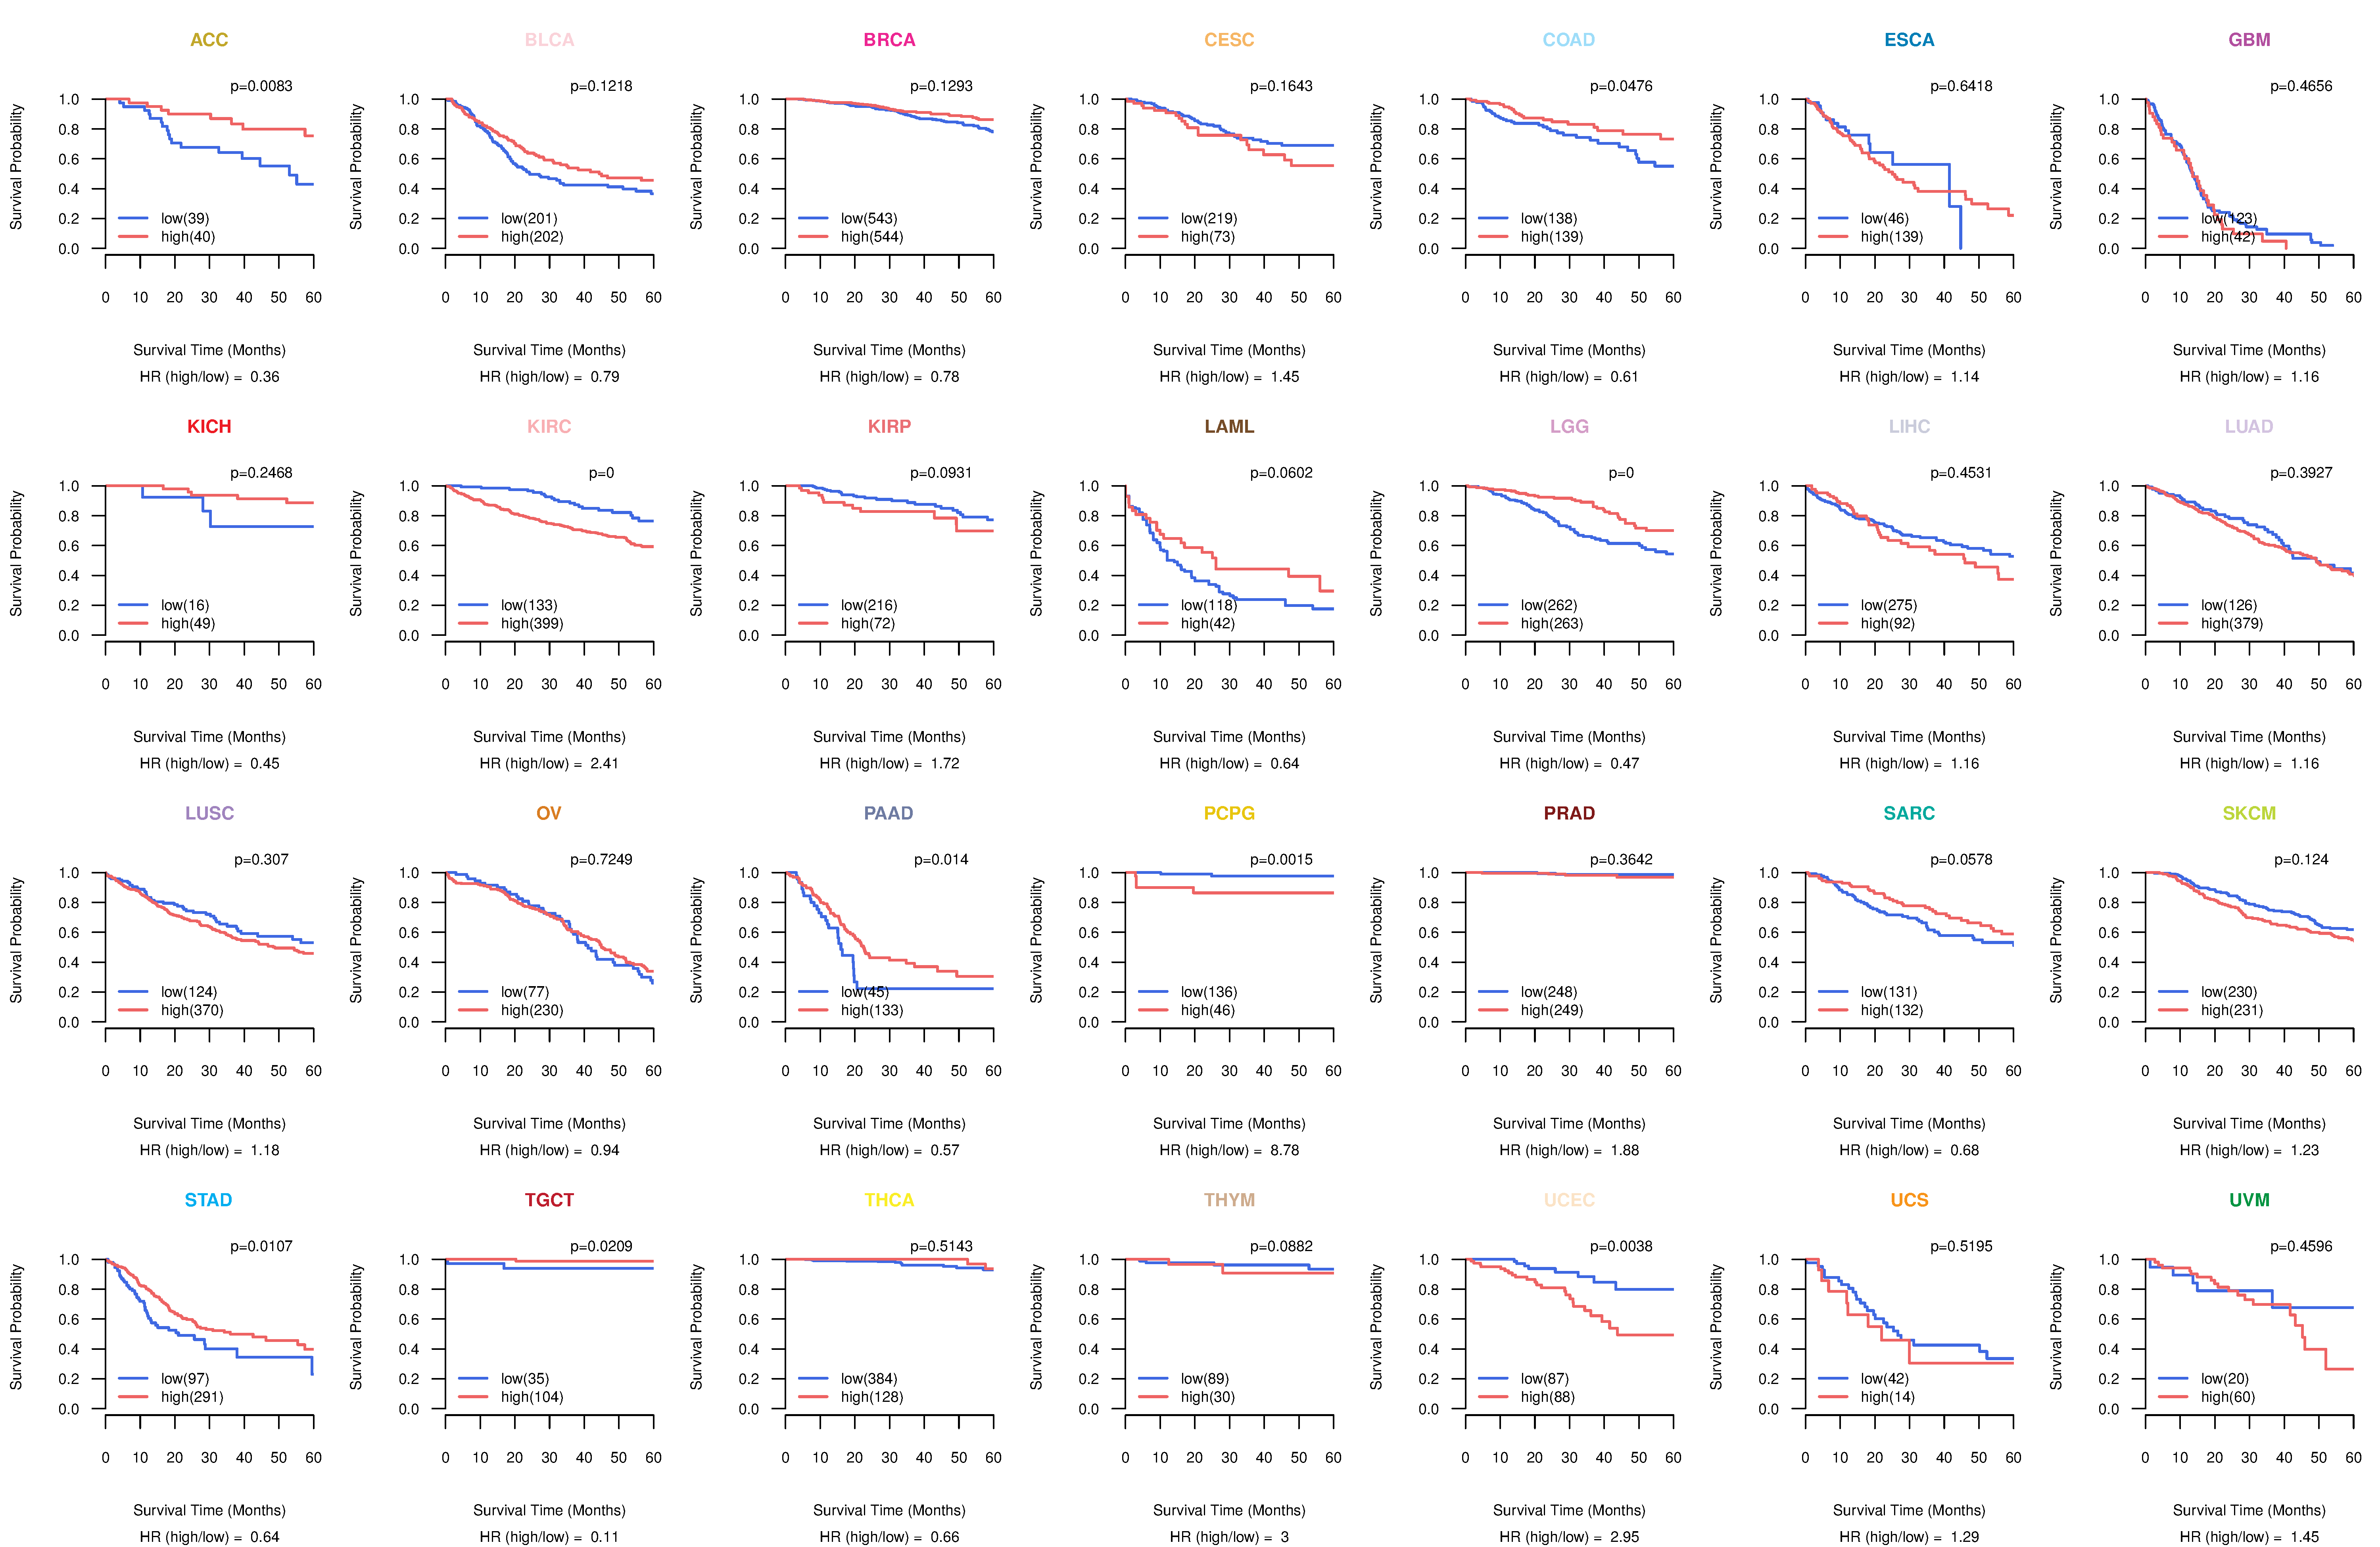
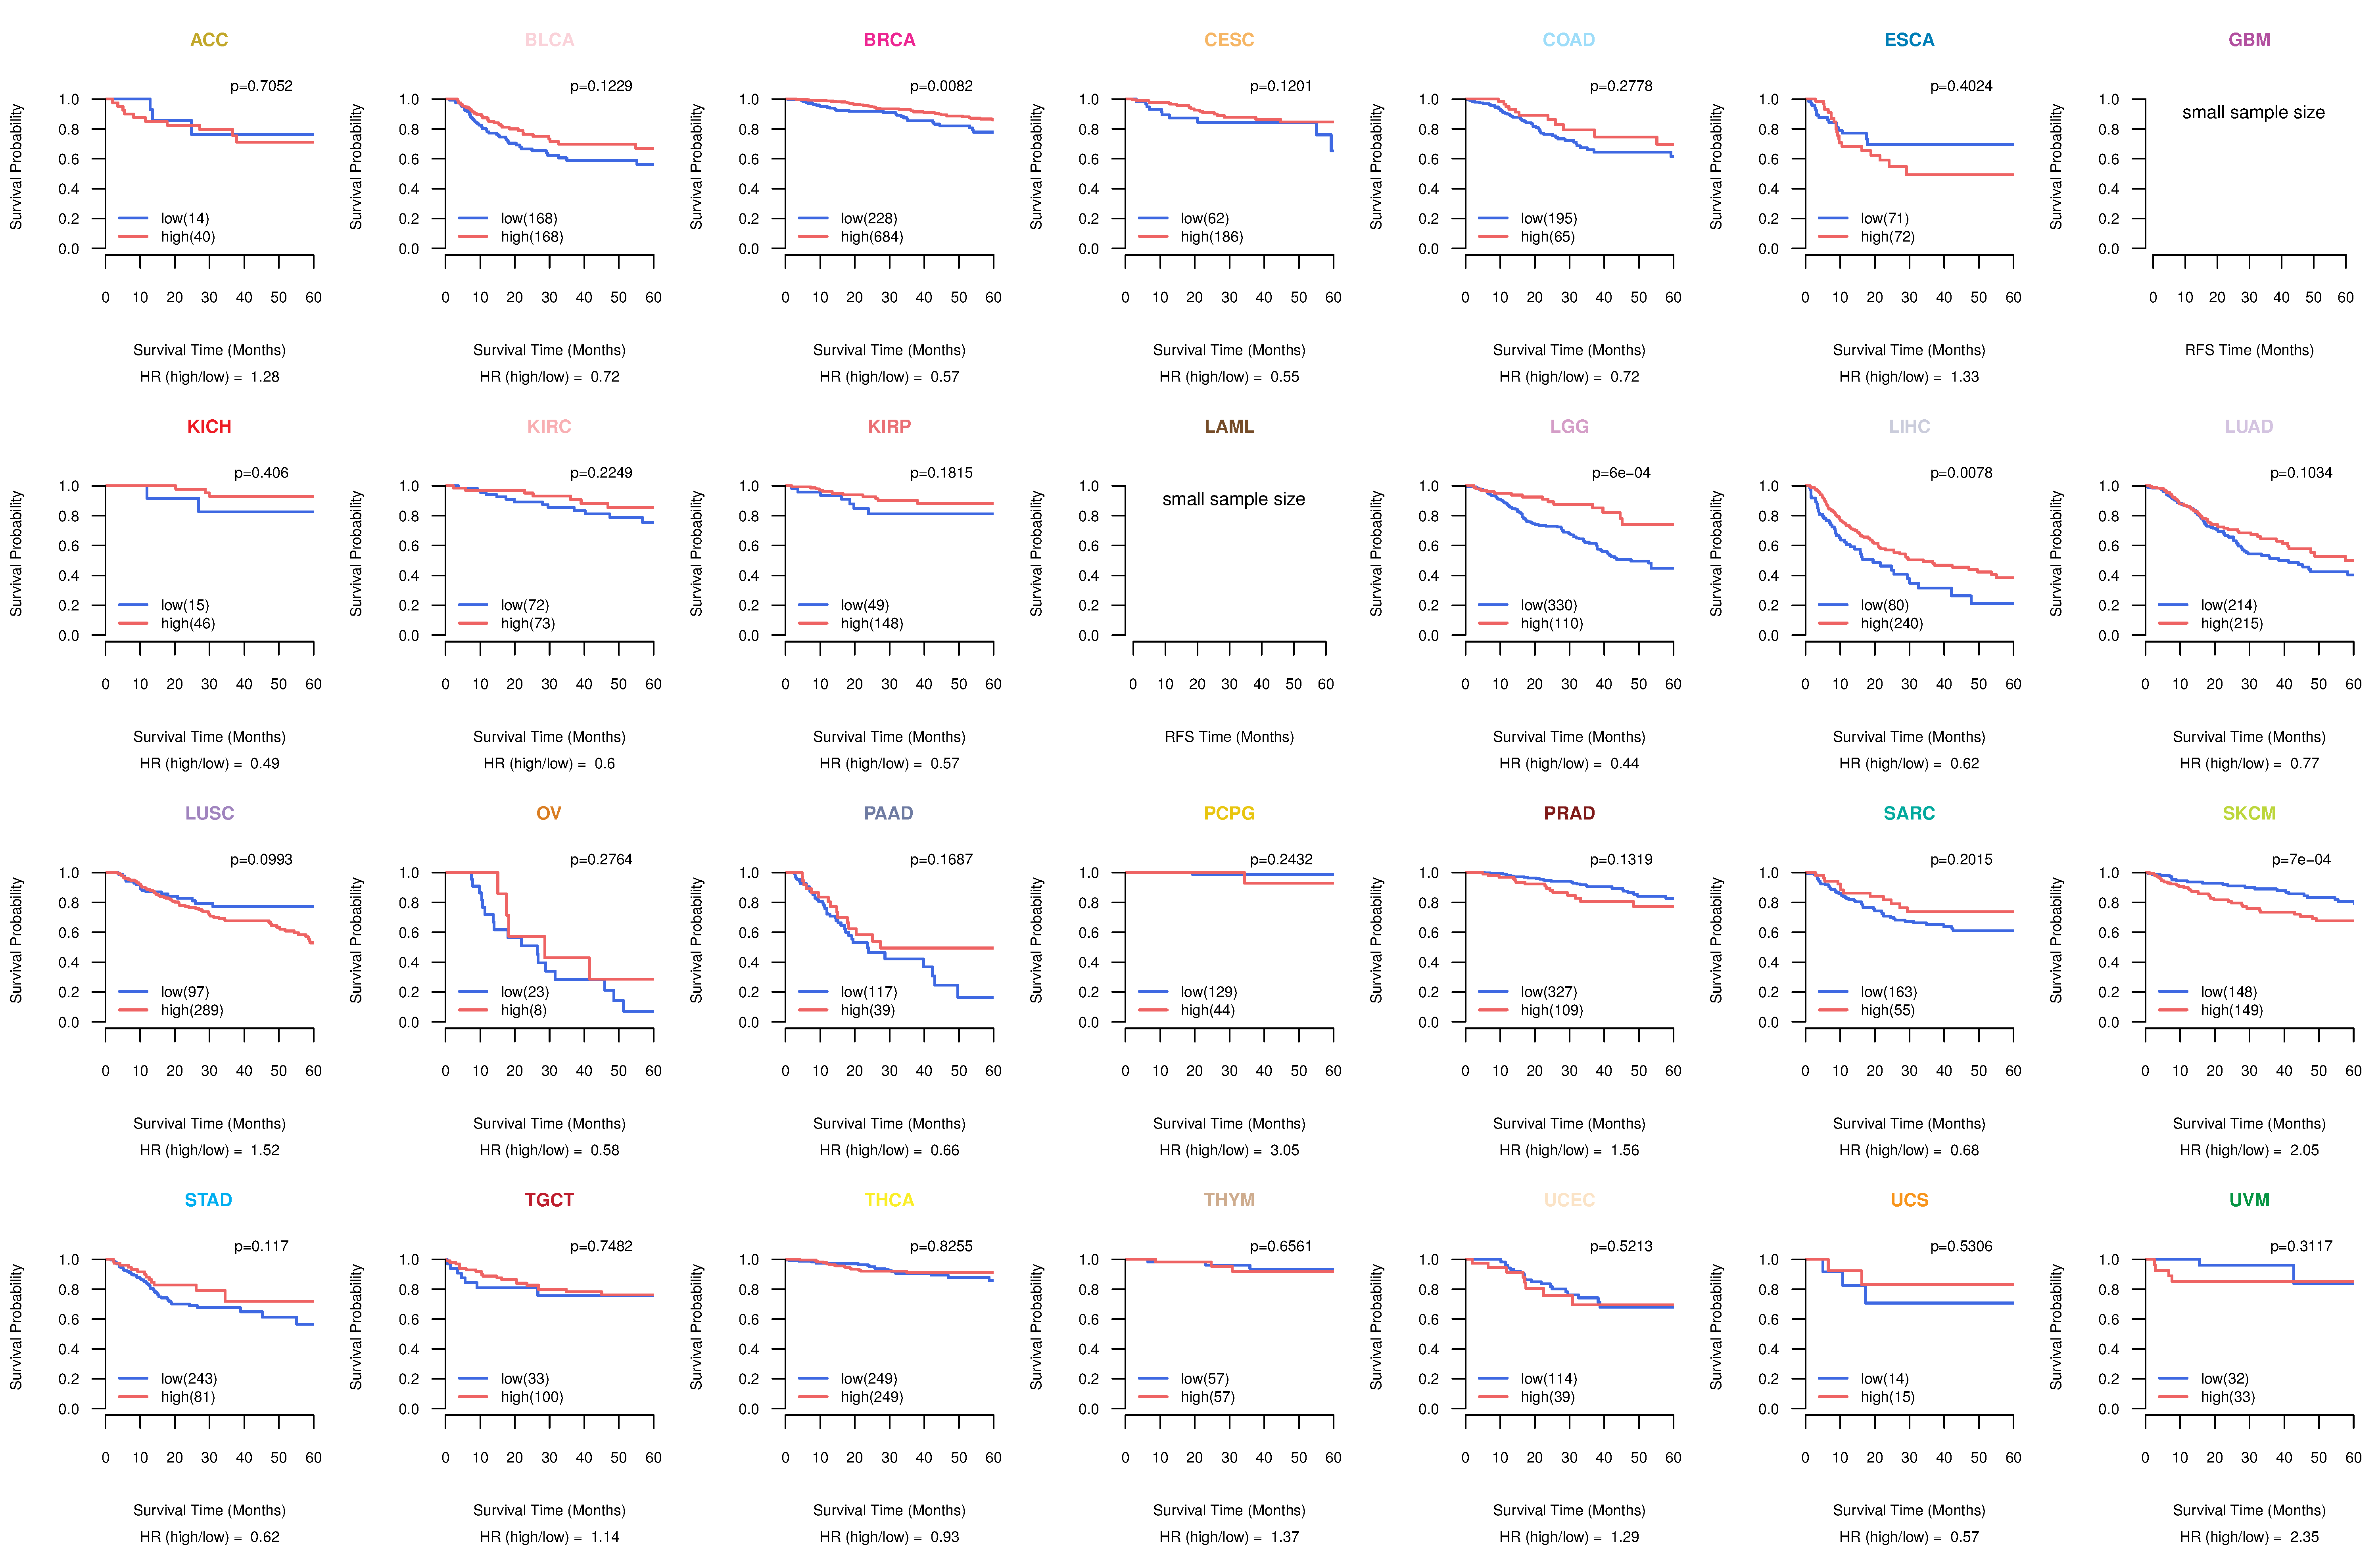
| Kaplan-Meier plots with logrank tests of overall survival (OS) using 28 cancer types (TCGA IlluminaHiSeq_RNASeqV2, pan-cancer normalized log2(norm_counts+1) data, version 2016-08-16) (TCGA clinicalMatrix, phenotype data, version 2016-04-27) * Click on the image to enlarge it in a new window. |
 |
| Kaplan-Meier plots with logrank test of relapse free survival (RFS) using 28 cancer types (TCGA IlluminaHiSeq_RNASeqV2, pan-cancer normalized log2(norm_counts+1) data, version 2016-08-16) (TCGA clinicalMatrix, phenotype data, version 2016-04-27) * Click on the image enlarge it in a new window. |
 |
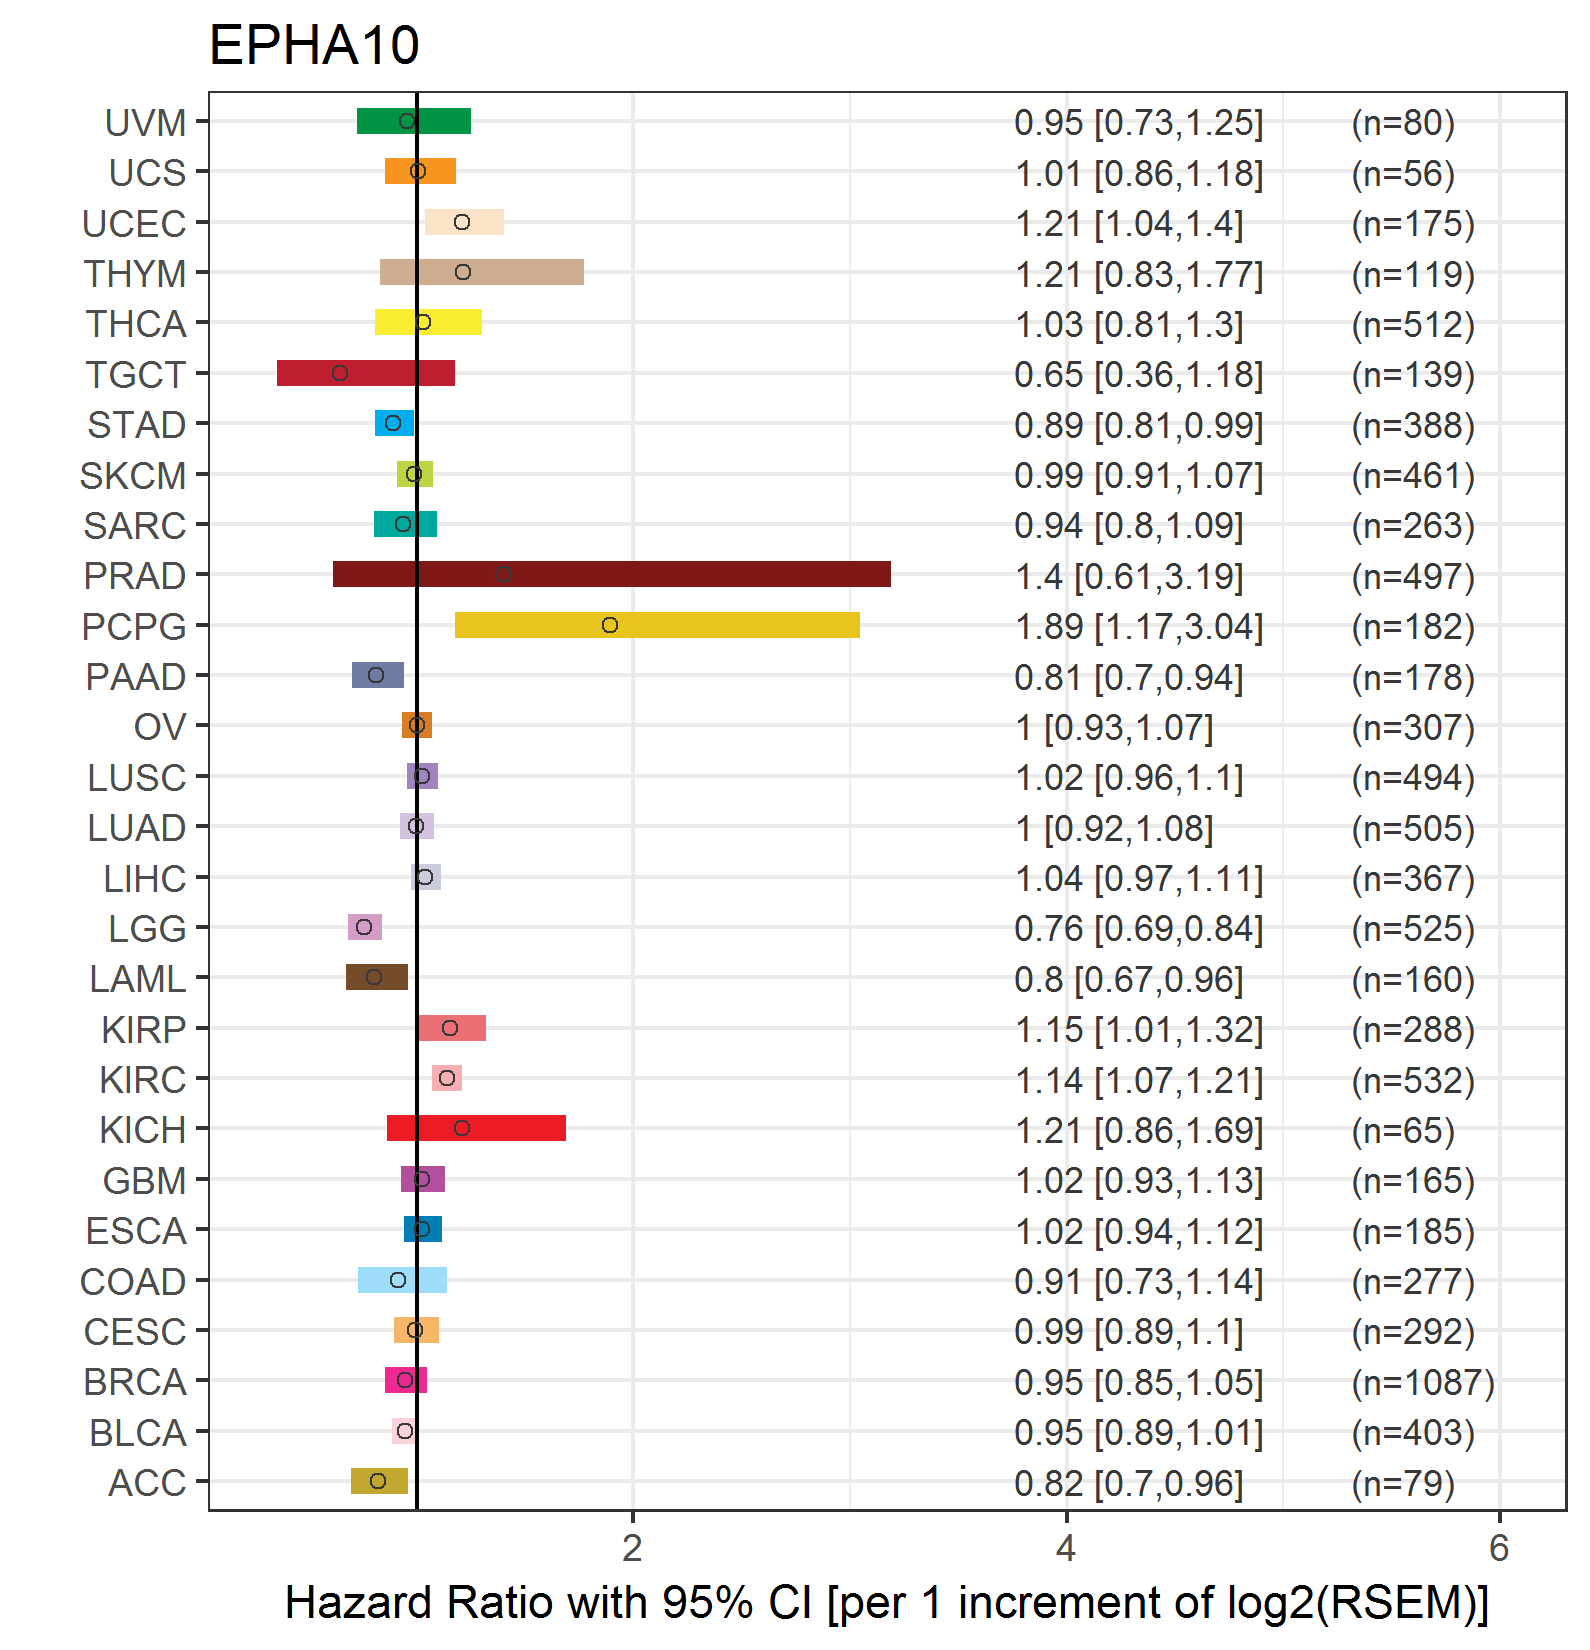
| Forest plot of Cox proportional hazard ratio (HR) and 95% CI of overall survival (OS) using 28 cancer types (TCGA IlluminaHiSeq_RNASeqV2, pan-cancer normalized log2(norm_counts+1) data, version 2016-08-16) (TCGA clinicalMatrix, phenotype data, version 2016-04-27) * Click on the image enlarge it in a new window. |
 |
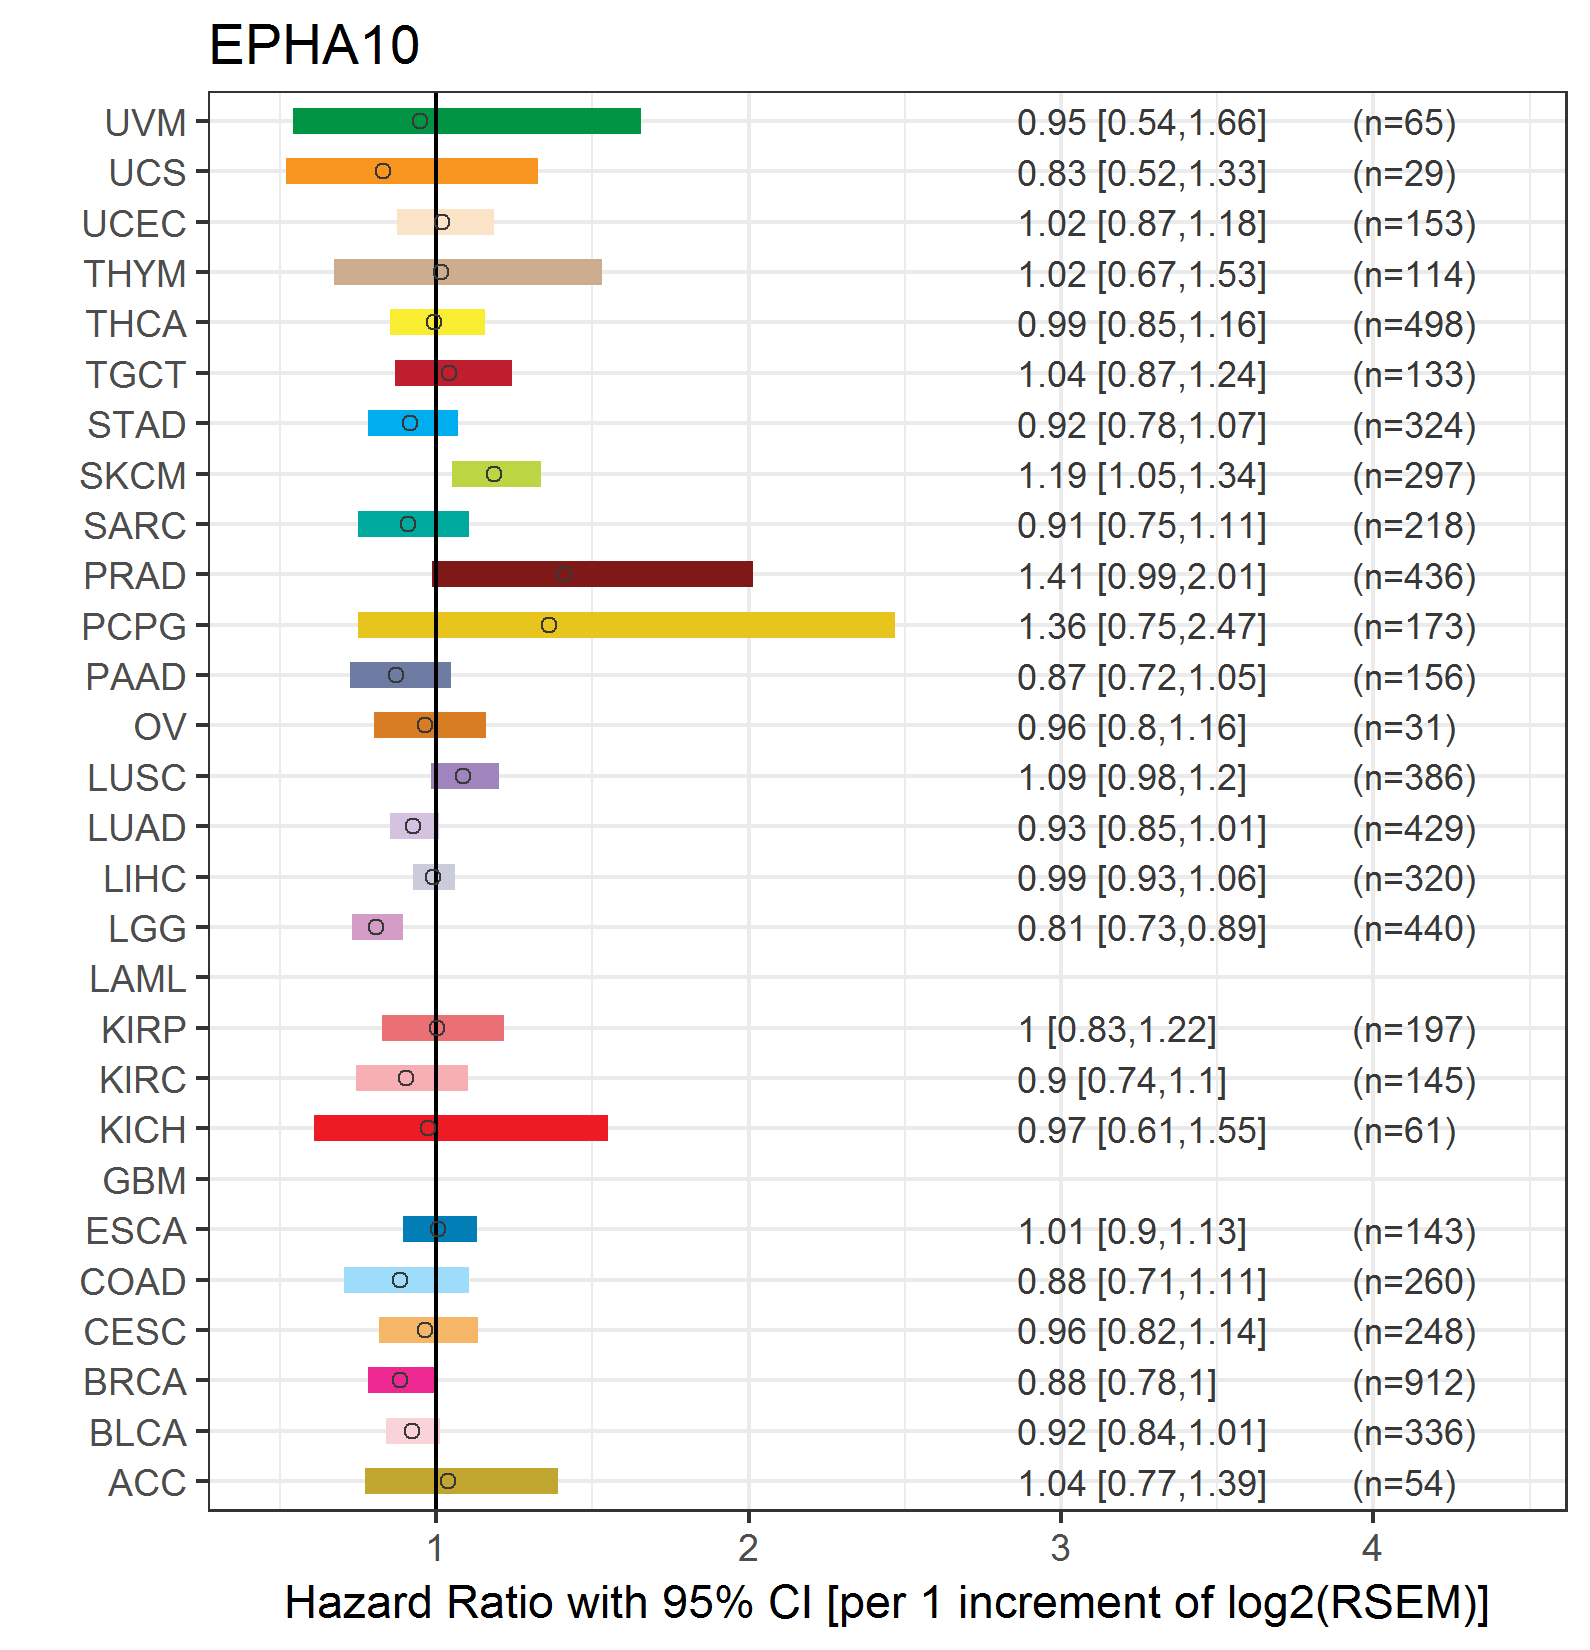
| Forest plot of Cox proportional hazard ratio (HR) and 95% CI of relapse free survival (RFS) using 28 cancer types (TCGA IlluminaHiSeq_RNASeqV2, pan-cancer normalized log2(norm_counts+1) data, version 2016-08-16) (TCGA clinicalMatrix, phenotype data, version 2016-04-27) * Click on the image enlarge it in a new window. |
 |
| Top |
| TissGeneClin for EPHA10 |
| TissGeneDrug for EPHA10 |
| Drug information targeting TissGene (DrugBank Version 5.0.6, 2017-04-01) |
| DrugBank ID | Drug name | Drug activity | Drug type | Drug status |
| Top |
| TissGeneDisease for EPHA10 |
| Disease information associated with TissGene (DisGeNet, 2016-06-01) |
| Disease ID | Disease name | # pubmeds | Source |
| umls:C0006142 | Malignant neoplasm of breast | 2 | BeFree |
| umls:C0678222 | Breast Carcinoma | 2 | BeFree |
| umls:C0023434 | Chronic Lymphocytic Leukemia | 1 | BeFree |
| umls:C0033578 | Prostatic Neoplasms | 1 | GAD |
| umls:C3539878 | Triple Negative Breast Neoplasms | 1 | BeFree |
|
Copyright 2016-Present - The University of Texas Health Science Center at Houston (UTHealth) Web File Viewing | How to Report, Fraud, Waste and Abuse | State of Texas | Statewide Search | Texas Homeland Security | Site Policies |