 |
| |
| |
| |
| |
| |
| |
|

| TissGeneSummary for MCHR1 |
 Gene summary Gene summary |
| Basic gene information | Gene symbol | MCHR1 |
| Gene name | melanin-concentrating hormone receptor 1 | |
| Synonyms | GPR24|MCH-1R|MCH1R|SLC-1|SLC1 | |
| Cytomap | UCSC genome browser: 22q13.2 | |
| Type of gene | protein-coding | |
| RefGenes | NM_005297.3, | |
| Description | G protein-coupled receptor 24MCH receptor 1somatostatin receptor-like protein | |
| Modification date | 20141207 | |
| dbXrefs | MIM : 601751 | |
| HGNC : HGNC | ||
| Ensembl : ENSG00000128285 | ||
| HPRD : 11874 | ||
| Vega : OTTHUMG00000150256 | ||
| Protein | UniProt: go to UniProt's Cross Reference DB Table | |
| Expression | CleanEX: HS_MCHR1 | |
| BioGPS: 2847 | ||
| Pathway | NCI Pathway Interaction Database: MCHR1 | |
| KEGG: MCHR1 | ||
| REACTOME: MCHR1 | ||
| Pathway Commons: MCHR1 | ||
| Context | iHOP: MCHR1 | |
| ligand binding site mutation search in PubMed: MCHR1 | ||
| UCL Cancer Institute: MCHR1 | ||
| Assigned class in TissGDB* | C | |
| Included tissue-specific gene expression resources | TiGER,GTEx | |
| Specific-tissues in normal samples (assigned by TissGDB using HPA, TiGER, and GTEx) | BrainUterus | |
| Cancer types related to the specific-tissues in cancer samples (assigned by TissGDB using TCGA) | GBM,LGGUCEC,UCS | |
| Reference showing the relevant tissue of MCHR1 | ||
| Description by TissGene annotations | ||
| * Class A consists of genes with literature evidence and is part of the cTissGenes. Class B consists of only cTissGenes without additional evidence. The remaining genes belong to Class C. |
| Gene ontology having evidence of Inferred from Direct Assay (IDA) from Entrez |
| GO ID | GO term | PubMed ID |
| Top |
| TissGeneExp for MCHR1 |
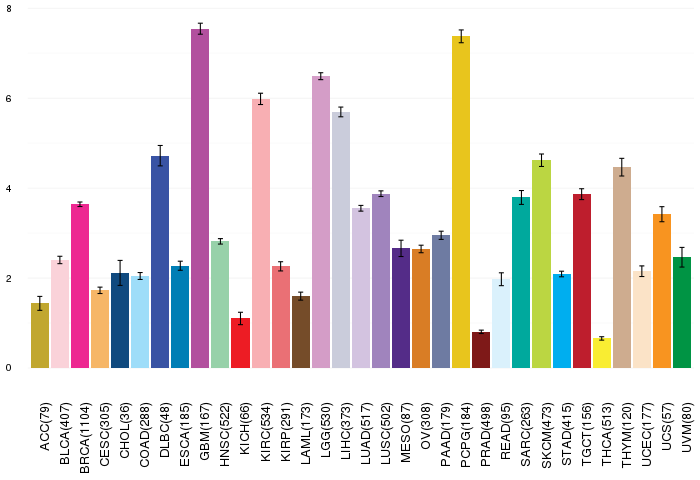
| Gene expressions across 28 cancer types (X-axis: cancer type and Y-axis: log2(norm_counts+1)) (TCGA IlluminaHiSeq_RNASeqV2, pan-cancer normalized log2(norm_counts+1) data, version 2016-08-16) |
 |
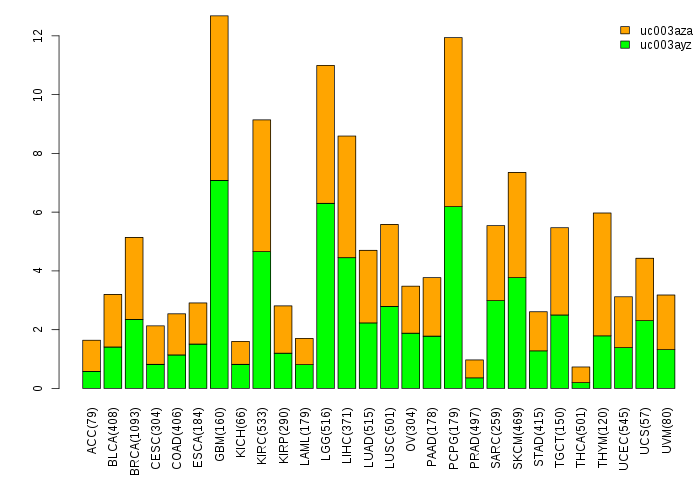
| Gene isoform expressions across 28 cancer types (X-axis: cancer type and Y-axis: log2(norm_counts+1)) (TCGA pan-cancer tcga_rsem_isoform_tpm, version 2016-09-01) |
 |
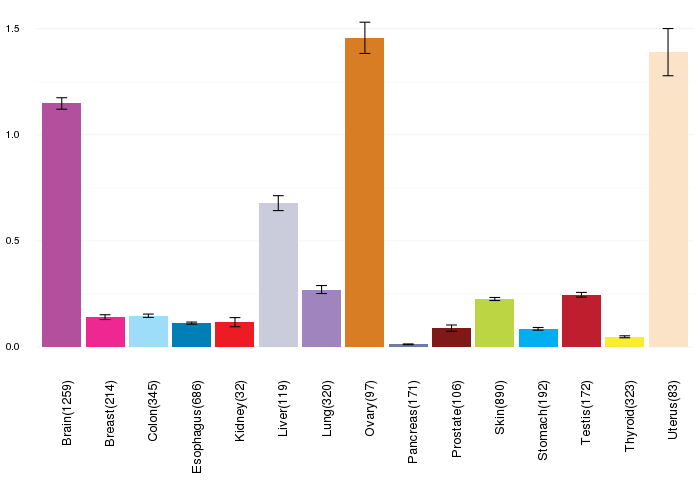
| Gene expressions across normal tissues of GTEx data (GTEx GTEx_Analysis_v6_RNA-seq_RNA-SeQCv1.1.8_gene_rpkm.gct) - Here, we shows the matched tissue types only among our 28 cancer types. |
 |
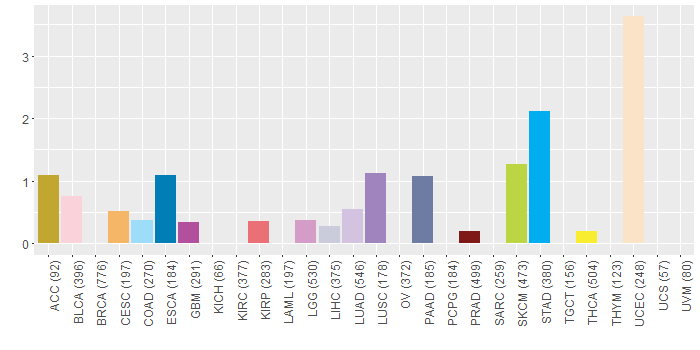
| Different expressions across 14 cancer types with more than 10 samples between matched tumors and normals (X-axis: cancer type and Y-axis: log2(norm_counts+1)) (TCGA IlluminaHiSeq_RNASeqV2, pan-cancer normalized log2(norm_counts+1) data, version 2016-08-16) |
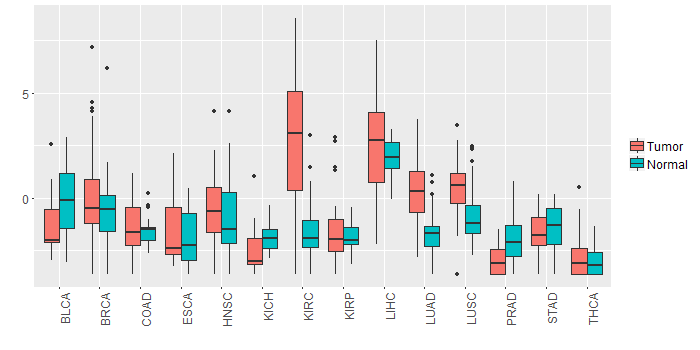 |
| - Significantly differentially expressed cancer types and information. (|Fold change|>1 and FDR<0.05) |
| Cancer type | Mean(exp) in tumor | Mean(exp) in matched normal | Log2FC | P-val. | FDR |
| LUAD | 0.265934192 | -1.694619256 | 1.960553448 | 6.38E-13 | 5.09E-12 |
| KIRC | 2.777186683 | -1.689332762 | 4.466519444 | 4.21E-22 | 3.85E-21 |
| LUSC | 0.51137067 | -0.87612737 | 1.387498039 | 7.49E-07 | 1.91E-06 |
| Top |
| TissGene-miRNA for MCHR1 |
| Significantly anti-correlated miRNAs of TissGene across 28 cancer types (Gene-miRNA relations from TargetScanHuman Relsease 7.1, Conserved_Site_Context_Scores.txt.zip, 06.01.2016) (TCGA IlluminaHiSeq_miRNASeq, log2(RPM+1) data, version 2016-11-21) (TCGA IlluminaHiSeq_RNASeqV2, log2(normalized_count+1) data, version 2016-08-16) (Spearman’s Rank Correlation (p-value<0.05 and coefficient<-0.25)) |
| Cancer type | miRNA id | miRNA accession | P-val. | Coeff. | # samples |
| Top |
| TissGeneMut for MCHR1 |
| TissGeneSNV for MCHR1 |
| nsSNV counts per each loci. Different colors of circles represent different cancer types. Circle size denotes number of samples. (TCGA somatic mutation (SNPs and small INDELs) data, version 2016-04-25) * Click on the image to enlarge it in a new window. |
 |
 |
| Somatic nucleotide variants of TissGene across 28 cancer types (X-axis: cancer type and Y-axis: % of mutated samples) The numbers in parentheses are numbers of samples with mutation (nsSNVs). (TCGA somatic mutation (SNPs and small INDELs) data, version 2016-04-25) |
 |
| - nsSNVs sorted by frequency. |
| AAchange | Cancer type | # samples |
| p.S306F | LUSC | 2 |
| p.K7N | UCEC | 2 |
| p.Y362H | BLCA | 1 |
| p.P289T | BLCA | 1 |
| p.L391F | BLCA | 1 |
| p.F180L | SKCM | 1 |
| p.R388H | GBM | 1 |
| p.T25A | ACC | 1 |
| p.T305M | LGG | 1 |
| p.W237C | LUAD | 1 |
| p.M191V | LUAD | 1 |
| p.Q402X | ESCA | 1 |
| p.Q40X | READ | 1 |
| p.R388H | COAD | 1 |
| p.D148N | UCEC | 1 |
| p.R353C | STAD | 1 |
| p.A412T | SKCM | 1 |
| p.R388H | LIHC | 1 |
| p.D28N | SKCM | 1 |
| p.G39E | PRAD | 1 |
| p.N32K | SKCM | 1 |
| p.A296T | HNSC | 1 |
| p.R325H | PAAD | 1 |
| p.R390C | UCEC | 1 |
| p.A238T | LGG | 1 |
| p.L274I | STAD | 1 |
| p.S104C | KIRP | 1 |
| p.Q49R | STAD | 1 |
| p.M168V | UCEC | 1 |
| p.V261M | UCEC | 1 |
| p.A193V | UCEC | 1 |
| p.Y250H | STAD | 1 |
| p.G174D | ESCA | 1 |
| p.S155L | HNSC | 1 |
| p.G176R | SKCM | 1 |
| p.R314H | STAD | 1 |
| p.G42D | STAD | 1 |
| p.S243N | STAD | 1 |
| p.T102M | PAAD | 1 |
| p.R101C | DLBC | 1 |
| p.T221K | THCA | 1 |
| p.R59W | CESC | 1 |
| p.S243N | UCEC | 1 |
| p.I110T | UCEC | 1 |
| p.R317Q | STAD | 1 |
| p.P29L | SKCM | 1 |
| p.T305M | READ | 1 |
| p.P246S | SKCM | 1 |
| p.G117S | LUAD | 1 |
| Top |
| TissGeneCNV for MCHR1 |
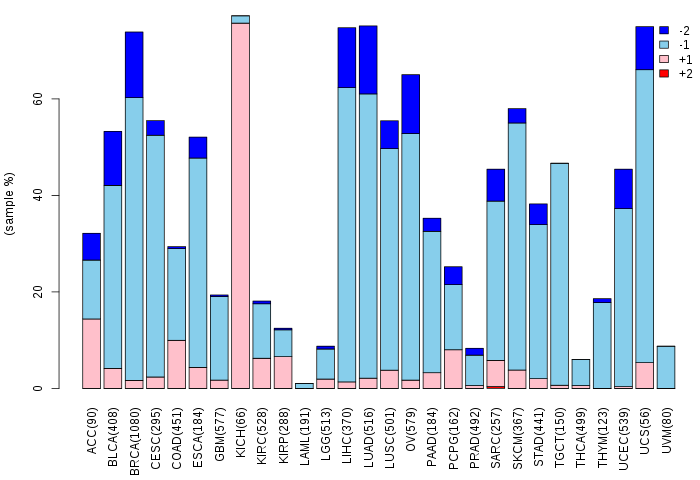
| Copy number variations of TissGene across 28 cancer types (X-axis: cancer type and Y-axis: % of CNV samples) (TCGA Gistic2_CopyNumber_Gistic2_all_data_by_genes, Gistic2 copy number data, version 2016-08-16) |
 |
| Top |
| TissGeneFusions for MCHR1 |
| Fusion genes including TissGene (ChimerDB 3.0, 2016-12-01 and TCGA fusion Portal 2015-12-01) |
| Database | Src | Cancer type | Sample | Fusion gene | ORF | 5'-gene BP | 3'-gene BP |
| TCGAfusionPortal | PRADA | BLCA | TCGA-BT-A0S7-01A | EP300-MCHR1 | In-frame | Chr22:41489102 | Chr22:41076953 |
| Top |
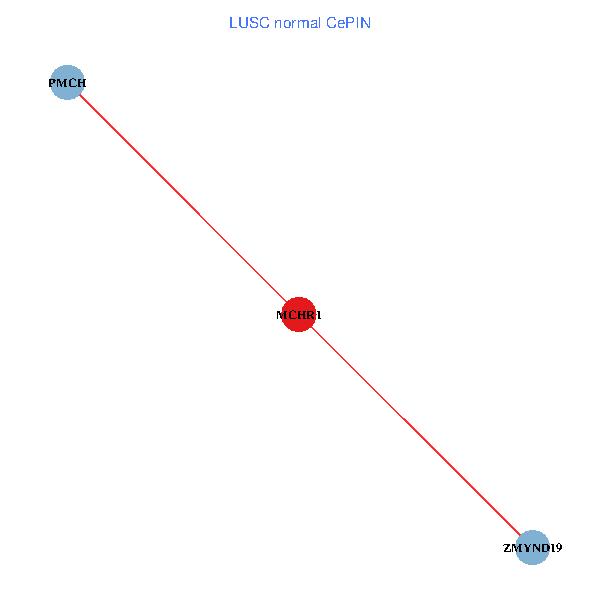
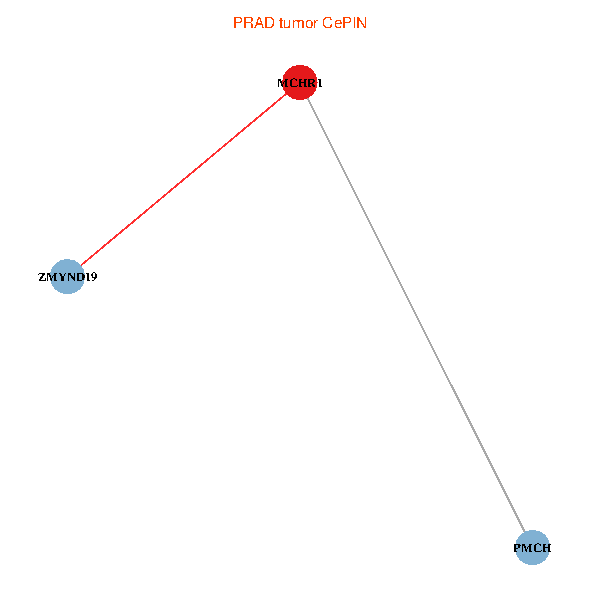
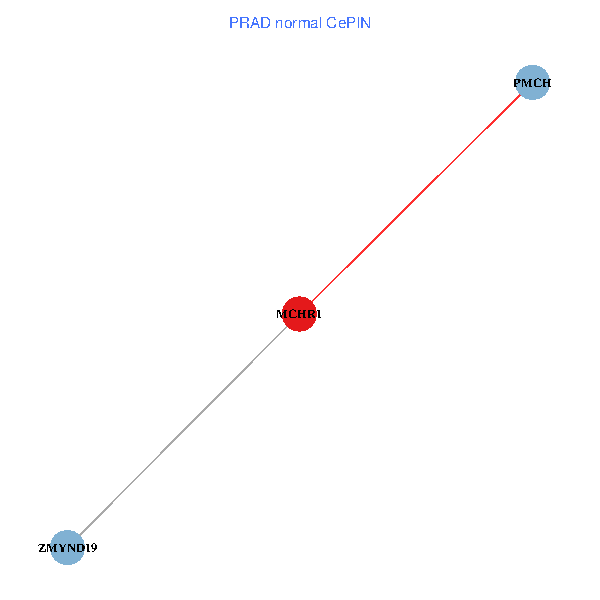
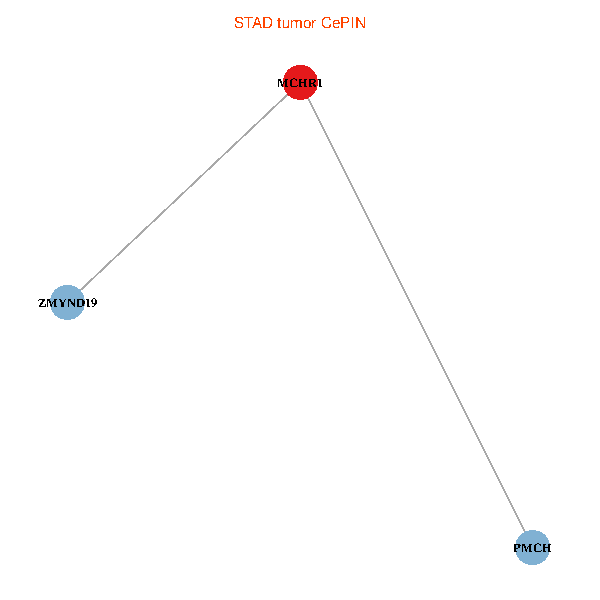
| TissGeneNet for MCHR1 |
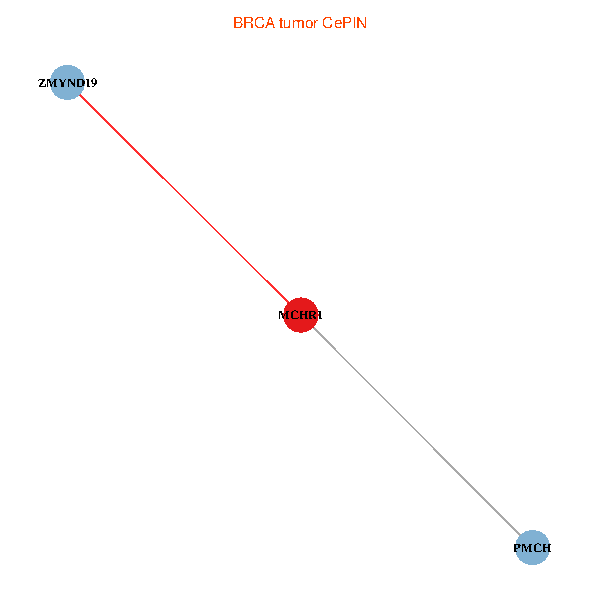
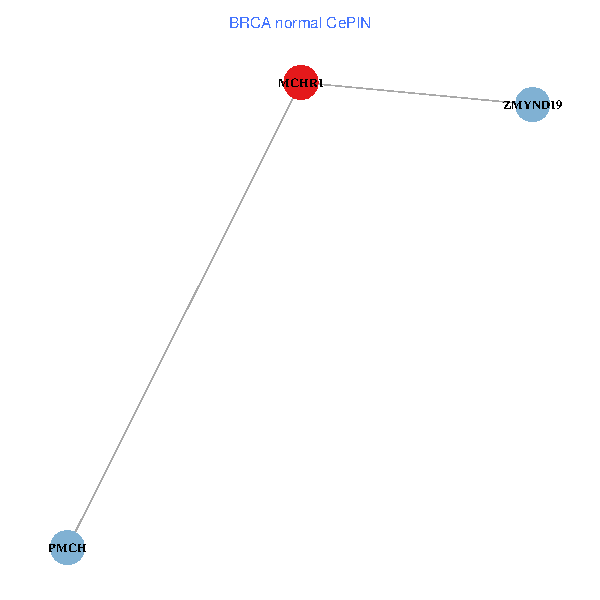
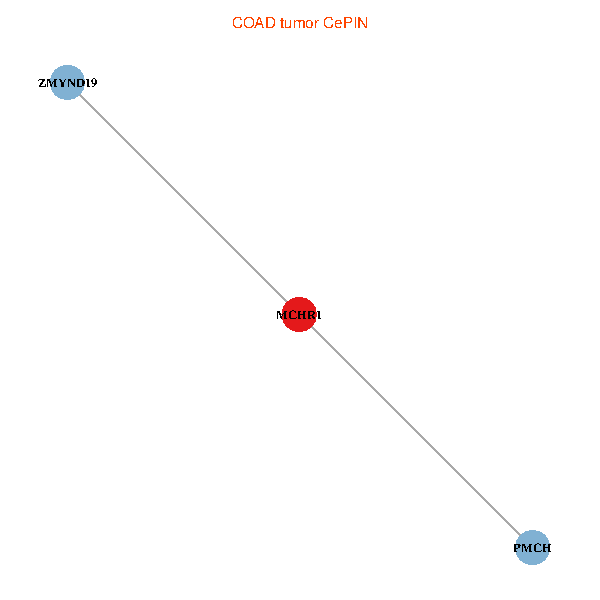
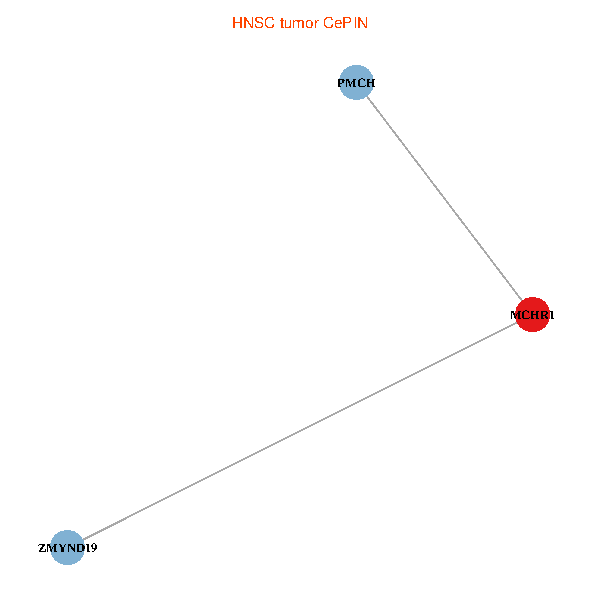
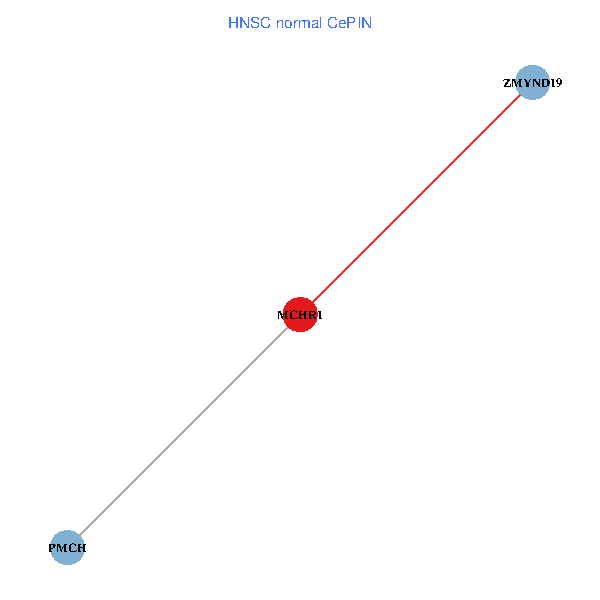
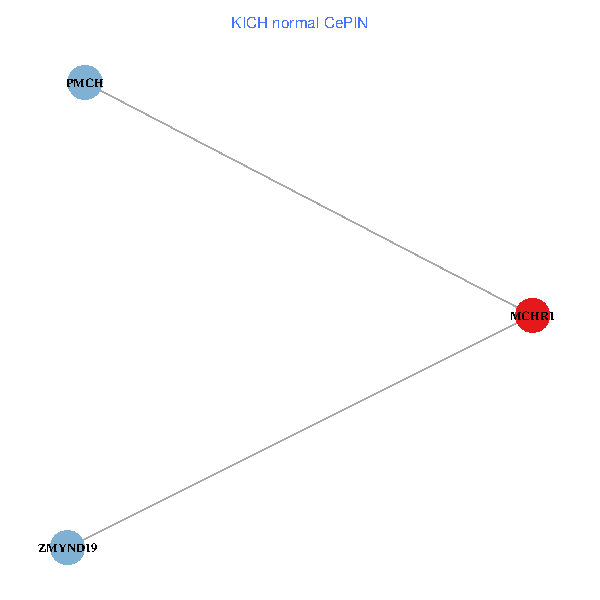
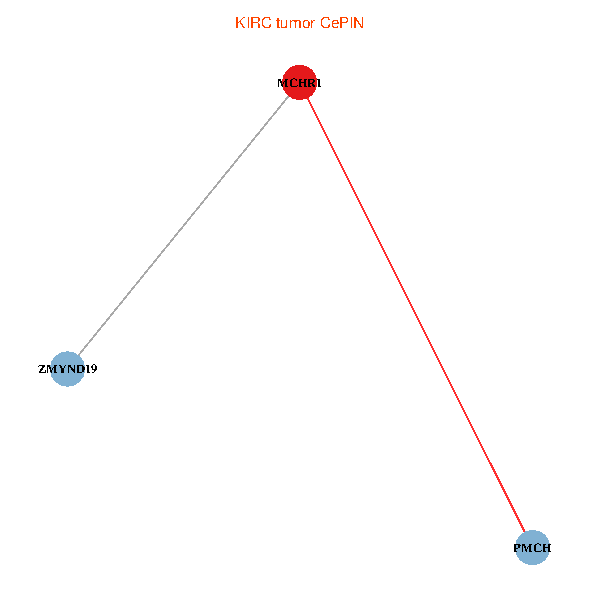
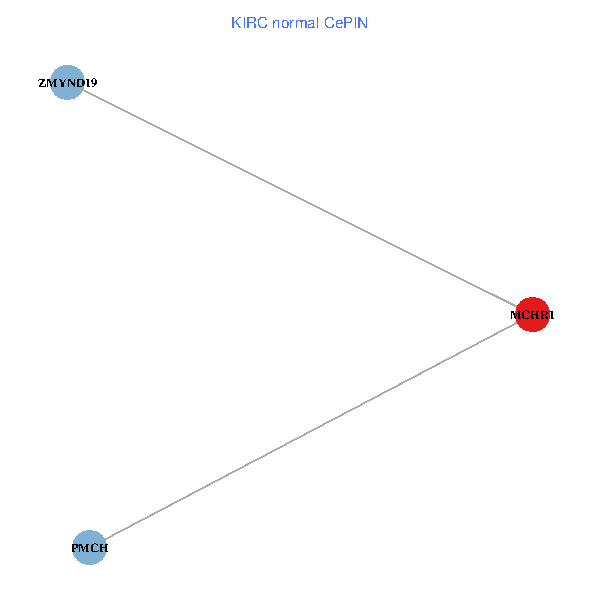
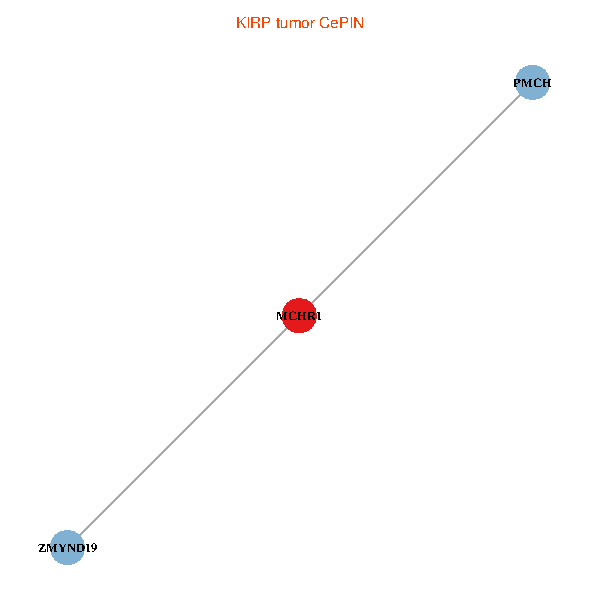
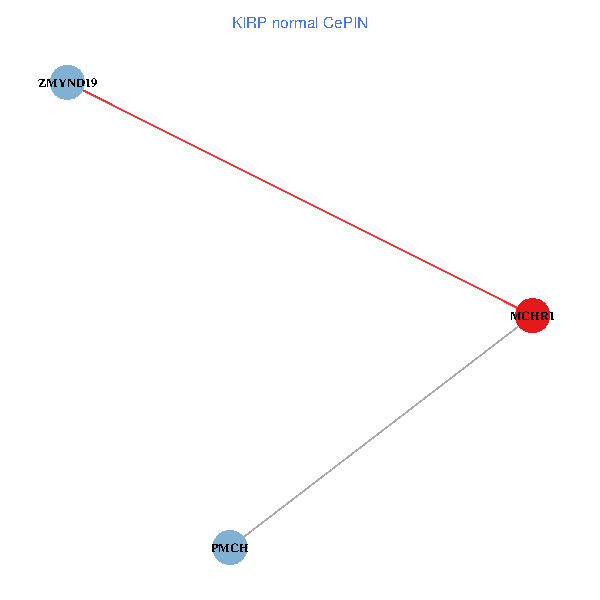
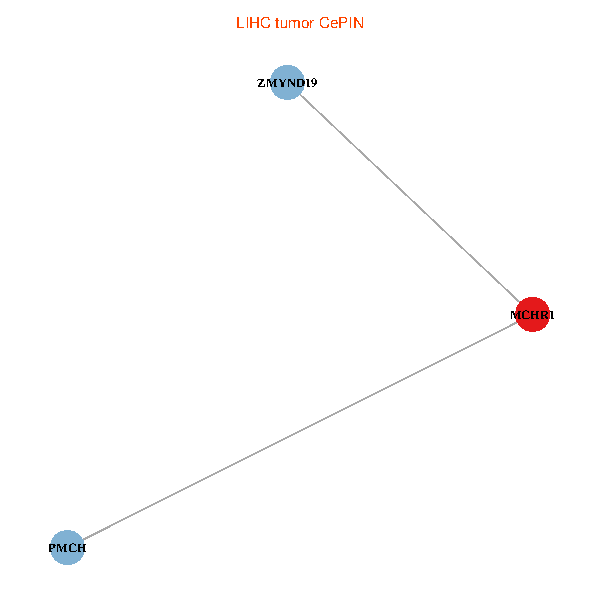
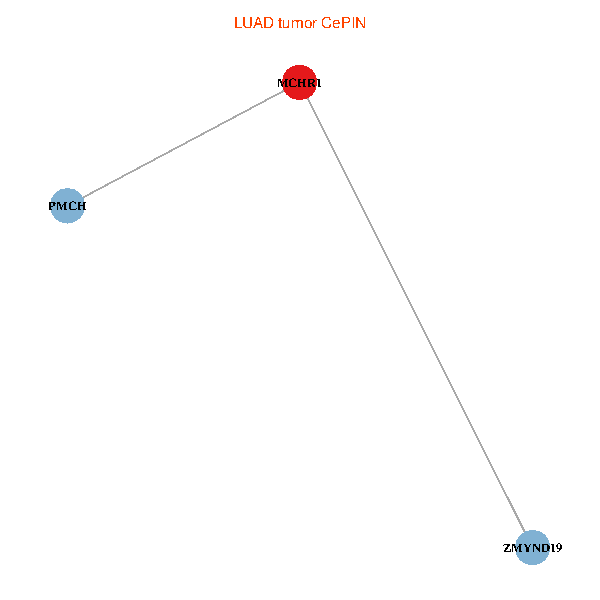
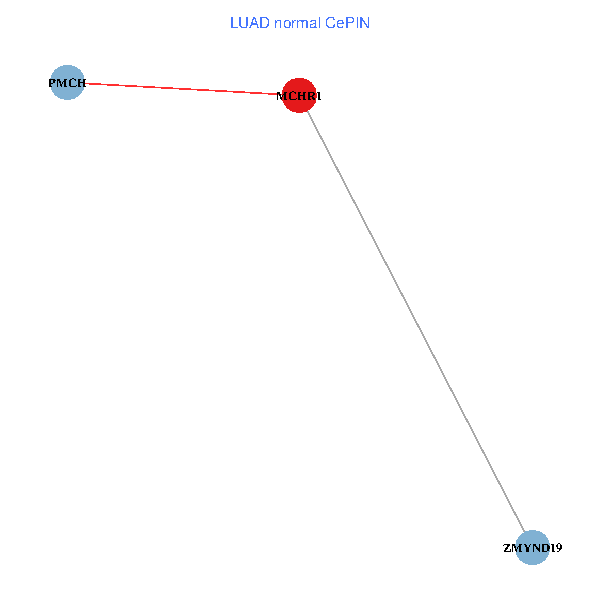
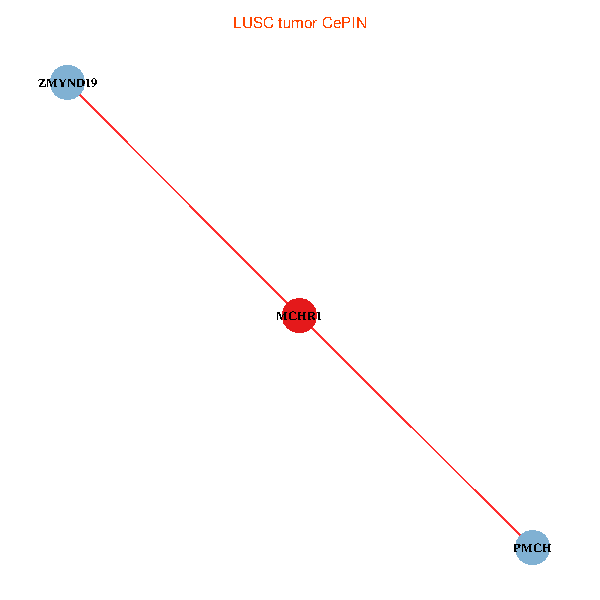
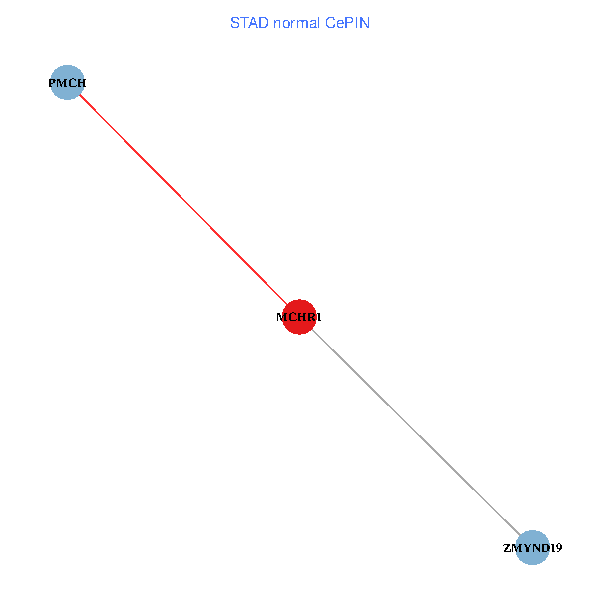
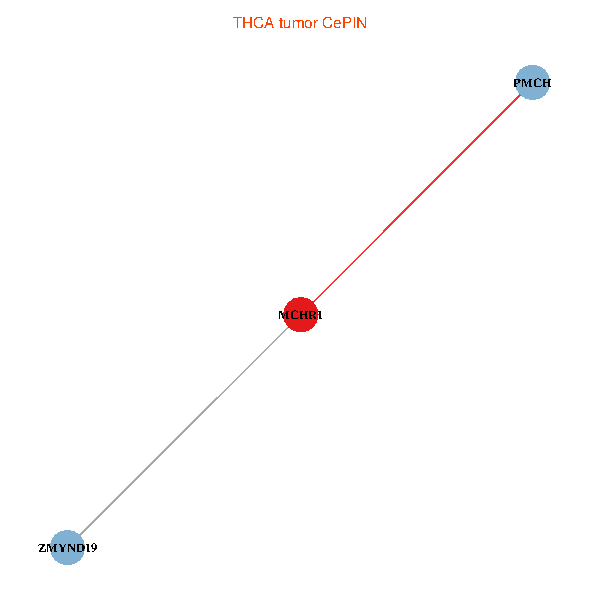
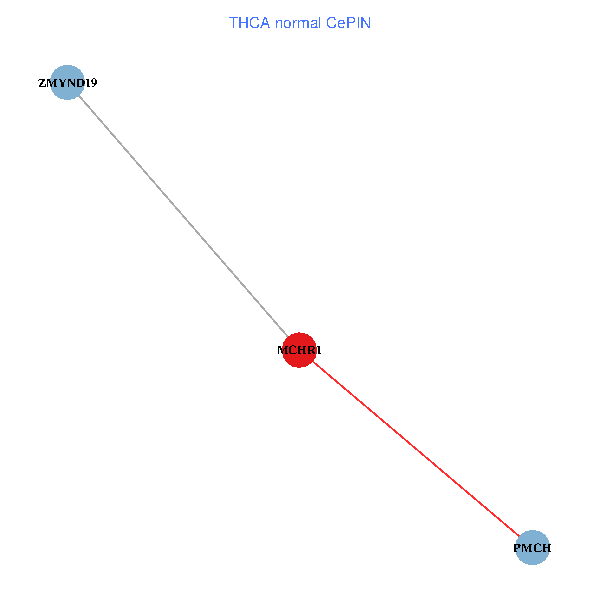
| Co-expressed gene networks based on protein-protein interaction data (CePIN) (TCGA IlluminaHiSeq_RNASeqV2, pan-cancer normalized log2(norm_counts+1) data, version 2016-08-16) (PINA2 ppi data) |
| BRCA (tumor) | BRCA (normal) |
| MCHR1, ZMYND19, PMCH (tumor) | MCHR1, ZMYND19, PMCH (normal) |
 |  |
| COAD (tumor) | COAD (normal) |
| MCHR1, ZMYND19, PMCH (tumor) | MCHR1, ZMYND19, PMCH (normal) |
 |  |
| HNSC (tumor) | HNSC (normal) |
| MCHR1, ZMYND19, PMCH (tumor) | MCHR1, ZMYND19, PMCH (normal) |
 |  |
| KICH (tumor) | KICH (normal) |
| MCHR1, ZMYND19, PMCH (tumor) | MCHR1, ZMYND19, PMCH (normal) |
 |  |
| KIRC (tumor) | KIRC (normal) |
| MCHR1, ZMYND19, PMCH (tumor) | MCHR1, ZMYND19, PMCH (normal) |
 |  |
| KIRP (tumor) | KIRP (normal) |
| MCHR1, ZMYND19, PMCH (tumor) | MCHR1, ZMYND19, PMCH (normal) |
 |  |
| LIHC (tumor) | LIHC (normal) |
| MCHR1, ZMYND19, PMCH (tumor) | MCHR1, ZMYND19, PMCH (normal) |
 |  |
| LUAD (tumor) | LUAD (normal) |
| MCHR1, ZMYND19, PMCH (tumor) | MCHR1, ZMYND19, PMCH (normal) |
 |  |
| LUSC (tumor) | LUSC (normal) |
| MCHR1, ZMYND19, PMCH (tumor) | MCHR1, ZMYND19, PMCH (normal) |
 |  |
| PRAD (tumor) | PRAD (normal) |
| MCHR1, ZMYND19, PMCH (tumor) | MCHR1, ZMYND19, PMCH (normal) |
 |  |
| STAD (tumor) | STAD (normal) |
| MCHR1, ZMYND19, PMCH (tumor) | MCHR1, ZMYND19, PMCH (normal) |
 |  |
| THCA (tumor) | THCA (normal) |
| MCHR1, ZMYND19, PMCH (tumor) | MCHR1, ZMYND19, PMCH (normal) |
 |  |
| Top |
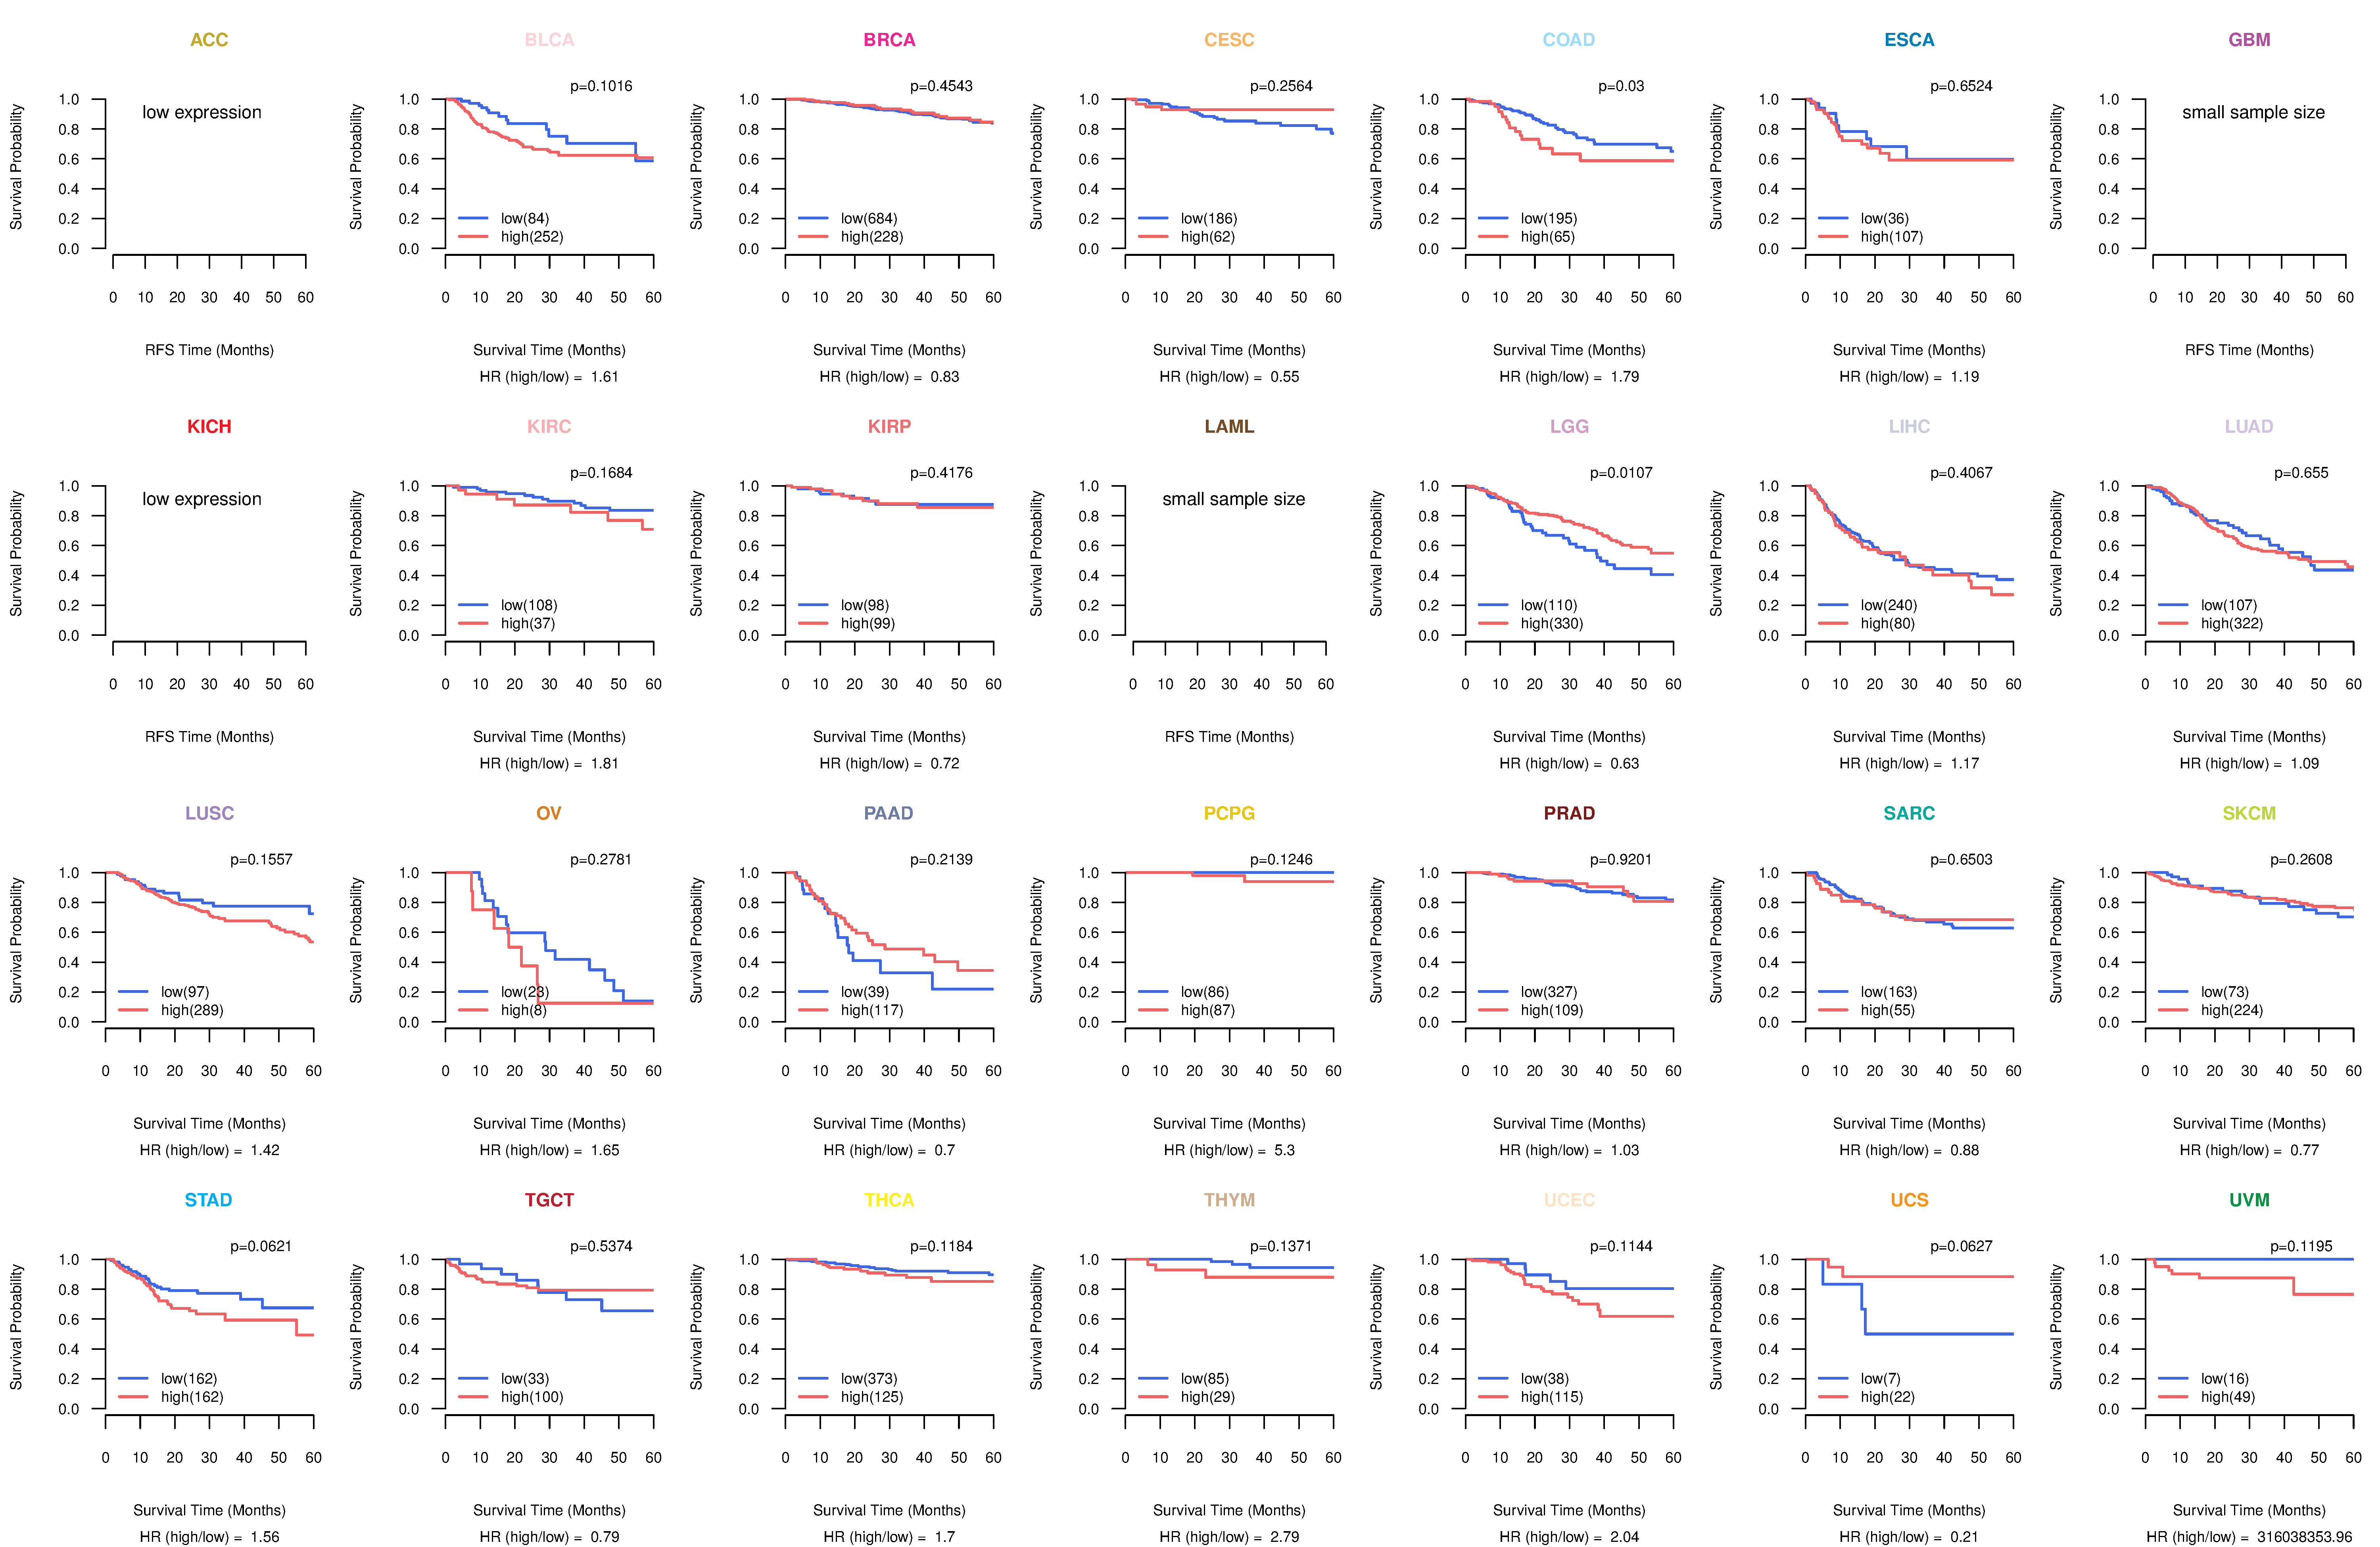
| TissGeneProg for MCHR1 |
| Kaplan-Meier plots with logrank tests of overall survival (OS) using 28 cancer types (TCGA IlluminaHiSeq_RNASeqV2, pan-cancer normalized log2(norm_counts+1) data, version 2016-08-16) (TCGA clinicalMatrix, phenotype data, version 2016-04-27) * Click on the image to enlarge it in a new window. |
 |
| Kaplan-Meier plots with logrank test of relapse free survival (RFS) using 28 cancer types (TCGA IlluminaHiSeq_RNASeqV2, pan-cancer normalized log2(norm_counts+1) data, version 2016-08-16) (TCGA clinicalMatrix, phenotype data, version 2016-04-27) * Click on the image enlarge it in a new window. |
 |
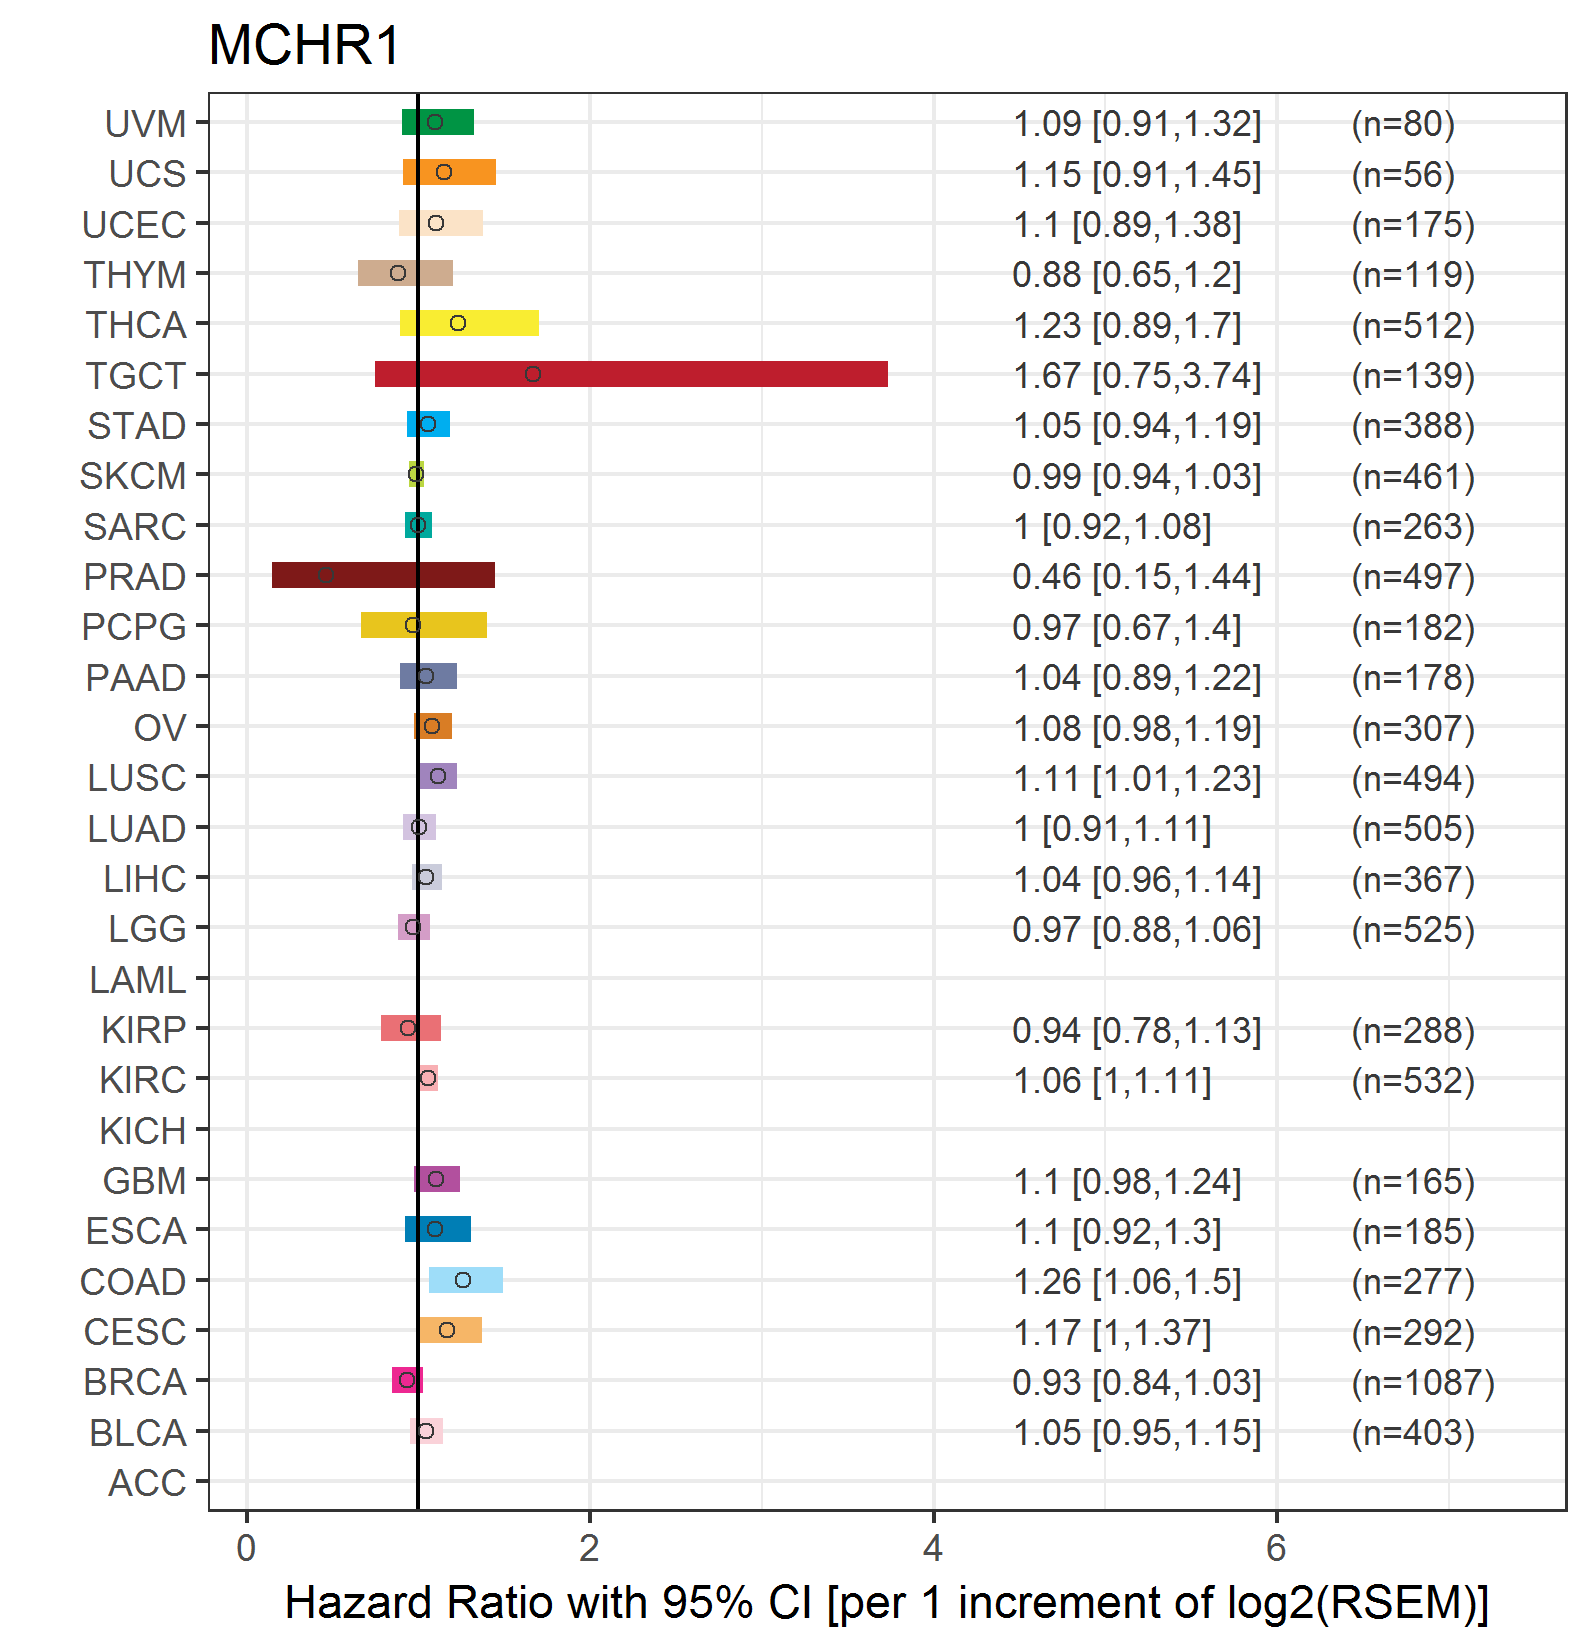
| Forest plot of Cox proportional hazard ratio (HR) and 95% CI of overall survival (OS) using 28 cancer types (TCGA IlluminaHiSeq_RNASeqV2, pan-cancer normalized log2(norm_counts+1) data, version 2016-08-16) (TCGA clinicalMatrix, phenotype data, version 2016-04-27) * Click on the image enlarge it in a new window. |
 |
| Forest plot of Cox proportional hazard ratio (HR) and 95% CI of relapse free survival (RFS) using 28 cancer types (TCGA IlluminaHiSeq_RNASeqV2, pan-cancer normalized log2(norm_counts+1) data, version 2016-08-16) (TCGA clinicalMatrix, phenotype data, version 2016-04-27) * Click on the image enlarge it in a new window. |
 |
| Top |
| TissGeneClin for MCHR1 |
| TissGeneDrug for MCHR1 |
| Drug information targeting TissGene (DrugBank Version 5.0.6, 2017-04-01) |
| DrugBank ID | Drug name | Drug activity | Drug type | Drug status |
| Top |
| TissGeneDisease for MCHR1 |
| Disease information associated with TissGene (DisGeNet, 2016-06-01) |
| Disease ID | Disease name | # pubmeds | Source |
| umls:C0028754 | Obesity | 12 | BeFree,GAD,RGD |
| umls:C0027819 | Neuroblastoma | 3 | BeFree |
| umls:C0036341 | Schizophrenia | 3 | BeFree,LHGDN |
| umls:C0525045 | Mood Disorders | 3 | BeFree,LHGDN |
| umls:C0700095 | Central neuroblastoma | 3 | BeFree |
| umls:C0005586 | Bipolar Disorder | 2 | BeFree |
| umls:C0011570 | Mental Depression | 2 | BeFree |
| umls:C0011581 | Depressive disorder | 2 | BeFree |
| umls:C0025202 | melanoma | 2 | BeFree |
| umls:C0001430 | Adenoma | 1 | BeFree |
| umls:C0006012 | Borderline Personality Disorder | 1 | BeFree |
| umls:C0006287 | Bronchopulmonary Dysplasia | 1 | BeFree |
| umls:C0011860 | Diabetes Mellitus, Non-Insulin-Dependent | 1 | GAD |
| umls:C0021655 | Insulin Resistance | 1 | GAD |
| umls:C0032002 | Pituitary Diseases | 1 | BeFree |
| umls:C0033860 | Psoriasis | 1 | BeFree |
| umls:C0042900 | Vitiligo | 1 | BeFree |
| umls:C1520166 | Xenograft Model | 1 | BeFree |
| umls:C1839839 | MAJOR AFFECTIVE DISORDER 2 | 1 | BeFree |
| umls:C1847835 | VITILIGO-ASSOCIATED MULTIPLE AUTOIMMUNE DISEASE SUSCEPTIBILITY 1 (finding) | 1 | BeFree |
| umls:C1852197 | MAJOR AFFECTIVE DISORDER 1 | 1 | BeFree |
| umls:C1970943 | MAJOR AFFECTIVE DISORDER 4 | 1 | BeFree |
| umls:C1970944 | MAJOR AFFECTIVE DISORDER 5 | 1 | BeFree |
| umls:C1970945 | MAJOR AFFECTIVE DISORDER 6 | 1 | BeFree |
| umls:C2700438 | MAJOR AFFECTIVE DISORDER 7 | 1 | BeFree |
| umls:C2700439 | MAJOR AFFECTIVE DISORDER 8 | 1 | BeFree |
| umls:C2700440 | MAJOR AFFECTIVE DISORDER 9 | 1 | BeFree |
|
Copyright 2016-Present - The University of Texas Health Science Center at Houston (UTHealth) Web File Viewing | How to Report, Fraud, Waste and Abuse | State of Texas | Statewide Search | Texas Homeland Security | Site Policies |