 |
| |
| |
| |
| |
| |
| |
|

| TissGeneSummary for C2orf61 |
 Gene summary Gene summary |
| Basic gene information | Gene symbol | C2orf61 |
| Gene name | chromosome 2 open reading frame 61 | |
| Synonyms | - | |
| Cytomap | UCSC genome browser: 2p21 | |
| Type of gene | protein-coding | |
| RefGenes | NM_001163561.1, NM_173649.2, | |
| Description | uncharacterized protein C2orf61 | |
| Modification date | 20141207 | |
| dbXrefs | HGNC : HGNC | |
| Ensembl : ENSG00000239605 | ||
| HPRD : 08273 | ||
| Protein | UniProt: go to UniProt's Cross Reference DB Table | |
| Expression | CleanEX: HS_C2orf61 | |
| BioGPS: 285051 | ||
| Pathway | NCI Pathway Interaction Database: C2orf61 | |
| KEGG: C2orf61 | ||
| REACTOME: C2orf61 | ||
| Pathway Commons: C2orf61 | ||
| Context | iHOP: C2orf61 | |
| ligand binding site mutation search in PubMed: C2orf61 | ||
| UCL Cancer Institute: C2orf61 | ||
| Assigned class in TissGDB* | C | |
| Included tissue-specific gene expression resources | HPA,GTEx | |
| Specific-tissues in normal samples (assigned by TissGDB using HPA, TiGER, and GTEx) | Testis | |
| Cancer types related to the specific-tissues in cancer samples (assigned by TissGDB using TCGA) | TGCT | |
| Reference showing the relevant tissue of C2orf61 | ||
| Description by TissGene annotations | Fused withTSGene | |
| * Class A consists of genes with literature evidence and is part of the cTissGenes. Class B consists of only cTissGenes without additional evidence. The remaining genes belong to Class C. |
| Gene ontology having evidence of Inferred from Direct Assay (IDA) from Entrez |
| GO ID | GO term | PubMed ID |
| Top |
| TissGeneExp for C2orf61 |
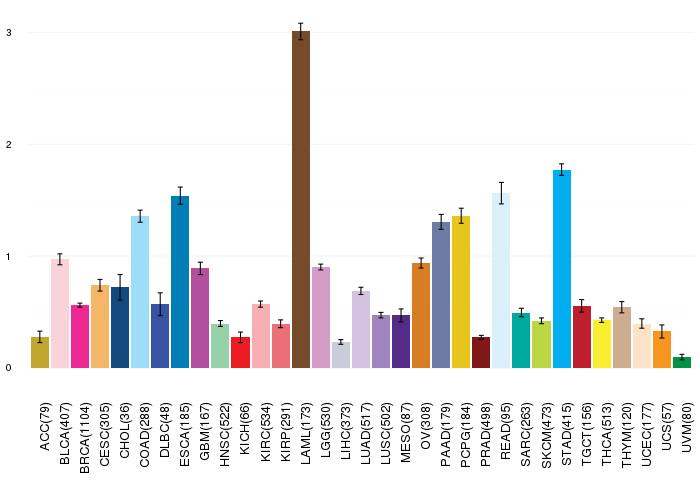
| Gene expressions across 28 cancer types (X-axis: cancer type and Y-axis: log2(norm_counts+1)) (TCGA IlluminaHiSeq_RNASeqV2, pan-cancer normalized log2(norm_counts+1) data, version 2016-08-16) |
 |
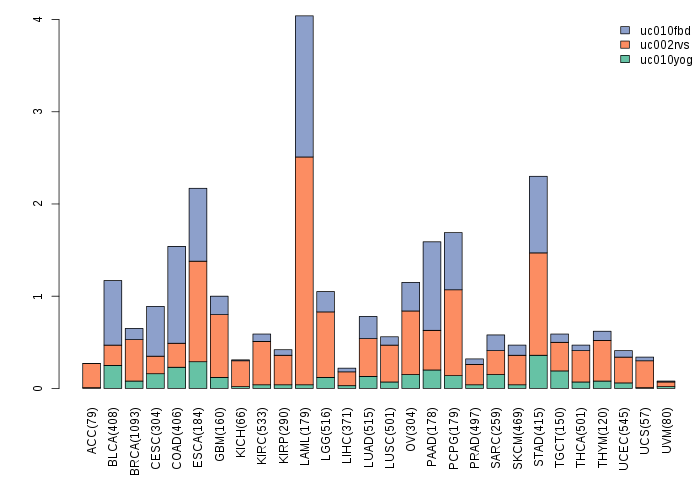
| Gene isoform expressions across 28 cancer types (X-axis: cancer type and Y-axis: log2(norm_counts+1)) (TCGA pan-cancer tcga_rsem_isoform_tpm, version 2016-09-01) |
 |
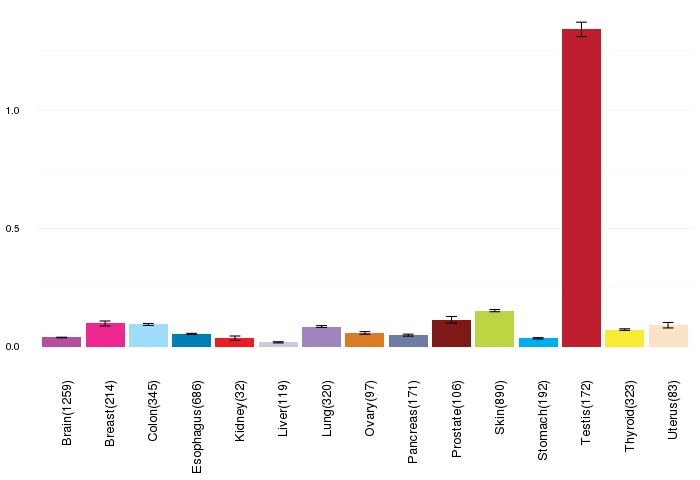
| Gene expressions across normal tissues of GTEx data (GTEx GTEx_Analysis_v6_RNA-seq_RNA-SeQCv1.1.8_gene_rpkm.gct) - Here, we shows the matched tissue types only among our 28 cancer types. |
 |
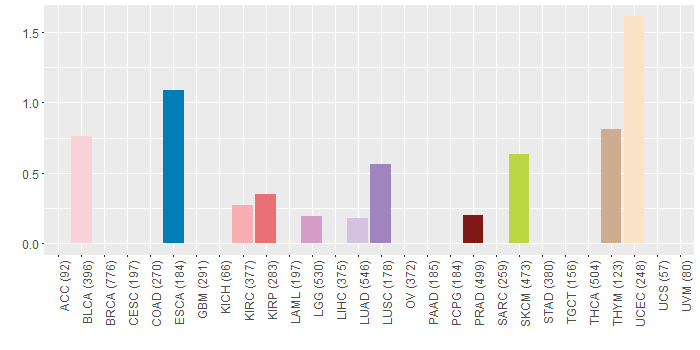
| Different expressions across 14 cancer types with more than 10 samples between matched tumors and normals (X-axis: cancer type and Y-axis: log2(norm_counts+1)) (TCGA IlluminaHiSeq_RNASeqV2, pan-cancer normalized log2(norm_counts+1) data, version 2016-08-16) |
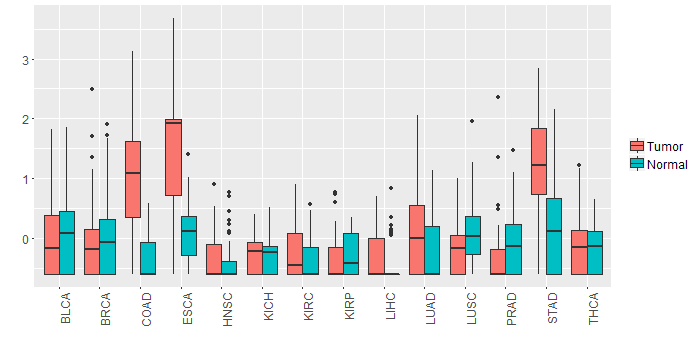 |
| - Significantly differentially expressed cancer types and information. (|Fold change|>1 and FDR<0.05) |
| Cancer type | Mean(exp) in tumor | Mean(exp) in matched normal | Log2FC | P-val. | FDR |
| COAD | 1.024789863 | -0.340640906 | 1.365430769 | 7.51E-08 | 5.39E-07 |
| ESCA | 1.439280773 | 0.152689863 | 1.286590909 | 0.00505 | 0.039764806 |
| STAD | 1.234771113 | 0.231399238 | 1.003371875 | 3.73E-05 | 0.000338257 |
| Top |
| TissGene-miRNA for C2orf61 |
| Significantly anti-correlated miRNAs of TissGene across 28 cancer types (Gene-miRNA relations from TargetScanHuman Relsease 7.1, Conserved_Site_Context_Scores.txt.zip, 06.01.2016) (TCGA IlluminaHiSeq_miRNASeq, log2(RPM+1) data, version 2016-11-21) (TCGA IlluminaHiSeq_RNASeqV2, log2(normalized_count+1) data, version 2016-08-16) (Spearman’s Rank Correlation (p-value<0.05 and coefficient<-0.25)) |
| Cancer type | miRNA id | miRNA accession | P-val. | Coeff. | # samples |
| Top |
| TissGeneMut for C2orf61 |
| TissGeneSNV for C2orf61 |
| nsSNV counts per each loci. Different colors of circles represent different cancer types. Circle size denotes number of samples. (TCGA somatic mutation (SNPs and small INDELs) data, version 2016-04-25) * Click on the image to enlarge it in a new window. |
 |
 |
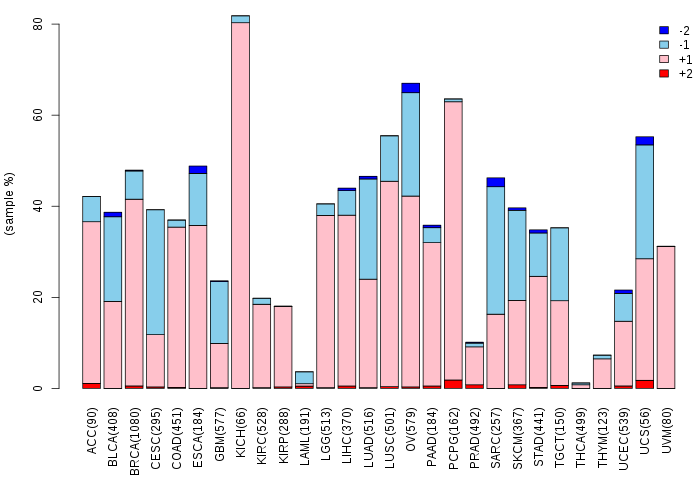
| Somatic nucleotide variants of TissGene across 28 cancer types (X-axis: cancer type and Y-axis: % of mutated samples) The numbers in parentheses are numbers of samples with mutation (nsSNVs). (TCGA somatic mutation (SNPs and small INDELs) data, version 2016-04-25) |
 |
| - nsSNVs sorted by frequency. |
| AAchange | Cancer type | # samples |
| p.S12P | KIRC | 1 |
| p.A7P | BLCA | 1 |
| p.P125L | SKCM | 1 |
| p.I13T | KIRP | 1 |
| p.N244I | UCEC | 1 |
| p.P85S | UCEC | 1 |
| p.K151I | BLCA | 1 |
| p.P83L | UCEC | 1 |
| p.T123A | UCEC | 1 |
| p.D119H | HNSC | 1 |
| p.P227A | ESCA | 1 |
| p.P50S | SKCM | 1 |
| p.P83L | SKCM | 1 |
| p.P179Q | ESCA | 1 |
| p.I124F | UCEC | 1 |
| p.T8I | HNSC | 1 |
| p.N74T | PRAD | 1 |
| p.F104L | THYM | 1 |
| p.P4T | BLCA | 1 |
| p.I24V | LGG | 1 |
| p.P125A | LUSC | 1 |
| p.C157Y | DLBC | 1 |
| p.N77S | LUAD | 1 |
| Top |
| TissGeneCNV for C2orf61 |
| Copy number variations of TissGene across 28 cancer types (X-axis: cancer type and Y-axis: % of CNV samples) (TCGA Gistic2_CopyNumber_Gistic2_all_data_by_genes, Gistic2 copy number data, version 2016-08-16) |
 |
| Top |
| TissGeneFusions for C2orf61 |
| Fusion genes including TissGene (ChimerDB 3.0, 2016-12-01 and TCGA fusion Portal 2015-12-01) |
| Database | Src | Cancer type | Sample | Fusion gene | ORF | 5'-gene BP | 3'-gene BP |
| Chimerdb3.0 | ChiTaRs | NA | BP249981 | C2orf61-SECISBP2L | chr2:47388915 | chr15:49288610 | |
| Chimerdb3.0 | ChiTaRs | NA | AI039637 | C2orf61-MCF2L2 | chr2:47387852 | chr3:182988389 | |
| Chimerdb3.0 | ChiTaRs | NA | DA514557 | C2orf61-GDI2 | chr2:47403650 | chr10:5838773 | |
| Chimerdb3.0 | ChiTaRs | NA | BM827779 | C2orf61-UCP2 | chr2:47403650 | chr11:73693832 | |
| Chimerdb3.0 | ChiTaRs | NA | BP374554 | C2orf61-LOC642776 | chr2:47403650 | chrX:115052439 | |
| Chimerdb3.0 | ChiTaRs | NA | AI688098 | C2orf61-HIST1H2BC | chr2:47387504 | chr6:26123755 | |
| Chimerdb3.0 | ChiTaRs | NA | BP219658 | C2orf61-CABIN1 | chr2:47403650 | chr22:24491284 | |
| Chimerdb3.0 | ChiTaRs | NA | BF927057 | SAFB-C2orf61 | chr19:5653360 | chr2:47388952 | |
| Chimerdb3.0 | ChiTaRs | NA | BF700255 | ESD-C2orf61 | chr13:47371264 | chr2:47387721 | |
| Chimerdb3.0 | ChiTaRs | NA | BF930423 | SAFB-C2orf61 | chr19:5653360 | chr2:47388906 | |
| TCGAfusionPortal | PRADA | OV | TCGA-23-1027-01A | C2orf61-ALK | Out-of-frame | Chr2:47357080 | Chr2:29754982 |
| Top |
| TissGeneNet for C2orf61 |
| Co-expressed gene networks based on protein-protein interaction data (CePIN) (TCGA IlluminaHiSeq_RNASeqV2, pan-cancer normalized log2(norm_counts+1) data, version 2016-08-16) (PINA2 ppi data) |
| Top |
| TissGeneProg for C2orf61 |
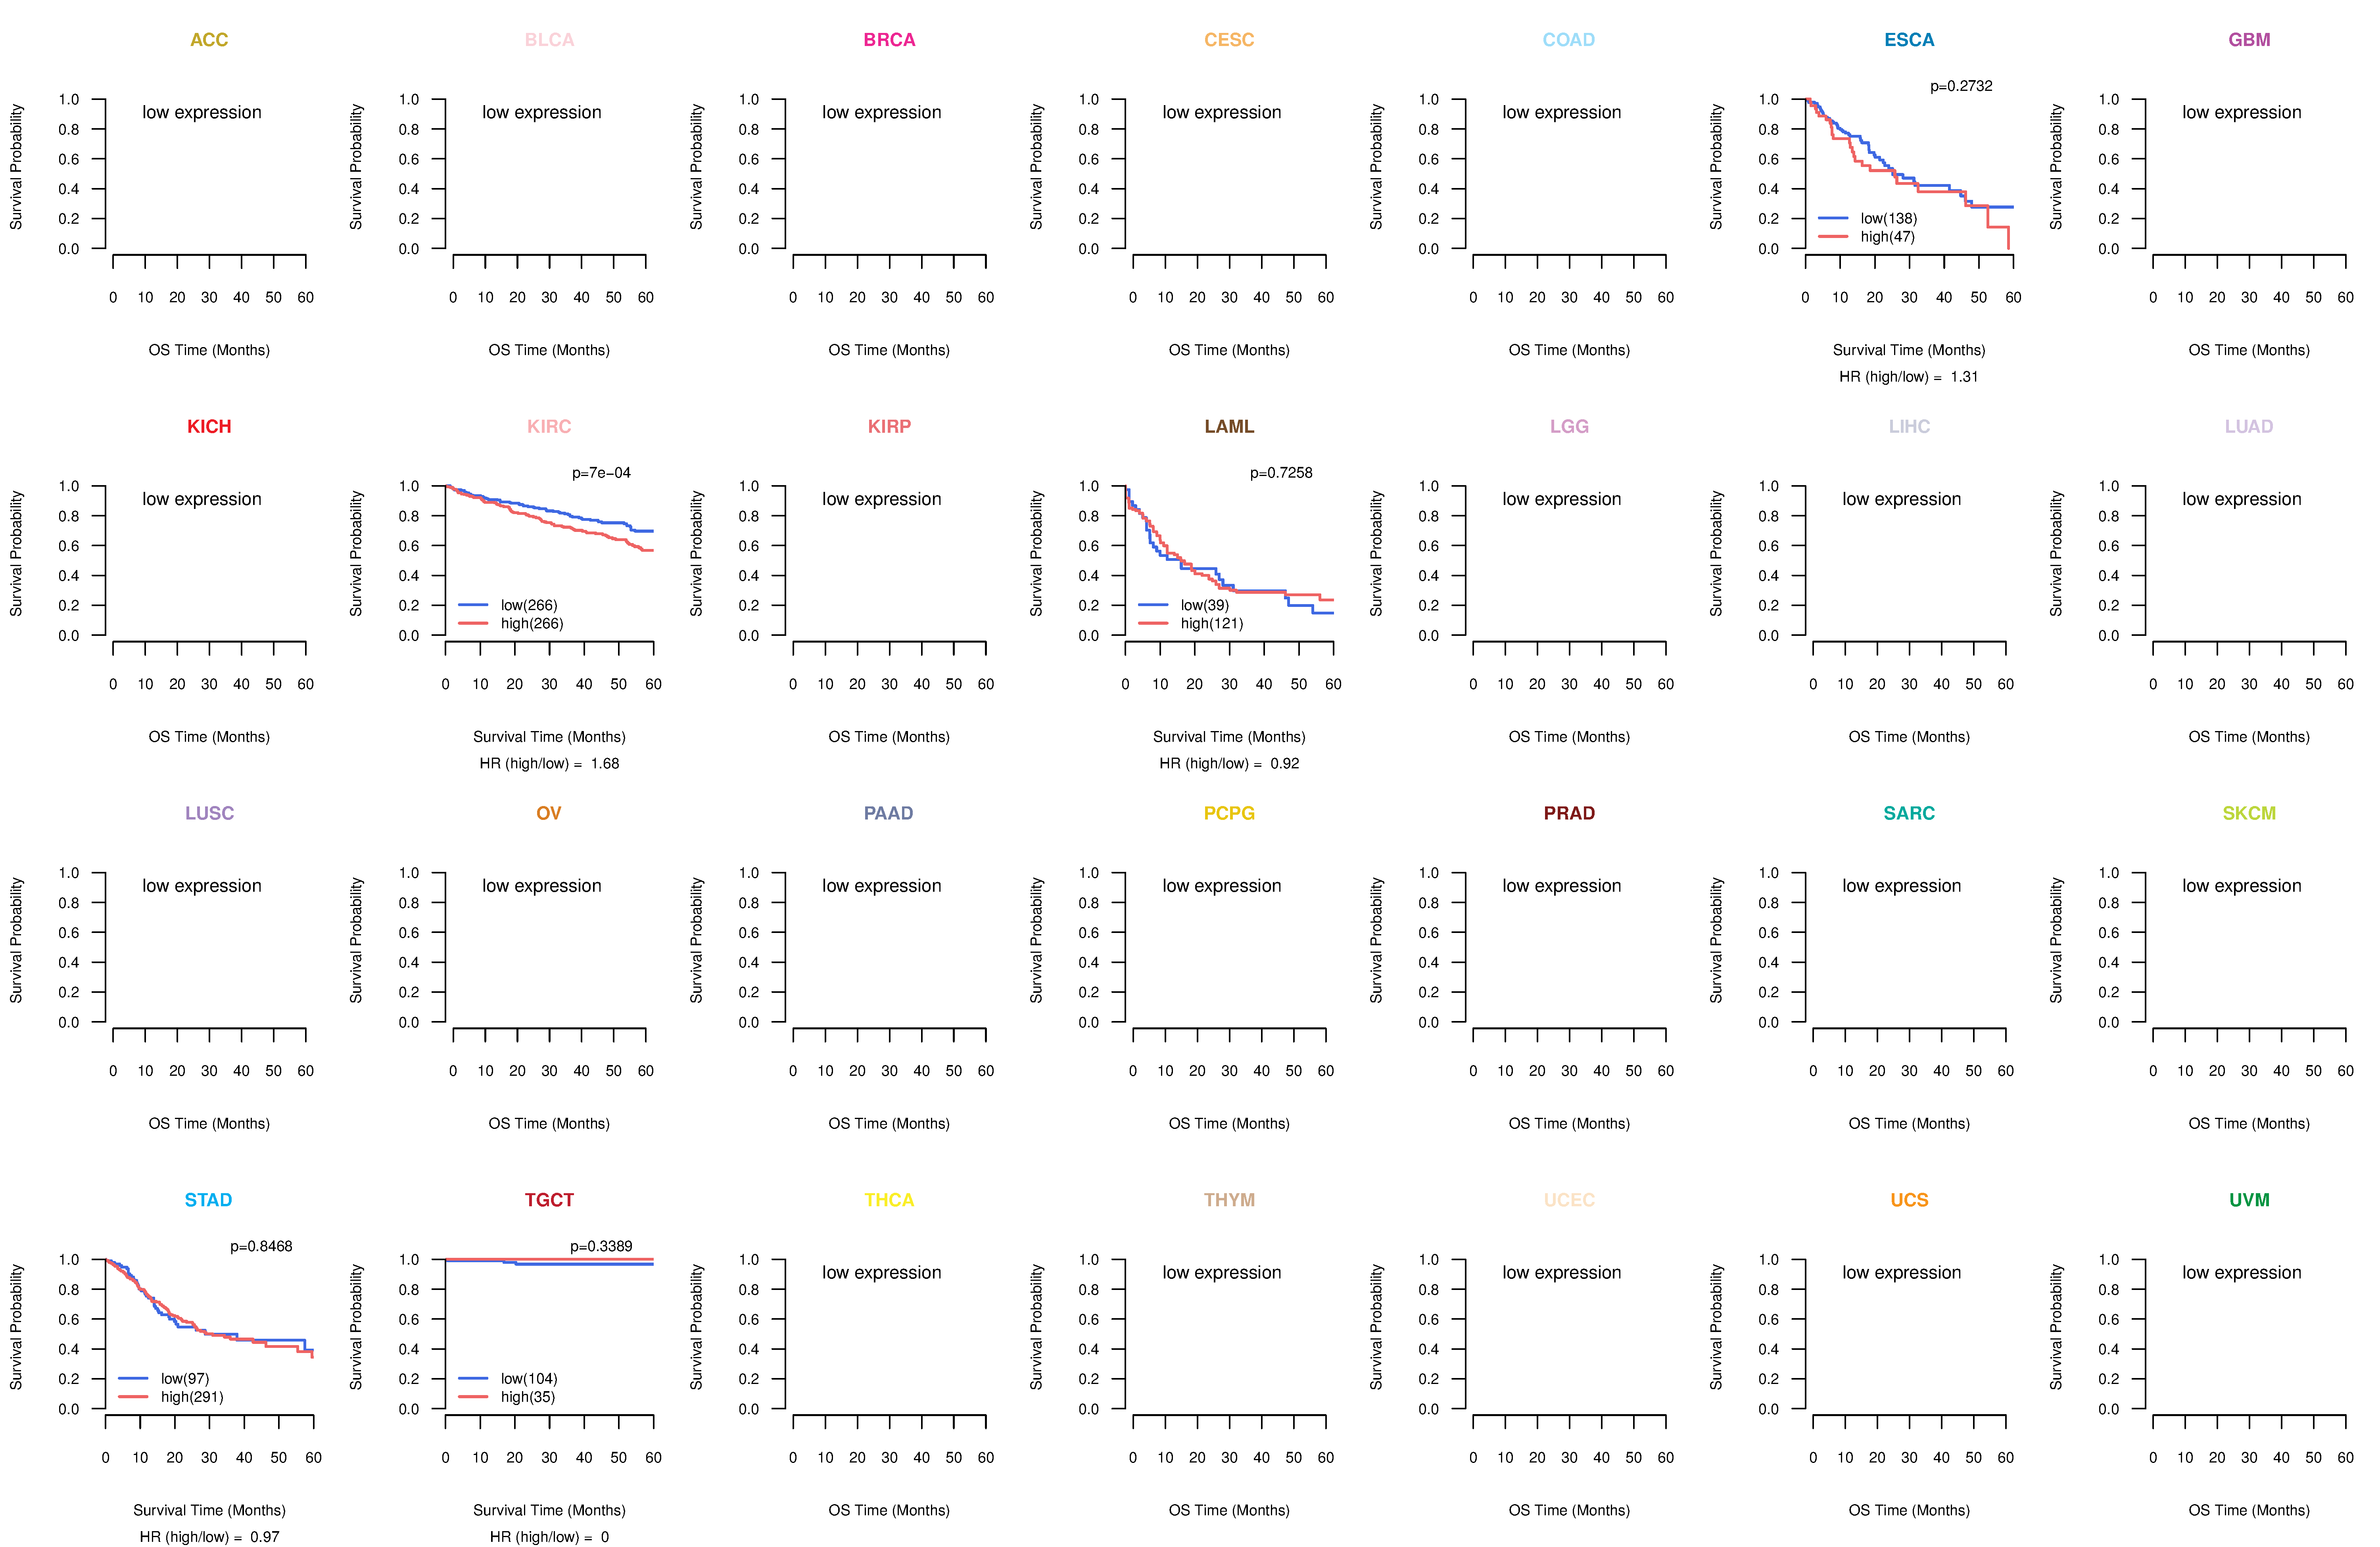
| Kaplan-Meier plots with logrank tests of overall survival (OS) using 28 cancer types (TCGA IlluminaHiSeq_RNASeqV2, pan-cancer normalized log2(norm_counts+1) data, version 2016-08-16) (TCGA clinicalMatrix, phenotype data, version 2016-04-27) * Click on the image to enlarge it in a new window. |
 |
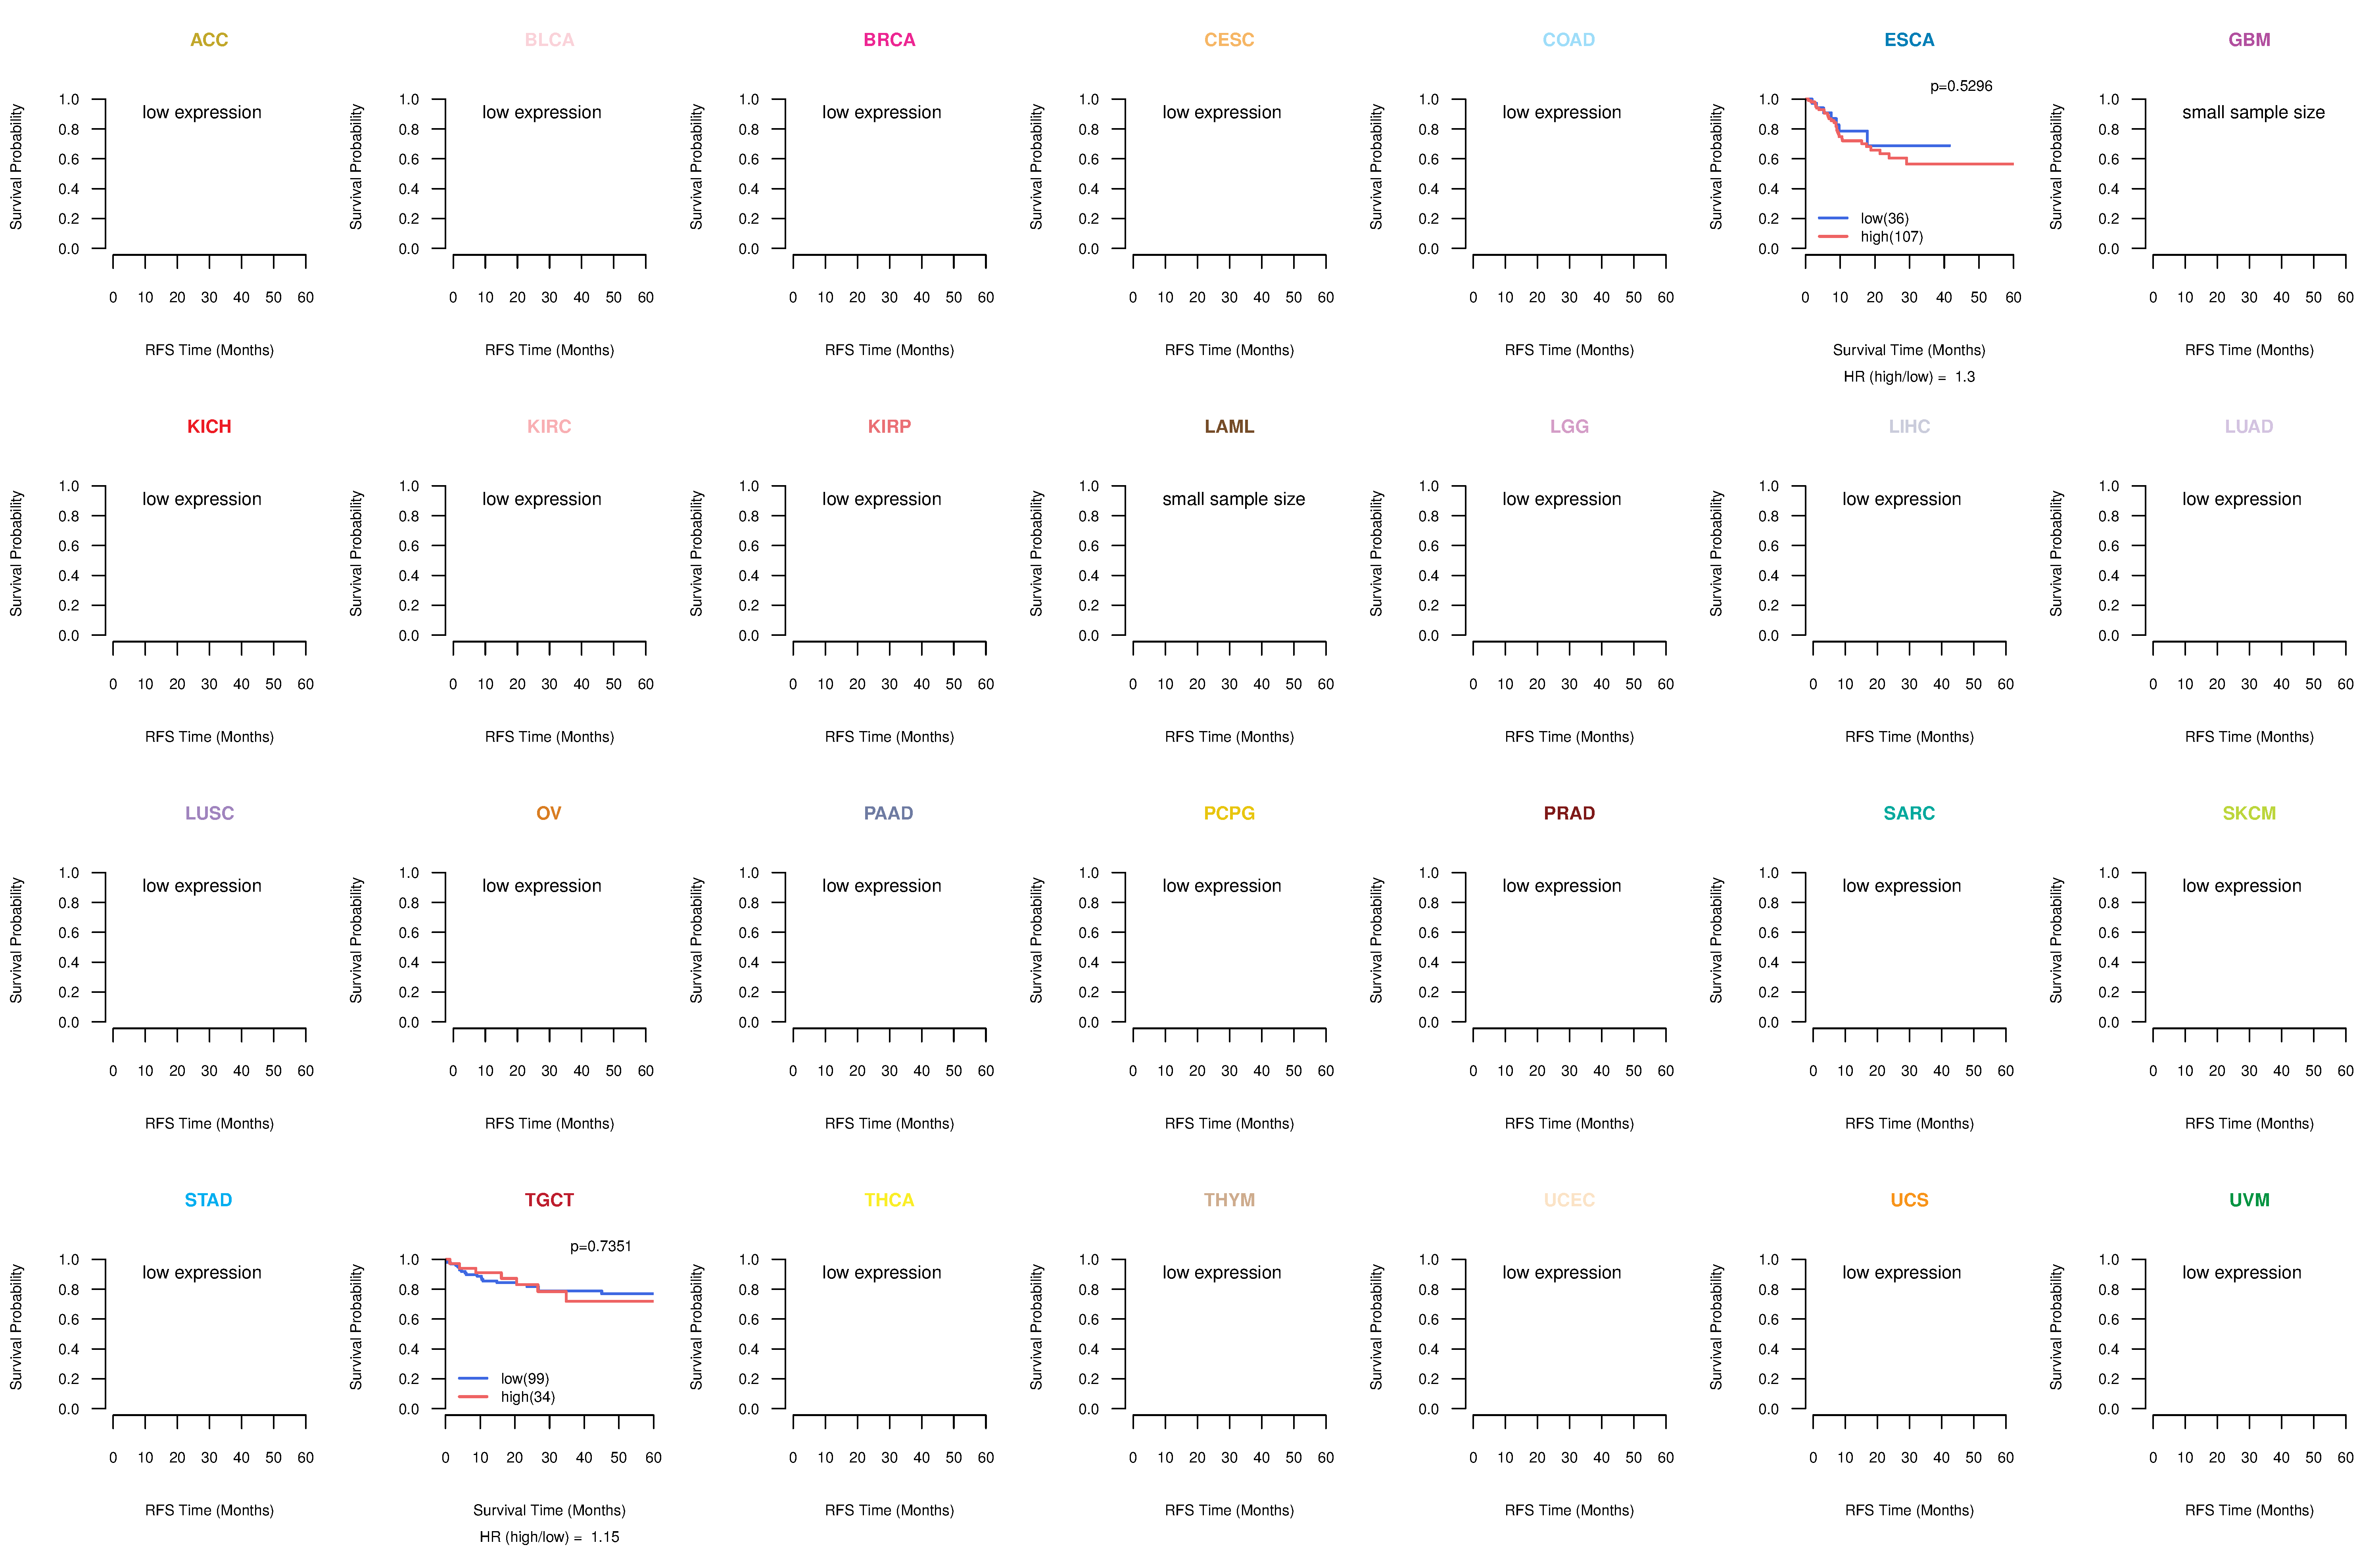
| Kaplan-Meier plots with logrank test of relapse free survival (RFS) using 28 cancer types (TCGA IlluminaHiSeq_RNASeqV2, pan-cancer normalized log2(norm_counts+1) data, version 2016-08-16) (TCGA clinicalMatrix, phenotype data, version 2016-04-27) * Click on the image enlarge it in a new window. |
 |
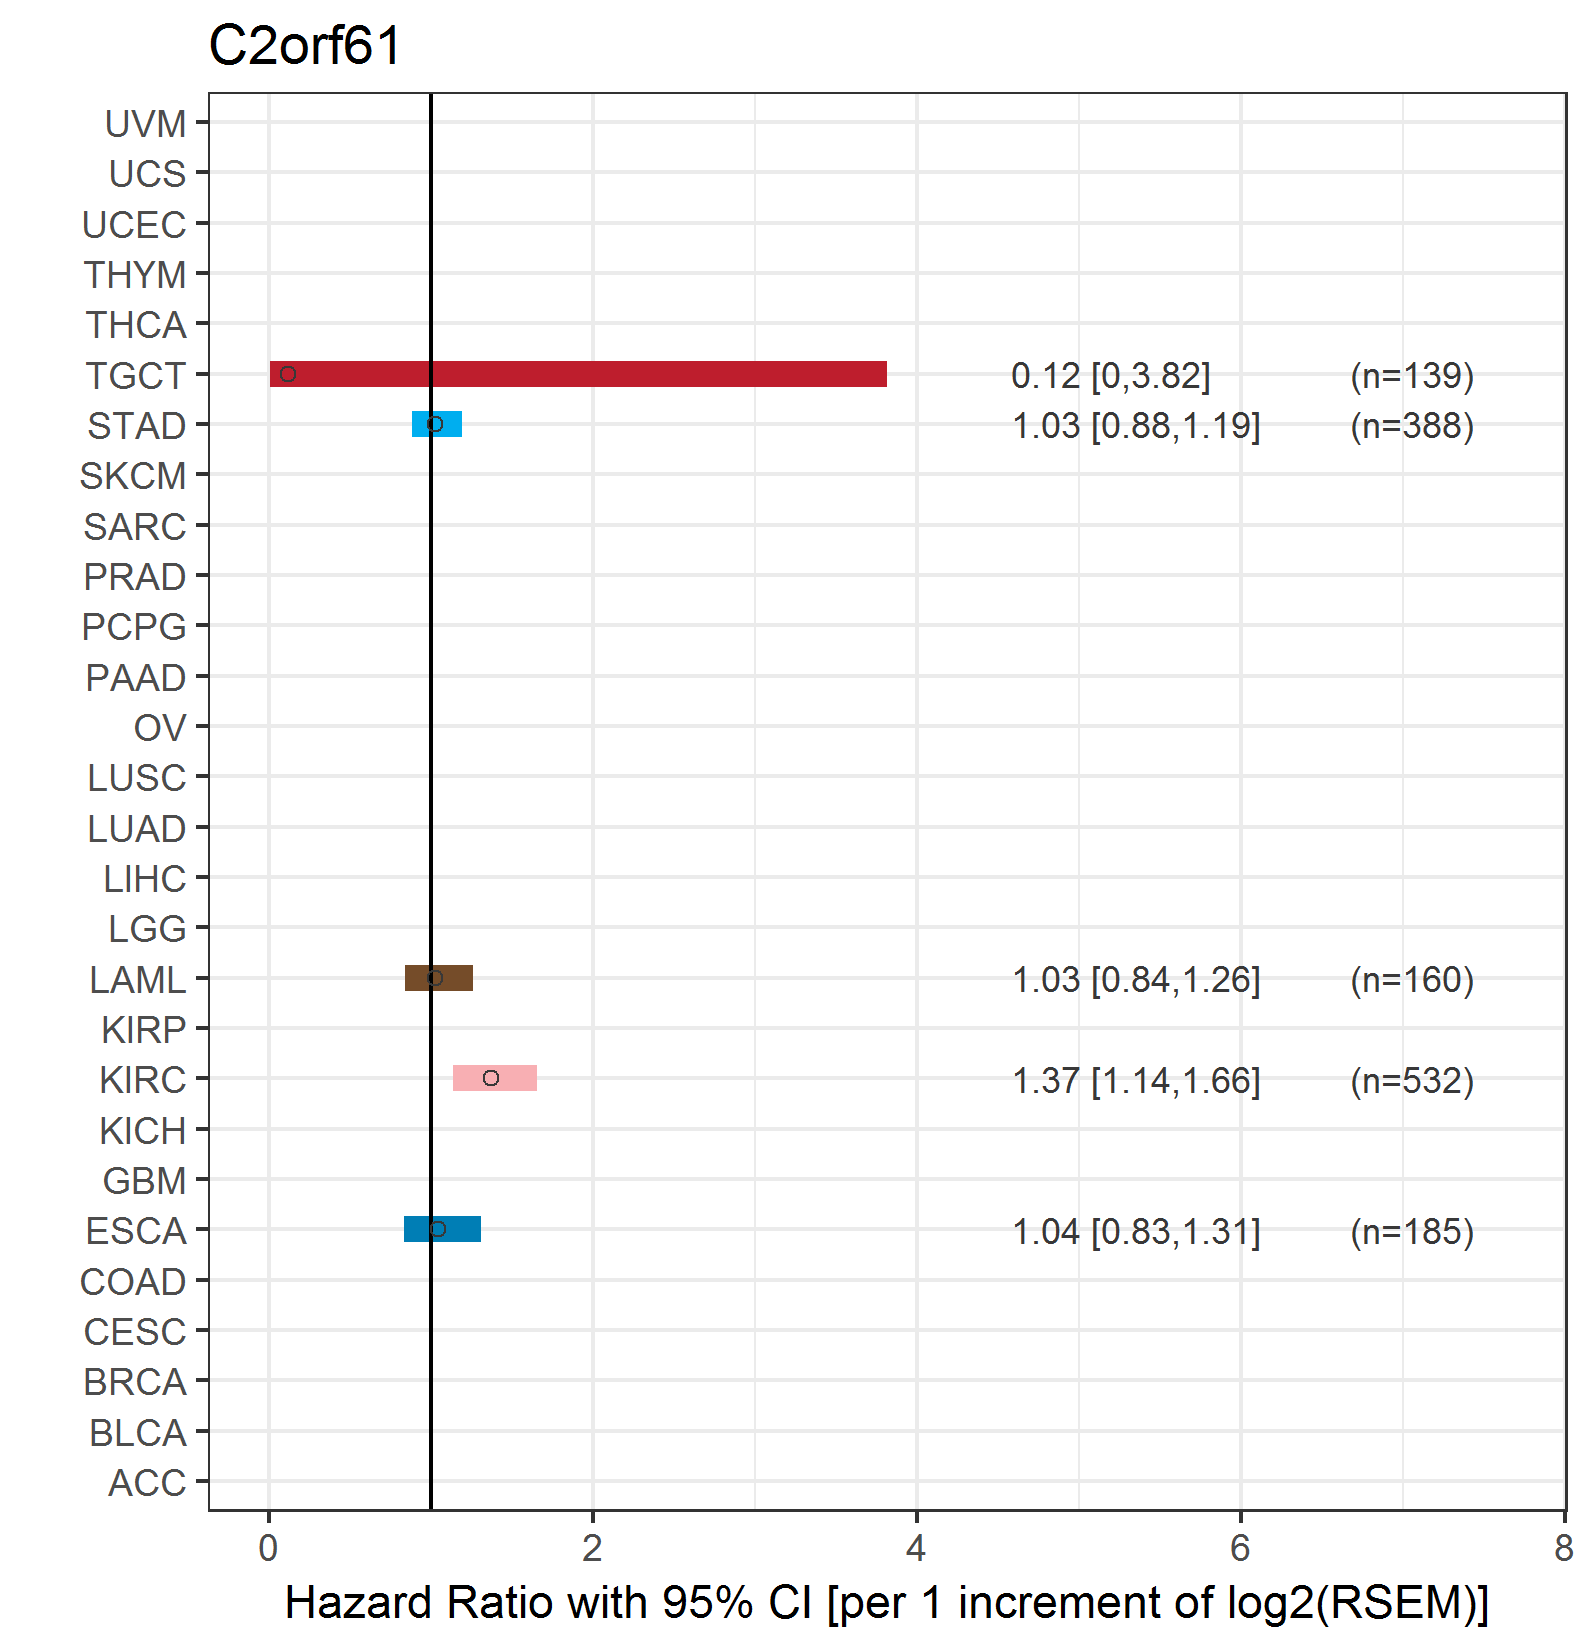
| Forest plot of Cox proportional hazard ratio (HR) and 95% CI of overall survival (OS) using 28 cancer types (TCGA IlluminaHiSeq_RNASeqV2, pan-cancer normalized log2(norm_counts+1) data, version 2016-08-16) (TCGA clinicalMatrix, phenotype data, version 2016-04-27) * Click on the image enlarge it in a new window. |
 |
| Forest plot of Cox proportional hazard ratio (HR) and 95% CI of relapse free survival (RFS) using 28 cancer types (TCGA IlluminaHiSeq_RNASeqV2, pan-cancer normalized log2(norm_counts+1) data, version 2016-08-16) (TCGA clinicalMatrix, phenotype data, version 2016-04-27) * Click on the image enlarge it in a new window. |
 |
| Top |
| TissGeneClin for C2orf61 |
| TissGeneDrug for C2orf61 |
| Drug information targeting TissGene (DrugBank Version 5.0.6, 2017-04-01) |
| DrugBank ID | Drug name | Drug activity | Drug type | Drug status |
| Top |
| TissGeneDisease for C2orf61 |
| Disease information associated with TissGene (DisGeNet, 2016-06-01) |
| Disease ID | Disease name | # pubmeds | Source |
|
Copyright 2016-Present - The University of Texas Health Science Center at Houston (UTHealth) Web File Viewing | How to Report, Fraud, Waste and Abuse | State of Texas | Statewide Search | Texas Homeland Security | Site Policies |