 |
| |
| |
| |
| |
| |
| |
|

| TissGeneSummary for CAGE1 |
 Gene summary Gene summary |
| Basic gene information | Gene symbol | CAGE1 |
| Gene name | cancer antigen 1 | |
| Synonyms | CT3|CT95|CTAG3|bA69L16.7 | |
| Cytomap | UCSC genome browser: 6p24.3 | |
| Type of gene | protein-coding | |
| RefGenes | NM_175745.3, NM_001170692.1,NM_001170693.1,NM_205864.2, | |
| Description | cancer-associated gene 1 proteincancer/testis antigen 3cancer/testis antigen 95cancer/testis antigen gene 1 | |
| Modification date | 20141207 | |
| dbXrefs | MIM : 608304 | |
| HGNC : HGNC | ||
| Ensembl : ENSG00000164304 | ||
| HPRD : 10511 | ||
| Vega : OTTHUMG00000014200 | ||
| Protein | UniProt: go to UniProt's Cross Reference DB Table | |
| Expression | CleanEX: HS_CAGE1 | |
| BioGPS: 285782 | ||
| Pathway | NCI Pathway Interaction Database: CAGE1 | |
| KEGG: CAGE1 | ||
| REACTOME: CAGE1 | ||
| Pathway Commons: CAGE1 | ||
| Context | iHOP: CAGE1 | |
| ligand binding site mutation search in PubMed: CAGE1 | ||
| UCL Cancer Institute: CAGE1 | ||
| Assigned class in TissGDB* | C | |
| Included tissue-specific gene expression resources | HPA,GTEx | |
| Specific-tissues in normal samples (assigned by TissGDB using HPA, TiGER, and GTEx) | Testis | |
| Cancer types related to the specific-tissues in cancer samples (assigned by TissGDB using TCGA) | TGCT | |
| Reference showing the relevant tissue of CAGE1 | ||
| Description by TissGene annotations | ||
| * Class A consists of genes with literature evidence and is part of the cTissGenes. Class B consists of only cTissGenes without additional evidence. The remaining genes belong to Class C. |
| Gene ontology having evidence of Inferred from Direct Assay (IDA) from Entrez |
| GO ID | GO term | PubMed ID |
| Top |
| TissGeneExp for CAGE1 |
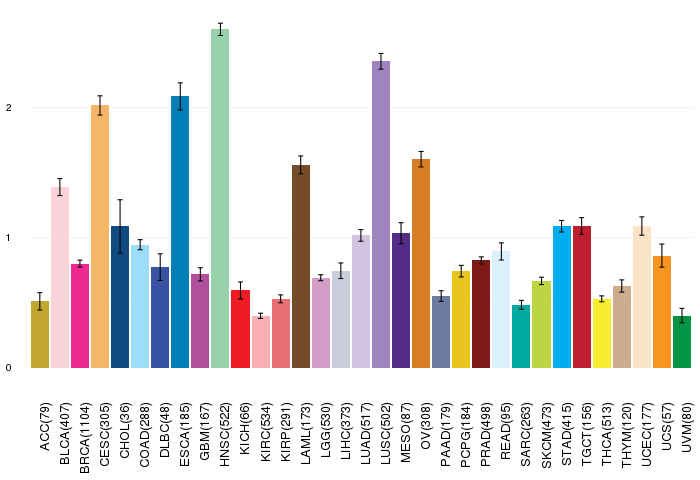
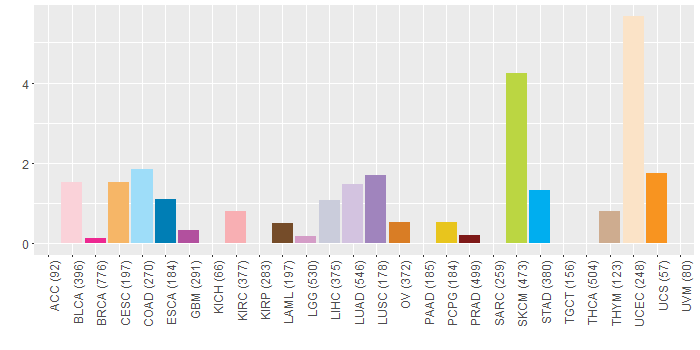
| Gene expressions across 28 cancer types (X-axis: cancer type and Y-axis: log2(norm_counts+1)) (TCGA IlluminaHiSeq_RNASeqV2, pan-cancer normalized log2(norm_counts+1) data, version 2016-08-16) |
 |
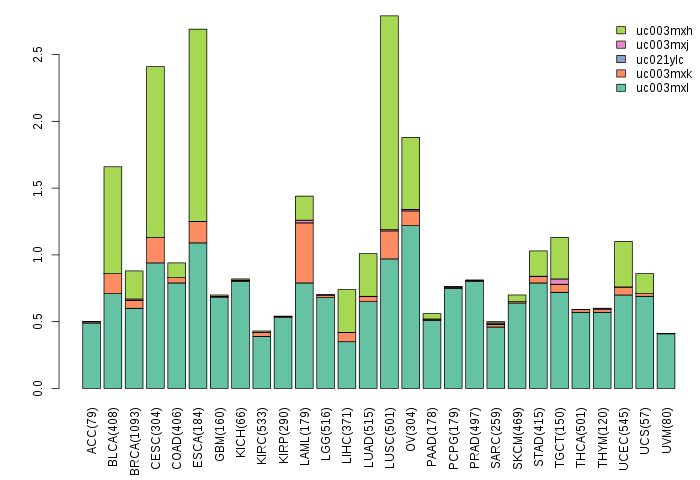
| Gene isoform expressions across 28 cancer types (X-axis: cancer type and Y-axis: log2(norm_counts+1)) (TCGA pan-cancer tcga_rsem_isoform_tpm, version 2016-09-01) |
 |
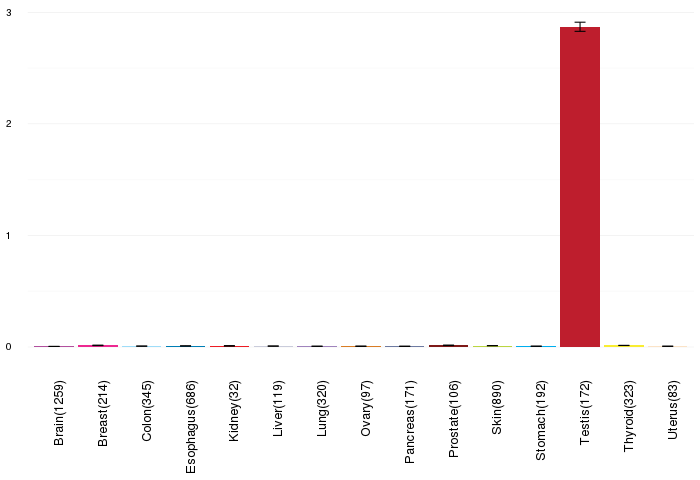
| Gene expressions across normal tissues of GTEx data (GTEx GTEx_Analysis_v6_RNA-seq_RNA-SeQCv1.1.8_gene_rpkm.gct) - Here, we shows the matched tissue types only among our 28 cancer types. |
 |
| Different expressions across 14 cancer types with more than 10 samples between matched tumors and normals (X-axis: cancer type and Y-axis: log2(norm_counts+1)) (TCGA IlluminaHiSeq_RNASeqV2, pan-cancer normalized log2(norm_counts+1) data, version 2016-08-16) |
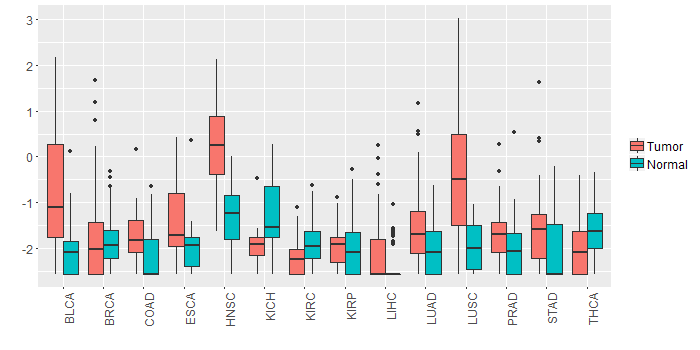 |
| - Significantly differentially expressed cancer types and information. (|Fold change|>1 and FDR<0.05) |
| Cancer type | Mean(exp) in tumor | Mean(exp) in matched normal | Log2FC | P-val. | FDR |
| LUSC | -0.420891616 | -1.927224949 | 1.506333333 | 1.43E-10 | 5.30E-10 |
| HNSC | 0.234560094 | -1.32551665 | 1.560076744 | 7.23E-13 | 2.85E-11 |
| BLCA | -0.749823505 | -1.998497189 | 1.248673684 | 0.00149 | 0.009921437 |
| Top |
| TissGene-miRNA for CAGE1 |
| Significantly anti-correlated miRNAs of TissGene across 28 cancer types (Gene-miRNA relations from TargetScanHuman Relsease 7.1, Conserved_Site_Context_Scores.txt.zip, 06.01.2016) (TCGA IlluminaHiSeq_miRNASeq, log2(RPM+1) data, version 2016-11-21) (TCGA IlluminaHiSeq_RNASeqV2, log2(normalized_count+1) data, version 2016-08-16) (Spearman’s Rank Correlation (p-value<0.05 and coefficient<-0.25)) |
| Cancer type | miRNA id | miRNA accession | P-val. | Coeff. | # samples |
| Top |
| TissGeneMut for CAGE1 |
| TissGeneSNV for CAGE1 |
| nsSNV counts per each loci. Different colors of circles represent different cancer types. Circle size denotes number of samples. (TCGA somatic mutation (SNPs and small INDELs) data, version 2016-04-25) * Click on the image to enlarge it in a new window. |
 |
 |
| Somatic nucleotide variants of TissGene across 28 cancer types (X-axis: cancer type and Y-axis: % of mutated samples) The numbers in parentheses are numbers of samples with mutation (nsSNVs). (TCGA somatic mutation (SNPs and small INDELs) data, version 2016-04-25) |
 |
| - nsSNVs sorted by frequency. |
| AAchange | Cancer type | # samples |
| p.E476K | SKCM | 4 |
| p.E403K | UCEC | 3 |
| p.R806* | LUAD | 1 |
| p.Q492* | SKCM | 1 |
| p.T103A | LIHC | 1 |
| p.F484L | UCS | 1 |
| p.P233S | SKCM | 1 |
| p.L193I | ESCA | 1 |
| p.E422X | PCPG | 1 |
| p.K796N | LIHC | 1 |
| p.E115K | SKCM | 1 |
| p.I395T | BRCA | 1 |
| p.E99X | COAD | 1 |
| p.N255S | SKCM | 1 |
| p.E740* | UCEC | 1 |
| p.S434F | LGG | 1 |
| p.N544S | HNSC | 1 |
| p.R366S | STAD | 1 |
| p.E334K | SKCM | 1 |
| p.Y721C | UCEC | 1 |
| p.K26X | SKCM | 1 |
| p.E539K | BLCA | 1 |
| p.S543I | UCEC | 1 |
| p.R608* | LUAD | 1 |
| p.T169I | DLBC | 1 |
| p.G715* | HNSC | 1 |
| p.D21N | KIRC | 1 |
| p.K396Q | READ | 1 |
| p.K357T | STAD | 1 |
| p.E437Q | BLCA | 1 |
| p.E307K | BLCA | 1 |
| p.V259A | LIHC | 1 |
| p.S615Y | LUAD | 1 |
| p.E495K | LUAD | 1 |
| p.K608I | LUAD | 1 |
| p.E340K | SKCM | 1 |
| p.I229L | UCEC | 1 |
| p.F214L | UCEC | 1 |
| p.M200L | KIRC | 1 |
| p.Q534* | CESC | 1 |
| p.T131I | STAD | 1 |
| p.K162* | SKCM | 1 |
| p.E242K | SKCM | 1 |
| p.Q41K | LAML | 1 |
| p.L376W | COAD | 1 |
| p.E227* | UCEC | 1 |
| p.H588Y | HNSC | 1 |
| p.V299L | OV | 1 |
| p.A135T | COAD | 1 |
| p.T267I | STAD | 1 |
| p.T586M | GBM | 1 |
| p.E198K | SKCM | 1 |
| p.E422* | PCPG | 1 |
| p.A467T | SKCM | 1 |
| p.N2D | UCEC | 1 |
| p.D754G | UCEC | 1 |
| p.L494R | LUSC | 1 |
| p.S636Y | UCEC | 1 |
| p.K493T | STAD | 1 |
| p.K307T | UCEC | 1 |
| p.Q456* | OV | 1 |
| p.E635K | SKCM | 1 |
| p.E573Q | BLCA | 1 |
| p.S588Y | LUAD | 1 |
| p.L193V | BLCA | 1 |
| p.E251K | SKCM | 1 |
| p.A782P | LUSC | 1 |
| p.E339K | SKCM | 1 |
| p.E451K | THYM | 1 |
| p.H49Q | COAD | 1 |
| p.S486F | SKCM | 1 |
| p.H452Y | HNSC | 1 |
| p.K705N | LUSC | 1 |
| p.Y558C | UCEC | 1 |
| p.A217D | LUAD | 1 |
| p.I576S | UCEC | 1 |
| p.E490K | CESC | 1 |
| p.R553K | SKCM | 1 |
| p.K307N | COAD | 1 |
| p.D535E | STAD | 1 |
| p.E543K | SKCM | 1 |
| p.L628H | LUAD | 1 |
| p.K673R | LIHC | 1 |
| p.E315* | UCEC | 1 |
| p.D546Y | UCEC | 1 |
| p.E203K | SKCM | 1 |
| p.L485F | KIRC | 1 |
| p.H722R | BLCA | 1 |
| p.R835I | BLCA | 1 |
| p.P287L | LUAD | 1 |
| p.P15S | READ | 1 |
| p.P630S | UCEC | 1 |
| p.S298F | UCEC | 1 |
| p.D729N | SKCM | 1 |
| p.R423K | PRAD | 1 |
| p.D719V | SKCM | 1 |
| p.E181K | SKCM | 1 |
| p.R339W | STAD | 1 |
| p.A331T | SKCM | 1 |
| p.A782T | ESCA | 1 |
| p.S786Y | LUAD | 1 |
| p.E83K | CESC | 1 |
| p.E833K | SKCM | 1 |
| p.P220S | SKCM | 1 |
| p.E158A | UCEC | 1 |
| p.N391S | SKCM | 1 |
| p.Q397* | BLCA | 1 |
| p.Q356X | SKCM | 1 |
| Top |
| TissGeneCNV for CAGE1 |
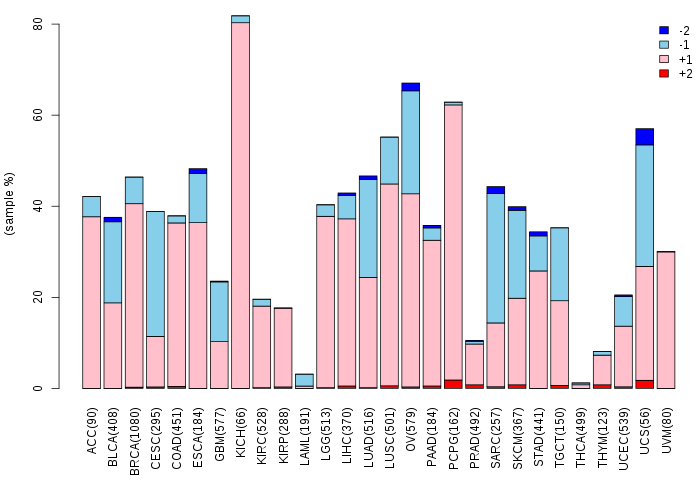
| Copy number variations of TissGene across 28 cancer types (X-axis: cancer type and Y-axis: % of CNV samples) (TCGA Gistic2_CopyNumber_Gistic2_all_data_by_genes, Gistic2 copy number data, version 2016-08-16) |
 |
| Top |
| TissGeneFusions for CAGE1 |
| Fusion genes including TissGene (ChimerDB 3.0, 2016-12-01 and TCGA fusion Portal 2015-12-01) |
| Database | Src | Cancer type | Sample | Fusion gene | ORF | 5'-gene BP | 3'-gene BP |
| Chimerdb3.0 | TopHat-Fusion | BRCA | TCGA-A2-A0CX-01A | SSR1-CAGE1 | Out-of-Frame | chr6:7301542 | chr6:7330120 |
| TCGAfusionPortal | PRADA | BRCA | TCGA-A2-A0CX-01A | SSR1-CAGE1 | Out-of-frame | Chr6:7301543 | Chr6:7330121 |
| Top |
| TissGeneNet for CAGE1 |
| Co-expressed gene networks based on protein-protein interaction data (CePIN) (TCGA IlluminaHiSeq_RNASeqV2, pan-cancer normalized log2(norm_counts+1) data, version 2016-08-16) (PINA2 ppi data) |
| Top |
| TissGeneProg for CAGE1 |
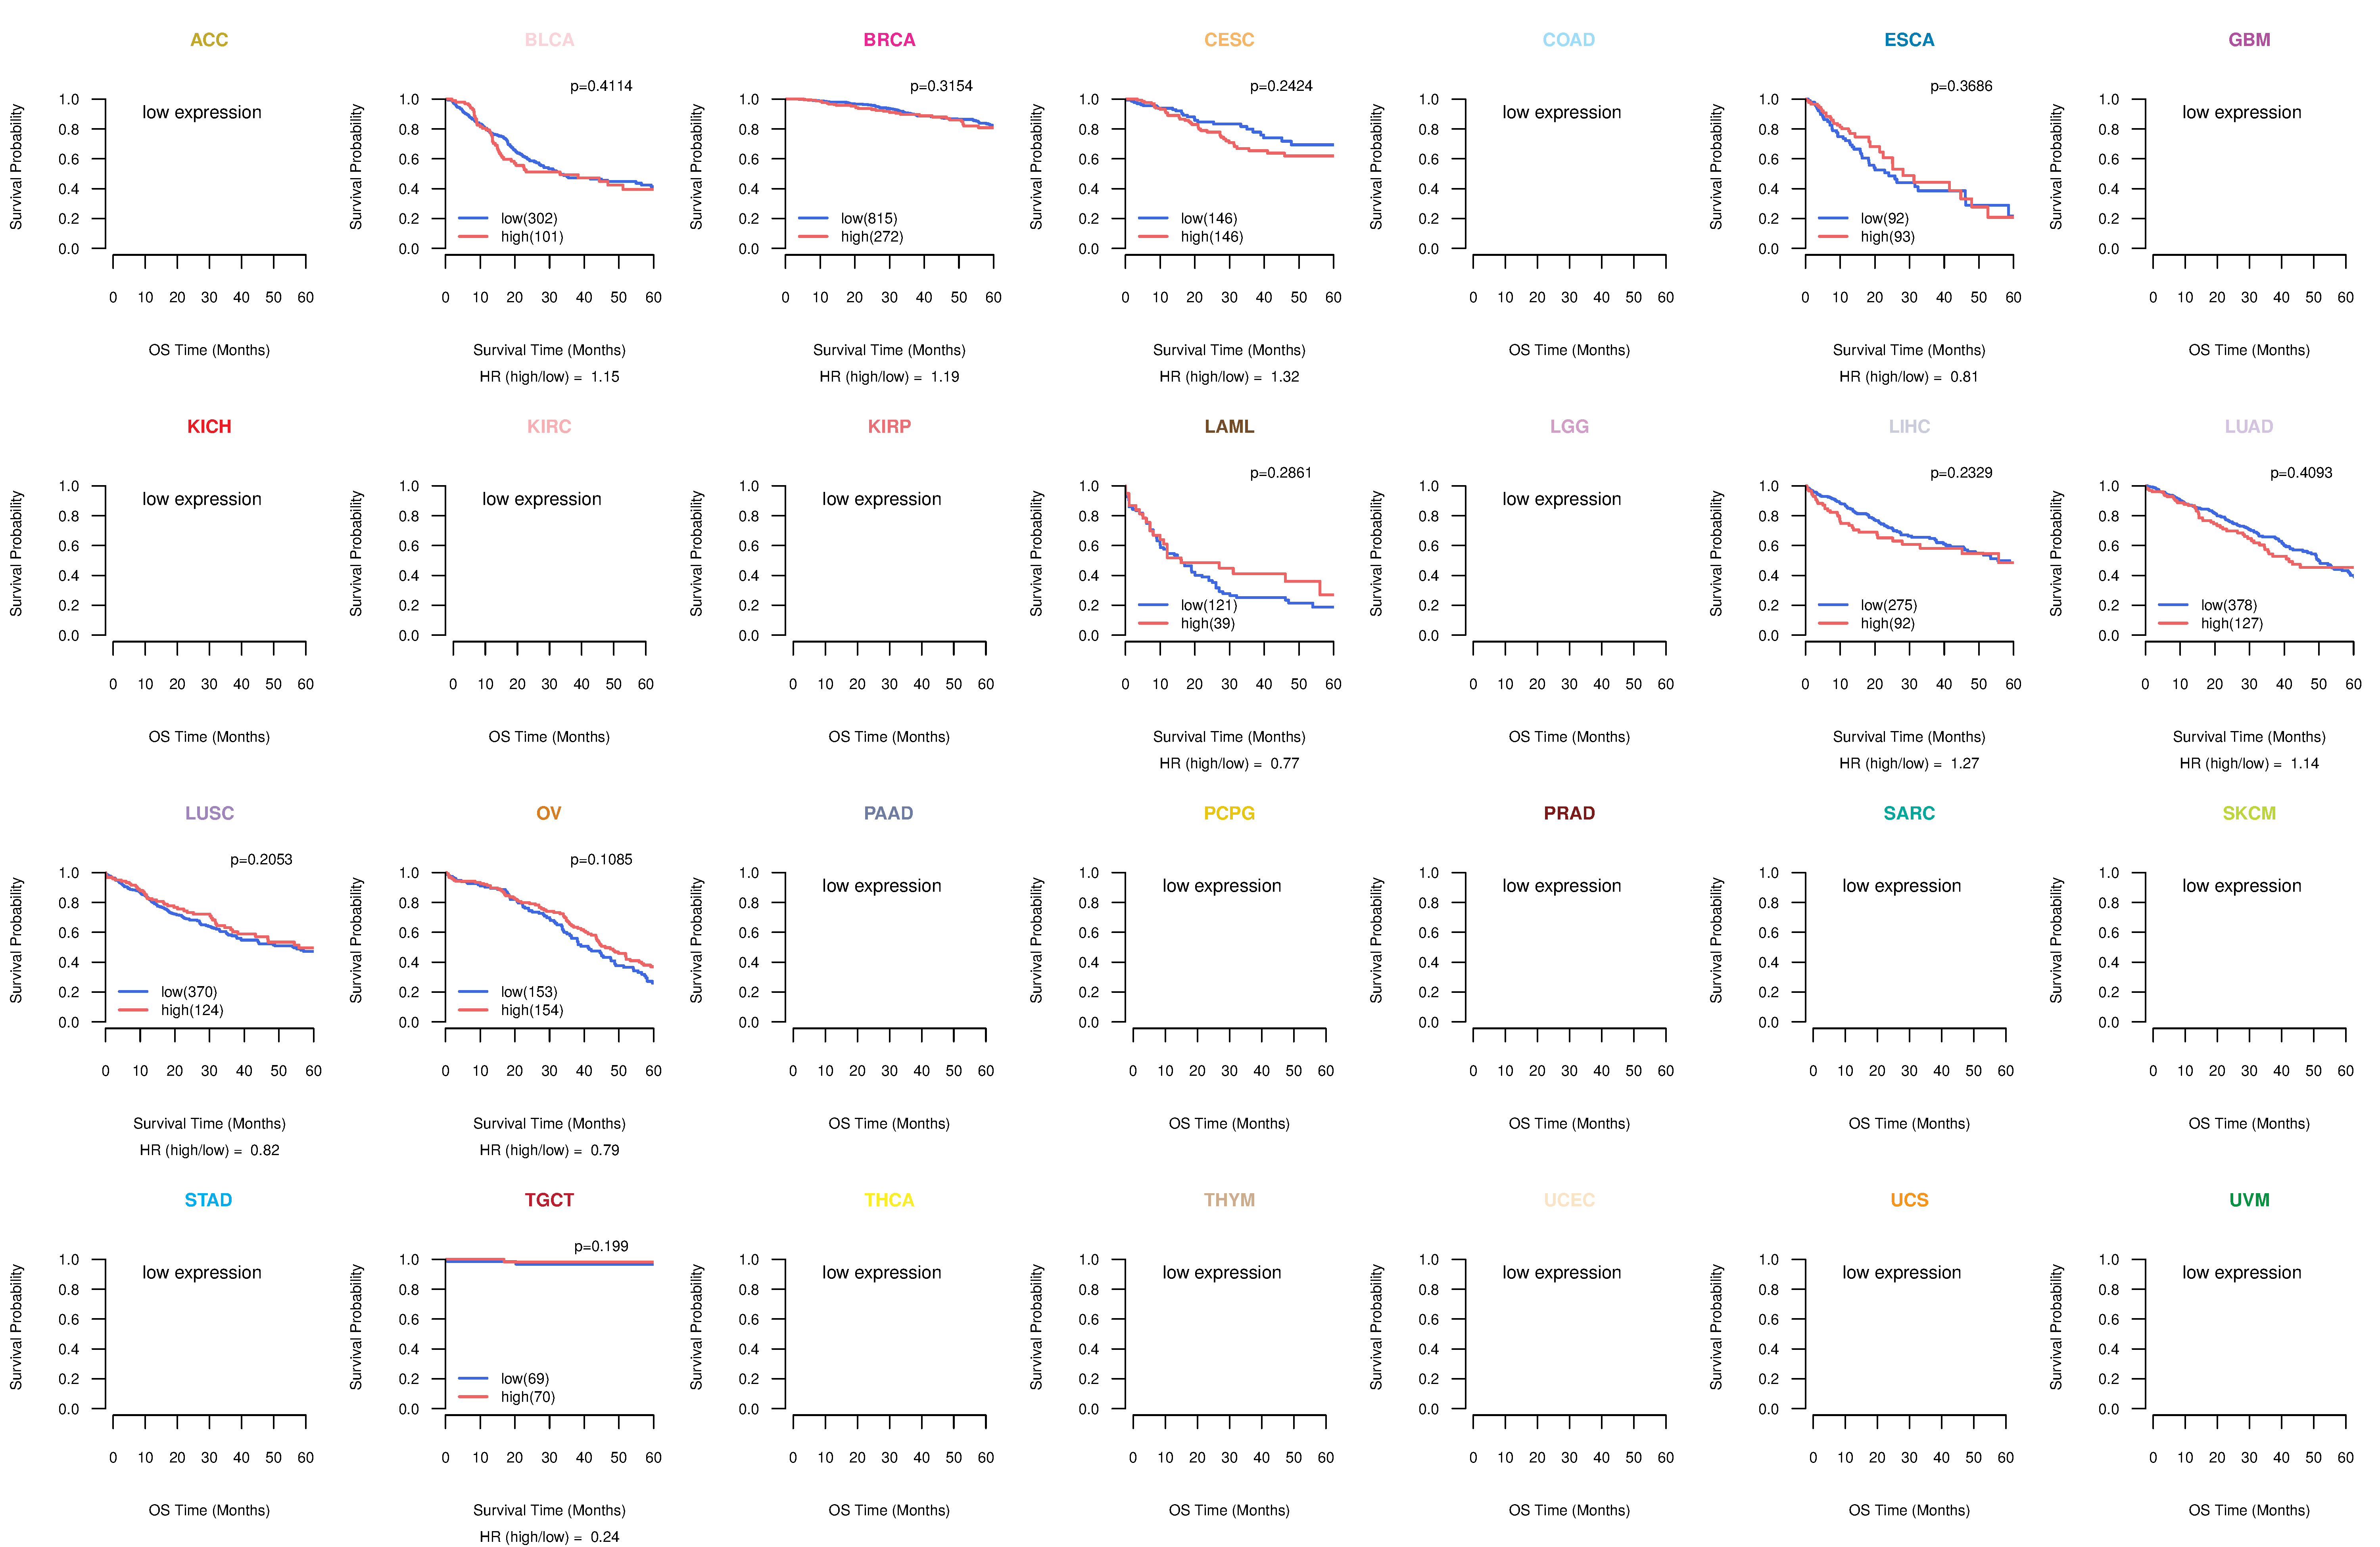
| Kaplan-Meier plots with logrank tests of overall survival (OS) using 28 cancer types (TCGA IlluminaHiSeq_RNASeqV2, pan-cancer normalized log2(norm_counts+1) data, version 2016-08-16) (TCGA clinicalMatrix, phenotype data, version 2016-04-27) * Click on the image to enlarge it in a new window. |
 |
| Kaplan-Meier plots with logrank test of relapse free survival (RFS) using 28 cancer types (TCGA IlluminaHiSeq_RNASeqV2, pan-cancer normalized log2(norm_counts+1) data, version 2016-08-16) (TCGA clinicalMatrix, phenotype data, version 2016-04-27) * Click on the image enlarge it in a new window. |
 |
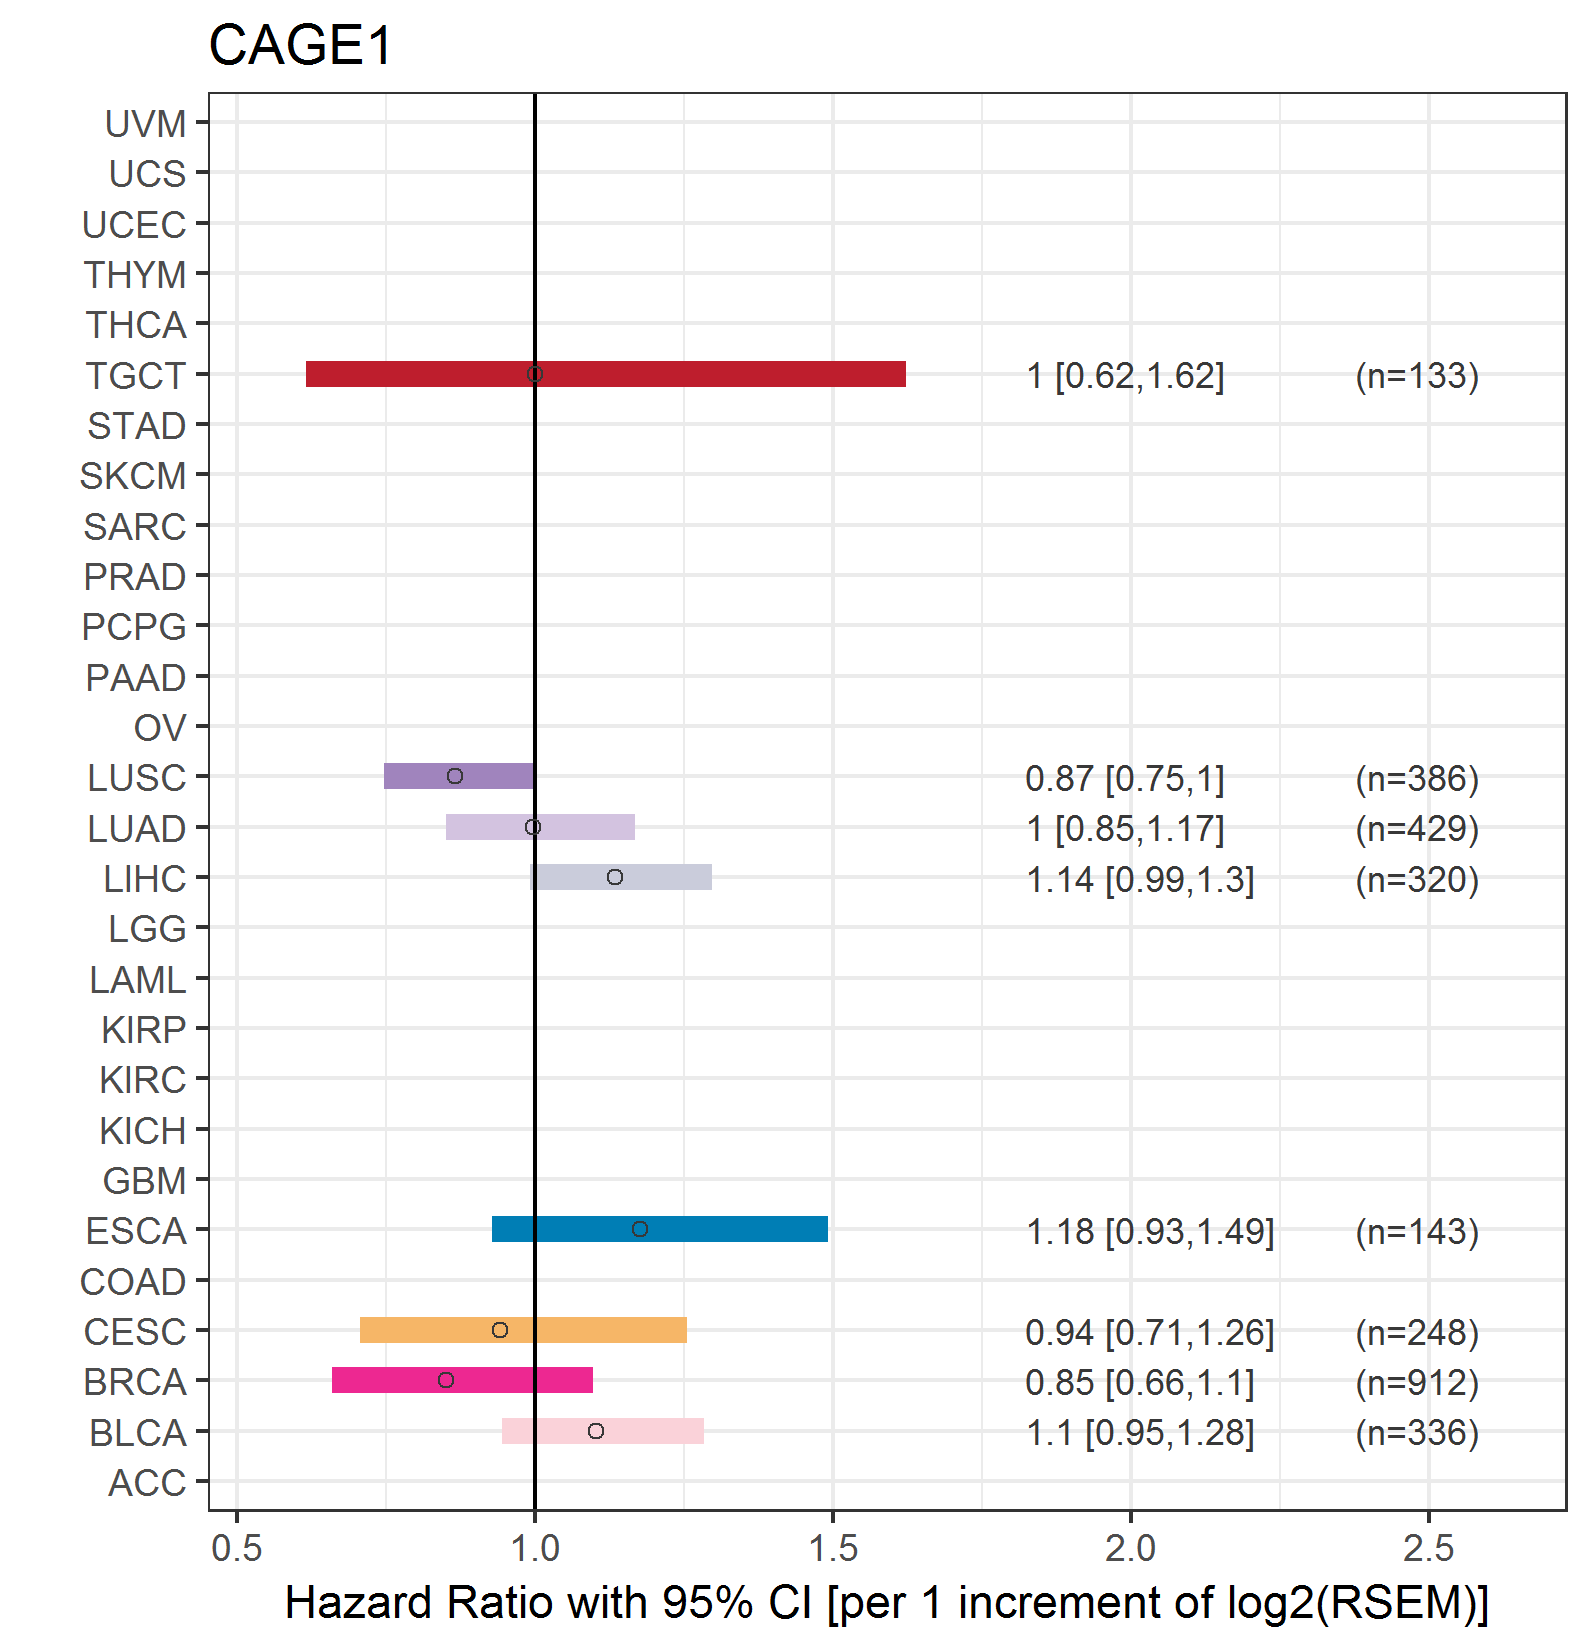
| Forest plot of Cox proportional hazard ratio (HR) and 95% CI of overall survival (OS) using 28 cancer types (TCGA IlluminaHiSeq_RNASeqV2, pan-cancer normalized log2(norm_counts+1) data, version 2016-08-16) (TCGA clinicalMatrix, phenotype data, version 2016-04-27) * Click on the image enlarge it in a new window. |
 |
| Forest plot of Cox proportional hazard ratio (HR) and 95% CI of relapse free survival (RFS) using 28 cancer types (TCGA IlluminaHiSeq_RNASeqV2, pan-cancer normalized log2(norm_counts+1) data, version 2016-08-16) (TCGA clinicalMatrix, phenotype data, version 2016-04-27) * Click on the image enlarge it in a new window. |
 |
| Top |
| TissGeneClin for CAGE1 |
| TissGeneDrug for CAGE1 |
| Drug information targeting TissGene (DrugBank Version 5.0.6, 2017-04-01) |
| DrugBank ID | Drug name | Drug activity | Drug type | Drug status |
| Top |
| TissGeneDisease for CAGE1 |
| Disease information associated with TissGene (DisGeNet, 2016-06-01) |
| Disease ID | Disease name | # pubmeds | Source |
| umls:C0596263 | Carcinogenesis | 2 | BeFree |
| umls:C0001418 | Adenocarcinoma | 1 | BeFree,LHGDN |
|
Copyright 2016-Present - The University of Texas Health Science Center at Houston (UTHealth) Web File Viewing | How to Report, Fraud, Waste and Abuse | State of Texas | Statewide Search | Texas Homeland Security | Site Policies |