 |
| |
| |
| |
| |
| |
| |
|

| TissGeneSummary for GRIA4 |
 Gene summary Gene summary |
| Basic gene information | Gene symbol | GRIA4 |
| Gene name | glutamate receptor, ionotropic, AMPA 4 | |
| Synonyms | GLUR4|GLUR4C|GLURD|GluA4 | |
| Cytomap | UCSC genome browser: 11q22 | |
| Type of gene | protein-coding | |
| RefGenes | NM_000829.3, NM_001077243.2,NM_001077244.1,NM_001112812.1,NR_046356.1, | |
| Description | AMPA-selective glutamate receptor 4gluR-4gluR-Dglutamate receptor 4glutamate receptor, ionotrophic, AMPA 4 | |
| Modification date | 20141207 | |
| dbXrefs | MIM : 138246 | |
| HGNC : HGNC | ||
| Ensembl : ENSG00000152578 | ||
| HPRD : 00694 | ||
| Vega : OTTHUMG00000166236 | ||
| Protein | UniProt: go to UniProt's Cross Reference DB Table | |
| Expression | CleanEX: HS_GRIA4 | |
| BioGPS: 2893 | ||
| Pathway | NCI Pathway Interaction Database: GRIA4 | |
| KEGG: GRIA4 | ||
| REACTOME: GRIA4 | ||
| Pathway Commons: GRIA4 | ||
| Context | iHOP: GRIA4 | |
| ligand binding site mutation search in PubMed: GRIA4 | ||
| UCL Cancer Institute: GRIA4 | ||
| Assigned class in TissGDB* | C | |
| Included tissue-specific gene expression resources | HPA,TiGER | |
| Specific-tissues in normal samples (assigned by TissGDB using HPA, TiGER, and GTEx) | BrainSoft tissueEye | |
| Cancer types related to the specific-tissues in cancer samples (assigned by TissGDB using TCGA) | GBM,LGGSARCUVM | |
| Reference showing the relevant tissue of GRIA4 | ||
| Description by TissGene annotations | Protective TissGene in OS | |
| * Class A consists of genes with literature evidence and is part of the cTissGenes. Class B consists of only cTissGenes without additional evidence. The remaining genes belong to Class C. |
| Gene ontology having evidence of Inferred from Direct Assay (IDA) from Entrez |
| GO ID | GO term | PubMed ID | GO:0035235 | ionotropic glutamate receptor signaling pathway | 21172611 | GO:0035235 | ionotropic glutamate receptor signaling pathway | 21172611 |
| Top |
| TissGeneExp for GRIA4 |
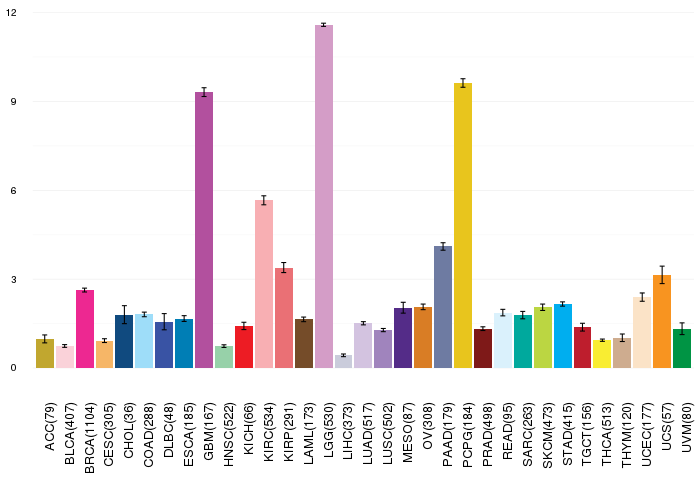
| Gene expressions across 28 cancer types (X-axis: cancer type and Y-axis: log2(norm_counts+1)) (TCGA IlluminaHiSeq_RNASeqV2, pan-cancer normalized log2(norm_counts+1) data, version 2016-08-16) |
 |
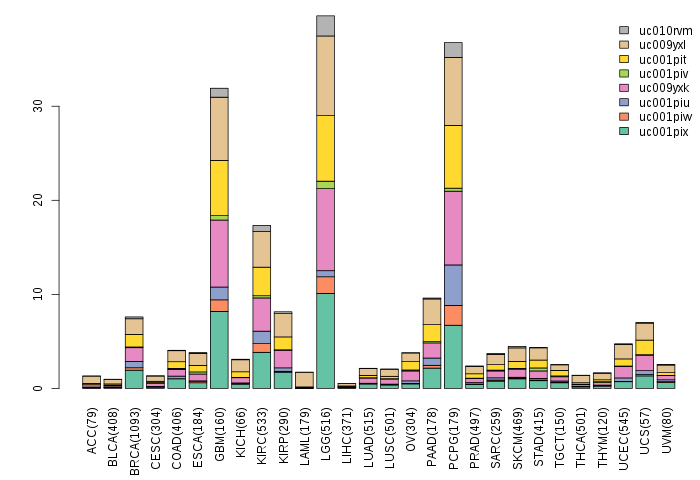
| Gene isoform expressions across 28 cancer types (X-axis: cancer type and Y-axis: log2(norm_counts+1)) (TCGA pan-cancer tcga_rsem_isoform_tpm, version 2016-09-01) |
 |
| Gene expressions across normal tissues of GTEx data (GTEx GTEx_Analysis_v6_RNA-seq_RNA-SeQCv1.1.8_gene_rpkm.gct) - Here, we shows the matched tissue types only among our 28 cancer types. |
 |
| Different expressions across 14 cancer types with more than 10 samples between matched tumors and normals (X-axis: cancer type and Y-axis: log2(norm_counts+1)) (TCGA IlluminaHiSeq_RNASeqV2, pan-cancer normalized log2(norm_counts+1) data, version 2016-08-16) |
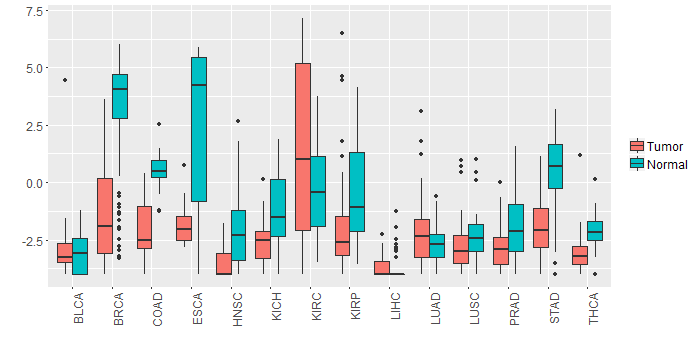 |
| - Significantly differentially expressed cancer types and information. (|Fold change|>1 and FDR<0.05) |
| Cancer type | Mean(exp) in tumor | Mean(exp) in matched normal | Log2FC | P-val. | FDR |
| BRCA | -1.333144107 | 3.213142735 | -4.546286842 | 2.26E-37 | 5.09E-36 |
| STAD | -1.903096738 | 0.324975137 | -2.228071875 | 3.16E-06 | 4.39E-05 |
| HNSC | -3.505733948 | -1.992138599 | -1.513595349 | 3.31E-06 | 2.17E-05 |
| COAD | -2.164858277 | 0.511872493 | -2.676730769 | 5.65E-12 | 1.24E-10 |
| ESCA | -1.791878556 | 2.210675989 | -4.002554545 | 0.00544 | 0.041863529 |
| KICH | -2.590752738 | -1.138472738 | -1.45228 | 0.000542 | 0.001227716 |
| KIRC | 1.43916854 | -0.387723127 | 1.826891667 | 0.000246 | 0.000499353 |
| Top |
| TissGene-miRNA for GRIA4 |
| Significantly anti-correlated miRNAs of TissGene across 28 cancer types (Gene-miRNA relations from TargetScanHuman Relsease 7.1, Conserved_Site_Context_Scores.txt.zip, 06.01.2016) (TCGA IlluminaHiSeq_miRNASeq, log2(RPM+1) data, version 2016-11-21) (TCGA IlluminaHiSeq_RNASeqV2, log2(normalized_count+1) data, version 2016-08-16) (Spearman’s Rank Correlation (p-value<0.05 and coefficient<-0.25)) |
| Cancer type | miRNA id | miRNA accession | P-val. | Coeff. | # samples |
| Top |
| TissGeneMut for GRIA4 |
| TissGeneSNV for GRIA4 |
| nsSNV counts per each loci. Different colors of circles represent different cancer types. Circle size denotes number of samples. (TCGA somatic mutation (SNPs and small INDELs) data, version 2016-04-25) * Click on the image to enlarge it in a new window. |
 |
 |
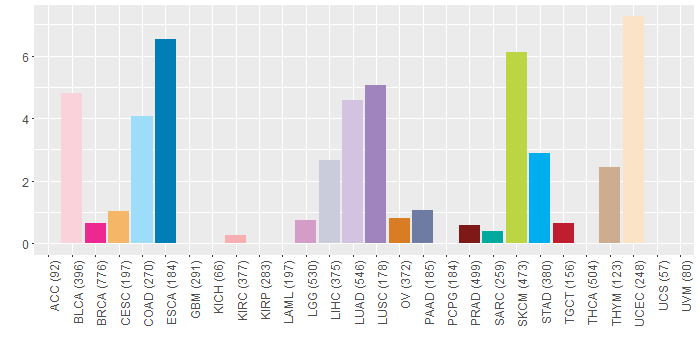
| Somatic nucleotide variants of TissGene across 28 cancer types (X-axis: cancer type and Y-axis: % of mutated samples) The numbers in parentheses are numbers of samples with mutation (nsSNVs). (TCGA somatic mutation (SNPs and small INDELs) data, version 2016-04-25) |
 |
| - nsSNVs sorted by frequency. |
| AAchange | Cancer type | # samples |
| p.V780I | COAD | 3 |
| p.K295E | LGG | 2 |
| p.E150K | SKCM | 2 |
| p.R45* | UCEC | 2 |
| p.S636L | LUAD | 2 |
| p.G747E | SKCM | 2 |
| p.I526T | LUAD | 1 |
| p.D344Y | LUAD | 1 |
| p.I460M | BLCA | 1 |
| p.M345T | HNSC | 1 |
| p.T758R | HNSC | 1 |
| p.R347K | CESC | 1 |
| p.S810N | STAD | 1 |
| p.C84Y | THYM | 1 |
| p.D401N | BLCA | 1 |
| p.R507L | UCEC | 1 |
| p.F154I | THYM | 1 |
| p.V560M | LUAD | 1 |
| p.K173N | SKCM | 1 |
| p.G801R | SKCM | 1 |
| p.I48V | BLCA | 1 |
| p.T105N | LUAD | 1 |
| p.E727* | HNSC | 1 |
| p.Q588X | LIHC | 1 |
| p.N641K | HNSC | 1 |
| p.A112S | ESCA | 1 |
| p.G799X | STAD | 1 |
| p.E710X | THYM | 1 |
| p.P384H | OV | 1 |
| p.R682T | TGCT | 1 |
| p.K848_splice | LUSC | 1 |
| p.L618P | BLCA | 1 |
| p.F95I | SKCM | 1 |
| p.T806M | READ | 1 |
| p.L50F | READ | 1 |
| p.D364H | BLCA | 1 |
| p.G796E | KIRC | 1 |
| p.A174T | STAD | 1 |
| p.R35Q | COAD | 1 |
| p.F49C | ESCA | 1 |
| p.S248Y | UCEC | 1 |
| p.M518I | SKCM | 1 |
| p.V490D | LUAD | 1 |
| p.E413D | BRCA | 1 |
| p.G535R | SKCM | 1 |
| p.E216A | LUSC | 1 |
| p.M271I | SKCM | 1 |
| p.G342E | SKCM | 1 |
| p.V703L | READ | 1 |
| p.K515N | LUAD | 1 |
| p.A112T | LGG | 1 |
| p.G816S | BLCA | 1 |
| p.P338L | SKCM | 1 |
| p.P585S | COAD | 1 |
| p.G779S | LUAD | 1 |
| p.V181I | BLCA | 1 |
| p.A828T | UCEC | 1 |
| p.R324M | UCEC | 1 |
| p.R45Q | UCEC | 1 |
| p.E880K | READ | 1 |
| p.E200V | LIHC | 1 |
| p.S514F | LUAD | 1 |
| p.S58L | BLCA | 1 |
| p.L501V | HNSC | 1 |
| p.I48V | SARC | 1 |
| p.R716H | PRAD | 1 |
| p.L198P | LUAD | 1 |
| p.R45L | ESCA | 1 |
| p.D541N | SKCM | 1 |
| p.G21R | BLCA | 1 |
| p.L770F | UCEC | 1 |
| p.Y754C | LUAD | 1 |
| p.E495D | UCEC | 1 |
| p.V402L | ESCA | 1 |
| p.R368L | UCEC | 1 |
| p.Q7H | BRCA | 1 |
| p.A668D | PAAD | 1 |
| p.L827F | HNSC | 1 |
| p.D283E | SKCM | 1 |
| p.S514Y | ESCA | 1 |
| p.S102L | UCEC | 1 |
| p.R45X | STAD | 1 |
| p.T416K | LUAD | 1 |
| p.L562V | ESCA | 1 |
| p.F49C | UCEC | 1 |
| p.E495D | COAD | 1 |
| p.R353* | SKCM | 1 |
| p.Q355* | UCEC | 1 |
| p.G581A | COAD | 1 |
| p.E843D | STAD | 1 |
| p.Q341H | ESCA | 1 |
| p.D38Y | UCEC | 1 |
| p.I884M | STAD | 1 |
| p.L64M | BLCA | 1 |
| p.D791N | SKCM | 1 |
| p.K721N | LIHC | 1 |
| p.E435D | OV | 1 |
| p.W279R | LIHC | 1 |
| p.F154S | HNSC | 1 |
| p.R860K | SKCM | 1 |
| p.F629L | UCEC | 1 |
| p.P338Q | SKCM | 1 |
| p.N433D | UCEC | 1 |
| p.A19T | BRCA | 1 |
| p.Y446C | LIHC | 1 |
| p.R353Q | SKCM | 1 |
| p.S128R | LUSC | 1 |
| p.R278C | SKCM | 1 |
| p.G96* | UCEC | 1 |
| p.V560M | STAD | 1 |
| p.E150K | STAD | 1 |
| p.E735Q | CESC | 1 |
| p.R35* | UCEC | 1 |
| p.E291D | LUSC | 1 |
| p.G581E | SKCM | 1 |
| p.H457R | LUSC | 1 |
| p.W151* | SKCM | 1 |
| p.V780I | BLCA | 1 |
| p.V397F | LUAD | 1 |
| p.R347K | PRAD | 1 |
| p.S810C | LGG | 1 |
| p.Y462C | SKCM | 1 |
| p.H114N | LUAD | 1 |
| p.A499S | LUSC | 1 |
| p.T742M | UCEC | 1 |
| p.T879A | STAD | 1 |
| p.N433S | HNSC | 1 |
| p.Y87* | LUAD | 1 |
| p.P654L | SKCM | 1 |
| p.D401Y | UCEC | 1 |
| p.R353X | SKCM | 1 |
| p.R217T | STAD | 1 |
| p.S852T | LGG | 1 |
| p.N81H | READ | 1 |
| p.K851R | BRCA | 1 |
| p.G801E | SKCM | 1 |
| p.R353Q | READ | 1 |
| p.F704L | ESCA | 1 |
| p.D580Y | LIHC | 1 |
| p.E666X | ESCA | 1 |
| p.Q7H | UCEC | 1 |
| p.M276I | BLCA | 1 |
| p.V745L | BLCA | 1 |
| p.T73K | LUSC | 1 |
| p.G304E | LIHC | 1 |
| p.A112T | ESCA | 1 |
| p.A643V | ESCA | 1 |
| p.G326A | BLCA | 1 |
| p.G359E | SKCM | 1 |
| p.K774T | LIHC | 1 |
| p.E72Q | BLCA | 1 |
| p.E592* | BLCA | 1 |
| p.G256R | SKCM | 1 |
| p.W151X | SKCM | 1 |
| p.S636L | BLCA | 1 |
| p.D469V | HNSC | 1 |
| p.R650G | LIHC | 1 |
| p.G824S | COAD | 1 |
| p.E488X | COAD | 1 |
| p.R621Q | READ | 1 |
| p.Y235H | STAD | 1 |
| p.Q318K | LUAD | 1 |
| p.G359E | HNSC | 1 |
| p.A723V | READ | 1 |
| p.E206Q | COAD | 1 |
| p.C611F | LUAD | 1 |
| p.T382A | STAD | 1 |
| p.P338S | SKCM | 1 |
| p.A74V | ESCA | 1 |
| p.D877Y | BLCA | 1 |
| p.N75K | LUAD | 1 |
| p.P654L | BLCA | 1 |
| p.G356V | LUAD | 1 |
| p.D375E | LIHC | 1 |
| p.G868E | SKCM | 1 |
| p.W693C | BRCA | 1 |
| p.L113I | HNSC | 1 |
| p.E40K | UCEC | 1 |
| p.I170V | LUAD | 1 |
| p.P294L | STAD | 1 |
| p.L825F | LUSC | 1 |
| p.S137* | LUSC | 1 |
| p.G799R | LUAD | 1 |
| p.H434Y | SKCM | 1 |
| p.R714H | COAD | 1 |
| p.A455P | HNSC | 1 |
| p.G470E | SKCM | 1 |
| p.A112T | COAD | 1 |
| p.V192F | LUSC | 1 |
| p.F83L | STAD | 1 |
| p.E127K | SKCM | 1 |
| p.L867S | BLCA | 1 |
| p.E583V | BLCA | 1 |
| p.S698* | LUAD | 1 |
| p.E794K | BLCA | 1 |
| p.S538F | SKCM | 1 |
| p.E150G | PRAD | 1 |
| p.G798R | SKCM | 1 |
| p.Q341X | COAD | 1 |
| p.R716G | LUAD | 1 |
| p.G229* | UCEC | 1 |
| p.N63K | SKCM | 1 |
| p.R45* | STAD | 1 |
| p.D344E | LUAD | 1 |
| p.D791N | PAAD | 1 |
| p.R162S | LIHC | 1 |
| p.L32P | OV | 1 |
| Top |
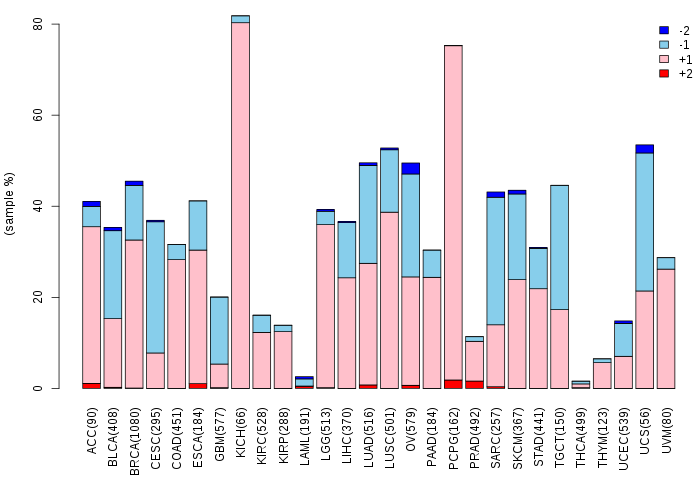
| TissGeneCNV for GRIA4 |
| Copy number variations of TissGene across 28 cancer types (X-axis: cancer type and Y-axis: % of CNV samples) (TCGA Gistic2_CopyNumber_Gistic2_all_data_by_genes, Gistic2 copy number data, version 2016-08-16) |
 |
| Top |
| TissGeneFusions for GRIA4 |
| Fusion genes including TissGene (ChimerDB 3.0, 2016-12-01 and TCGA fusion Portal 2015-12-01) |
| Database | Src | Cancer type | Sample | Fusion gene | ORF | 5'-gene BP | 3'-gene BP |
| Chimerdb3.0 | ChiTaRs | NA | BP213476 | TMEM126B-GRIA4 | chr11:85346822 | chr11:105782602 | |
| Chimerdb3.0 | FusionScan | LGG | TCGA-DB-5277-01A | GRIA4-NAALAD2 | In-Frame | chr11:105732934 | chr11:89906991 |
| TCGAfusionPortal | PRADA | LGG | TCGA-DB-5277-01A | GRIA4-NAALAD2 | In-frame | Chr11:105732934 | Chr11:89906992 |
| Top |
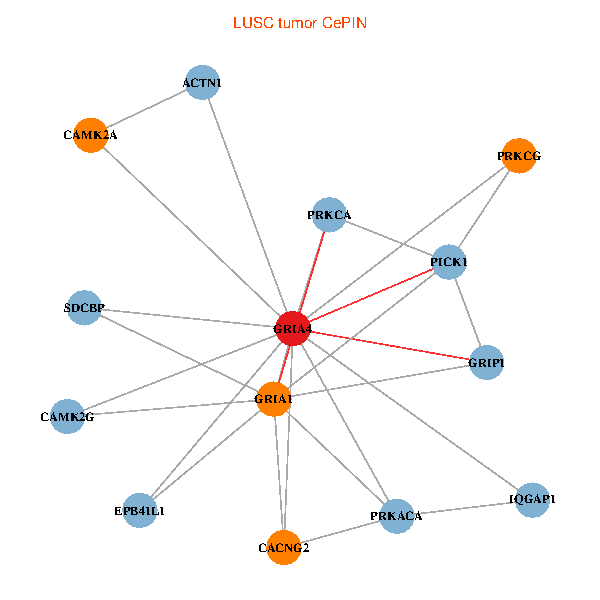
| TissGeneNet for GRIA4 |
| Co-expressed gene networks based on protein-protein interaction data (CePIN) (TCGA IlluminaHiSeq_RNASeqV2, pan-cancer normalized log2(norm_counts+1) data, version 2016-08-16) (PINA2 ppi data) |
| BRCA (tumor) | BRCA (normal) |
| GRIA4, PRKCG, PRKCA, CAMK2A, PRKACA, CAMK2G, PICK1, IQGAP1, EPB41L1, GRIP1, ACTN1, SDCBP, GRIA1, CACNG2 (tumor) | GRIA4, PRKCG, PRKCA, CAMK2A, PRKACA, CAMK2G, PICK1, IQGAP1, EPB41L1, GRIP1, ACTN1, SDCBP, GRIA1, CACNG2 (normal) |
 |  |
| COAD (tumor) | COAD (normal) |
| GRIA4, PRKCG, PRKCA, CAMK2A, PRKACA, CAMK2G, PICK1, IQGAP1, EPB41L1, GRIP1, ACTN1, SDCBP, GRIA1, CACNG2 (tumor) | GRIA4, PRKCG, PRKCA, CAMK2A, PRKACA, CAMK2G, PICK1, IQGAP1, EPB41L1, GRIP1, ACTN1, SDCBP, GRIA1, CACNG2 (normal) |
 |  |
| HNSC (tumor) | HNSC (normal) |
| GRIA4, PRKCG, PRKCA, CAMK2A, PRKACA, CAMK2G, PICK1, IQGAP1, EPB41L1, GRIP1, ACTN1, SDCBP, GRIA1, CACNG2 (tumor) | GRIA4, PRKCG, PRKCA, CAMK2A, PRKACA, CAMK2G, PICK1, IQGAP1, EPB41L1, GRIP1, ACTN1, SDCBP, GRIA1, CACNG2 (normal) |
 |  |
| KICH (tumor) | KICH (normal) |
| GRIA4, PRKCG, PRKCA, CAMK2A, PRKACA, CAMK2G, PICK1, IQGAP1, EPB41L1, GRIP1, ACTN1, SDCBP, GRIA1, CACNG2 (tumor) | GRIA4, PRKCG, PRKCA, CAMK2A, PRKACA, CAMK2G, PICK1, IQGAP1, EPB41L1, GRIP1, ACTN1, SDCBP, GRIA1, CACNG2 (normal) |
 |  |
| KIRC (tumor) | KIRC (normal) |
| GRIA4, PRKCG, PRKCA, CAMK2A, PRKACA, CAMK2G, PICK1, IQGAP1, EPB41L1, GRIP1, ACTN1, SDCBP, GRIA1, CACNG2 (tumor) | GRIA4, PRKCG, PRKCA, CAMK2A, PRKACA, CAMK2G, PICK1, IQGAP1, EPB41L1, GRIP1, ACTN1, SDCBP, GRIA1, CACNG2 (normal) |
 |  |
| KIRP (tumor) | KIRP (normal) |
| GRIA4, PRKCG, PRKCA, CAMK2A, PRKACA, CAMK2G, PICK1, IQGAP1, EPB41L1, GRIP1, ACTN1, SDCBP, GRIA1, CACNG2 (tumor) | GRIA4, PRKCG, PRKCA, CAMK2A, PRKACA, CAMK2G, PICK1, IQGAP1, EPB41L1, GRIP1, ACTN1, SDCBP, GRIA1, CACNG2 (normal) |
 |  |
| LIHC (tumor) | LIHC (normal) |
| GRIA4, PRKCG, PRKCA, CAMK2A, PRKACA, CAMK2G, PICK1, IQGAP1, EPB41L1, GRIP1, ACTN1, SDCBP, GRIA1, CACNG2 (tumor) | GRIA4, PRKCG, PRKCA, CAMK2A, PRKACA, CAMK2G, PICK1, IQGAP1, EPB41L1, GRIP1, ACTN1, SDCBP, GRIA1, CACNG2 (normal) |
 |  |
| LUAD (tumor) | LUAD (normal) |
| GRIA4, PRKCG, PRKCA, CAMK2A, PRKACA, CAMK2G, PICK1, IQGAP1, EPB41L1, GRIP1, ACTN1, SDCBP, GRIA1, CACNG2 (tumor) | GRIA4, PRKCG, PRKCA, CAMK2A, PRKACA, CAMK2G, PICK1, IQGAP1, EPB41L1, GRIP1, ACTN1, SDCBP, GRIA1, CACNG2 (normal) |
 |  |
| LUSC (tumor) | LUSC (normal) |
| GRIA4, PRKCG, PRKCA, CAMK2A, PRKACA, CAMK2G, PICK1, IQGAP1, EPB41L1, GRIP1, ACTN1, SDCBP, GRIA1, CACNG2 (tumor) | GRIA4, PRKCG, PRKCA, CAMK2A, PRKACA, CAMK2G, PICK1, IQGAP1, EPB41L1, GRIP1, ACTN1, SDCBP, GRIA1, CACNG2 (normal) |
 |  |
| PRAD (tumor) | PRAD (normal) |
| GRIA4, PRKCG, PRKCA, CAMK2A, PRKACA, CAMK2G, PICK1, IQGAP1, EPB41L1, GRIP1, ACTN1, SDCBP, GRIA1, CACNG2 (tumor) | GRIA4, PRKCG, PRKCA, CAMK2A, PRKACA, CAMK2G, PICK1, IQGAP1, EPB41L1, GRIP1, ACTN1, SDCBP, GRIA1, CACNG2 (normal) |
 |  |
| STAD (tumor) | STAD (normal) |
| GRIA4, PRKCG, PRKCA, CAMK2A, PRKACA, CAMK2G, PICK1, IQGAP1, EPB41L1, GRIP1, ACTN1, SDCBP, GRIA1, CACNG2 (tumor) | GRIA4, PRKCG, PRKCA, CAMK2A, PRKACA, CAMK2G, PICK1, IQGAP1, EPB41L1, GRIP1, ACTN1, SDCBP, GRIA1, CACNG2 (normal) |
 |  |
| THCA (tumor) | THCA (normal) |
| GRIA4, PRKCG, PRKCA, CAMK2A, PRKACA, CAMK2G, PICK1, IQGAP1, EPB41L1, GRIP1, ACTN1, SDCBP, GRIA1, CACNG2 (tumor) | GRIA4, PRKCG, PRKCA, CAMK2A, PRKACA, CAMK2G, PICK1, IQGAP1, EPB41L1, GRIP1, ACTN1, SDCBP, GRIA1, CACNG2 (normal) |
 |  |
| Top |
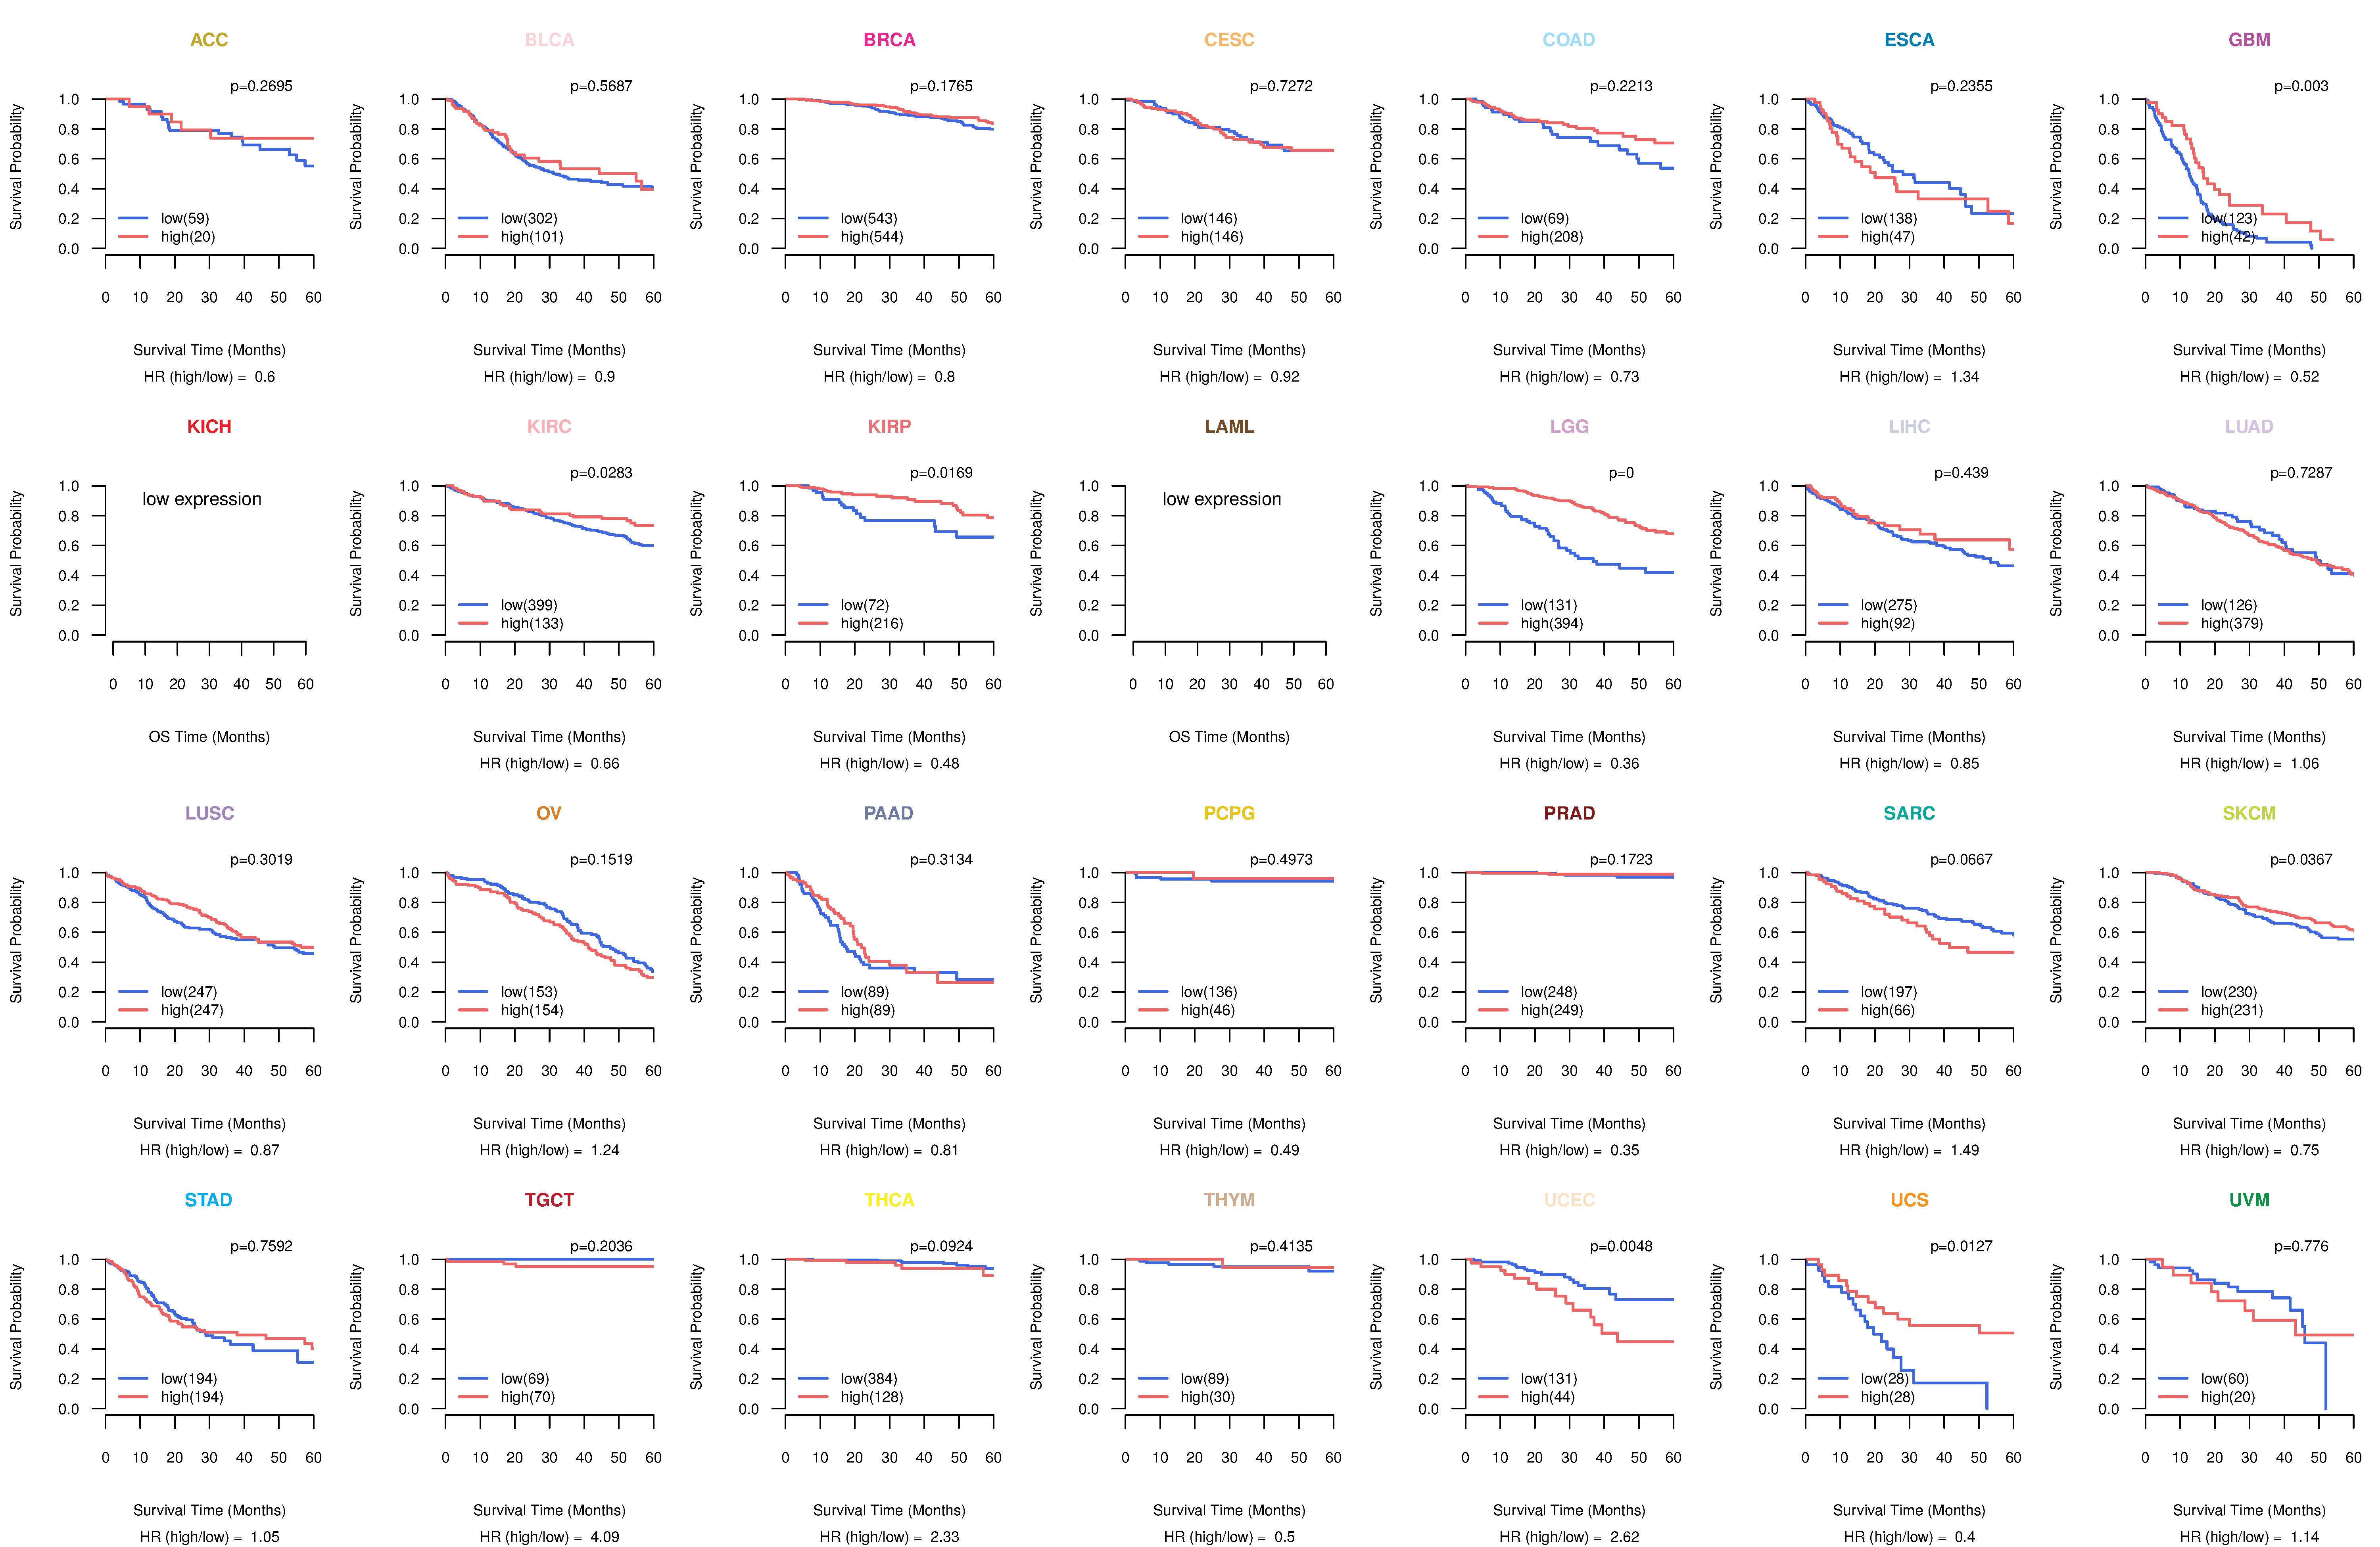
| TissGeneProg for GRIA4 |
| Kaplan-Meier plots with logrank tests of overall survival (OS) using 28 cancer types (TCGA IlluminaHiSeq_RNASeqV2, pan-cancer normalized log2(norm_counts+1) data, version 2016-08-16) (TCGA clinicalMatrix, phenotype data, version 2016-04-27) * Click on the image to enlarge it in a new window. |
 |
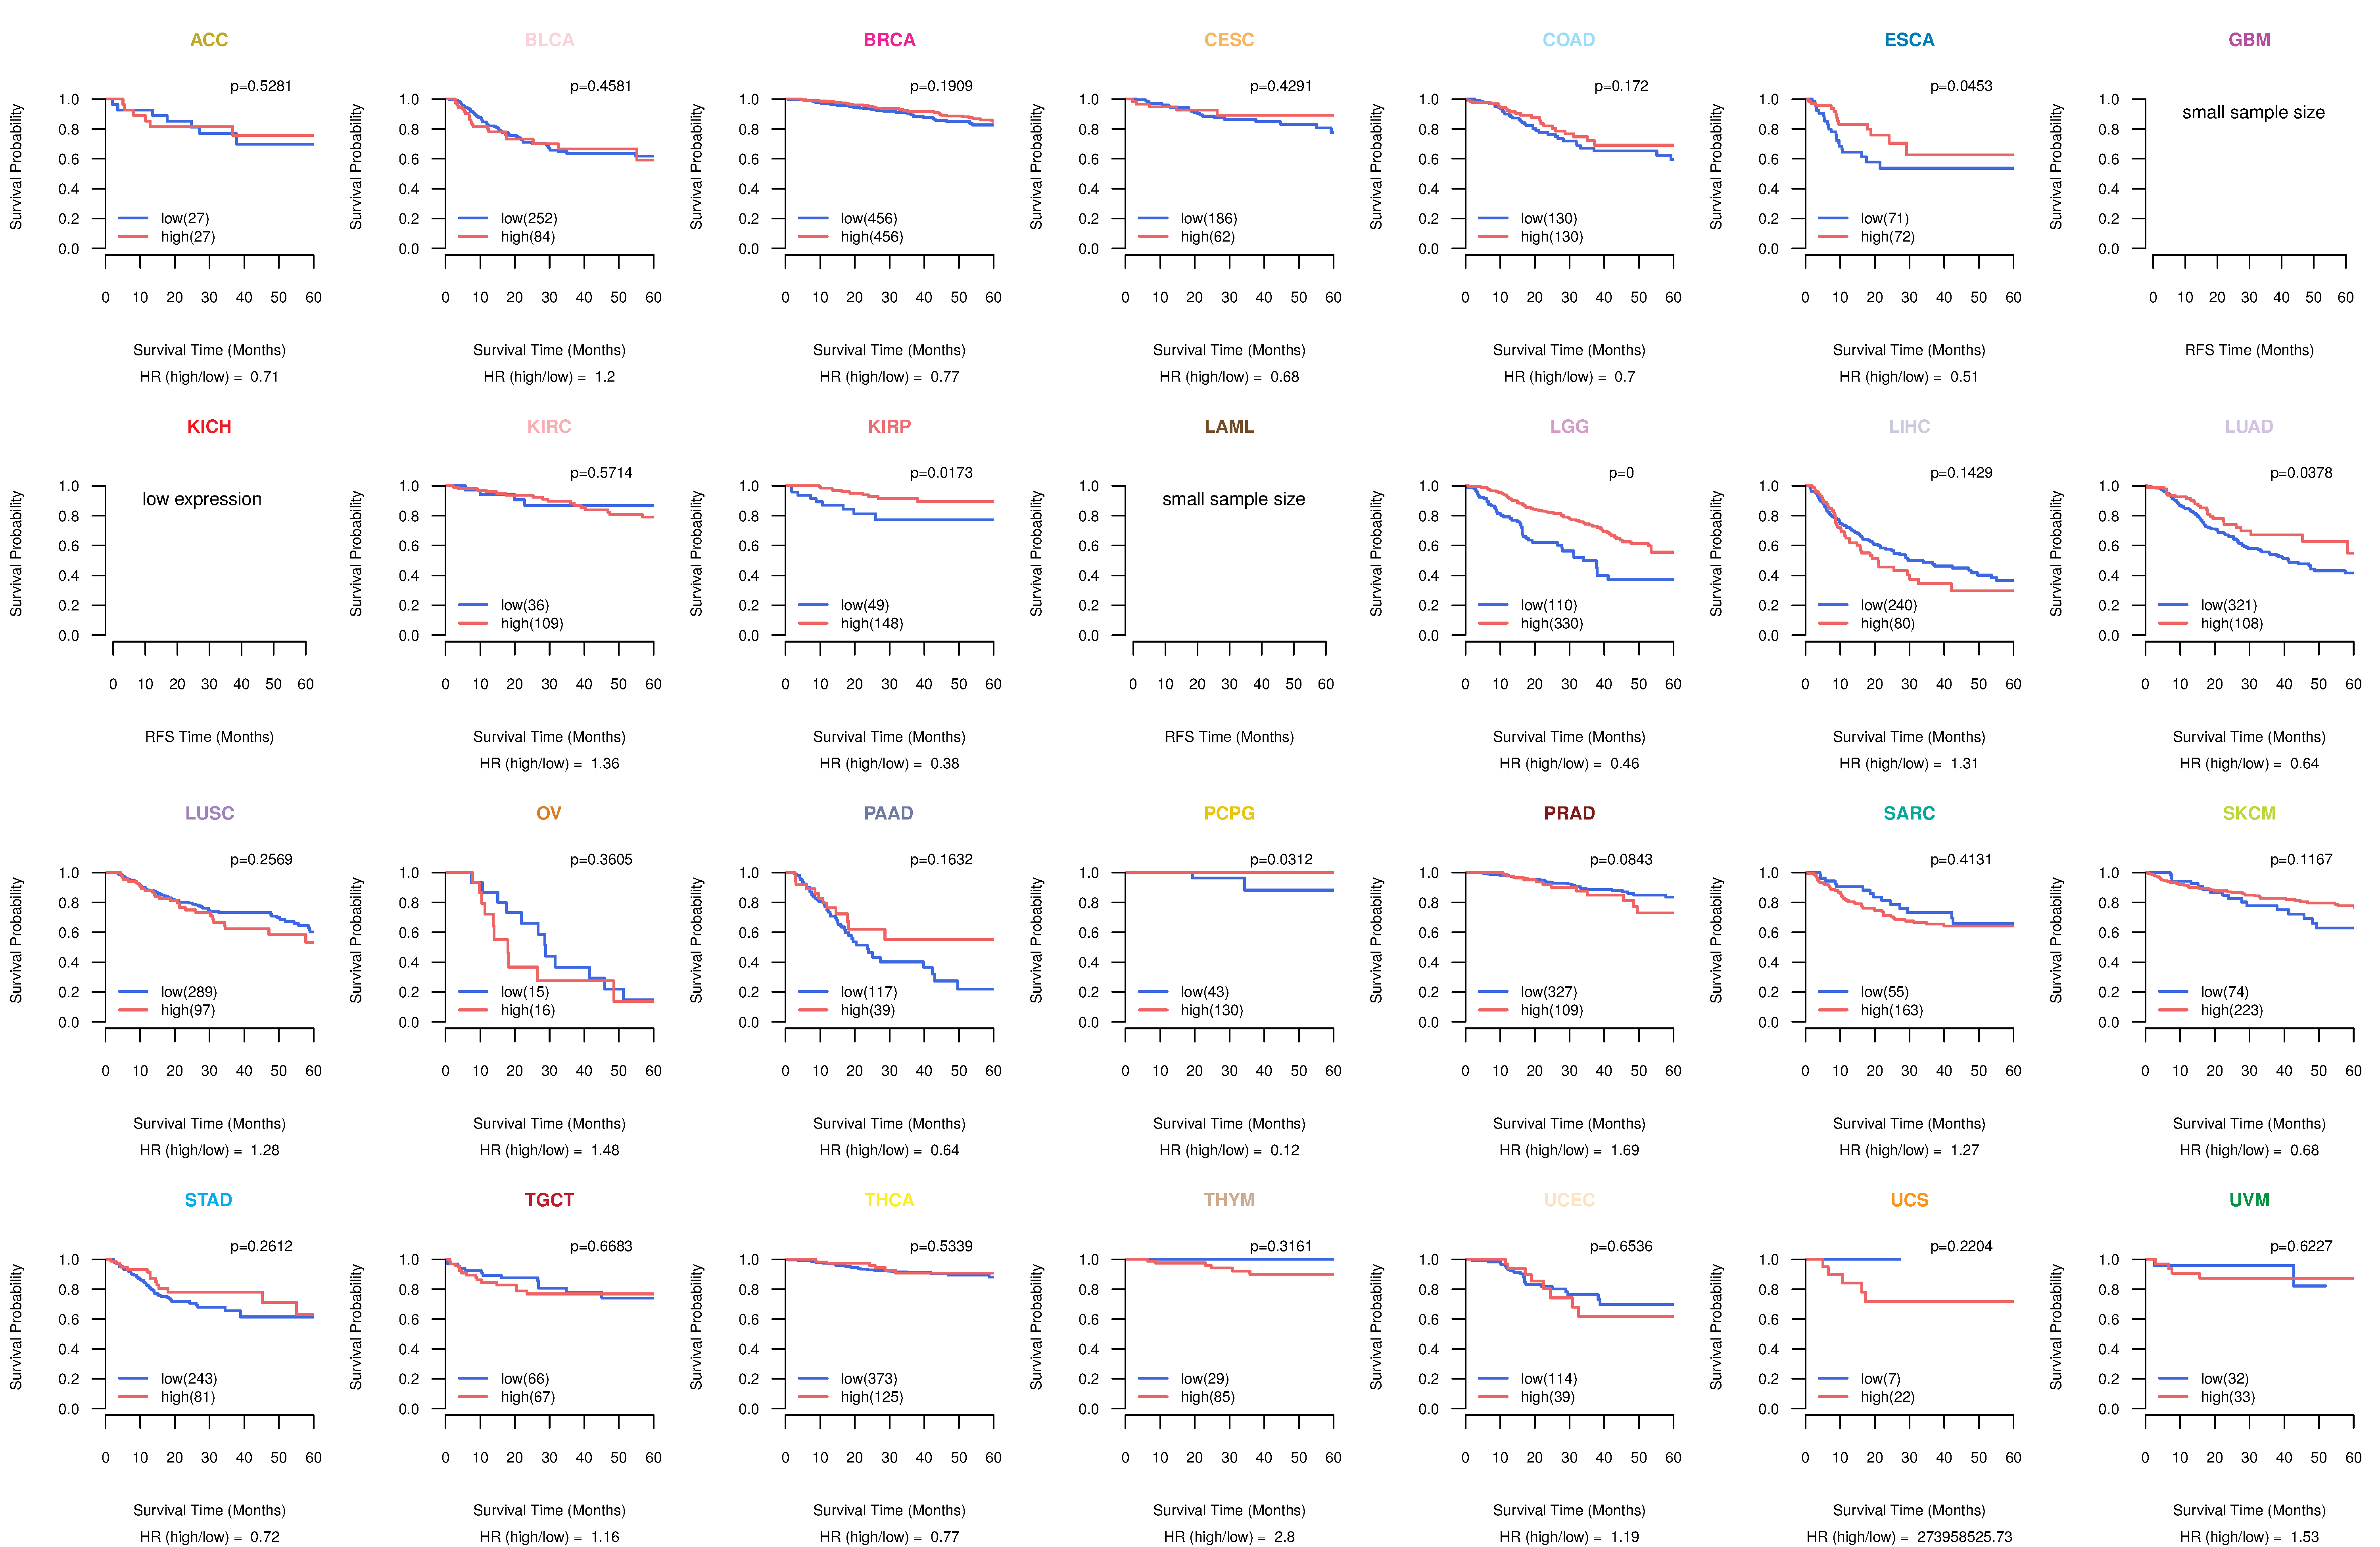
| Kaplan-Meier plots with logrank test of relapse free survival (RFS) using 28 cancer types (TCGA IlluminaHiSeq_RNASeqV2, pan-cancer normalized log2(norm_counts+1) data, version 2016-08-16) (TCGA clinicalMatrix, phenotype data, version 2016-04-27) * Click on the image enlarge it in a new window. |
 |
| Forest plot of Cox proportional hazard ratio (HR) and 95% CI of overall survival (OS) using 28 cancer types (TCGA IlluminaHiSeq_RNASeqV2, pan-cancer normalized log2(norm_counts+1) data, version 2016-08-16) (TCGA clinicalMatrix, phenotype data, version 2016-04-27) * Click on the image enlarge it in a new window. |
 |
| Forest plot of Cox proportional hazard ratio (HR) and 95% CI of relapse free survival (RFS) using 28 cancer types (TCGA IlluminaHiSeq_RNASeqV2, pan-cancer normalized log2(norm_counts+1) data, version 2016-08-16) (TCGA clinicalMatrix, phenotype data, version 2016-04-27) * Click on the image enlarge it in a new window. |
 |
| Top |
| TissGeneClin for GRIA4 |
| TissGeneDrug for GRIA4 |
| Drug information targeting TissGene (DrugBank Version 5.0.6, 2017-04-01) |
| DrugBank ID | Drug name | Drug activity | Drug type | Drug status |
| Top |
| TissGeneDisease for GRIA4 |
| Disease information associated with TissGene (DisGeNet, 2016-06-01) |
| Disease ID | Disease name | # pubmeds | Source |
| umls:C0036341 | Schizophrenia | 7 | BeFree,GAD,LHGDN |
| umls:C0004135 | Ataxia Telangiectasia | 2 | BeFree |
| umls:C0027627 | Neoplasm Metastasis | 2 | BeFree |
| umls:C0041696 | Unipolar Depression | 2 | BeFree |
| umls:C1269683 | Major Depressive Disorder | 2 | BeFree |
| umls:C0002736 | Amyotrophic Lateral Sclerosis | 1 | BeFree,LHGDN |
| umls:C0014553 | Absence Epilepsy | 1 | BeFree |
| umls:C0017636 | Glioblastoma | 1 | BeFree |
| umls:C0027092 | Myopia | 1 | CTD_human |
| umls:C0034951 | Refractive Errors | 1 | GWASCAT |
| umls:C0043094 | Weight Gain | 1 | GAD |
| umls:C0149931 | Migraine Disorders | 1 | BeFree |
| umls:C0236969 | Substance-Related Disorders | 1 | CTD_human |
| umls:C0279702 | Conventional (Clear Cell) Renal Cell Carcinoma | 1 | BeFree |
| umls:C2911647 | Weight Gain Adverse Event | 1 | GAD |
|
Copyright 2016-Present - The University of Texas Health Science Center at Houston (UTHealth) Web File Viewing | How to Report, Fraud, Waste and Abuse | State of Texas | Statewide Search | Texas Homeland Security | Site Policies |