 |
| |
| |
| |
| |
| |
| |
|

| TissGeneSummary for GSTA2 |
 Gene summary Gene summary |
| Basic gene information | Gene symbol | GSTA2 |
| Gene name | ||
| Synonyms | ||
| Cytomap | UCSC genome browser: | |
| Type of gene | ||
| RefGenes | ||
| Description | ||
| Modification date | ||
| dbXrefs | ||
| Protein | UniProt: go to UniProt's Cross Reference DB Table | |
| Expression | CleanEX: HS_GSTA2 | |
| BioGPS: 2938 | ||
| Pathway | NCI Pathway Interaction Database: GSTA2 | |
| KEGG: GSTA2 | ||
| REACTOME: GSTA2 | ||
| Pathway Commons: GSTA2 | ||
| Context | iHOP: GSTA2 | |
| ligand binding site mutation search in PubMed: GSTA2 | ||
| UCL Cancer Institute: GSTA2 | ||
| Assigned class in TissGDB* | C | |
| Included tissue-specific gene expression resources | TiGER,GTEx | |
| Specific-tissues in normal samples (assigned by TissGDB using HPA, TiGER, and GTEx) | LiverPancreasTestis | |
| Cancer types related to the specific-tissues in cancer samples (assigned by TissGDB using TCGA) | LIHCPAADTGCT | |
| Reference showing the relevant tissue of GSTA2 | ||
| Description by TissGene annotations | ||
| * Class A consists of genes with literature evidence and is part of the cTissGenes. Class B consists of only cTissGenes without additional evidence. The remaining genes belong to Class C. |
| Gene ontology having evidence of Inferred from Direct Assay (IDA) from Entrez |
| GO ID | GO term | PubMed ID |
| Top |
| TissGeneExp for GSTA2 |
| Gene expressions across 28 cancer types (X-axis: cancer type and Y-axis: log2(norm_counts+1)) (TCGA IlluminaHiSeq_RNASeqV2, pan-cancer normalized log2(norm_counts+1) data, version 2016-08-16) |
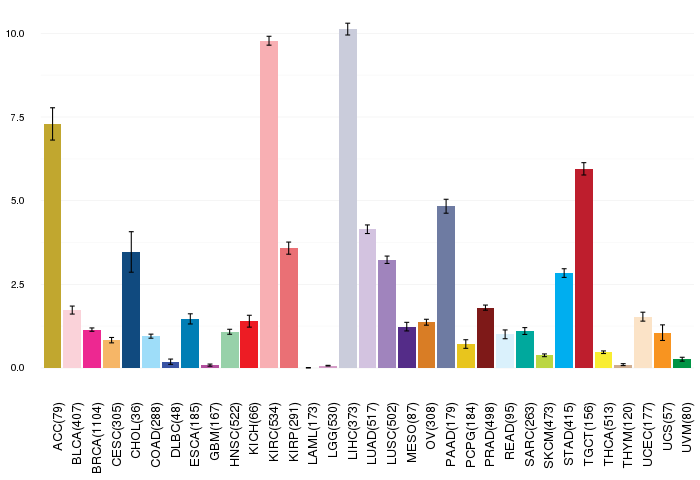 |
| Gene isoform expressions across 28 cancer types (X-axis: cancer type and Y-axis: log2(norm_counts+1)) (TCGA pan-cancer tcga_rsem_isoform_tpm, version 2016-09-01) |
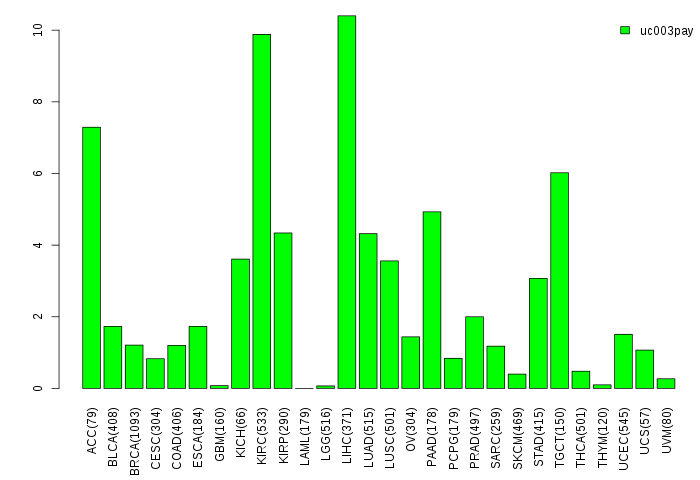 |
| Gene expressions across normal tissues of GTEx data (GTEx GTEx_Analysis_v6_RNA-seq_RNA-SeQCv1.1.8_gene_rpkm.gct) - Here, we shows the matched tissue types only among our 28 cancer types. |
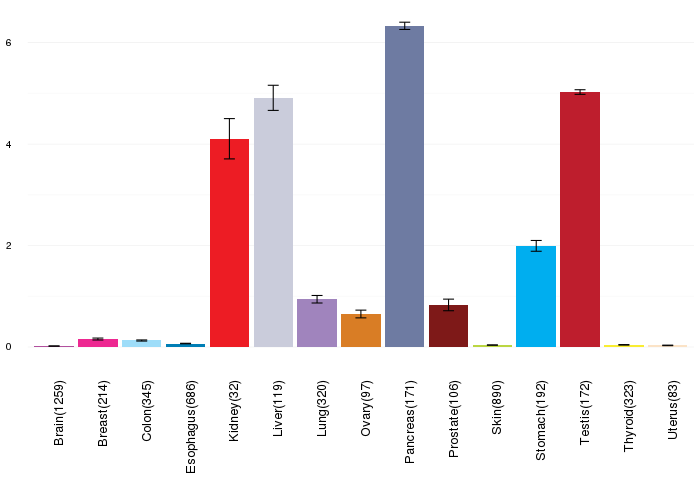 |
| Different expressions across 14 cancer types with more than 10 samples between matched tumors and normals (X-axis: cancer type and Y-axis: log2(norm_counts+1)) (TCGA IlluminaHiSeq_RNASeqV2, pan-cancer normalized log2(norm_counts+1) data, version 2016-08-16) |
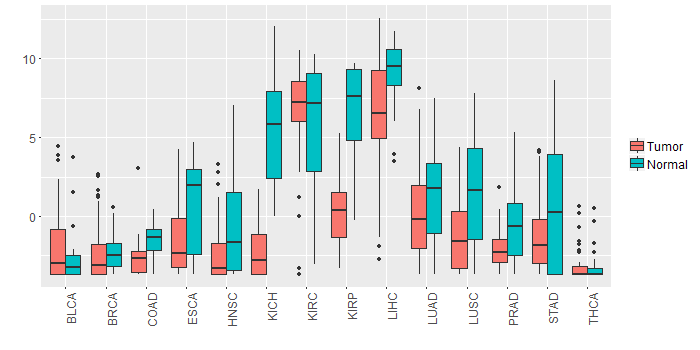 |
| - Significantly differentially expressed cancer types and information. (|Fold change|>1 and FDR<0.05) |
| Cancer type | Mean(exp) in tumor | Mean(exp) in matched normal | Log2FC | P-val. | FDR |
| KIRP | 0.352916632 | 6.830960382 | -6.47804375 | 3.03E-14 | 7.00E-13 |
| LUSC | -1.245077425 | 1.560318654 | -2.805396078 | 1.88E-06 | 4.54E-06 |
| LIHC | 6.421881007 | 9.201525007 | -2.779644 | 8.16E-06 | 3.53E-05 |
| KICH | -2.225906993 | 5.324101007 | -7.550008 | 2.12E-11 | 1.88E-10 |
| LUAD | 0.084707903 | 1.423151007 | -1.338443103 | 0.012 | 0.021094044 |
| HNSC | -2.307915272 | -0.797494342 | -1.51042093 | 0.007 | 0.018124281 |
| COAD | -2.517787455 | -1.431798993 | -1.085988462 | 0.00188 | 0.005085284 |
| PRAD | -2.031804763 | -0.536104763 | -1.4957 | 0.000215 | 0.000837939 |
| Top |
| TissGene-miRNA for GSTA2 |
| Significantly anti-correlated miRNAs of TissGene across 28 cancer types (Gene-miRNA relations from TargetScanHuman Relsease 7.1, Conserved_Site_Context_Scores.txt.zip, 06.01.2016) (TCGA IlluminaHiSeq_miRNASeq, log2(RPM+1) data, version 2016-11-21) (TCGA IlluminaHiSeq_RNASeqV2, log2(normalized_count+1) data, version 2016-08-16) (Spearman’s Rank Correlation (p-value<0.05 and coefficient<-0.25)) |
| Cancer type | miRNA id | miRNA accession | P-val. | Coeff. | # samples |
| Top |
| TissGeneMut for GSTA2 |
| TissGeneSNV for GSTA2 |
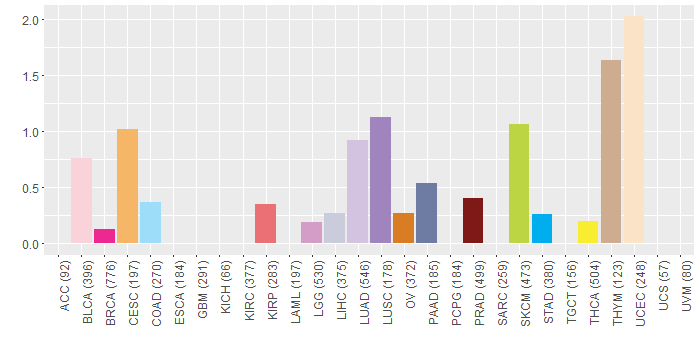
| nsSNV counts per each loci. Different colors of circles represent different cancer types. Circle size denotes number of samples. (TCGA somatic mutation (SNPs and small INDELs) data, version 2016-04-25) * Click on the image to enlarge it in a new window. |
 |
 |
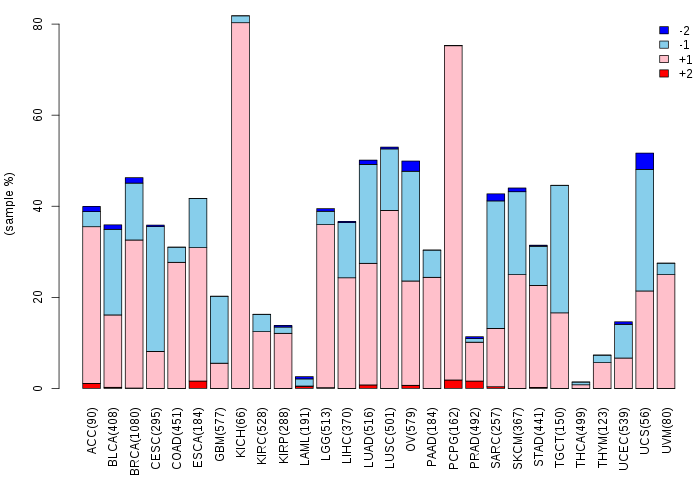
| Somatic nucleotide variants of TissGene across 28 cancer types (X-axis: cancer type and Y-axis: % of mutated samples) The numbers in parentheses are numbers of samples with mutation (nsSNVs). (TCGA somatic mutation (SNPs and small INDELs) data, version 2016-04-25) |
 |
| - nsSNVs sorted by frequency. |
| AAchange | Cancer type | # samples |
| p.E126D | UCEC | 2 |
| p.R221S | HNSC | 2 |
| p.L153M | THYM | 1 |
| p.D209N | SKCM | 1 |
| p.E32D | UCEC | 1 |
| p.K141R | SKCM | 1 |
| p.E215D | LUAD | 1 |
| p.A100V | UCEC | 1 |
| p.V55E | LUAD | 1 |
| p.I35L | OV | 1 |
| p.D42N | COAD | 1 |
| p.K196T | STAD | 1 |
| p.R131C | UCEC | 1 |
| p.P114L | LUAD | 1 |
| p.R20W | PAAD | 1 |
| p.V58A | LUAD | 1 |
| p.F111V | LIHC | 1 |
| p.P206H | READ | 1 |
| p.D61H | CESC | 1 |
| p.S176Y | UCEC | 1 |
| p.H159Q | LUSC | 1 |
| p.G144E | THCA | 1 |
| p.Q117H | KIRP | 1 |
| p.V167M | LGG | 1 |
| p.K152M | PRAD | 1 |
| p.R221S | BLCA | 1 |
| p.K185R | SKCM | 1 |
| p.I60T | PRAD | 1 |
| p.R13W | HNSC | 1 |
| p.G48E | SKCM | 1 |
| p.E97K | LUAD | 1 |
| p.K195N | BLCA | 1 |
| p.K64R | THYM | 1 |
| p.A2T | LUSC | 1 |
| p.L163F | BRCA | 1 |
| p.G27A | BLCA | 1 |
| p.G103S | CESC | 1 |
| p.L107F | SKCM | 1 |
| Top |
| TissGeneCNV for GSTA2 |
| Copy number variations of TissGene across 28 cancer types (X-axis: cancer type and Y-axis: % of CNV samples) (TCGA Gistic2_CopyNumber_Gistic2_all_data_by_genes, Gistic2 copy number data, version 2016-08-16) |
 |
| Top |
| TissGeneFusions for GSTA2 |
| Fusion genes including TissGene (ChimerDB 3.0, 2016-12-01 and TCGA fusion Portal 2015-12-01) |
| Database | Src | Cancer type | Sample | Fusion gene | ORF | 5'-gene BP | 3'-gene BP |
| Top |
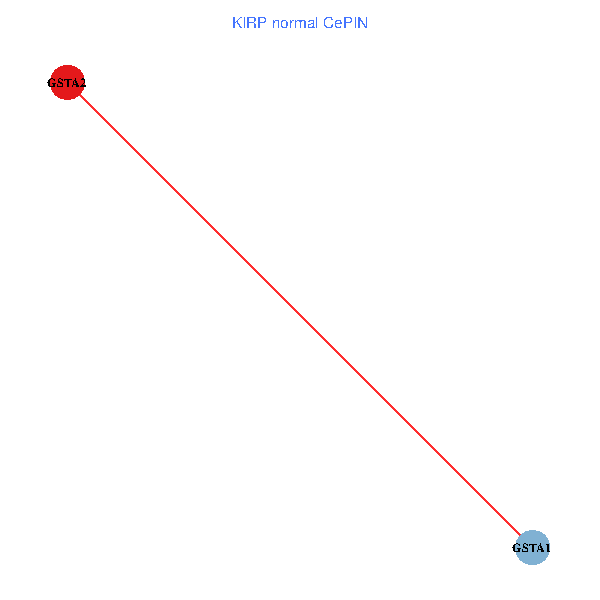
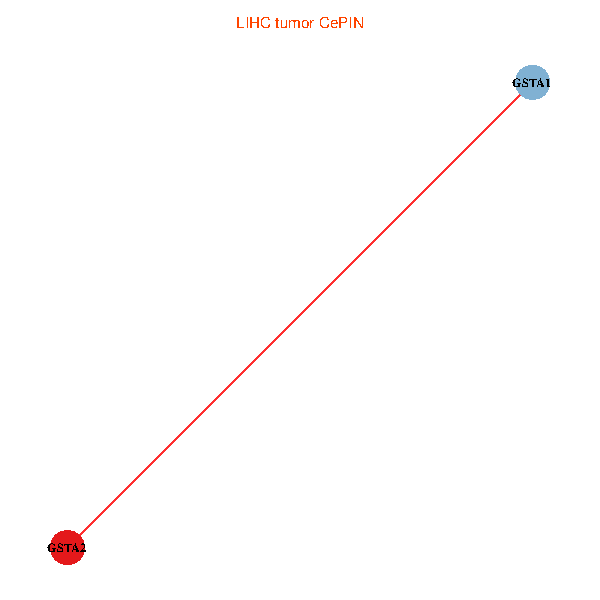
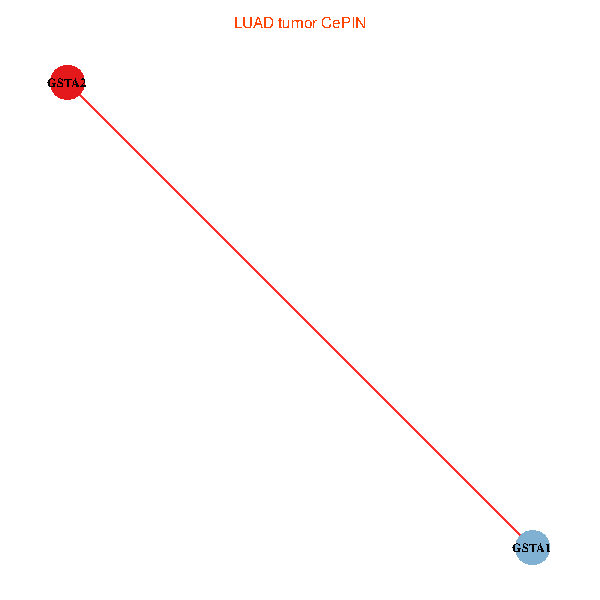
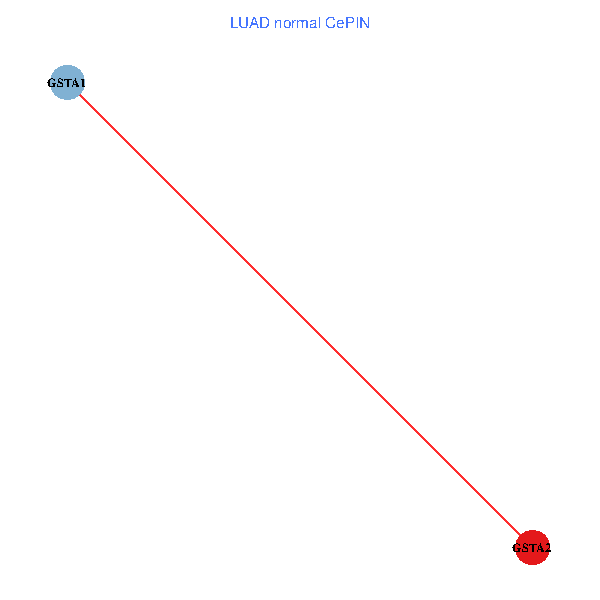
| TissGeneNet for GSTA2 |
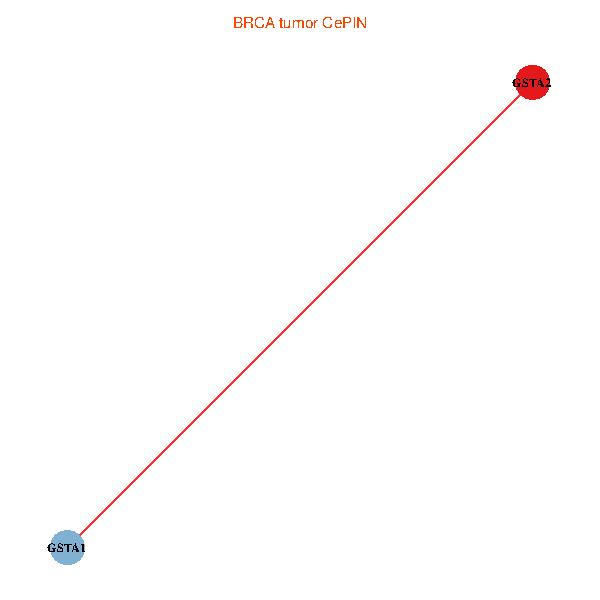
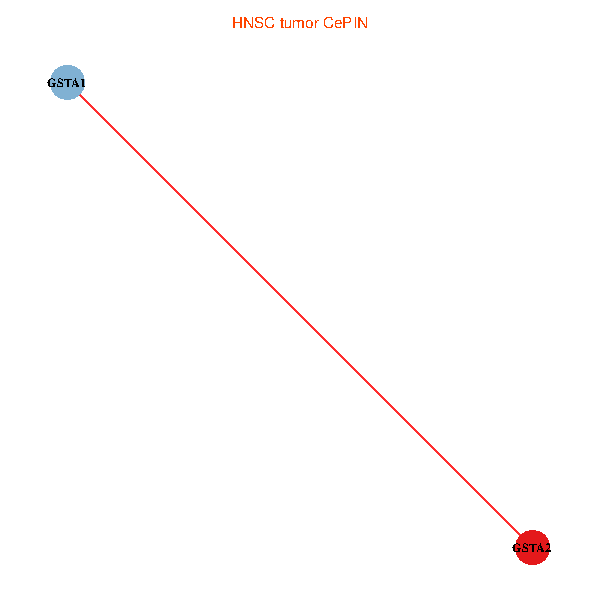
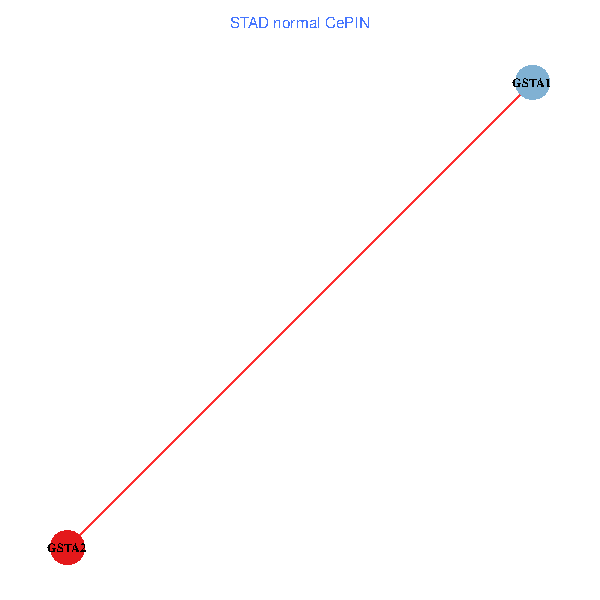
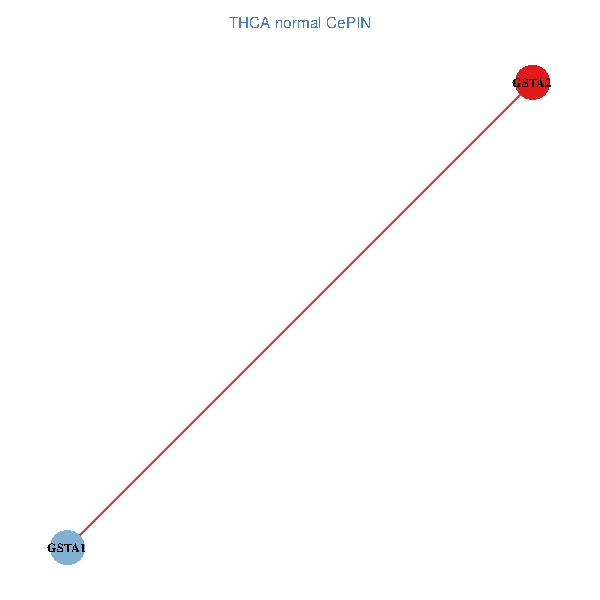
| Co-expressed gene networks based on protein-protein interaction data (CePIN) (TCGA IlluminaHiSeq_RNASeqV2, pan-cancer normalized log2(norm_counts+1) data, version 2016-08-16) (PINA2 ppi data) |
| BRCA (tumor) | BRCA (normal) |
| GSTA2, GSTA1 (tumor) | GSTA2, GSTA1 (normal) |
 |  |
| COAD (tumor) | COAD (normal) |
| GSTA2, GSTA1 (tumor) | GSTA2, GSTA1 (normal) |
 |  |
| HNSC (tumor) | HNSC (normal) |
| GSTA2, GSTA1 (tumor) | GSTA2, GSTA1 (normal) |
 |  |
| KICH (tumor) | KICH (normal) |
| GSTA2, GSTA1 (tumor) | GSTA2, GSTA1 (normal) |
 |  |
| KIRC (tumor) | KIRC (normal) |
| GSTA2, GSTA1 (tumor) | GSTA2, GSTA1 (normal) |
 |  |
| KIRP (tumor) | KIRP (normal) |
| GSTA2, GSTA1 (tumor) | GSTA2, GSTA1 (normal) |
 |  |
| LIHC (tumor) | LIHC (normal) |
| GSTA2, GSTA1 (tumor) | GSTA2, GSTA1 (normal) |
 |  |
| LUAD (tumor) | LUAD (normal) |
| GSTA2, GSTA1 (tumor) | GSTA2, GSTA1 (normal) |
 |  |
| LUSC (tumor) | LUSC (normal) |
| GSTA2, GSTA1 (tumor) | GSTA2, GSTA1 (normal) |
 |  |
| PRAD (tumor) | PRAD (normal) |
| GSTA2, GSTA1 (tumor) | GSTA2, GSTA1 (normal) |
 |  |
| STAD (tumor) | STAD (normal) |
| GSTA2, GSTA1 (tumor) | GSTA2, GSTA1 (normal) |
 |  |
| THCA (tumor) | THCA (normal) |
| GSTA2, GSTA1 (tumor) | GSTA2, GSTA1 (normal) |
 |  |
| Top |
| TissGeneProg for GSTA2 |
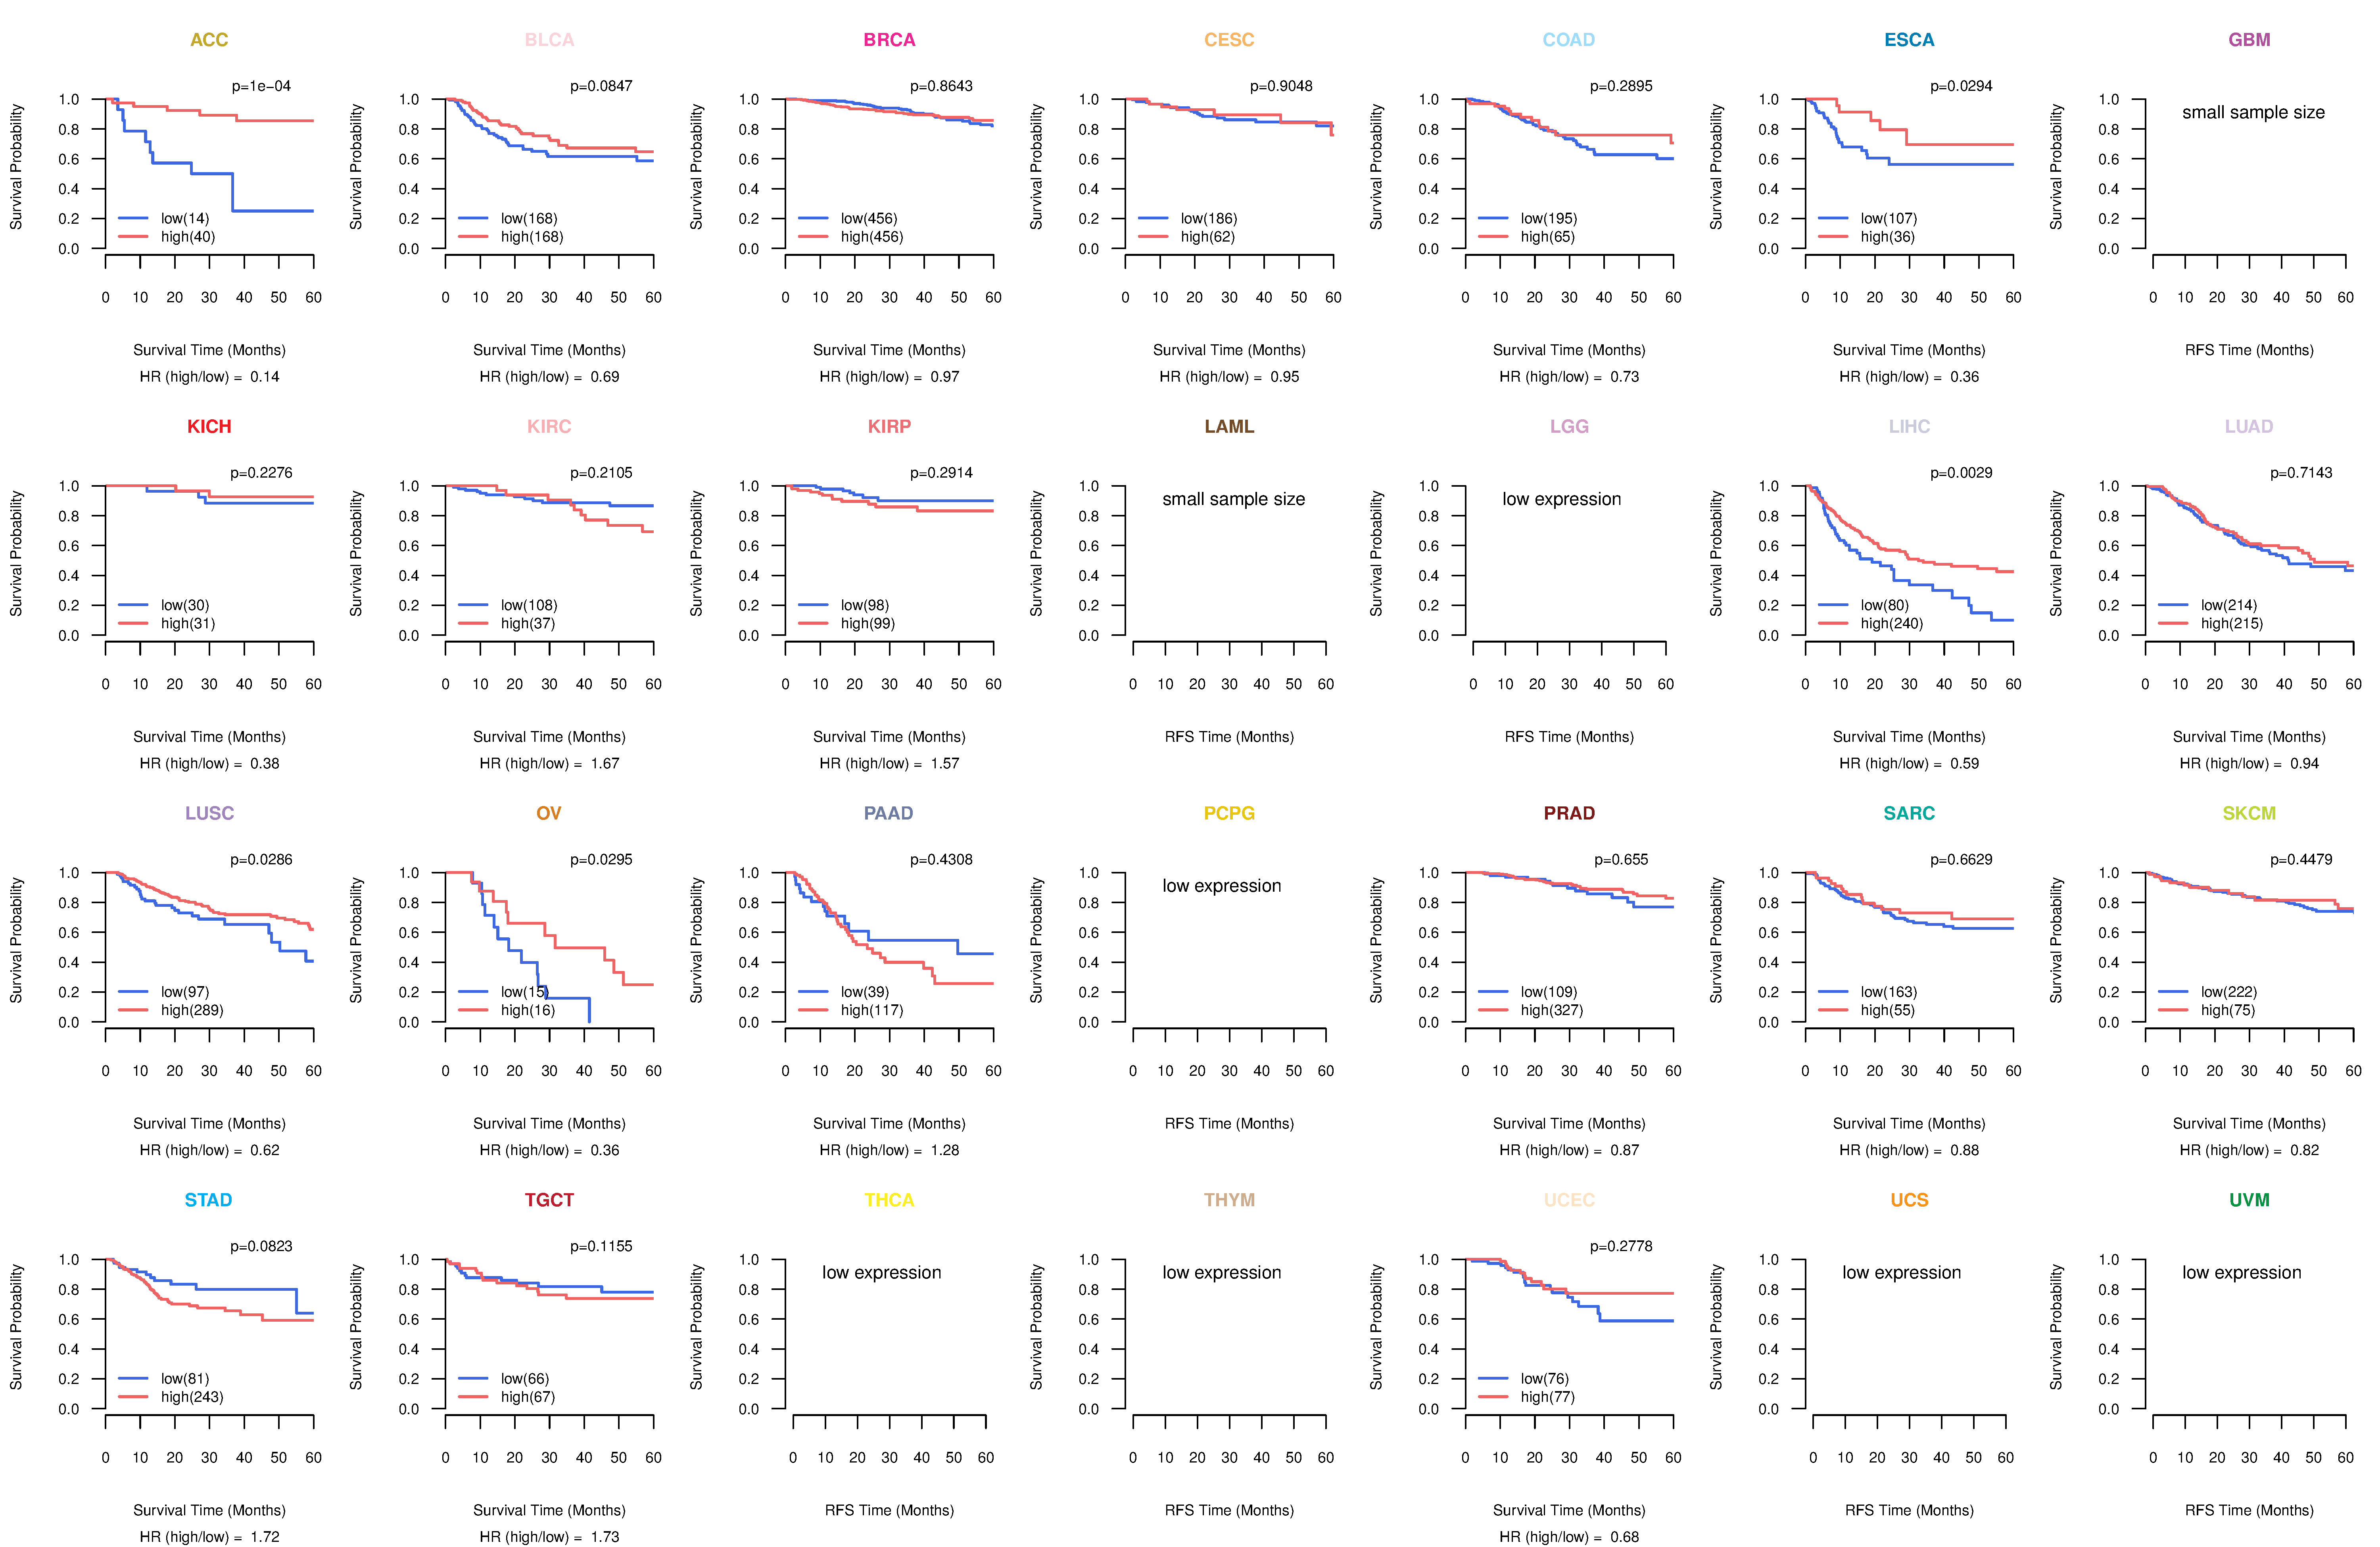
| Kaplan-Meier plots with logrank tests of overall survival (OS) using 28 cancer types (TCGA IlluminaHiSeq_RNASeqV2, pan-cancer normalized log2(norm_counts+1) data, version 2016-08-16) (TCGA clinicalMatrix, phenotype data, version 2016-04-27) * Click on the image to enlarge it in a new window. |
 |
| Kaplan-Meier plots with logrank test of relapse free survival (RFS) using 28 cancer types (TCGA IlluminaHiSeq_RNASeqV2, pan-cancer normalized log2(norm_counts+1) data, version 2016-08-16) (TCGA clinicalMatrix, phenotype data, version 2016-04-27) * Click on the image enlarge it in a new window. |
 |
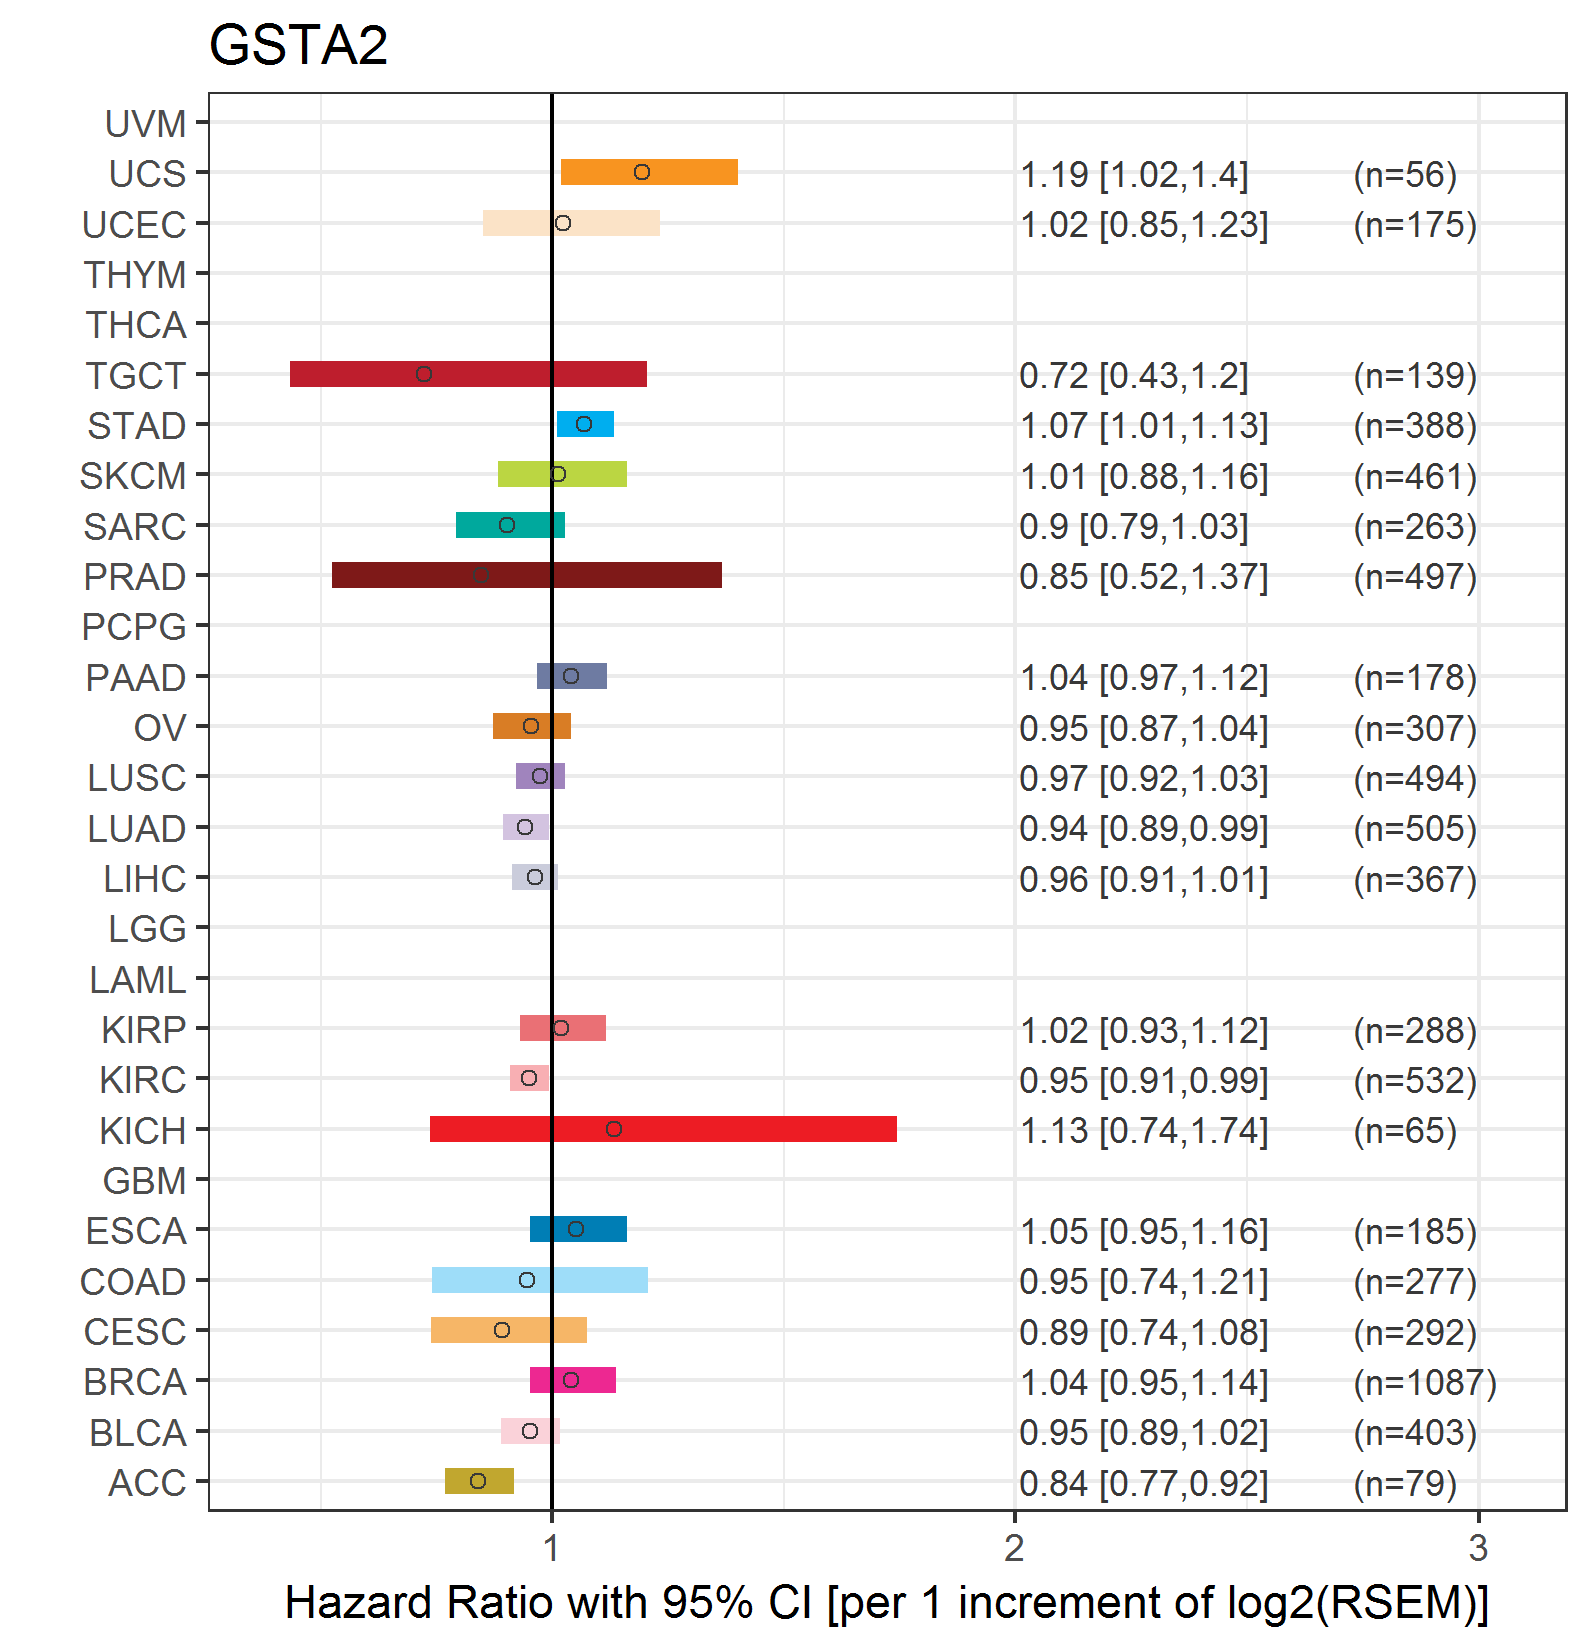
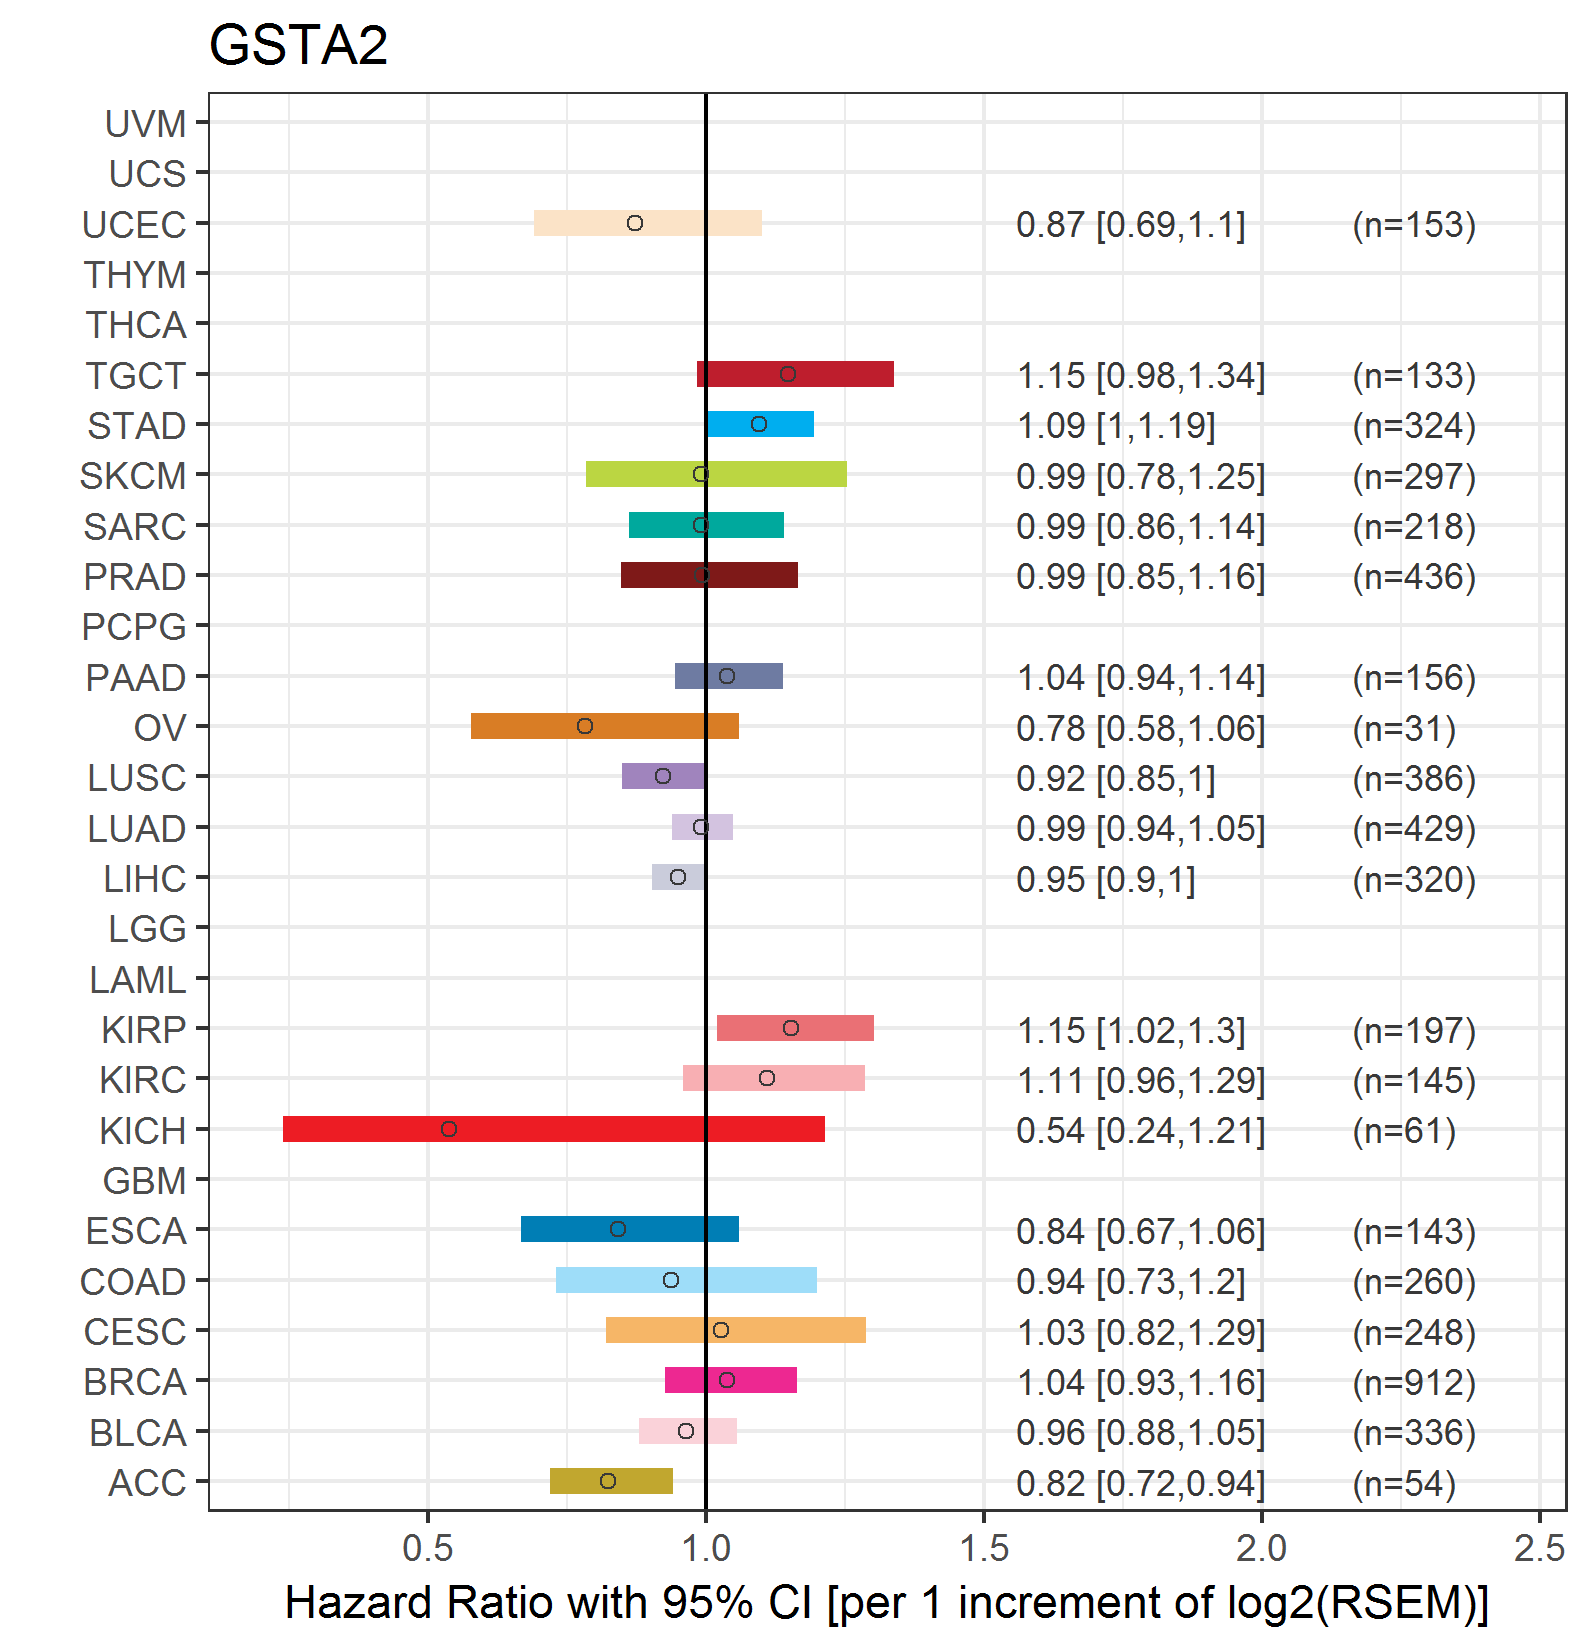
| Forest plot of Cox proportional hazard ratio (HR) and 95% CI of overall survival (OS) using 28 cancer types (TCGA IlluminaHiSeq_RNASeqV2, pan-cancer normalized log2(norm_counts+1) data, version 2016-08-16) (TCGA clinicalMatrix, phenotype data, version 2016-04-27) * Click on the image enlarge it in a new window. |
 |
| Forest plot of Cox proportional hazard ratio (HR) and 95% CI of relapse free survival (RFS) using 28 cancer types (TCGA IlluminaHiSeq_RNASeqV2, pan-cancer normalized log2(norm_counts+1) data, version 2016-08-16) (TCGA clinicalMatrix, phenotype data, version 2016-04-27) * Click on the image enlarge it in a new window. |
 |
| Top |
| TissGeneClin for GSTA2 |
| TissGeneDrug for GSTA2 |
| Drug information targeting TissGene (DrugBank Version 5.0.6, 2017-04-01) |
| DrugBank ID | Drug name | Drug activity | Drug type | Drug status |
| DB00608 | Chloroquine | Small molecule | Approved|Vet_approved |
| Top |
| TissGeneDisease for GSTA2 |
| Disease information associated with TissGene (DisGeNet, 2016-06-01) |
| Disease ID | Disease name | # pubmeds | Source |
| umls:C0006142 | Malignant neoplasm of breast | 3 | BeFree,GAD |
| umls:C0678222 | Breast Carcinoma | 3 | BeFree |
| umls:C0014859 | Esophageal Neoplasms | 2 | GAD |
| umls:C0018671 | Head and Neck Neoplasms | 2 | GAD |
| umls:C0023055 | Laryngeal neoplasm | 2 | GAD |
| umls:C0026640 | Mouth Neoplasms | 2 | GAD |
| umls:C0031347 | Pharyngeal Neoplasms | 2 | GAD |
| umls:C0242379 | Malignant neoplasm of lung | 2 | BeFree,GAD |
| umls:C0022116 | Ischemia | 1 | BeFree |
| umls:C0023434 | Chronic Lymphocytic Leukemia | 1 | GAD |
| umls:C0023893 | Liver Cirrhosis, Experimental | 1 | CTD_human |
| umls:C0025500 | Mesothelioma | 1 | GAD |
| umls:C0032229 | Pleural Neoplasms | 1 | GAD |
| umls:C0376358 | Malignant neoplasm of prostate | 1 | GAD |
| umls:C0546837 | Malignant neoplasm of esophagus | 1 | GAD |
| umls:C0684249 | Carcinoma of lung | 1 | BeFree |
| umls:C0919532 | Genomic Instability | 1 | GAD |
| umls:C1527249 | Colorectal Cancer | 1 | GAD |
|
Copyright 2016-Present - The University of Texas Health Science Center at Houston (UTHealth) Web File Viewing | How to Report, Fraud, Waste and Abuse | State of Texas | Statewide Search | Texas Homeland Security | Site Policies |