 |
| |
| |
| |
| |
| |
| |
|

| TissGeneSummary for NPC1L1 |
 Gene summary Gene summary |
| Basic gene information | Gene symbol | NPC1L1 |
| Gene name | NPC1-like 1 | |
| Synonyms | NPC11L1 | |
| Cytomap | UCSC genome browser: 7p13 | |
| Type of gene | protein-coding | |
| RefGenes | NM_001101648.1, NM_001300967.1,NM_013389.2, | |
| Description | NPC1 (Niemann-Pick disease, type C1, gene)-like 1Niemann-Pick C1-like protein 1 | |
| Modification date | 20141222 | |
| dbXrefs | MIM : 608010 | |
| HGNC : HGNC | ||
| Ensembl : ENSG00000015520 | ||
| HPRD : 09725 | ||
| Vega : OTTHUMG00000023691 | ||
| Protein | UniProt: go to UniProt's Cross Reference DB Table | |
| Expression | CleanEX: HS_NPC1L1 | |
| BioGPS: 29881 | ||
| Pathway | NCI Pathway Interaction Database: NPC1L1 | |
| KEGG: NPC1L1 | ||
| REACTOME: NPC1L1 | ||
| Pathway Commons: NPC1L1 | ||
| Context | iHOP: NPC1L1 | |
| ligand binding site mutation search in PubMed: NPC1L1 | ||
| UCL Cancer Institute: NPC1L1 | ||
| Assigned class in TissGDB* | C | |
| Included tissue-specific gene expression resources | TiGER,GTEx | |
| Specific-tissues in normal samples (assigned by TissGDB using HPA, TiGER, and GTEx) | LiverPancreas | |
| Cancer types related to the specific-tissues in cancer samples (assigned by TissGDB using TCGA) | LIHCPAAD | |
| Reference showing the relevant tissue of NPC1L1 | ||
| Description by TissGene annotations | ||
| * Class A consists of genes with literature evidence and is part of the cTissGenes. Class B consists of only cTissGenes without additional evidence. The remaining genes belong to Class C. |
| Gene ontology having evidence of Inferred from Direct Assay (IDA) from Entrez |
| GO ID | GO term | PubMed ID |
| Top |
| TissGeneExp for NPC1L1 |
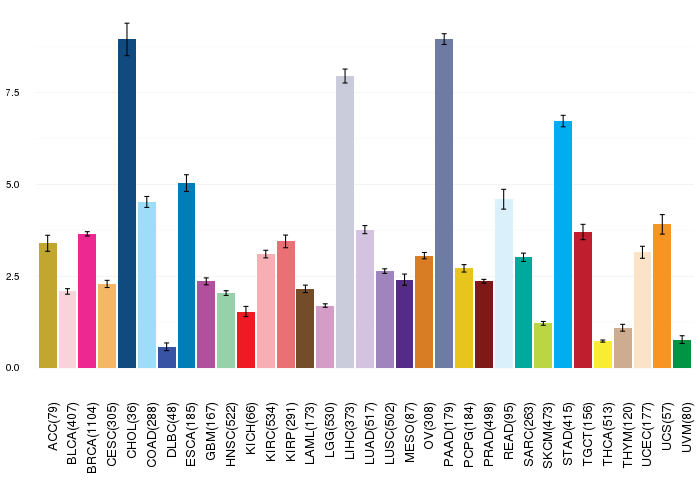
| Gene expressions across 28 cancer types (X-axis: cancer type and Y-axis: log2(norm_counts+1)) (TCGA IlluminaHiSeq_RNASeqV2, pan-cancer normalized log2(norm_counts+1) data, version 2016-08-16) |
 |
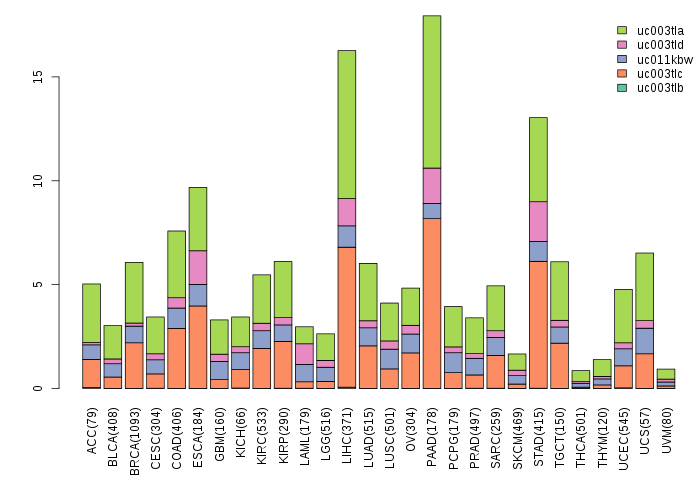
| Gene isoform expressions across 28 cancer types (X-axis: cancer type and Y-axis: log2(norm_counts+1)) (TCGA pan-cancer tcga_rsem_isoform_tpm, version 2016-09-01) |
 |
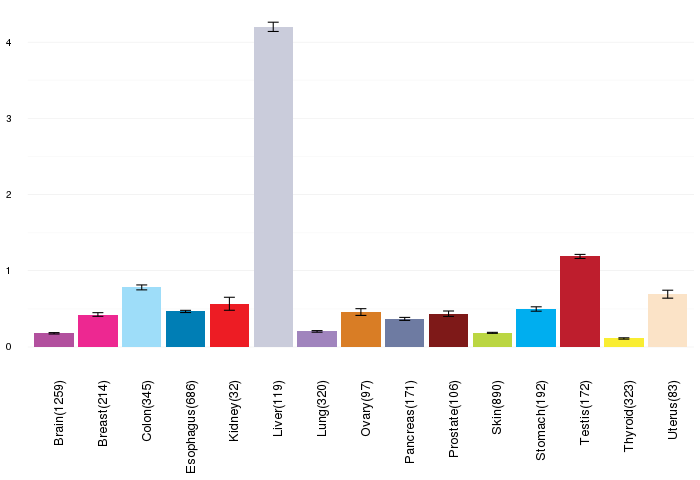
| Gene expressions across normal tissues of GTEx data (GTEx GTEx_Analysis_v6_RNA-seq_RNA-SeQCv1.1.8_gene_rpkm.gct) - Here, we shows the matched tissue types only among our 28 cancer types. |
 |
| Different expressions across 14 cancer types with more than 10 samples between matched tumors and normals (X-axis: cancer type and Y-axis: log2(norm_counts+1)) (TCGA IlluminaHiSeq_RNASeqV2, pan-cancer normalized log2(norm_counts+1) data, version 2016-08-16) |
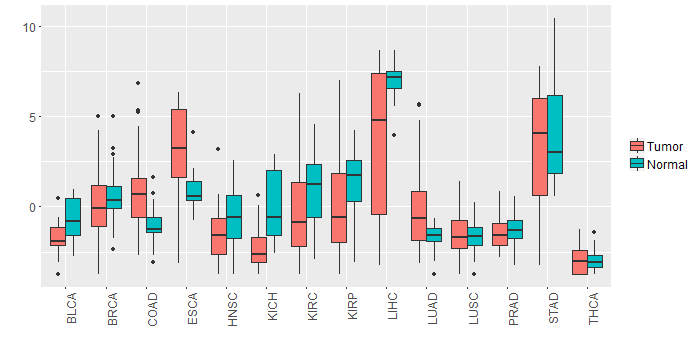 |
| - Significantly differentially expressed cancer types and information. (|Fold change|>1 and FDR<0.05) |
| Cancer type | Mean(exp) in tumor | Mean(exp) in matched normal | Log2FC | P-val. | FDR |
| LUAD | -0.274802244 | -1.606993623 | 1.332191379 | 2.99E-05 | 8.17E-05 |
| LIHC | 3.595539274 | 6.997935274 | -3.402396 | 5.04E-07 | 2.89E-06 |
| KICH | -2.240446726 | 0.022645274 | -2.263092 | 8.07E-06 | 2.60E-05 |
| KIRC | -0.173903393 | 0.903011885 | -1.076915278 | 0.00631 | 0.010927906 |
| HNSC | -1.486796029 | -0.479282075 | -1.007513953 | 0.00293 | 0.008606397 |
| COAD | 1.041555581 | -1.00431365 | 2.045869231 | 0.000332 | 0.001069724 |
| Top |
| TissGene-miRNA for NPC1L1 |
| Significantly anti-correlated miRNAs of TissGene across 28 cancer types (Gene-miRNA relations from TargetScanHuman Relsease 7.1, Conserved_Site_Context_Scores.txt.zip, 06.01.2016) (TCGA IlluminaHiSeq_miRNASeq, log2(RPM+1) data, version 2016-11-21) (TCGA IlluminaHiSeq_RNASeqV2, log2(normalized_count+1) data, version 2016-08-16) (Spearman’s Rank Correlation (p-value<0.05 and coefficient<-0.25)) |
| Cancer type | miRNA id | miRNA accession | P-val. | Coeff. | # samples |
| Top |
| TissGeneMut for NPC1L1 |
| TissGeneSNV for NPC1L1 |
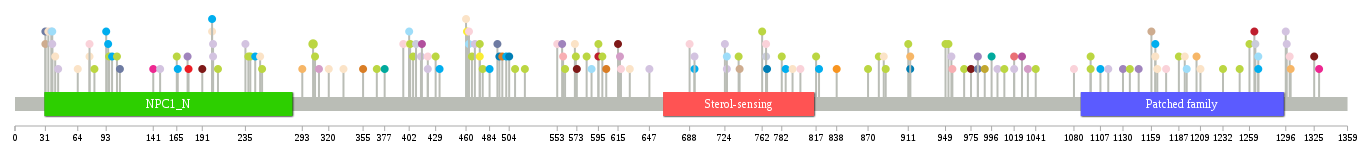
| nsSNV counts per each loci. Different colors of circles represent different cancer types. Circle size denotes number of samples. (TCGA somatic mutation (SNPs and small INDELs) data, version 2016-04-25) * Click on the image to enlarge it in a new window. |
 |
 |
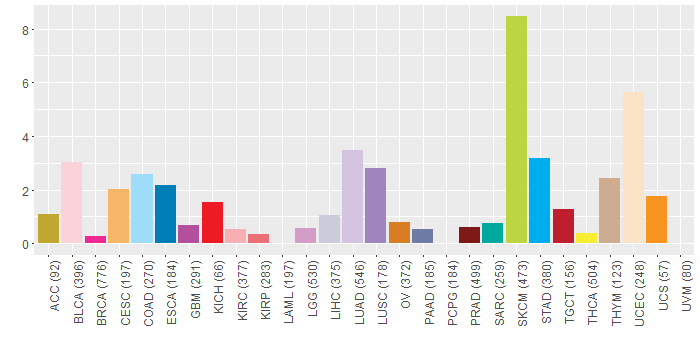
| Somatic nucleotide variants of TissGene across 28 cancer types (X-axis: cancer type and Y-axis: % of mutated samples) The numbers in parentheses are numbers of samples with mutation (nsSNVs). (TCGA somatic mutation (SNPs and small INDELs) data, version 2016-04-25) |
 |
| - nsSNVs sorted by frequency. |
| AAchange | Cancer type | # samples |
| p.G304E | SKCM | 2 |
| p.S982L | PAAD | 1 |
| p.K107N | PAAD | 1 |
| p.A310T | LGG | 1 |
| p.R1163H | UCEC | 1 |
| p.R801K | BLCA | 1 |
| p.R141H | BRCA | 1 |
| p.L81F | SKCM | 1 |
| p.Y886F | UCEC | 1 |
| p.R1019W | KIRP | 1 |
| p.L888F | SKCM | 1 |
| p.G558V | LUSC | 1 |
| p.H1009Y | SKCM | 1 |
| p.I996V | SARC | 1 |
| p.E1130* | LUSC | 1 |
| p.G31C | THYM | 1 |
| p.E238K | SKCM | 1 |
| p.G1165D | UCEC | 1 |
| p.F553L | BLCA | 1 |
| p.G369S | SKCM | 1 |
| p.P838A | UCS | 1 |
| p.S881L | SKCM | 1 |
| p.P319L | HNSC | 1 |
| p.E817K | SKCM | 1 |
| p.A617T | LGG | 1 |
| p.E599K | SKCM | 1 |
| p.E913K | ESCA | 1 |
| p.G1027_splice | GBM | 1 |
| p.E460K | UCEC | 1 |
| p.S688C | BLCA | 1 |
| p.R452G | HNSC | 1 |
| p.R1163H | STAD | 1 |
| p.R64H | UCEC | 1 |
| p.V1209M | UCEC | 1 |
| p.K320N | UCEC | 1 |
| p.K76N | BLCA | 1 |
| p.R176L | LUSC | 1 |
| p.A595V | SKCM | 1 |
| p.E618Q | BLCA | 1 |
| p.L724Q | LUAD | 1 |
| p.P403L | SKCM | 1 |
| p.F603S | OV | 1 |
| p.V177I | KICH | 1 |
| p.R421M | BLCA | 1 |
| p.T504K | ESCA | 1 |
| p.A165V | SKCM | 1 |
| p.P949L | SKCM | 1 |
| p.R1268C | COAD | 1 |
| p.R1097X | SKCM | 1 |
| p.V191M | PRAD | 1 |
| p.A1259T | SKCM | 1 |
| p.T1232A | SKCM | 1 |
| p.E38K | LUAD | 1 |
| p.I1264N | TGCT | 1 |
| p.A1301E | CESC | 1 |
| p.F615L | PRAD | 1 |
| p.P767T | ESCA | 1 |
| p.M766I | BLCA | 1 |
| p.R726W | LUAD | 1 |
| p.A252V | SKCM | 1 |
| p.D956A | KIRC | 1 |
| p.S952F | SKCM | 1 |
| p.L786P | STAD | 1 |
| p.V240A | SKCM | 1 |
| p.E913K | CESC | 1 |
| p.N975K | PRAD | 1 |
| p.G561E | SKCM | 1 |
| p.R693C | STAD | 1 |
| p.G207E | SKCM | 1 |
| p.P820L | STAD | 1 |
| p.I647F | LUAD | 1 |
| p.G1159D | THYM | 1 |
| p.G148V | LUAD | 1 |
| p.S911F | SKCM | 1 |
| p.A414T | LUAD | 1 |
| p.P1137S | SKCM | 1 |
| p.R421M | LUAD | 1 |
| p.S1033G | LGG | 1 |
| p.Q409L | LIHC | 1 |
| p.S466F | SKCM | 1 |
| p.M766I | LIHC | 1 |
| p.R726Q | COAD | 1 |
| p.L1107P | STAD | 1 |
| p.R201H | UCEC | 1 |
| p.M1174I | BLCA | 1 |
| p.D583N | SKCM | 1 |
| p.P474L | THCA | 1 |
| p.F494L | ESCA | 1 |
| p.D250N | UCEC | 1 |
| p.D469Y | LUAD | 1 |
| p.P474S | SKCM | 1 |
| p.R1325Q | PRAD | 1 |
| p.H1080R | BLCA | 1 |
| p.R306C | SKCM | 1 |
| p.L99P | STAD | 1 |
| p.F1265I | LIHC | 1 |
| p.R406Q | SKCM | 1 |
| p.R627H | UCEC | 1 |
| p.K41N | UCEC | 1 |
| p.E166G | STAD | 1 |
| p.R738Q | SKCM | 1 |
| p.G31D | PAAD | 1 |
| p.C1146Y | LUSC | 1 |
| p.R201H | STAD | 1 |
| p.W202R | LUAD | 1 |
| p.D1041N | SKCM | 1 |
| p.R1019L | LUAD | 1 |
| p.A595V | TGCT | 1 |
| p.N1297Y | LUAD | 1 |
| p.L96P | SKCM | 1 |
| p.P235H | LUAD | 1 |
| p.A34T | UCEC | 1 |
| p.L1195R | COAD | 1 |
| p.E38K | COAD | 1 |
| p.R463H | COAD | 1 |
| p.R806W | READ | 1 |
| p.R1097* | SKCM | 1 |
| p.S104L | SKCM | 1 |
| p.D1330H | BRCA | 1 |
| p.R968C | SKCM | 1 |
| p.I355V | OV | 1 |
| p.A461E | THCA | 1 |
| p.A762V | SKCM | 1 |
| p.Y559H | KIRC | 1 |
| p.S1205F | CESC | 1 |
| p.A1310G | HNSC | 1 |
| p.T573M | PRAD | 1 |
| p.W202C | LUAD | 1 |
| p.V1296I | LUAD | 1 |
| p.E44V | LUAD | 1 |
| p.S982L | LUSC | 1 |
| p.D484N | STAD | 1 |
| p.E245A | STAD | 1 |
| p.D955G | LUAD | 1 |
| p.A739T | THYM | 1 |
| p.C197F | HNSC | 1 |
| p.S433N | STAD | 1 |
| p.L782F | SKCM | 1 |
| p.T335I | UCEC | 1 |
| p.Q492H | PAAD | 1 |
| p.R693H | LUAD | 1 |
| p.N1021S | HNSC | 1 |
| p.A93T | STAD | 1 |
| p.P1115Q | LUAD | 1 |
| p.Q95L | STAD | 1 |
| p.G1187S | SKCM | 1 |
| p.C989S | ACC | 1 |
| p.G870R | SKCM | 1 |
| p.I571L | UCEC | 1 |
| p.R1002M | LUAD | 1 |
| p.G402A | UCEC | 1 |
| p.M510I | SKCM | 1 |
| p.M572I | SKCM | 1 |
| p.G402S | COAD | 1 |
| p.V1193M | UCEC | 1 |
| p.K76N | UCEC | 1 |
| p.A368E | CHOL | 1 |
| p.A793V | UCEC | 1 |
| p.P415T | GBM | 1 |
| p.R463C | BLCA | 1 |
| p.R1268H | STAD | 1 |
| p.N497S | OV | 1 |
| p.P477S | SKCM | 1 |
| p.S293F | CESC | 1 |
| p.L501P | STAD | 1 |
| p.P1249L | SKCM | 1 |
| p.F396L | BLCA | 1 |
| p.P429L | SKCM | 1 |
| p.T377M | SARC | 1 |
| p.L1300V | BLCA | 1 |
| p.Q588H | COAD | 1 |
| p.D37G | LIHC | 1 |
| p.D520N | SKCM | 1 |
| Top |
| TissGeneCNV for NPC1L1 |
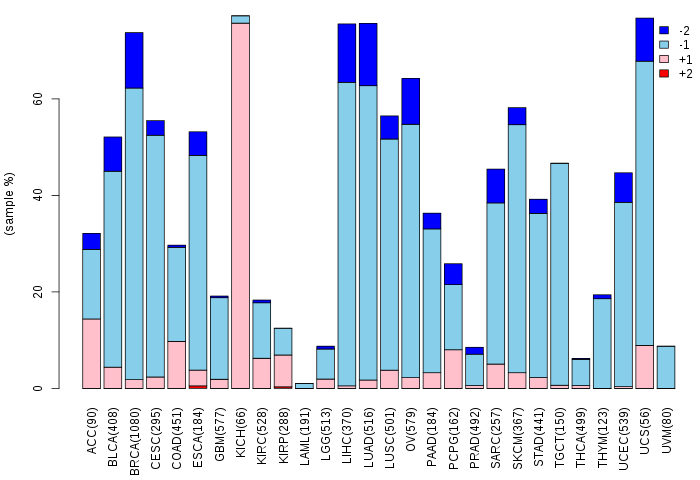
| Copy number variations of TissGene across 28 cancer types (X-axis: cancer type and Y-axis: % of CNV samples) (TCGA Gistic2_CopyNumber_Gistic2_all_data_by_genes, Gistic2 copy number data, version 2016-08-16) |
 |
| Top |
| TissGeneFusions for NPC1L1 |
| Fusion genes including TissGene (ChimerDB 3.0, 2016-12-01 and TCGA fusion Portal 2015-12-01) |
| Database | Src | Cancer type | Sample | Fusion gene | ORF | 5'-gene BP | 3'-gene BP |
| Top |
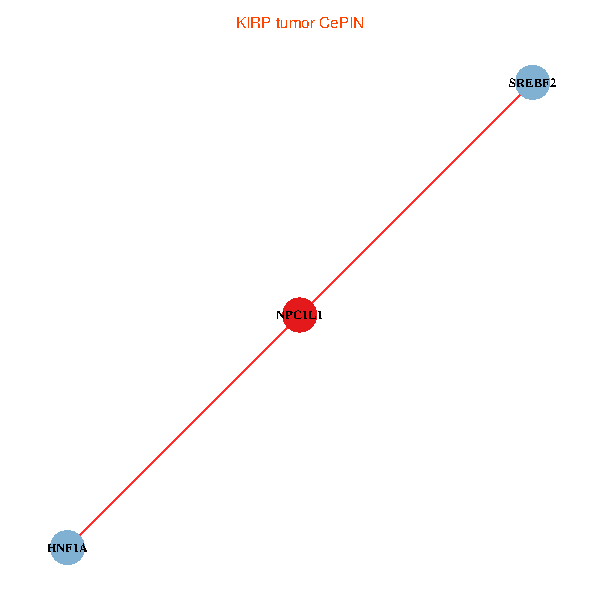
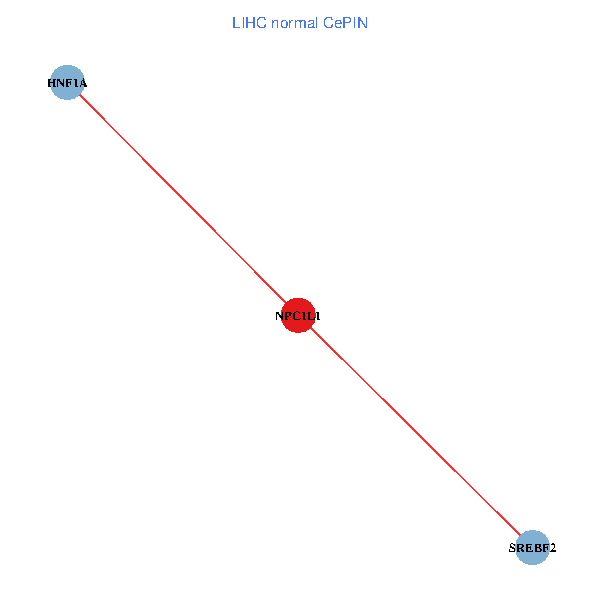
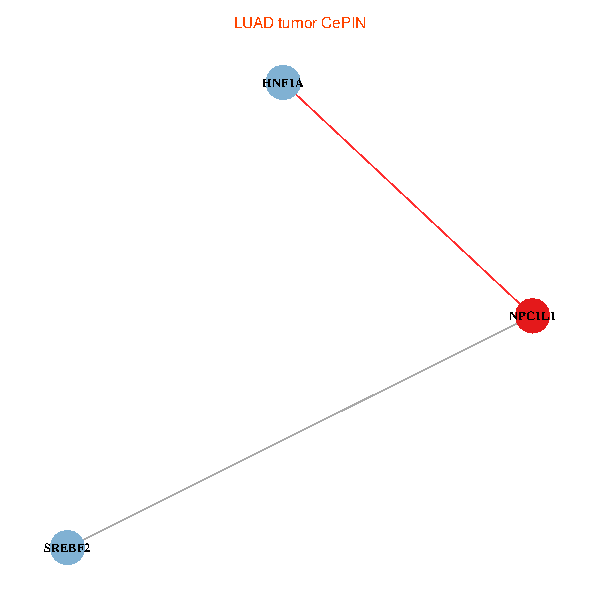
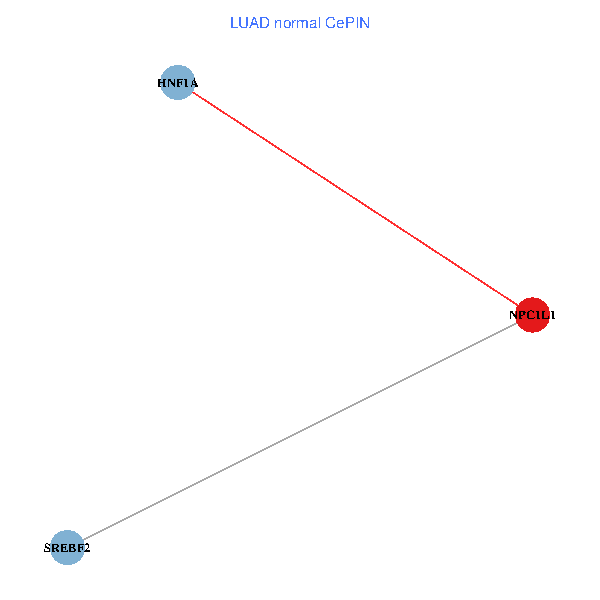
| TissGeneNet for NPC1L1 |
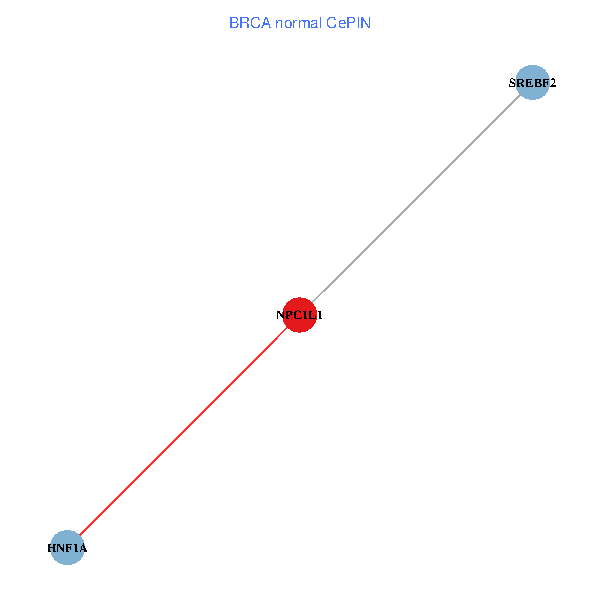
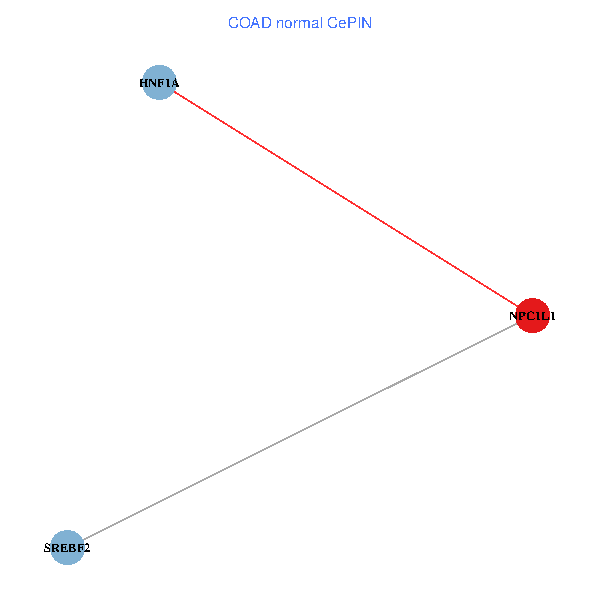
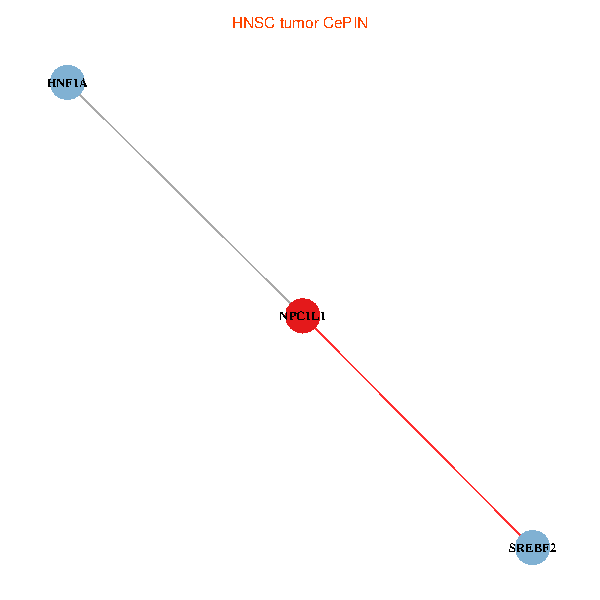
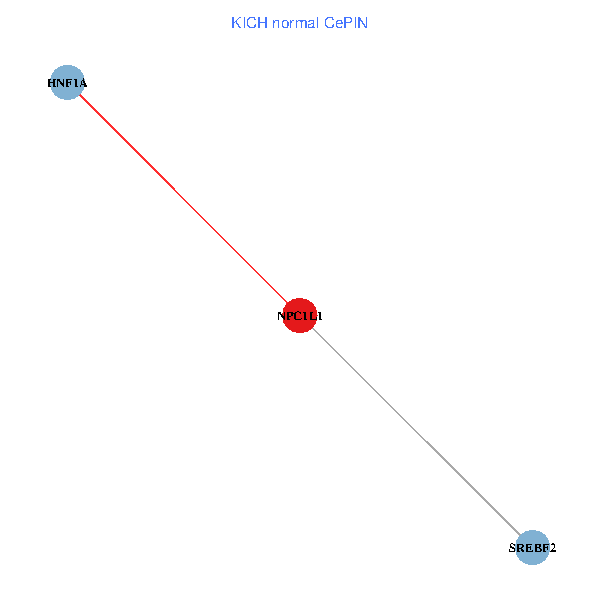
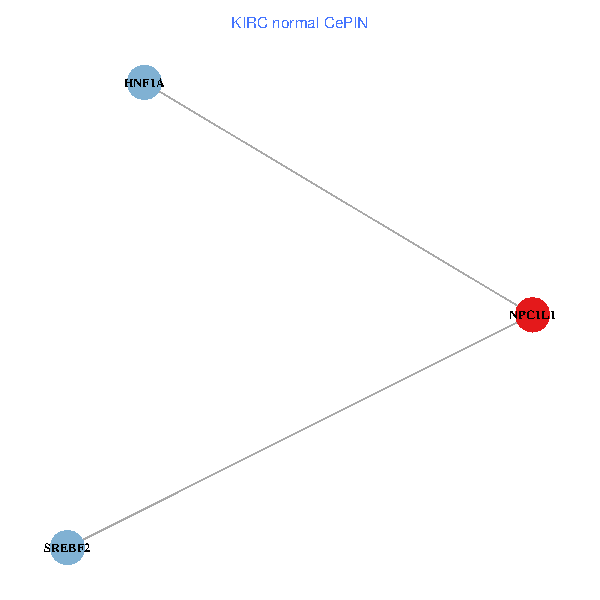
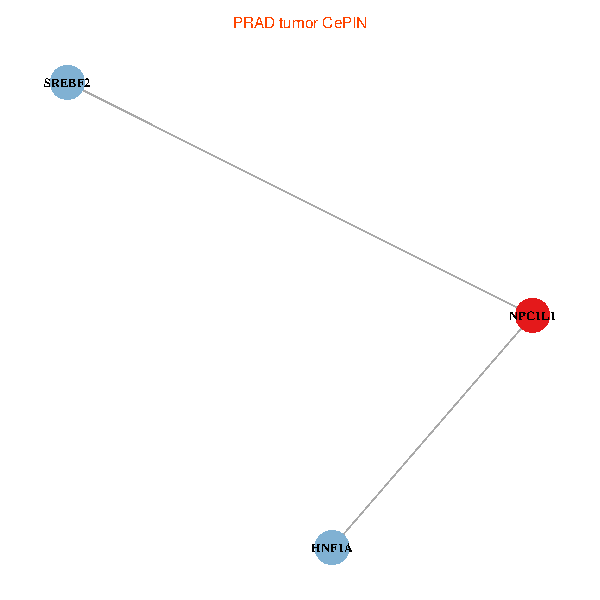
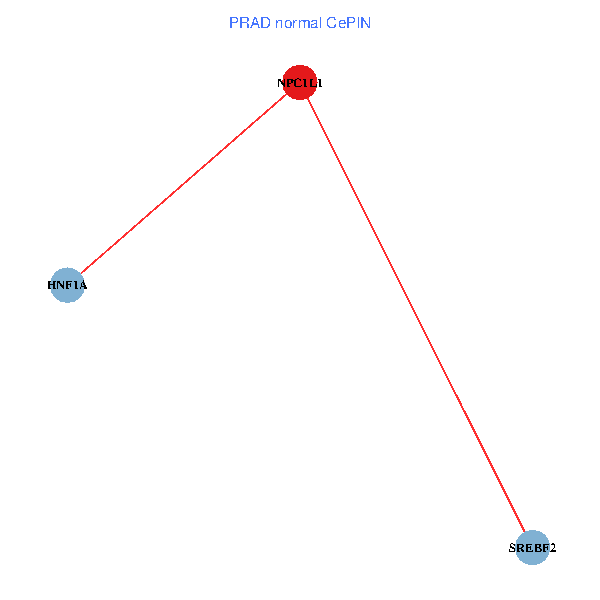
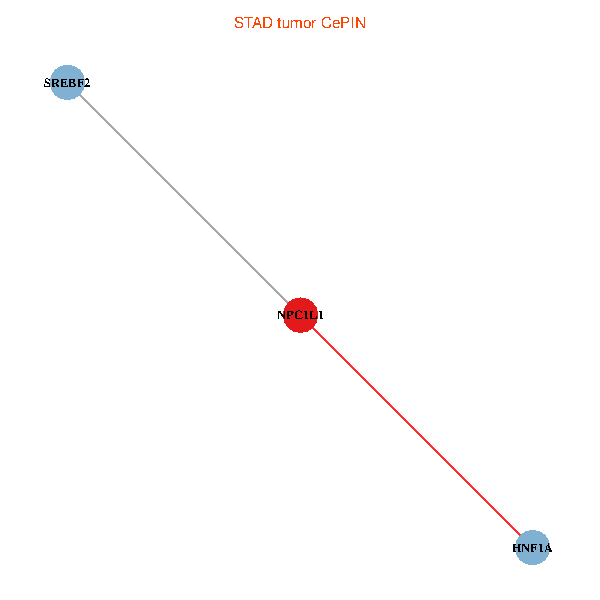
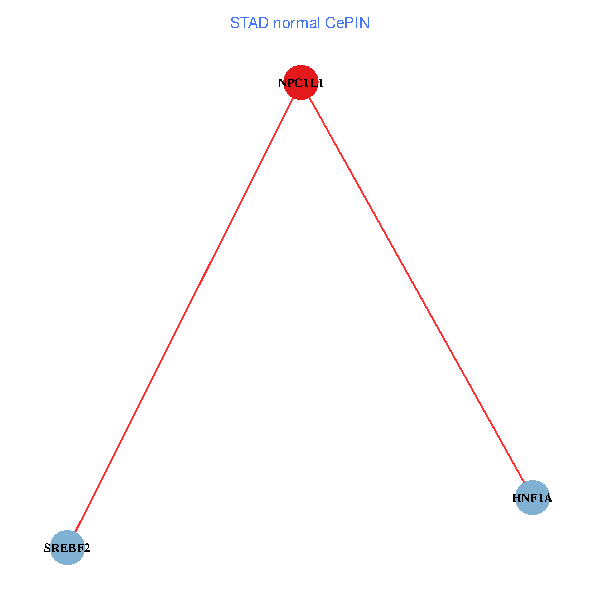
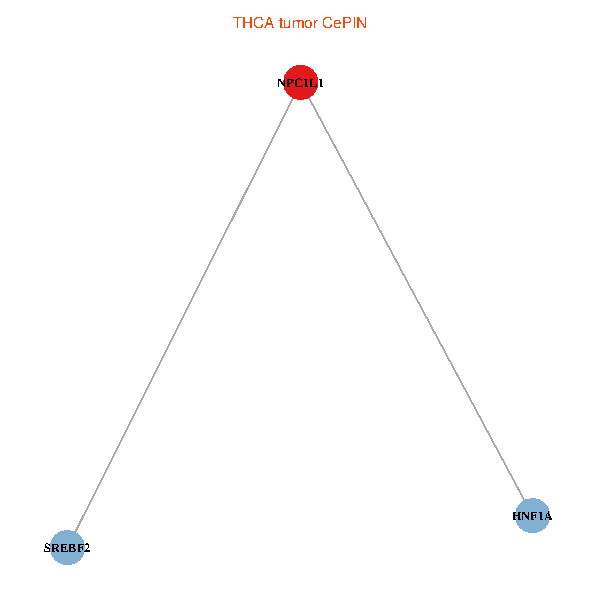
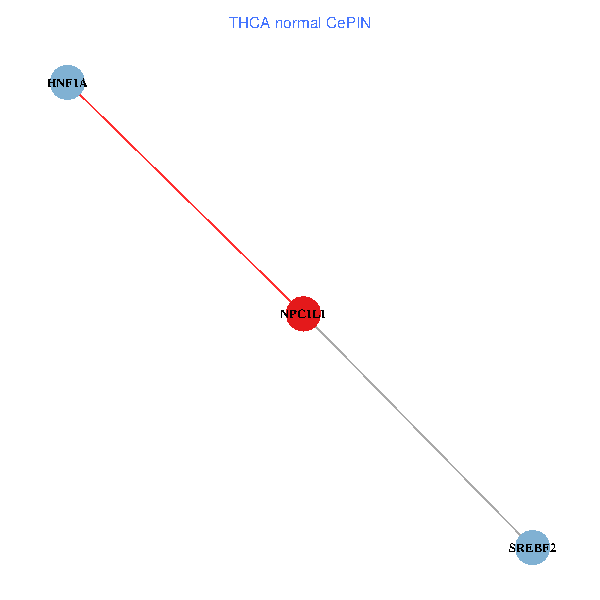
| Co-expressed gene networks based on protein-protein interaction data (CePIN) (TCGA IlluminaHiSeq_RNASeqV2, pan-cancer normalized log2(norm_counts+1) data, version 2016-08-16) (PINA2 ppi data) |
| BRCA (tumor) | BRCA (normal) |
| NPC1L1, HNF1A, SREBF2 (tumor) | NPC1L1, HNF1A, SREBF2 (normal) |
 |  |
| COAD (tumor) | COAD (normal) |
| NPC1L1, HNF1A, SREBF2 (tumor) | NPC1L1, HNF1A, SREBF2 (normal) |
 |  |
| HNSC (tumor) | HNSC (normal) |
| NPC1L1, HNF1A, SREBF2 (tumor) | NPC1L1, HNF1A, SREBF2 (normal) |
 |  |
| KICH (tumor) | KICH (normal) |
| NPC1L1, HNF1A, SREBF2 (tumor) | NPC1L1, HNF1A, SREBF2 (normal) |
 |  |
| KIRC (tumor) | KIRC (normal) |
| NPC1L1, HNF1A, SREBF2 (tumor) | NPC1L1, HNF1A, SREBF2 (normal) |
 |  |
| KIRP (tumor) | KIRP (normal) |
| NPC1L1, HNF1A, SREBF2 (tumor) | NPC1L1, HNF1A, SREBF2 (normal) |
 |  |
| LIHC (tumor) | LIHC (normal) |
| NPC1L1, HNF1A, SREBF2 (tumor) | NPC1L1, HNF1A, SREBF2 (normal) |
 |  |
| LUAD (tumor) | LUAD (normal) |
| NPC1L1, HNF1A, SREBF2 (tumor) | NPC1L1, HNF1A, SREBF2 (normal) |
 |  |
| LUSC (tumor) | LUSC (normal) |
| NPC1L1, HNF1A, SREBF2 (tumor) | NPC1L1, HNF1A, SREBF2 (normal) |
 |  |
| PRAD (tumor) | PRAD (normal) |
| NPC1L1, HNF1A, SREBF2 (tumor) | NPC1L1, HNF1A, SREBF2 (normal) |
 |  |
| STAD (tumor) | STAD (normal) |
| NPC1L1, HNF1A, SREBF2 (tumor) | NPC1L1, HNF1A, SREBF2 (normal) |
 |  |
| THCA (tumor) | THCA (normal) |
| NPC1L1, HNF1A, SREBF2 (tumor) | NPC1L1, HNF1A, SREBF2 (normal) |
 |  |
| Top |
| TissGeneProg for NPC1L1 |
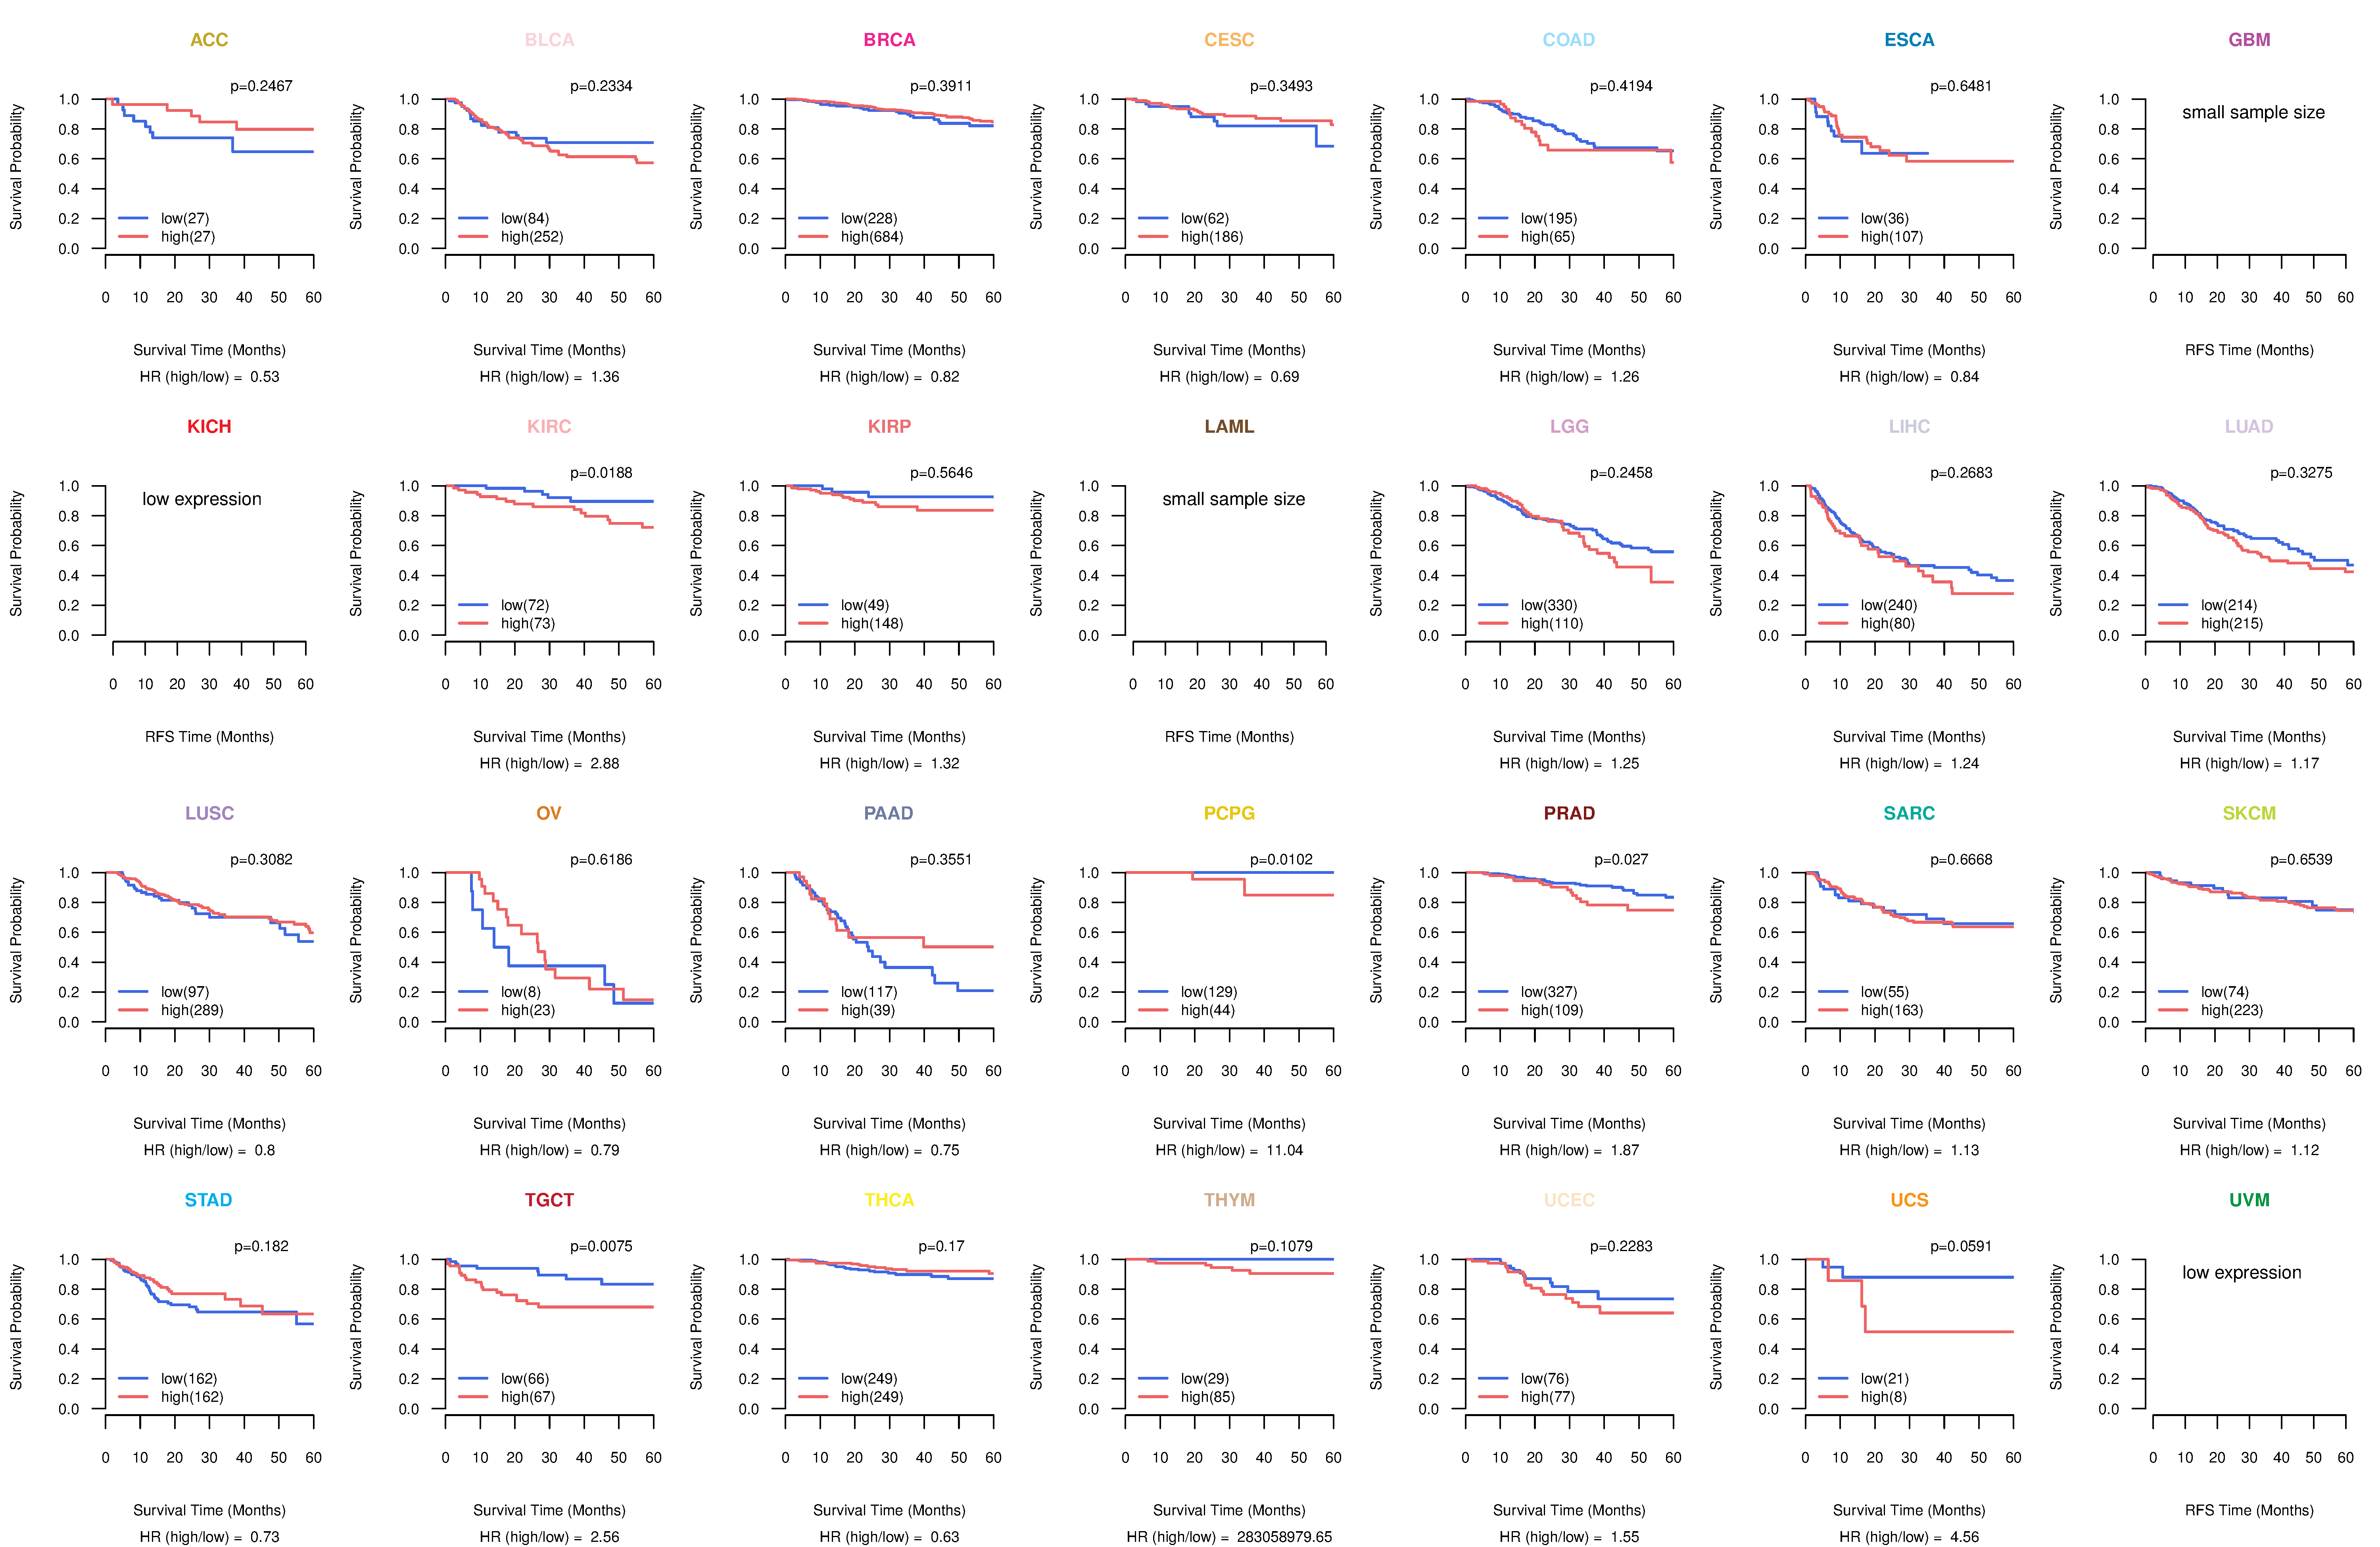
| Kaplan-Meier plots with logrank tests of overall survival (OS) using 28 cancer types (TCGA IlluminaHiSeq_RNASeqV2, pan-cancer normalized log2(norm_counts+1) data, version 2016-08-16) (TCGA clinicalMatrix, phenotype data, version 2016-04-27) * Click on the image to enlarge it in a new window. |
 |
| Kaplan-Meier plots with logrank test of relapse free survival (RFS) using 28 cancer types (TCGA IlluminaHiSeq_RNASeqV2, pan-cancer normalized log2(norm_counts+1) data, version 2016-08-16) (TCGA clinicalMatrix, phenotype data, version 2016-04-27) * Click on the image enlarge it in a new window. |
 |
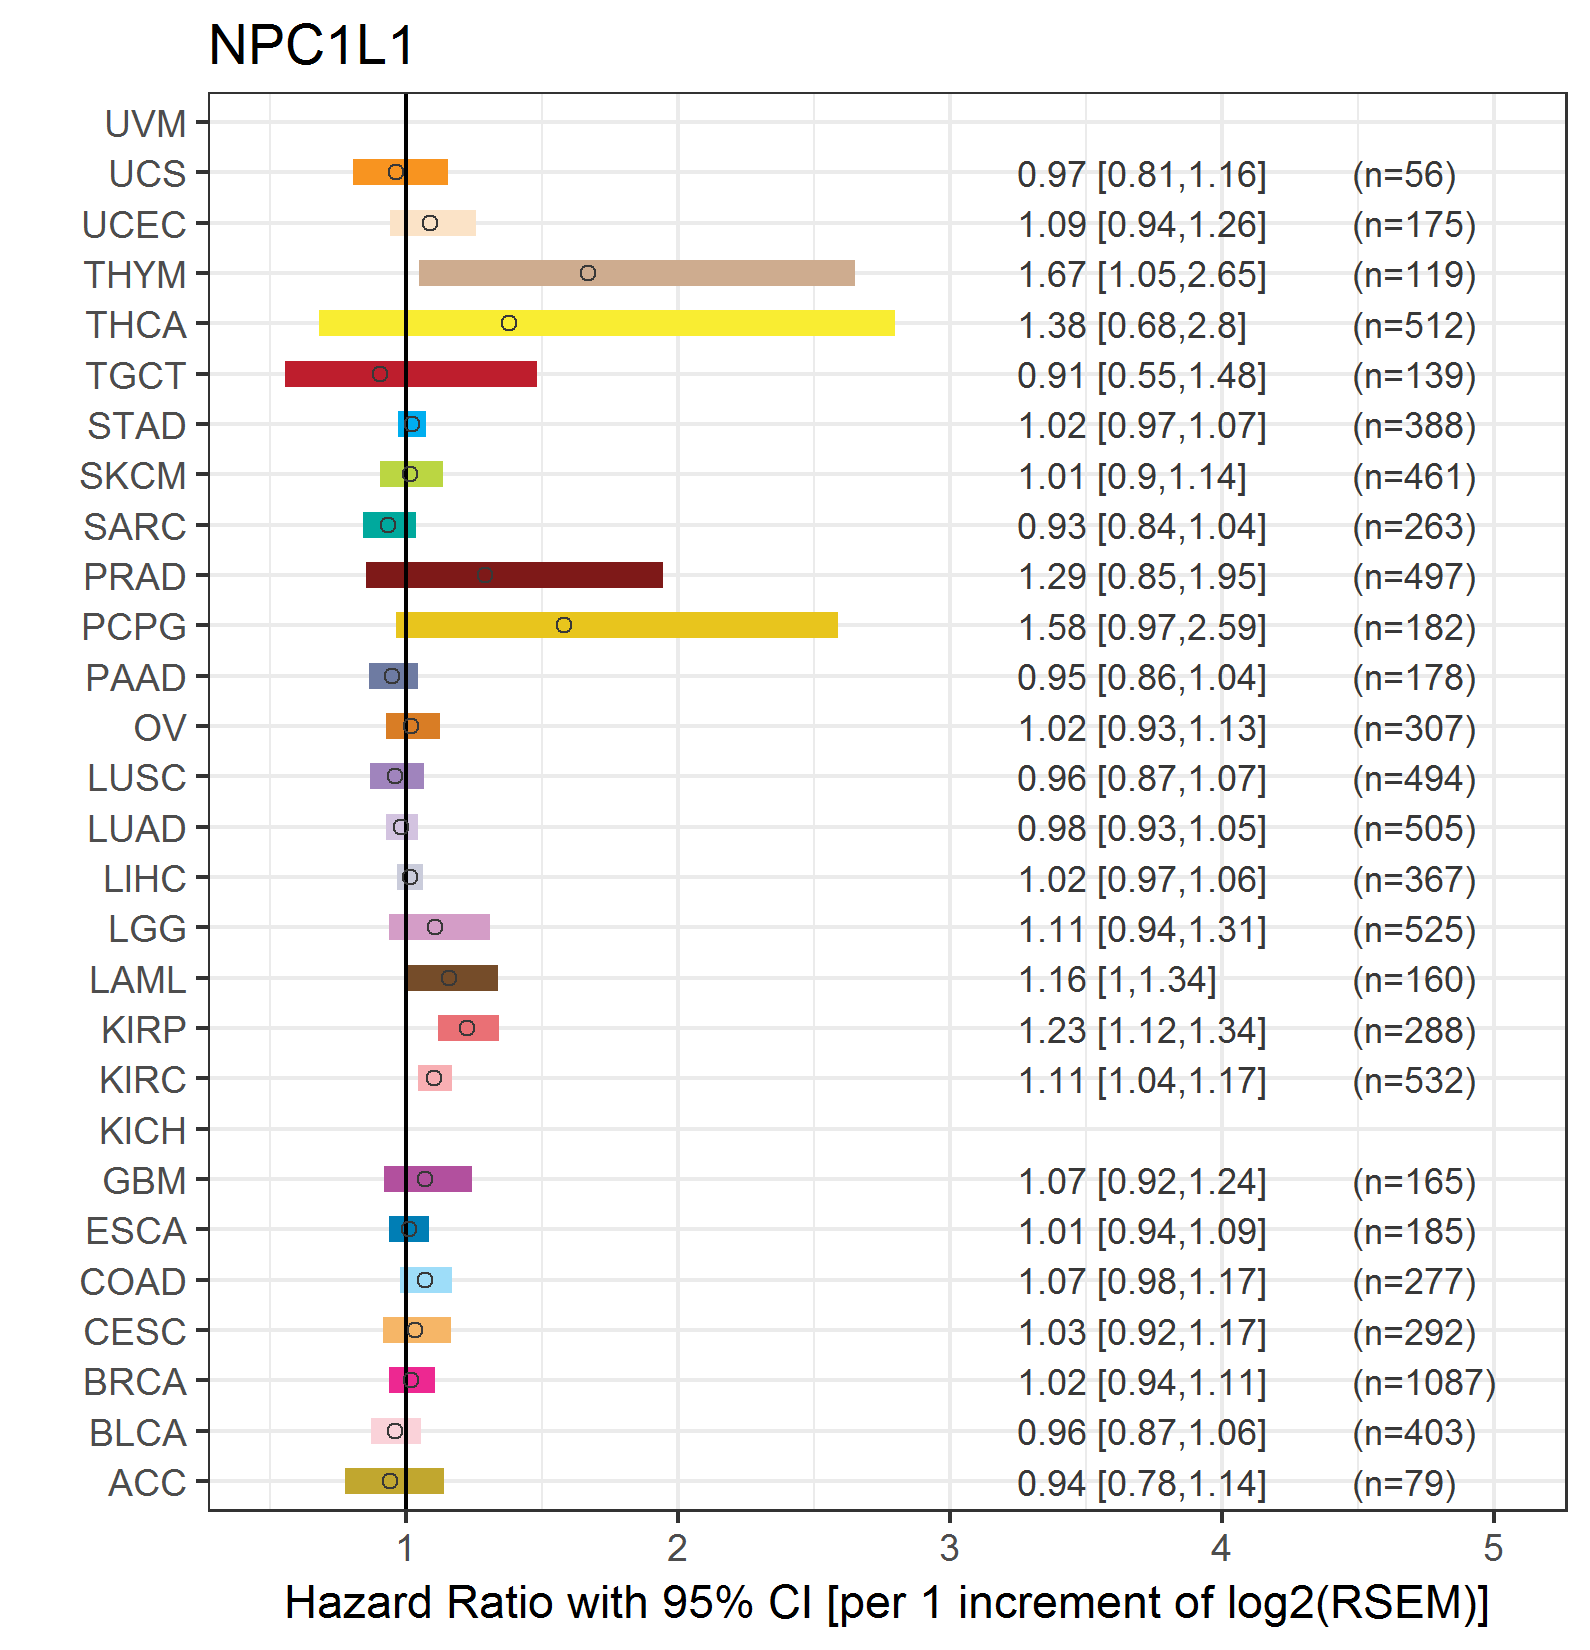
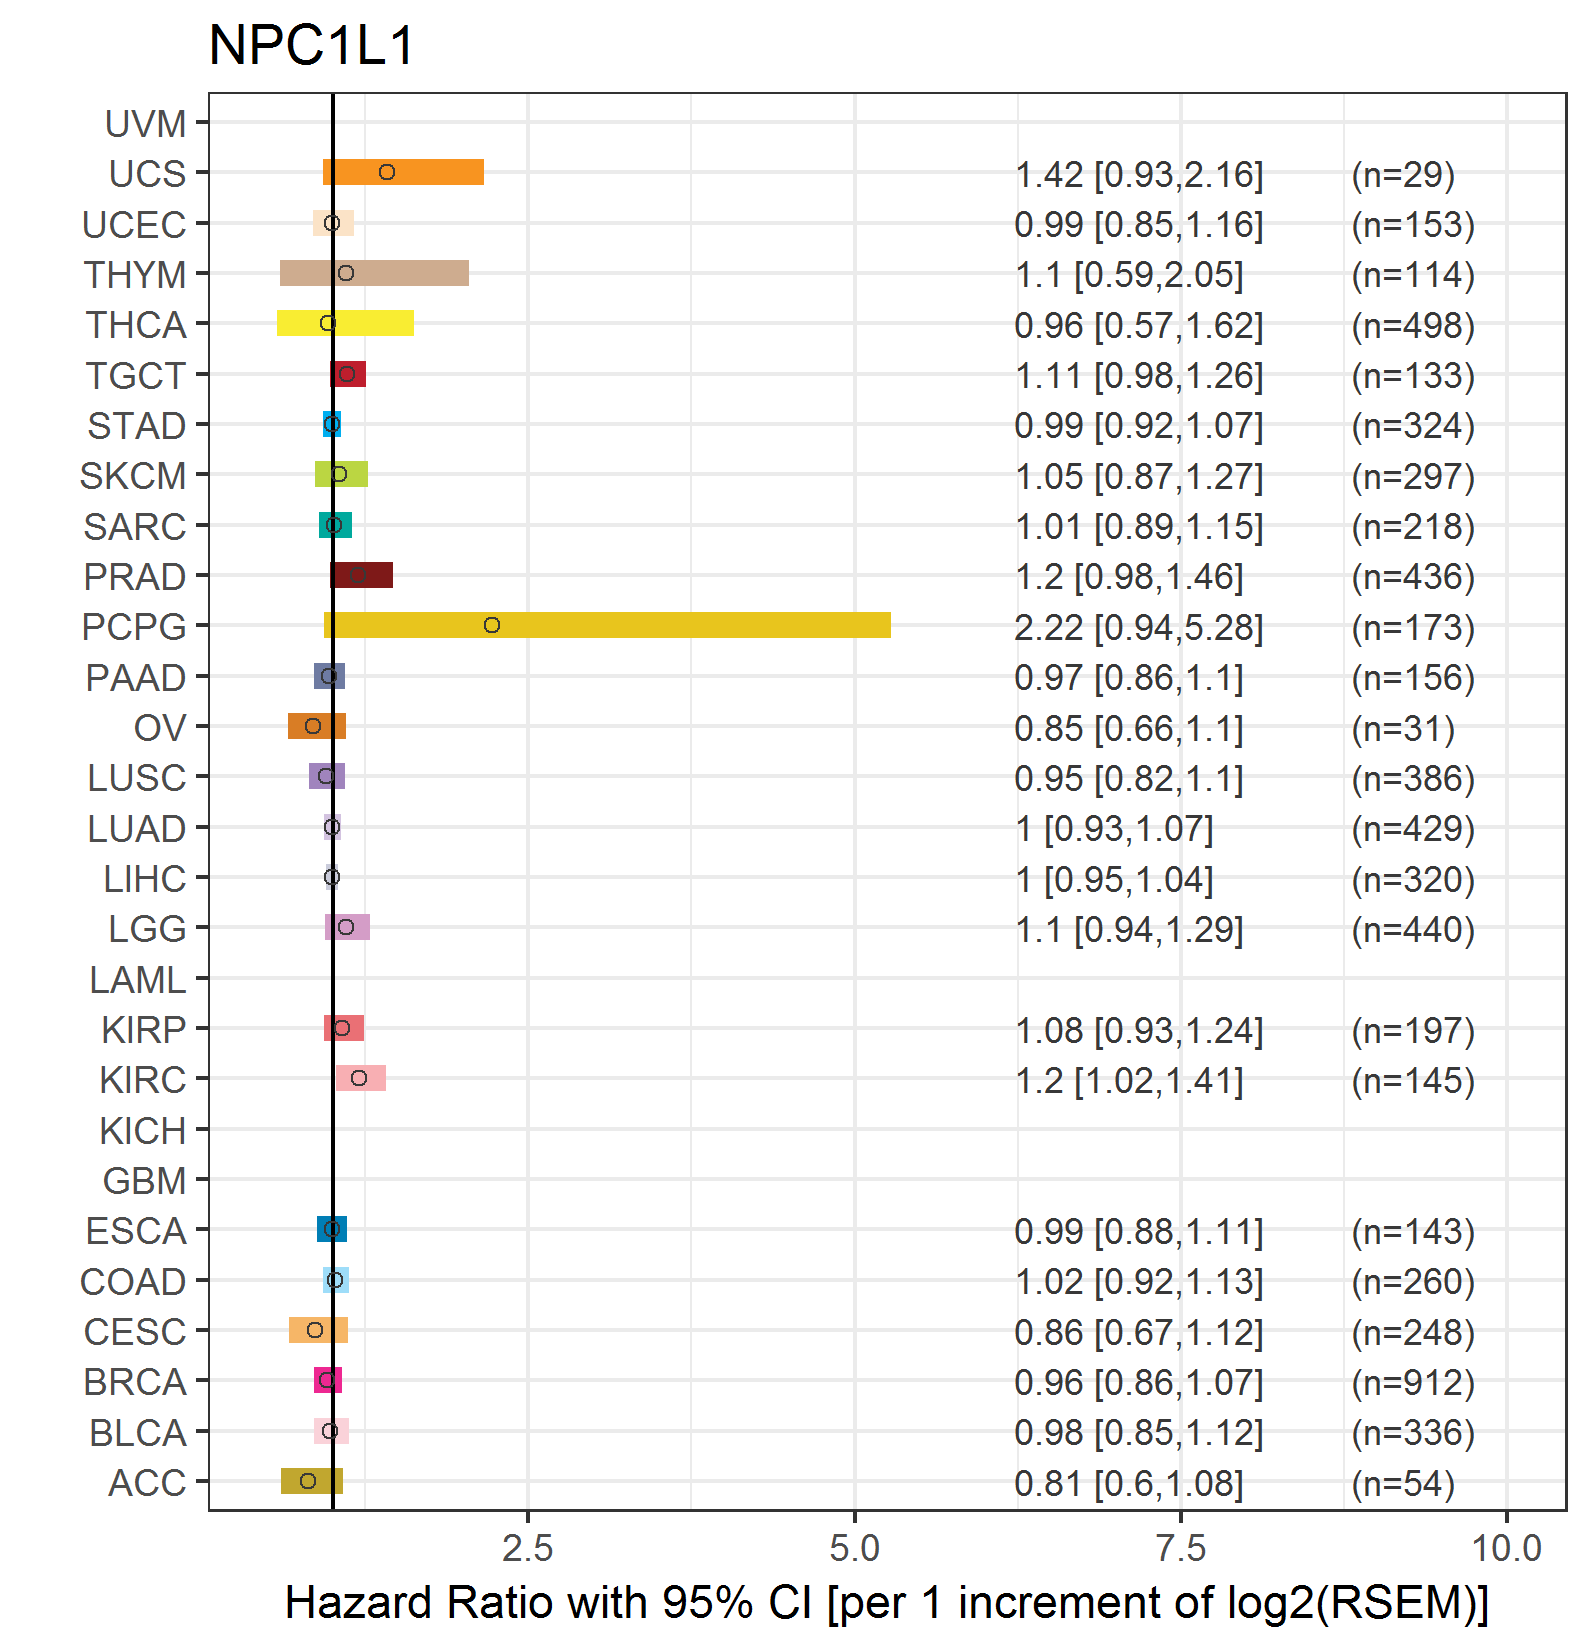
| Forest plot of Cox proportional hazard ratio (HR) and 95% CI of overall survival (OS) using 28 cancer types (TCGA IlluminaHiSeq_RNASeqV2, pan-cancer normalized log2(norm_counts+1) data, version 2016-08-16) (TCGA clinicalMatrix, phenotype data, version 2016-04-27) * Click on the image enlarge it in a new window. |
 |
| Forest plot of Cox proportional hazard ratio (HR) and 95% CI of relapse free survival (RFS) using 28 cancer types (TCGA IlluminaHiSeq_RNASeqV2, pan-cancer normalized log2(norm_counts+1) data, version 2016-08-16) (TCGA clinicalMatrix, phenotype data, version 2016-04-27) * Click on the image enlarge it in a new window. |
 |
| Top |
| TissGeneClin for NPC1L1 |
| TissGeneDrug for NPC1L1 |
| Drug information targeting TissGene (DrugBank Version 5.0.6, 2017-04-01) |
| DrugBank ID | Drug name | Drug activity | Drug type | Drug status |
| DB00973 | Ezetimibe | Inhibitor | Small molecule | Approved |
| Top |
| TissGeneDisease for NPC1L1 |
| Disease information associated with TissGene (DisGeNet, 2016-06-01) |
| Disease ID | Disease name | # pubmeds | Source |
| umls:C0020443 | Hypercholesterolemia | 9 | BeFree,GAD,LHGDN |
| umls:C0010068 | Coronary heart disease | 5 | BeFree,GAD |
| umls:C0856727 | Cholesterol gallstones | 3 | BeFree |
| umls:C0020473 | Hyperlipidemia | 2 | BeFree,GAD |
| umls:C0028754 | Obesity | 2 | BeFree,GAD |
| umls:C0010054 | Coronary Arteriosclerosis | 1 | BeFree |
| umls:C0011849 | Diabetes Mellitus | 1 | BeFree |
| umls:C0011853 | Diabetes Mellitus, Experimental | 1 | RGD |
| umls:C0018799 | Heart Diseases | 1 | BeFree,GAD |
| umls:C0020597 | Hypobetalipoproteinemias | 1 | BeFree |
| umls:C0021368 | Inflammation | 1 | GAD |
| umls:C0021655 | Insulin Resistance | 1 | GAD |
| umls:C0242339 | Dyslipidemias | 1 | BeFree |
| umls:C0311277 | Obesity, Abdominal | 1 | BeFree |
| umls:C0745103 | Hyperlipoproteinemia Type IIa | 1 | BeFree |
| umls:C1862596 | Familial hypobetalipoproteinemia | 1 | BeFree |
| umls:C1956346 | Coronary Artery Disease | 1 | GAD |
|
Copyright 2016-Present - The University of Texas Health Science Center at Houston (UTHealth) Web File Viewing | How to Report, Fraud, Waste and Abuse | State of Texas | Statewide Search | Texas Homeland Security | Site Policies |