 |
| |
| |
| |
| |
| |
| |
|

| TissGeneSummary for HCFC2 |
 Gene summary Gene summary |
| Basic gene information | Gene symbol | HCFC2 |
| Gene name | host cell factor C2 | |
| Synonyms | HCF-2|HCF2 | |
| Cytomap | UCSC genome browser: 12q23.3 | |
| Type of gene | protein-coding | |
| RefGenes | NM_013320.2, | |
| Description | C2 factorhost cell factor 2 | |
| Modification date | 20141207 | |
| dbXrefs | MIM : 607926 | |
| HGNC : HGNC | ||
| Ensembl : ENSG00000111727 | ||
| HPRD : 06393 | ||
| Vega : OTTHUMG00000170175 | ||
| Protein | UniProt: go to UniProt's Cross Reference DB Table | |
| Expression | CleanEX: HS_HCFC2 | |
| BioGPS: 29915 | ||
| Pathway | NCI Pathway Interaction Database: HCFC2 | |
| KEGG: HCFC2 | ||
| REACTOME: HCFC2 | ||
| Pathway Commons: HCFC2 | ||
| Context | iHOP: HCFC2 | |
| ligand binding site mutation search in PubMed: HCFC2 | ||
| UCL Cancer Institute: HCFC2 | ||
| Assigned class in TissGDB* | C | |
| Included tissue-specific gene expression resources | TiGER,GTEx | |
| Specific-tissues in normal samples (assigned by TissGDB using HPA, TiGER, and GTEx) | Testis | |
| Cancer types related to the specific-tissues in cancer samples (assigned by TissGDB using TCGA) | TGCT | |
| Reference showing the relevant tissue of HCFC2 | ||
| Description by TissGene annotations | TissgsLTS Fused withOncogene | |
| * Class A consists of genes with literature evidence and is part of the cTissGenes. Class B consists of only cTissGenes without additional evidence. The remaining genes belong to Class C. |
| Gene ontology having evidence of Inferred from Direct Assay (IDA) from Entrez |
| GO ID | GO term | PubMed ID |
| Top |
| TissGeneExp for HCFC2 |
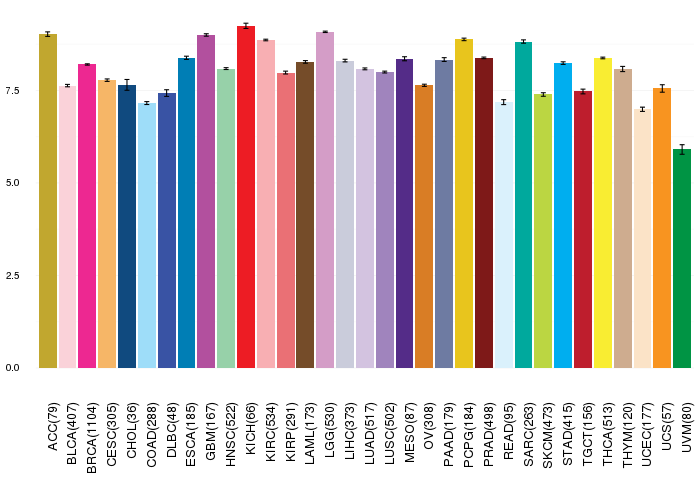
| Gene expressions across 28 cancer types (X-axis: cancer type and Y-axis: log2(norm_counts+1)) (TCGA IlluminaHiSeq_RNASeqV2, pan-cancer normalized log2(norm_counts+1) data, version 2016-08-16) |
 |
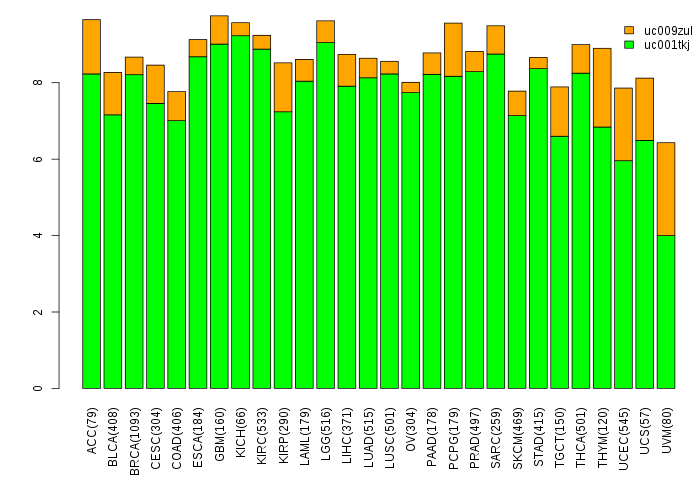
| Gene isoform expressions across 28 cancer types (X-axis: cancer type and Y-axis: log2(norm_counts+1)) (TCGA pan-cancer tcga_rsem_isoform_tpm, version 2016-09-01) |
 |
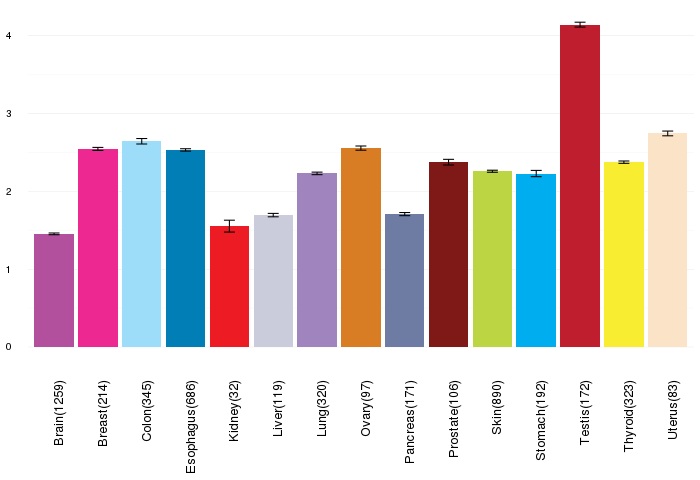
| Gene expressions across normal tissues of GTEx data (GTEx GTEx_Analysis_v6_RNA-seq_RNA-SeQCv1.1.8_gene_rpkm.gct) - Here, we shows the matched tissue types only among our 28 cancer types. |
 |
| Different expressions across 14 cancer types with more than 10 samples between matched tumors and normals (X-axis: cancer type and Y-axis: log2(norm_counts+1)) (TCGA IlluminaHiSeq_RNASeqV2, pan-cancer normalized log2(norm_counts+1) data, version 2016-08-16) |
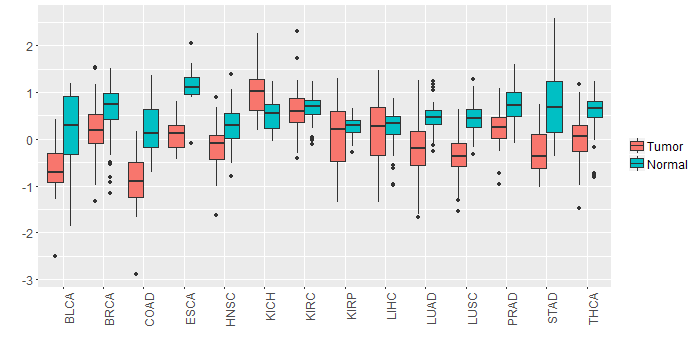 |
| - Significantly differentially expressed cancer types and information. (|Fold change|>1 and FDR<0.05) |
| Cancer type | Mean(exp) in tumor | Mean(exp) in matched normal | Log2FC | P-val. | FDR |
| STAD | -0.233888978 | 0.808120397 | -1.042009375 | 1.43E-07 | 3.61E-06 |
| COAD | -0.884001237 | 0.211491071 | -1.095492308 | 1.76E-08 | 1.47E-07 |
| ESCA | 0.110750511 | 1.132505057 | -1.021754545 | 5.42E-05 | 0.002114751 |
| Top |
| TissGene-miRNA for HCFC2 |
| Significantly anti-correlated miRNAs of TissGene across 28 cancer types (Gene-miRNA relations from TargetScanHuman Relsease 7.1, Conserved_Site_Context_Scores.txt.zip, 06.01.2016) (TCGA IlluminaHiSeq_miRNASeq, log2(RPM+1) data, version 2016-11-21) (TCGA IlluminaHiSeq_RNASeqV2, log2(normalized_count+1) data, version 2016-08-16) (Spearman’s Rank Correlation (p-value<0.05 and coefficient<-0.25)) |
| Cancer type | miRNA id | miRNA accession | P-val. | Coeff. | # samples |
| LUSC | hsa-let-7c-5p | MIMAT0000064 | 0.0036 | -0.26 | 128 |
| THYM | hsa-miR-520e | MIMAT0002825 | 0.012 | -0.28 | 122 |
| UCS | hsa-miR-381-3p | MIMAT0000736 | 0.035 | -0.28 | 56 |
| UCS | hsa-miR-495-3p | MIMAT0002817 | 0.035 | -0.28 | 56 |
| Top |
| TissGeneMut for HCFC2 |
| TissGeneSNV for HCFC2 |
| nsSNV counts per each loci. Different colors of circles represent different cancer types. Circle size denotes number of samples. (TCGA somatic mutation (SNPs and small INDELs) data, version 2016-04-25) * Click on the image to enlarge it in a new window. |
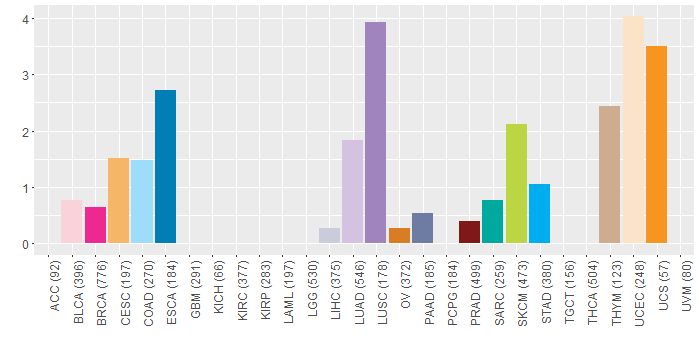
 |
 |
| Somatic nucleotide variants of TissGene across 28 cancer types (X-axis: cancer type and Y-axis: % of mutated samples) The numbers in parentheses are numbers of samples with mutation (nsSNVs). (TCGA somatic mutation (SNPs and small INDELs) data, version 2016-04-25) |
 |
| - nsSNVs sorted by frequency. |
| AAchange | Cancer type | # samples |
| p.R107H | BRCA | 1 |
| p.W232C | UCEC | 1 |
| p.P675S | SARC | 1 |
| p.V91A | UCEC | 1 |
| p.S303Y | LUSC | 1 |
| p.T369A | LIHC | 1 |
| p.A322V | THYM | 1 |
| p.T56M | COAD | 1 |
| p.P703L | LUAD | 1 |
| p.R596* | UCEC | 1 |
| p.A589S | SARC | 1 |
| p.E92Q | BLCA | 1 |
| p.V86L | UCEC | 1 |
| p.P584L | SKCM | 1 |
| p.E167* | LUAD | 1 |
| p.S428_splice | LUSC | 1 |
| p.R596* | UCS | 1 |
| p.P587S | SKCM | 1 |
| p.K592X | ESCA | 1 |
| p.L502R | LUSC | 1 |
| p.E558* | UCEC | 1 |
| p.K485R | LUSC | 1 |
| p.G129* | SKCM | 1 |
| p.Y209H | STAD | 1 |
| p.D151H | BRCA | 1 |
| p.P187H | UCEC | 1 |
| p.G71D | ESCA | 1 |
| p.A73S | THYM | 1 |
| p.R127Q | UCEC | 1 |
| p.E150K | READ | 1 |
| p.T458M | OV | 1 |
| p.G71V | BLCA | 1 |
| p.H276Y | BLCA | 1 |
| p.L610F | HNSC | 1 |
| p.K592* | ESCA | 1 |
| p.E445* | LUSC | 1 |
| p.L390F | CESC | 1 |
| p.T739I | HNSC | 1 |
| p.R780W | READ | 1 |
| p.R596X | UCS | 1 |
| p.R326Q | COAD | 1 |
| p.P466S | SKCM | 1 |
| p.E582D | ESCA | 1 |
| p.I624F | LUAD | 1 |
| p.R780W | SKCM | 1 |
| p.P681H | ESCA | 1 |
| p.E691K | LUAD | 1 |
| p.Q389K | LUAD | 1 |
| p.E102K | CESC | 1 |
| p.R218H | STAD | 1 |
| p.G662R | BRCA | 1 |
| p.K639T | COAD | 1 |
| p.R245Q | ESCA | 1 |
| p.G44S | SKCM | 1 |
| p.S131I | UCEC | 1 |
| p.K138N | PAAD | 1 |
| p.Y93C | SKCM | 1 |
| p.D415N | LUAD | 1 |
| p.E582K | STAD | 1 |
| p.V64L | BRCA | 1 |
| p.R245* | CESC | 1 |
| p.S625* | HNSC | 1 |
| p.F142C | LUAD | 1 |
| p.W9* | LUAD | 1 |
| p.E191G | UCEC | 1 |
| p.C72G | SKCM | 1 |
| p.H193Y | SKCM | 1 |
| p.A22T | COAD | 1 |
| p.S285L | SKCM | 1 |
| p.H475Y | PRAD | 1 |
| p.S274L | SKCM | 1 |
| p.M230I | PRAD | 1 |
| p.L643I | UCEC | 1 |
| p.W330C | LUSC | 1 |
| p.N786S | LUAD | 1 |
| p.P242S | READ | 1 |
| p.A28S | UCEC | 1 |
| p.K267N | THYM | 1 |
| p.G89E | BRCA | 1 |
| p.W781C | ESCA | 1 |
| p.N724I | LUSC | 1 |
| p.R27P | LUAD | 1 |
| p.P584L | UCS | 1 |
| p.G324S | STAD | 1 |
| Top |
| TissGeneCNV for HCFC2 |
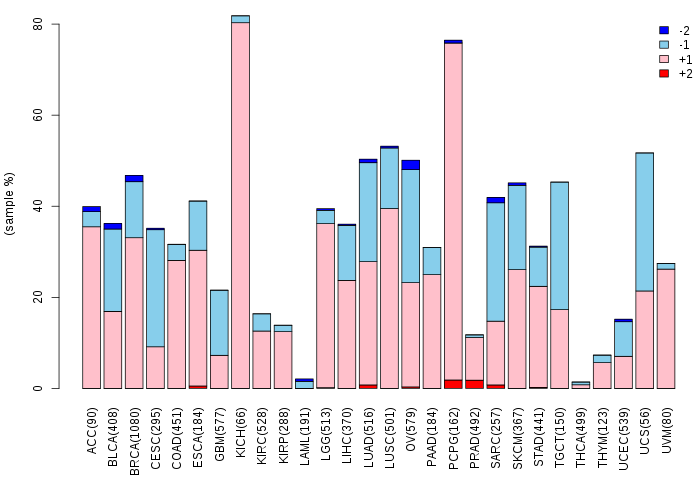
| Copy number variations of TissGene across 28 cancer types (X-axis: cancer type and Y-axis: % of CNV samples) (TCGA Gistic2_CopyNumber_Gistic2_all_data_by_genes, Gistic2 copy number data, version 2016-08-16) |
 |
| Top |
| TissGeneFusions for HCFC2 |
| Fusion genes including TissGene (ChimerDB 3.0, 2016-12-01 and TCGA fusion Portal 2015-12-01) |
| Database | Src | Cancer type | Sample | Fusion gene | ORF | 5'-gene BP | 3'-gene BP |
| Chimerdb3.0 | ChiTaRs | NA | AA625768 | MYOT-HCFC2 | chr5:137087660 | chr12:104495890 | |
| TCGAfusionPortal | PRADA | HNSC | TCGA-CV-7416-01A | CHST11-HCFC2 | In-frame | Chr12:104851292 | Chr12:104459945 |
| TCGAfusionPortal | PRADA | LGG | TCGA-HT-7611-01A | HCFC2-ANKS1B | Out-of-frame | Chr12:104492258 | Chr12:99640642 |
| TCGAfusionPortal | PRADA | LUSC | TCGA-43-2578-01A | TXNRD1-HCFC2 | Out-of-frame | Chr12:104682818 | Chr12:104474524 |
| Top |
| TissGeneNet for HCFC2 |
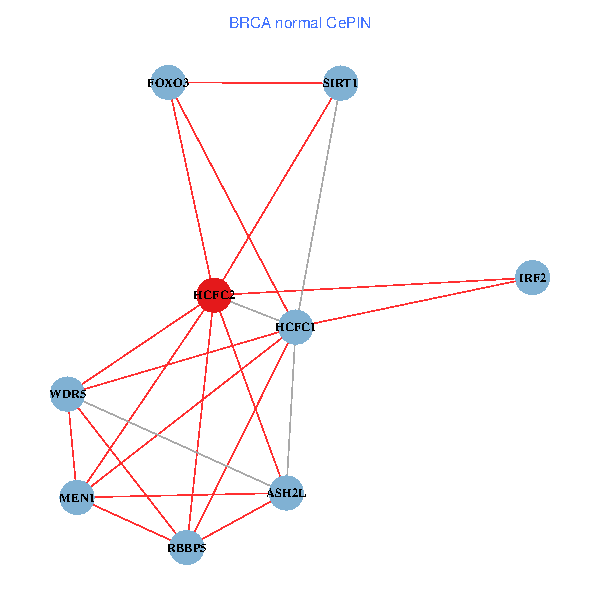
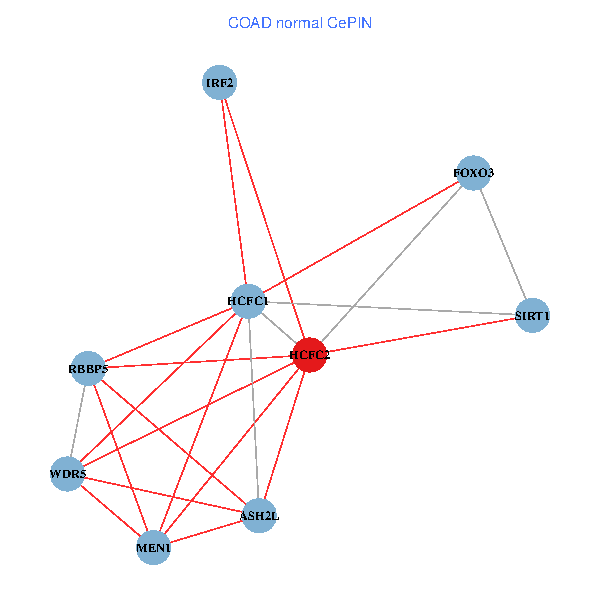
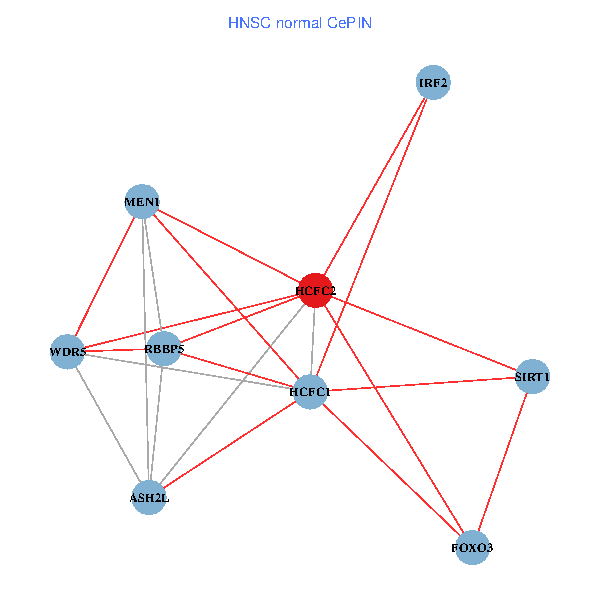
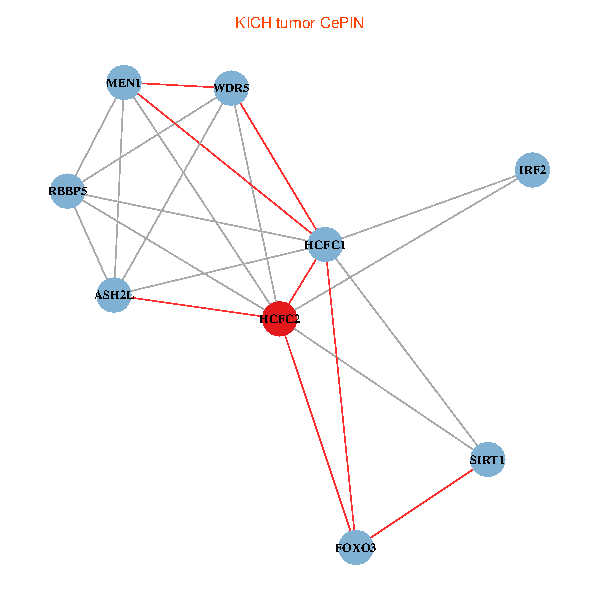
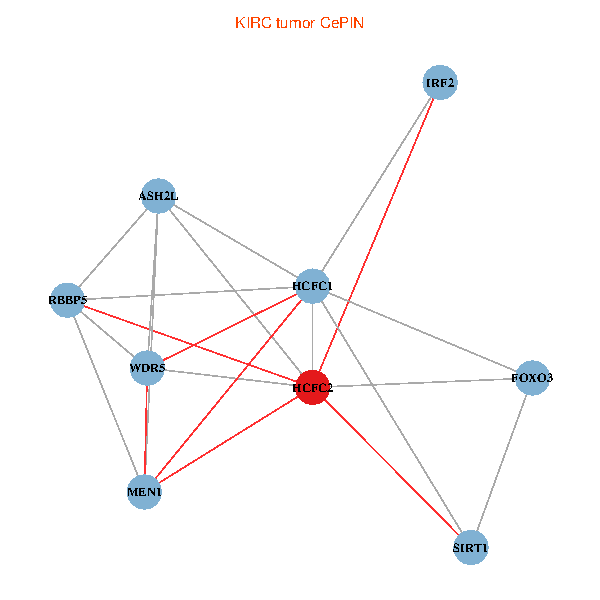
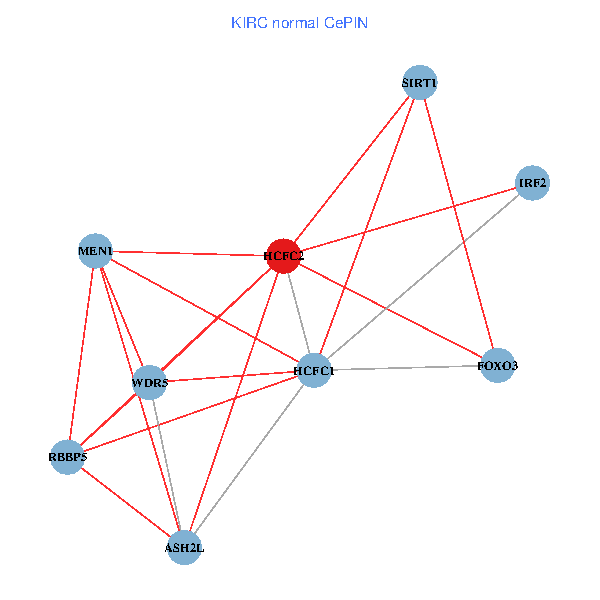
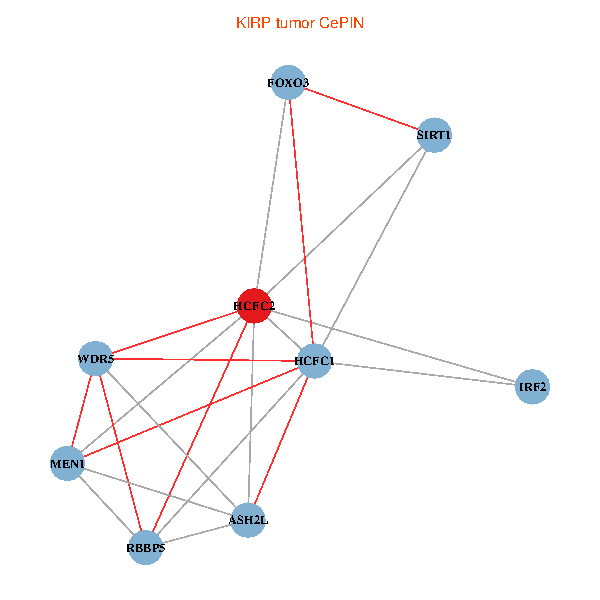
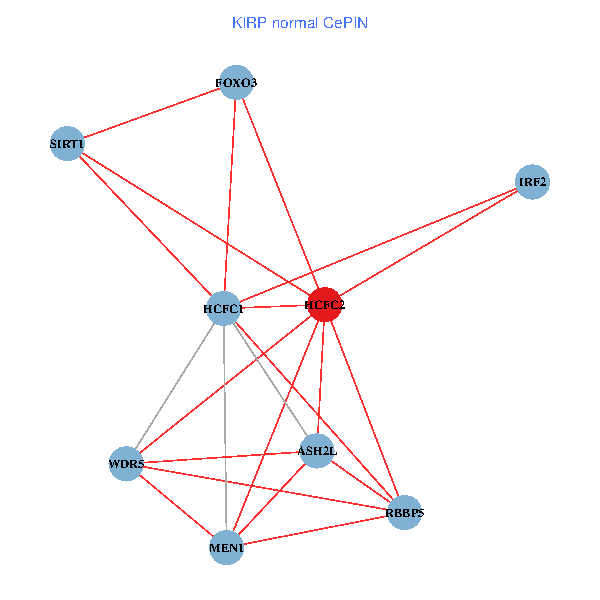
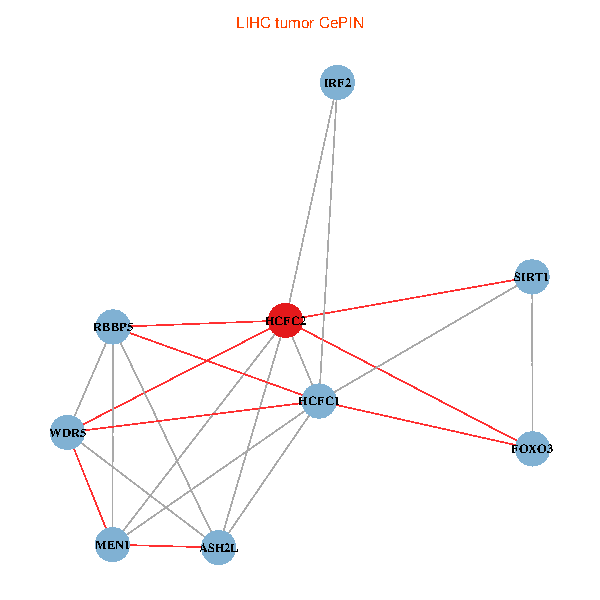
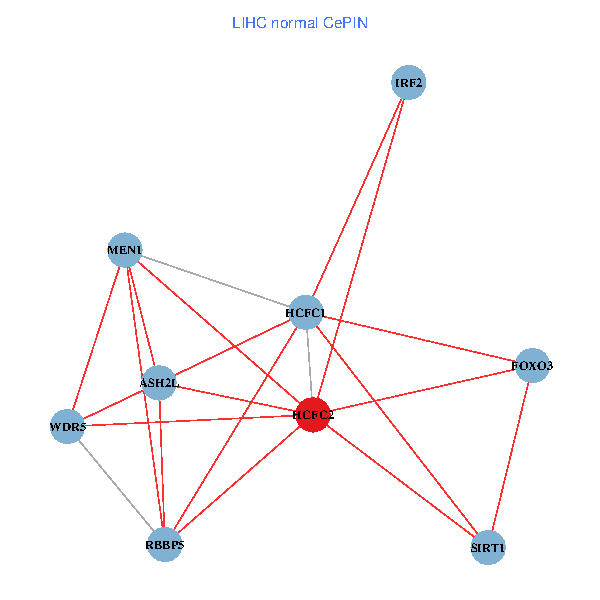
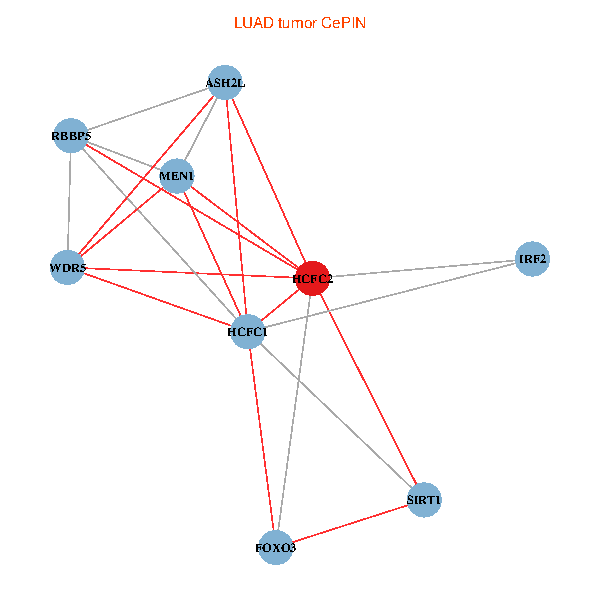
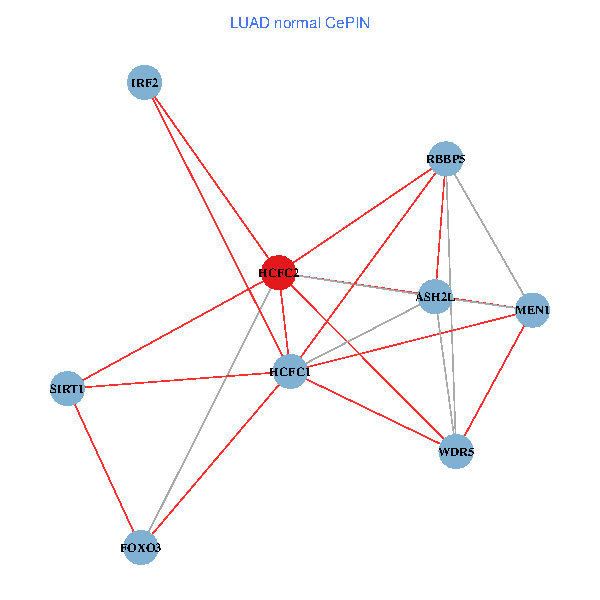
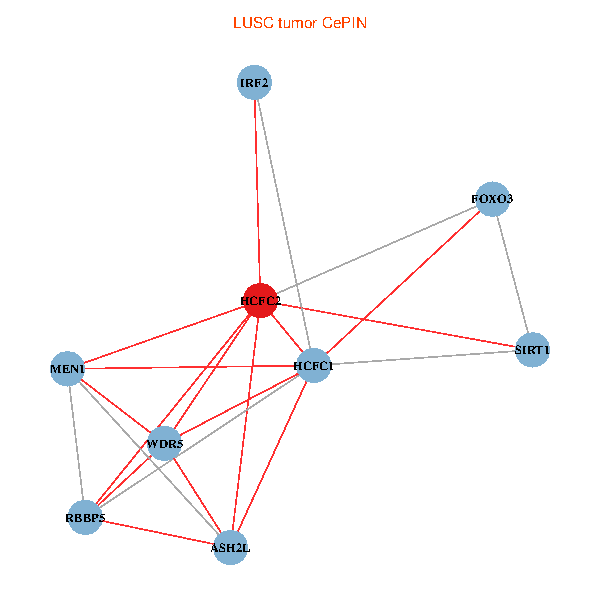
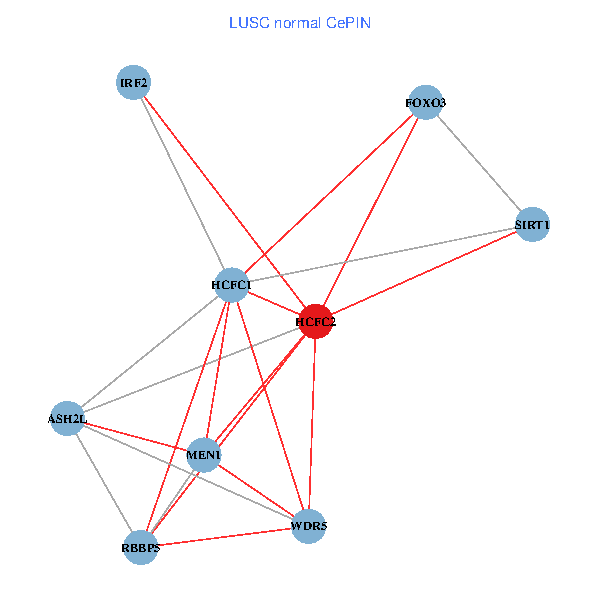
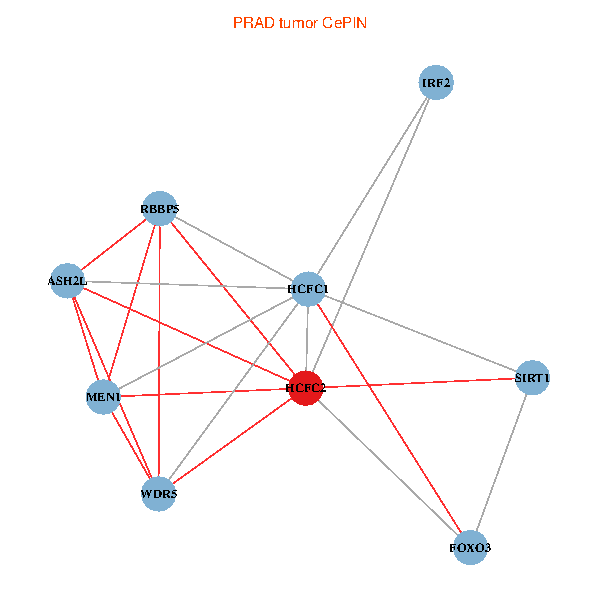
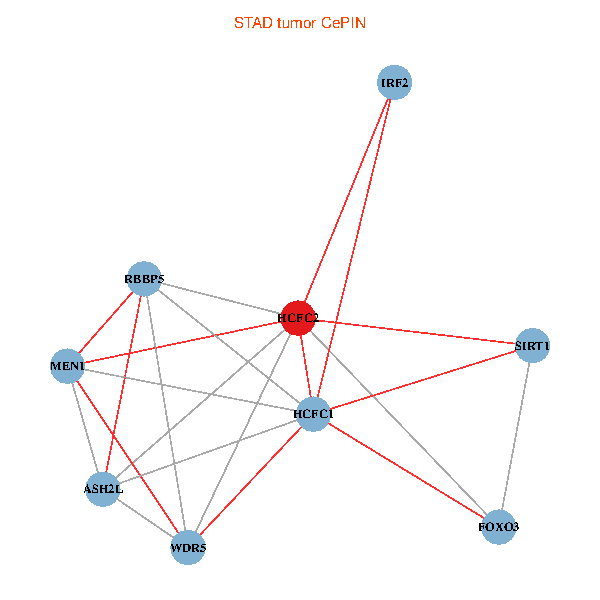
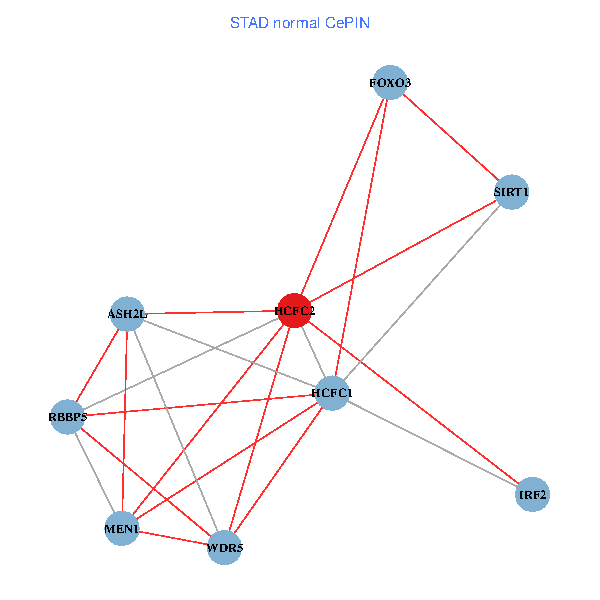
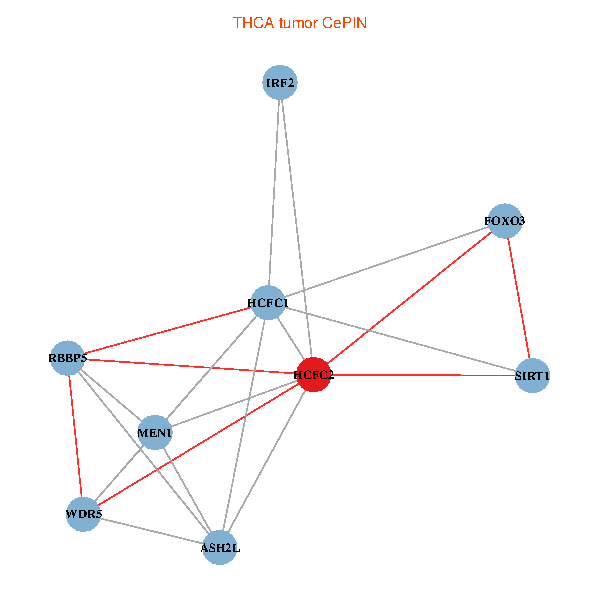
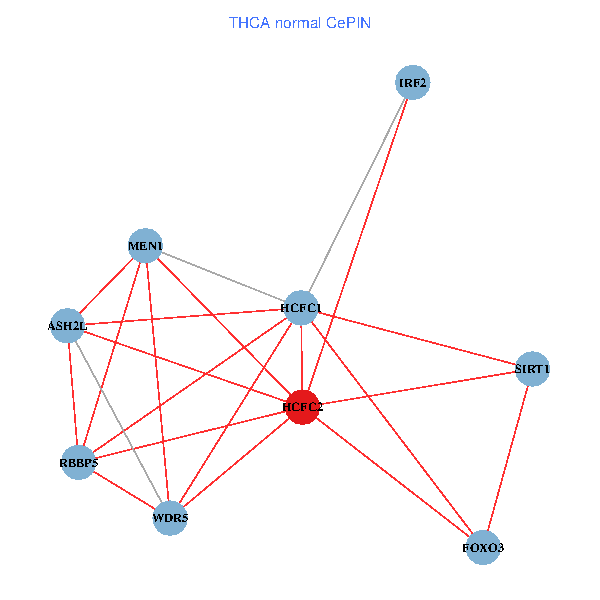
| Co-expressed gene networks based on protein-protein interaction data (CePIN) (TCGA IlluminaHiSeq_RNASeqV2, pan-cancer normalized log2(norm_counts+1) data, version 2016-08-16) (PINA2 ppi data) |
| BRCA (tumor) | BRCA (normal) |
| HCFC2, RBBP5, MEN1, ASH2L, HCFC1, IRF2, SIRT1, WDR5, FOXO3 (tumor) | HCFC2, RBBP5, MEN1, ASH2L, HCFC1, IRF2, SIRT1, WDR5, FOXO3 (normal) |
 |  |
| COAD (tumor) | COAD (normal) |
| HCFC2, RBBP5, MEN1, ASH2L, HCFC1, IRF2, SIRT1, WDR5, FOXO3 (tumor) | HCFC2, RBBP5, MEN1, ASH2L, HCFC1, IRF2, SIRT1, WDR5, FOXO3 (normal) |
 |  |
| HNSC (tumor) | HNSC (normal) |
| HCFC2, RBBP5, MEN1, ASH2L, HCFC1, IRF2, SIRT1, WDR5, FOXO3 (tumor) | HCFC2, RBBP5, MEN1, ASH2L, HCFC1, IRF2, SIRT1, WDR5, FOXO3 (normal) |
 |  |
| KICH (tumor) | KICH (normal) |
| HCFC2, RBBP5, MEN1, ASH2L, HCFC1, IRF2, SIRT1, WDR5, FOXO3 (tumor) | HCFC2, RBBP5, MEN1, ASH2L, HCFC1, IRF2, SIRT1, WDR5, FOXO3 (normal) |
 |  |
| KIRC (tumor) | KIRC (normal) |
| HCFC2, RBBP5, MEN1, ASH2L, HCFC1, IRF2, SIRT1, WDR5, FOXO3 (tumor) | HCFC2, RBBP5, MEN1, ASH2L, HCFC1, IRF2, SIRT1, WDR5, FOXO3 (normal) |
 |  |
| KIRP (tumor) | KIRP (normal) |
| HCFC2, RBBP5, MEN1, ASH2L, HCFC1, IRF2, SIRT1, WDR5, FOXO3 (tumor) | HCFC2, RBBP5, MEN1, ASH2L, HCFC1, IRF2, SIRT1, WDR5, FOXO3 (normal) |
 |  |
| LIHC (tumor) | LIHC (normal) |
| HCFC2, RBBP5, MEN1, ASH2L, HCFC1, IRF2, SIRT1, WDR5, FOXO3 (tumor) | HCFC2, RBBP5, MEN1, ASH2L, HCFC1, IRF2, SIRT1, WDR5, FOXO3 (normal) |
 |  |
| LUAD (tumor) | LUAD (normal) |
| HCFC2, RBBP5, MEN1, ASH2L, HCFC1, IRF2, SIRT1, WDR5, FOXO3 (tumor) | HCFC2, RBBP5, MEN1, ASH2L, HCFC1, IRF2, SIRT1, WDR5, FOXO3 (normal) |
 |  |
| LUSC (tumor) | LUSC (normal) |
| HCFC2, RBBP5, MEN1, ASH2L, HCFC1, IRF2, SIRT1, WDR5, FOXO3 (tumor) | HCFC2, RBBP5, MEN1, ASH2L, HCFC1, IRF2, SIRT1, WDR5, FOXO3 (normal) |
 |  |
| PRAD (tumor) | PRAD (normal) |
| HCFC2, RBBP5, MEN1, ASH2L, HCFC1, IRF2, SIRT1, WDR5, FOXO3 (tumor) | HCFC2, RBBP5, MEN1, ASH2L, HCFC1, IRF2, SIRT1, WDR5, FOXO3 (normal) |
 |  |
| STAD (tumor) | STAD (normal) |
| HCFC2, RBBP5, MEN1, ASH2L, HCFC1, IRF2, SIRT1, WDR5, FOXO3 (tumor) | HCFC2, RBBP5, MEN1, ASH2L, HCFC1, IRF2, SIRT1, WDR5, FOXO3 (normal) |
 |  |
| THCA (tumor) | THCA (normal) |
| HCFC2, RBBP5, MEN1, ASH2L, HCFC1, IRF2, SIRT1, WDR5, FOXO3 (tumor) | HCFC2, RBBP5, MEN1, ASH2L, HCFC1, IRF2, SIRT1, WDR5, FOXO3 (normal) |
 |  |
| Top |
| TissGeneProg for HCFC2 |
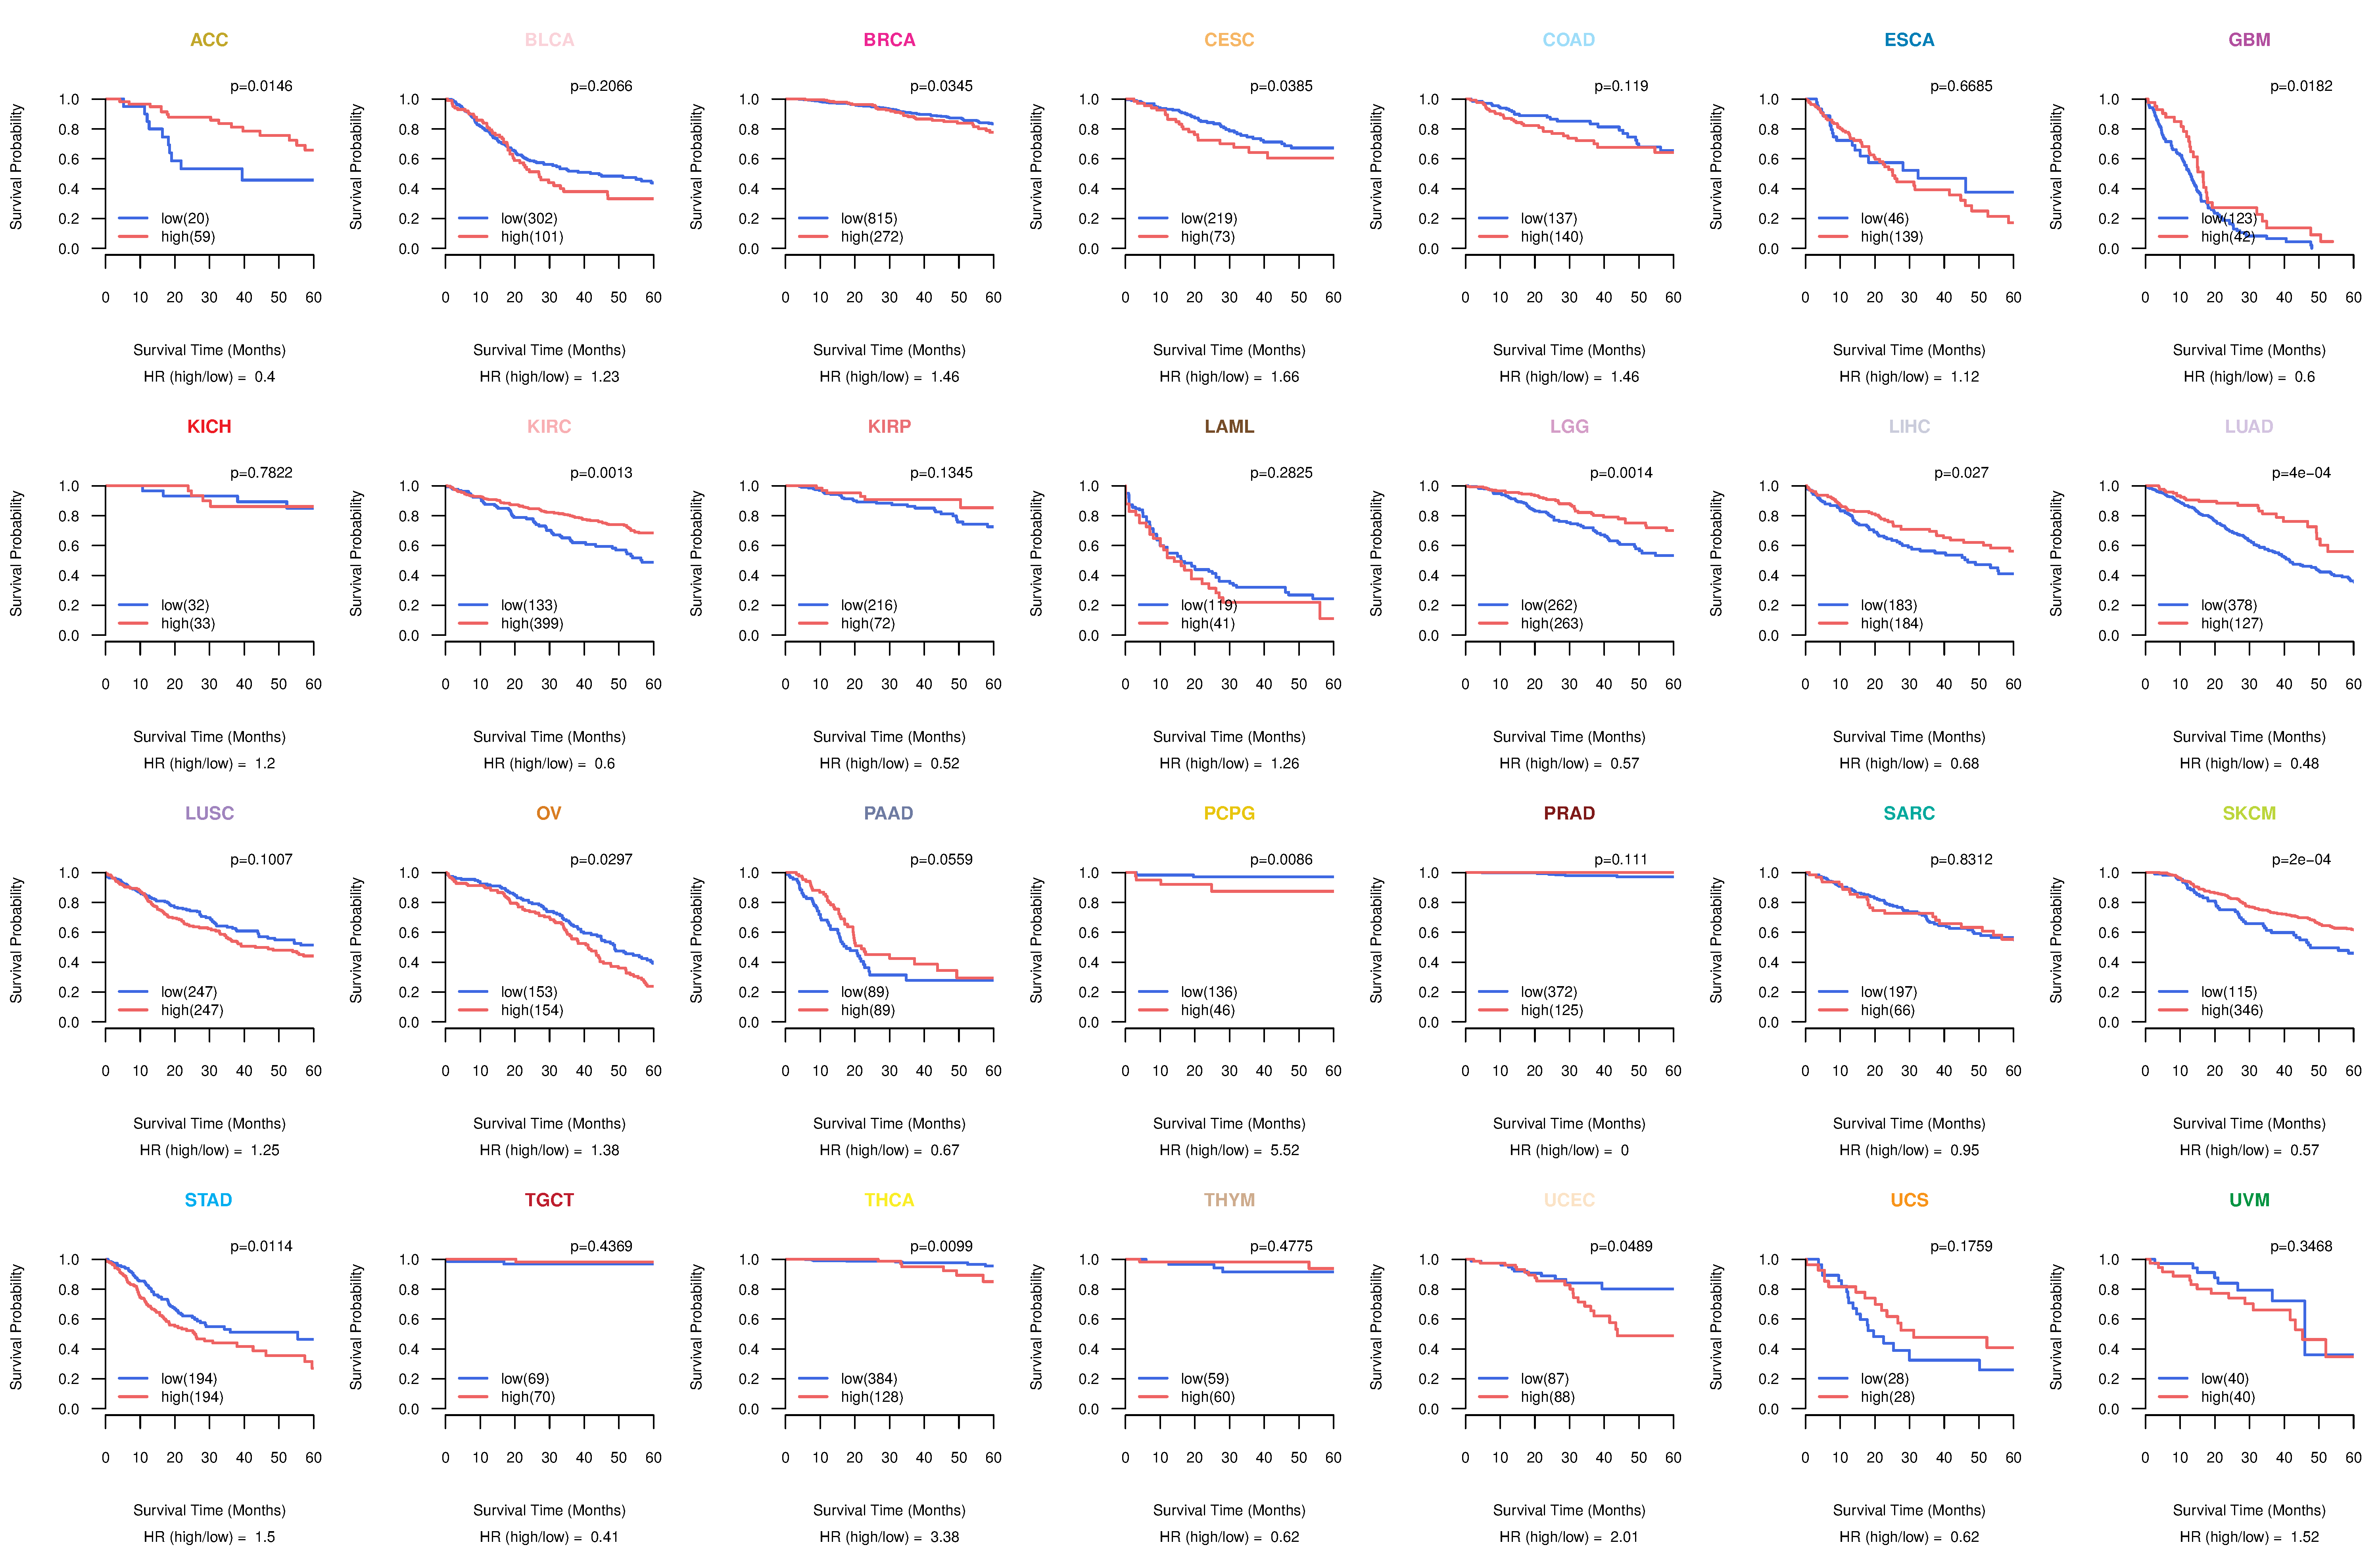
| Kaplan-Meier plots with logrank tests of overall survival (OS) using 28 cancer types (TCGA IlluminaHiSeq_RNASeqV2, pan-cancer normalized log2(norm_counts+1) data, version 2016-08-16) (TCGA clinicalMatrix, phenotype data, version 2016-04-27) * Click on the image to enlarge it in a new window. |
 |
| Kaplan-Meier plots with logrank test of relapse free survival (RFS) using 28 cancer types (TCGA IlluminaHiSeq_RNASeqV2, pan-cancer normalized log2(norm_counts+1) data, version 2016-08-16) (TCGA clinicalMatrix, phenotype data, version 2016-04-27) * Click on the image enlarge it in a new window. |
 |
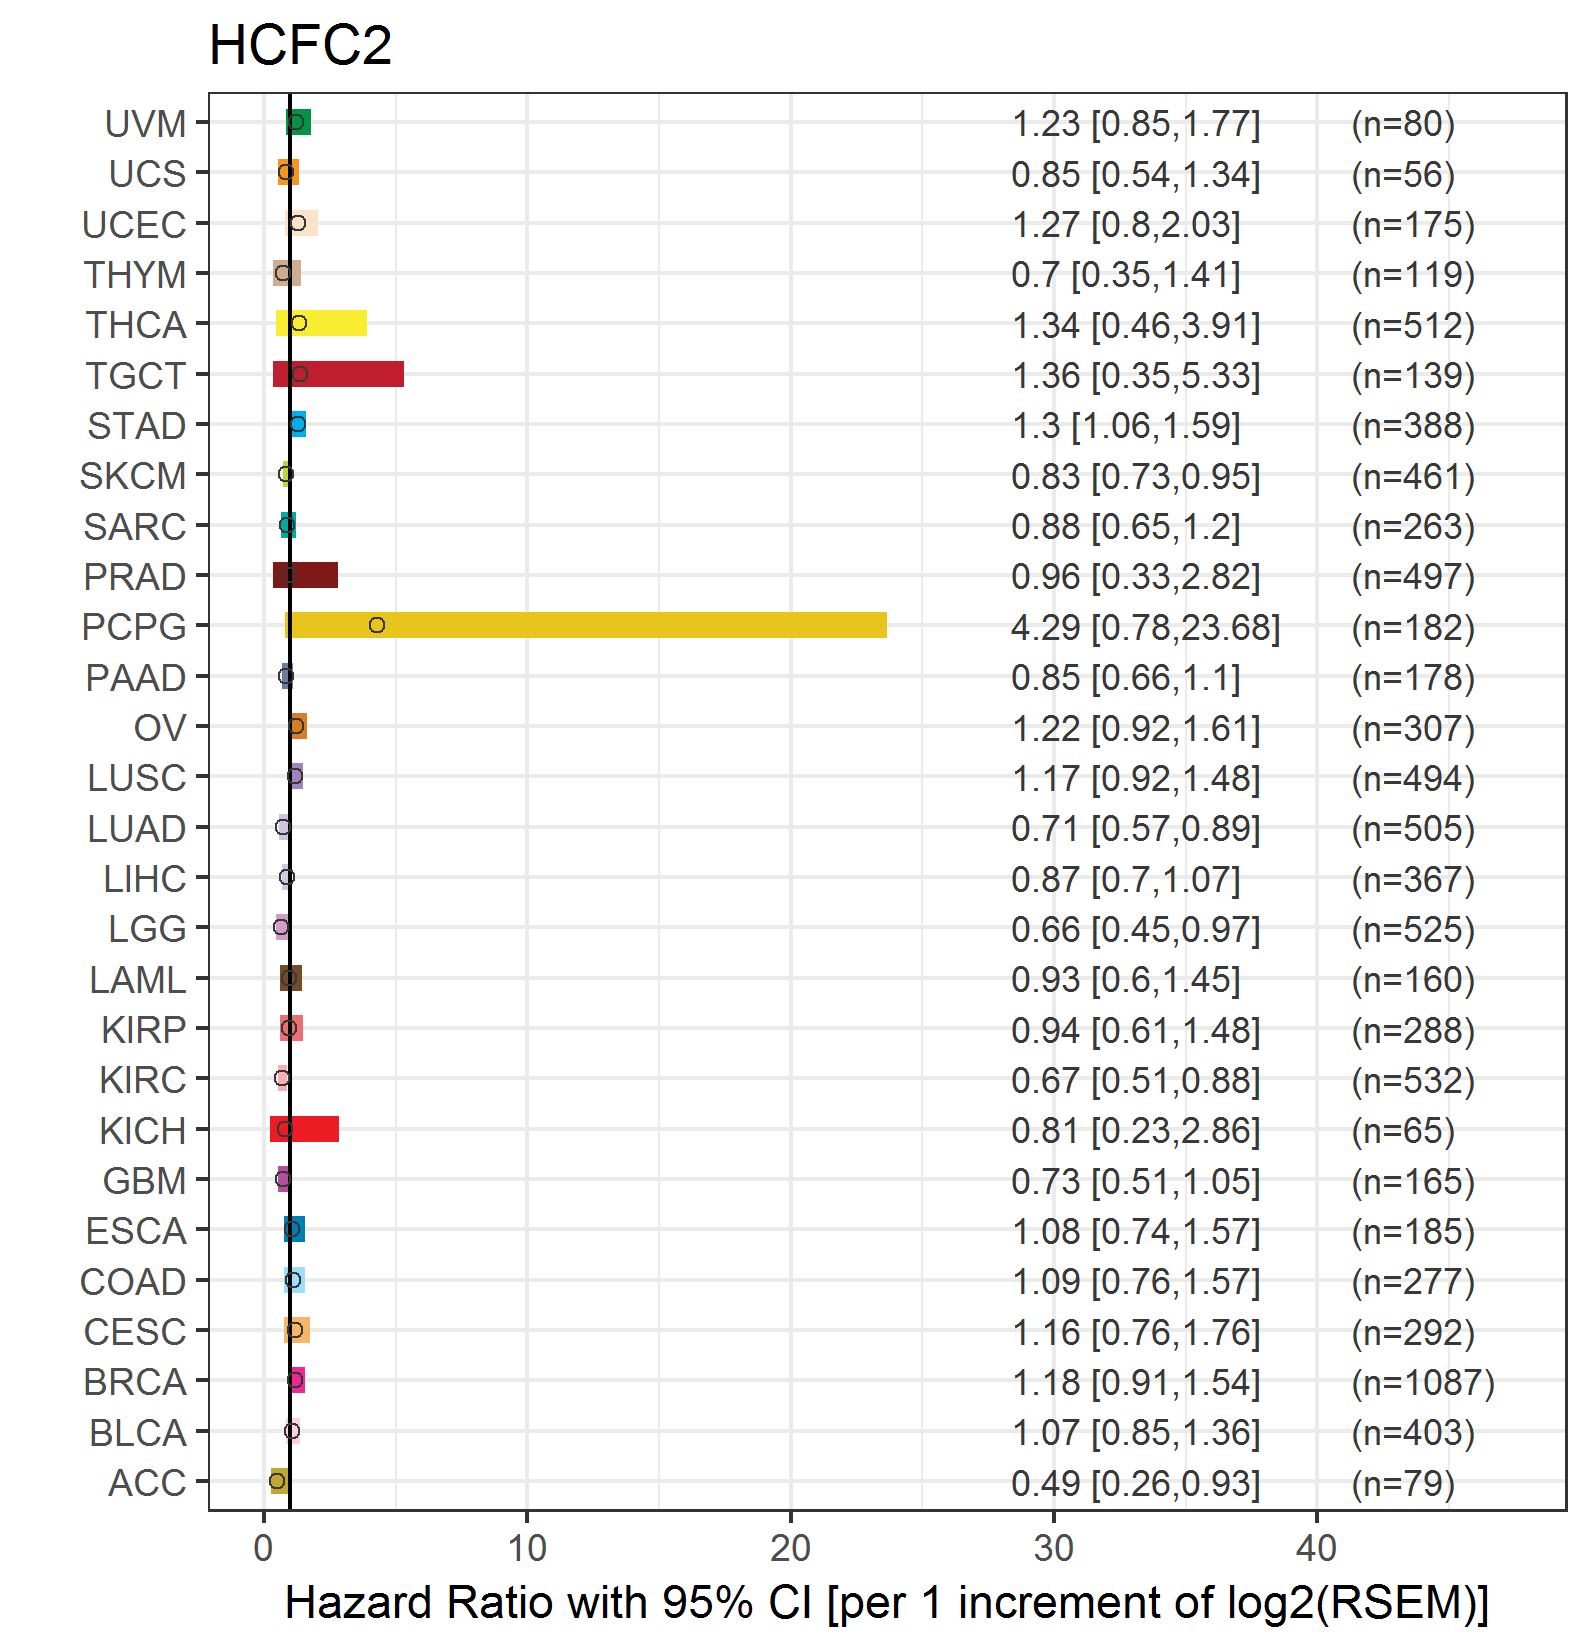
| Forest plot of Cox proportional hazard ratio (HR) and 95% CI of overall survival (OS) using 28 cancer types (TCGA IlluminaHiSeq_RNASeqV2, pan-cancer normalized log2(norm_counts+1) data, version 2016-08-16) (TCGA clinicalMatrix, phenotype data, version 2016-04-27) * Click on the image enlarge it in a new window. |
 |
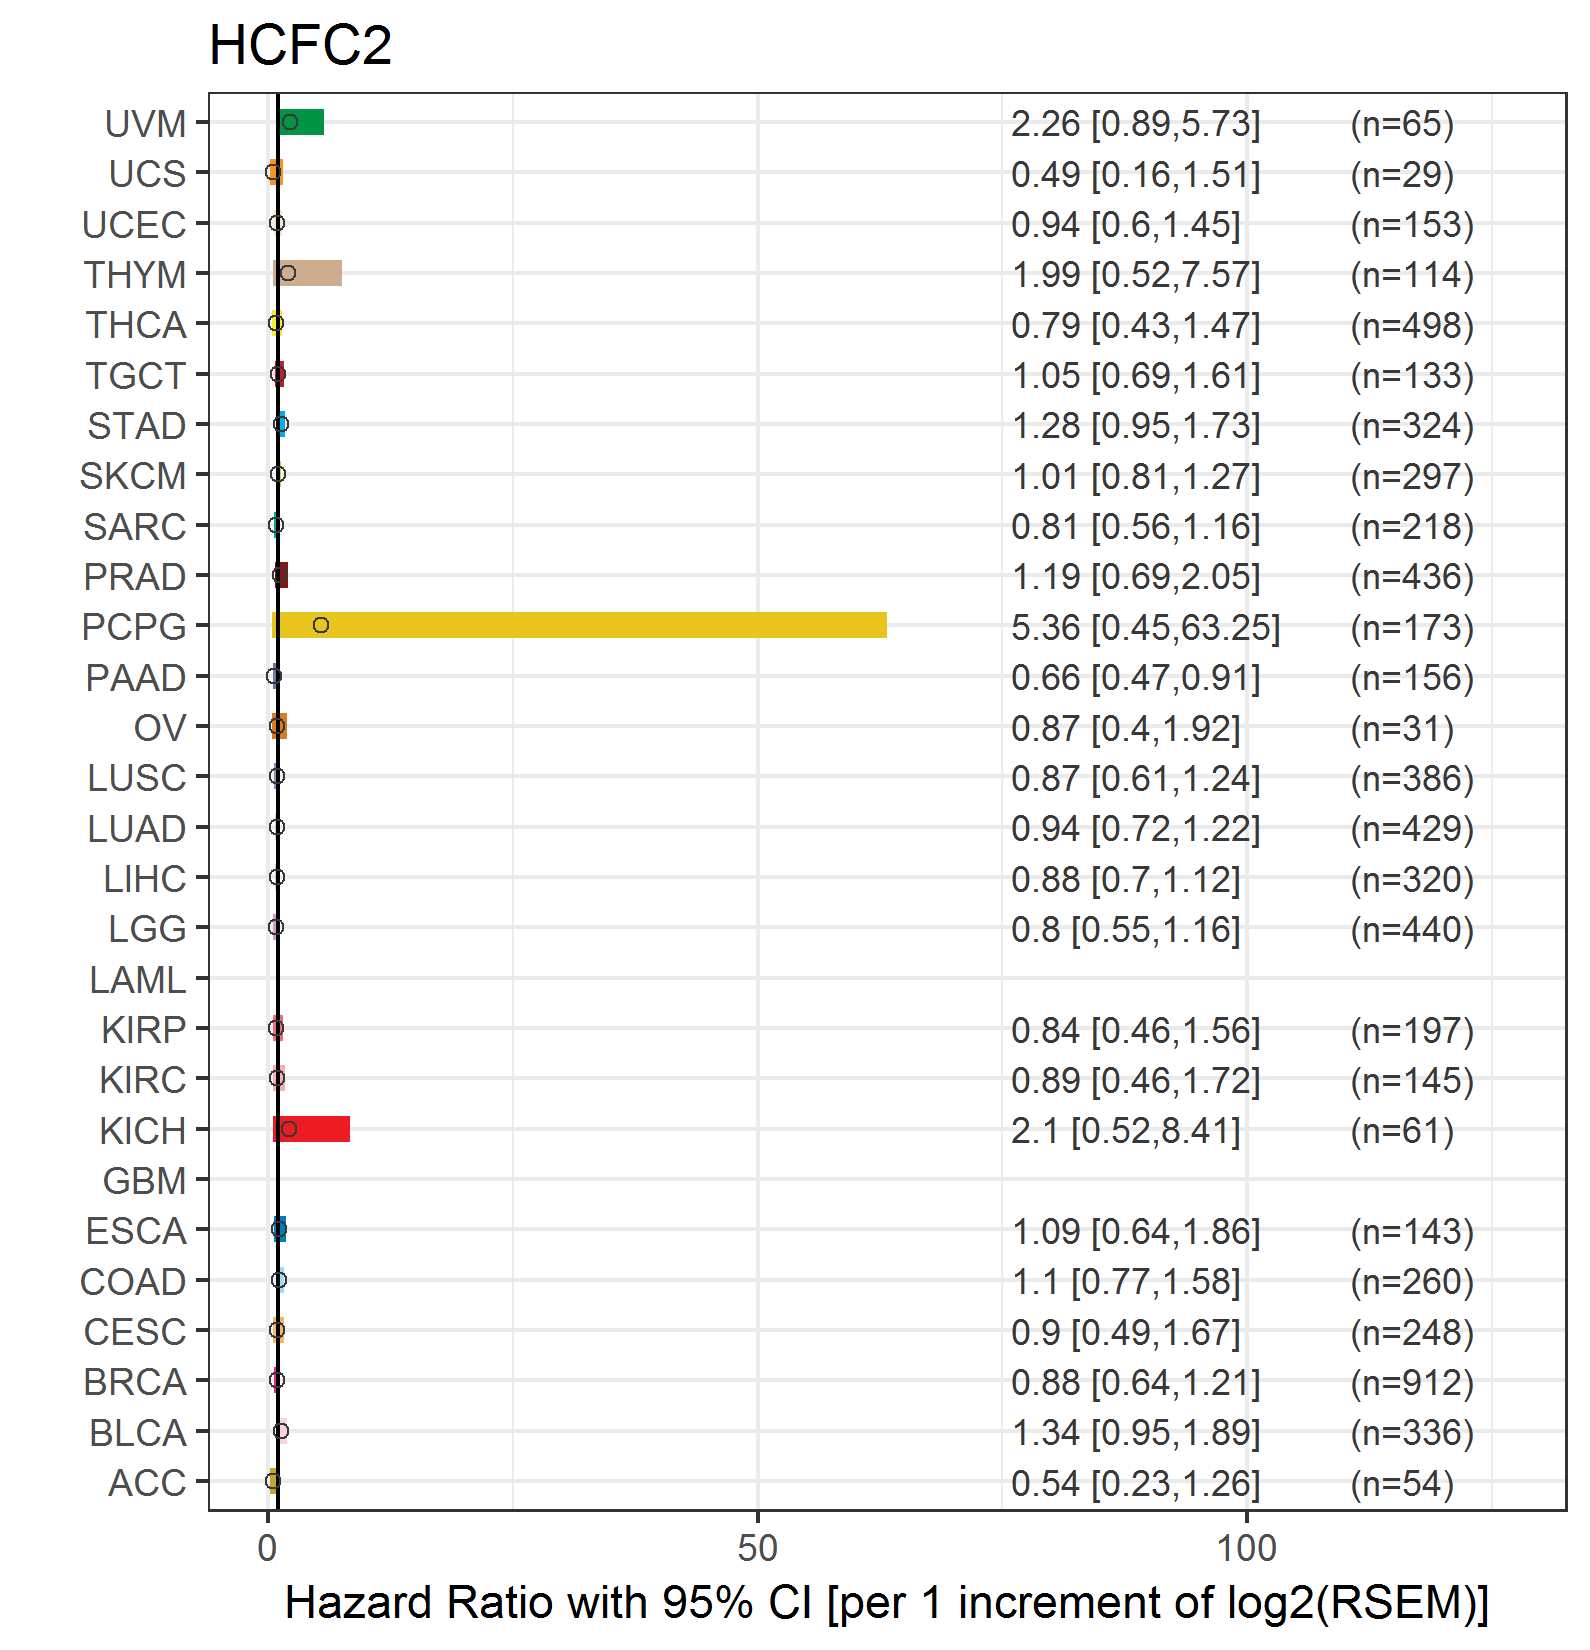
| Forest plot of Cox proportional hazard ratio (HR) and 95% CI of relapse free survival (RFS) using 28 cancer types (TCGA IlluminaHiSeq_RNASeqV2, pan-cancer normalized log2(norm_counts+1) data, version 2016-08-16) (TCGA clinicalMatrix, phenotype data, version 2016-04-27) * Click on the image enlarge it in a new window. |
 |
| Top |
| TissGeneClin for HCFC2 |
| TissGeneDrug for HCFC2 |
| Drug information targeting TissGene (DrugBank Version 5.0.6, 2017-04-01) |
| DrugBank ID | Drug name | Drug activity | Drug type | Drug status |
| Top |
| TissGeneDisease for HCFC2 |
| Disease information associated with TissGene (DisGeNet, 2016-06-01) |
| Disease ID | Disease name | # pubmeds | Source |
| umls:C0023903 | Liver neoplasms | 1 | BeFree |
| umls:C1512409 | Hepatocarcinogenesis | 1 | BeFree |
|
Copyright 2016-Present - The University of Texas Health Science Center at Houston (UTHealth) Web File Viewing | How to Report, Fraud, Waste and Abuse | State of Texas | Statewide Search | Texas Homeland Security | Site Policies |