 |
| |
| |
| |
| |
| |
| |
|

| TissGeneSummary for PADI1 |
 Gene summary Gene summary |
| Basic gene information | Gene symbol | PADI1 |
| Gene name | peptidyl arginine deiminase, type I | |
| Synonyms | HPAD10|PAD1|PDI|PDI1 | |
| Cytomap | UCSC genome browser: 1p36.13 | |
| Type of gene | protein-coding | |
| RefGenes | NM_013358.2, | |
| Description | hPAD-colony 10peptidylarginine deiminase Iprotein-arginine deiminase type Iprotein-arginine deiminase type-1 | |
| Modification date | 20141207 | |
| dbXrefs | MIM : 607934 | |
| HGNC : HGNC | ||
| Ensembl : ENSG00000142623 | ||
| HPRD : 06395 | ||
| Vega : OTTHUMG00000002294 | ||
| Protein | UniProt: go to UniProt's Cross Reference DB Table | |
| Expression | CleanEX: HS_PADI1 | |
| BioGPS: 29943 | ||
| Pathway | NCI Pathway Interaction Database: PADI1 | |
| KEGG: PADI1 | ||
| REACTOME: PADI1 | ||
| Pathway Commons: PADI1 | ||
| Context | iHOP: PADI1 | |
| ligand binding site mutation search in PubMed: PADI1 | ||
| UCL Cancer Institute: PADI1 | ||
| Assigned class in TissGDB* | C | |
| Included tissue-specific gene expression resources | HPA,GTEx | |
| Specific-tissues in normal samples (assigned by TissGDB using HPA, TiGER, and GTEx) | Esophagus | |
| Cancer types related to the specific-tissues in cancer samples (assigned by TissGDB using TCGA) | ESCA | |
| Reference showing the relevant tissue of PADI1 | ||
| Description by TissGene annotations | ||
| * Class A consists of genes with literature evidence and is part of the cTissGenes. Class B consists of only cTissGenes without additional evidence. The remaining genes belong to Class C. |
| Gene ontology having evidence of Inferred from Direct Assay (IDA) from Entrez |
| GO ID | GO term | PubMed ID |
| Top |
| TissGeneExp for PADI1 |
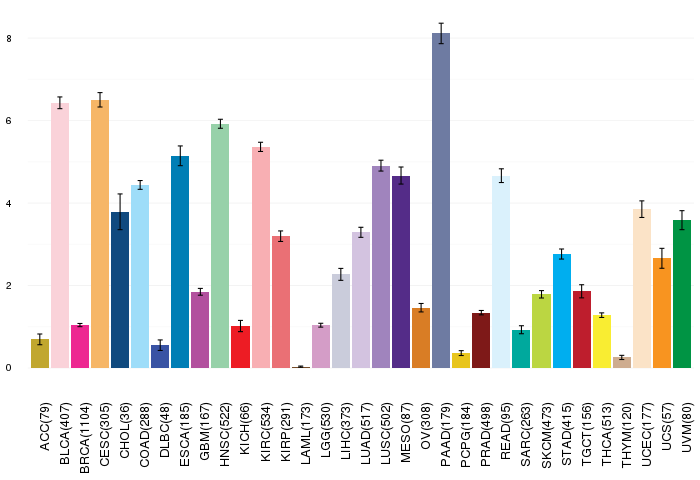
| Gene expressions across 28 cancer types (X-axis: cancer type and Y-axis: log2(norm_counts+1)) (TCGA IlluminaHiSeq_RNASeqV2, pan-cancer normalized log2(norm_counts+1) data, version 2016-08-16) |
 |
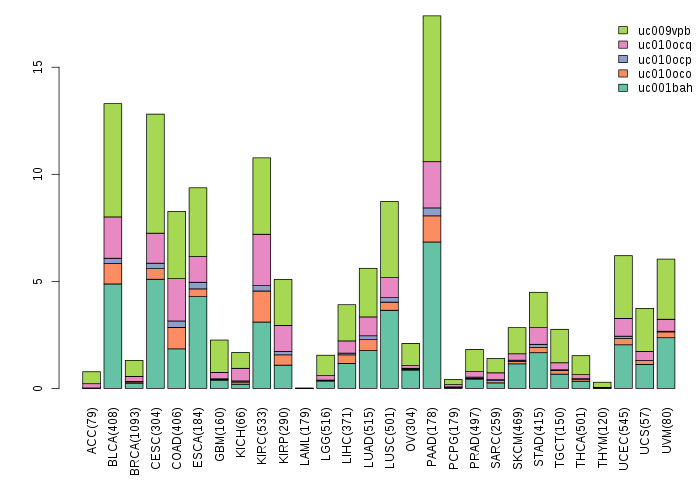
| Gene isoform expressions across 28 cancer types (X-axis: cancer type and Y-axis: log2(norm_counts+1)) (TCGA pan-cancer tcga_rsem_isoform_tpm, version 2016-09-01) |
 |
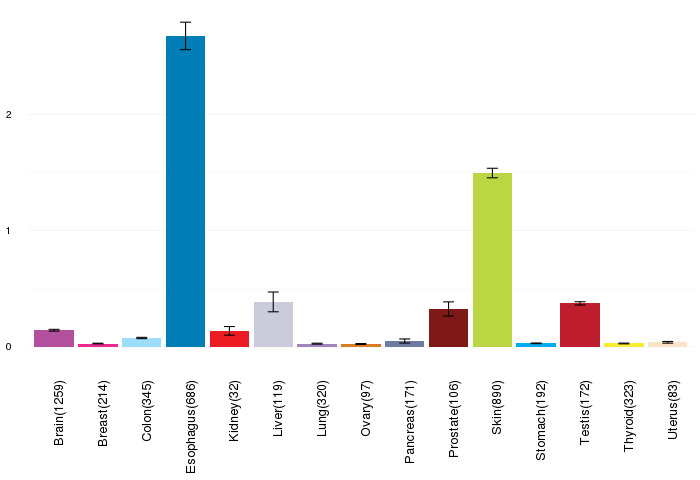
| Gene expressions across normal tissues of GTEx data (GTEx GTEx_Analysis_v6_RNA-seq_RNA-SeQCv1.1.8_gene_rpkm.gct) - Here, we shows the matched tissue types only among our 28 cancer types. |
 |
| Different expressions across 14 cancer types with more than 10 samples between matched tumors and normals (X-axis: cancer type and Y-axis: log2(norm_counts+1)) (TCGA IlluminaHiSeq_RNASeqV2, pan-cancer normalized log2(norm_counts+1) data, version 2016-08-16) |
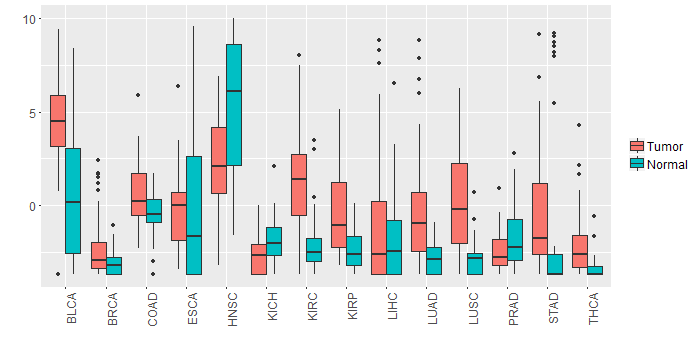 |
| - Significantly differentially expressed cancer types and information. (|Fold change|>1 and FDR<0.05) |
| Cancer type | Mean(exp) in tumor | Mean(exp) in matched normal | Log2FC | P-val. | FDR |
| HNSC | 2.275472833 | 5.383826321 | -3.108353488 | 1.22E-05 | 6.79E-05 |
| LUSC | 0.165836992 | -2.823935557 | 2.989772549 | 1.12E-10 | 4.20E-10 |
| THCA | -2.201502689 | -3.400863706 | 1.199361017 | 8.99E-07 | 3.42E-06 |
| KIRC | 1.195822122 | -2.224363989 | 3.420186111 | 2.19E-17 | 1.35E-16 |
| LUAD | -0.384687552 | -2.907801345 | 2.523113793 | 2.75E-08 | 1.17E-07 |
| BLCA | 4.208666713 | 0.888129871 | 3.320536842 | 0.00418 | 0.023299048 |
| COAD | 0.696573191 | -0.534380655 | 1.230953846 | 0.00912 | 0.020389714 |
| KIRP | -0.318424405 | -2.412243155 | 2.09381875 | 4.90E-05 | 0.000179507 |
| Top |
| TissGene-miRNA for PADI1 |
| Significantly anti-correlated miRNAs of TissGene across 28 cancer types (Gene-miRNA relations from TargetScanHuman Relsease 7.1, Conserved_Site_Context_Scores.txt.zip, 06.01.2016) (TCGA IlluminaHiSeq_miRNASeq, log2(RPM+1) data, version 2016-11-21) (TCGA IlluminaHiSeq_RNASeqV2, log2(normalized_count+1) data, version 2016-08-16) (Spearman’s Rank Correlation (p-value<0.05 and coefficient<-0.25)) |
| Cancer type | miRNA id | miRNA accession | P-val. | Coeff. | # samples |
| Top |
| TissGeneMut for PADI1 |
| TissGeneSNV for PADI1 |
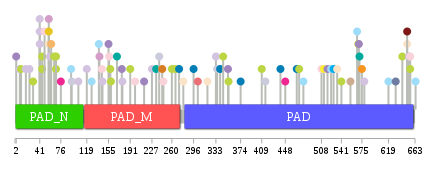
| nsSNV counts per each loci. Different colors of circles represent different cancer types. Circle size denotes number of samples. (TCGA somatic mutation (SNPs and small INDELs) data, version 2016-04-25) * Click on the image to enlarge it in a new window. |
 |
 |
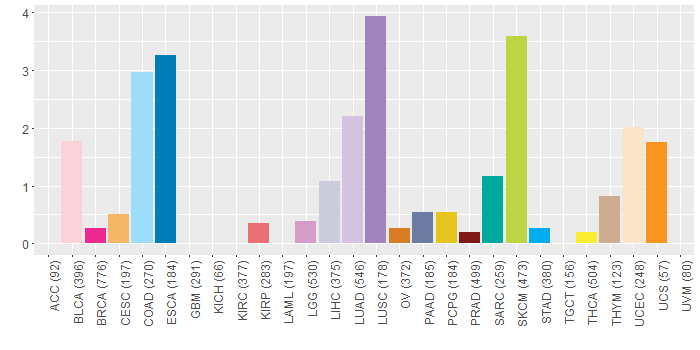
| Somatic nucleotide variants of TissGene across 28 cancer types (X-axis: cancer type and Y-axis: % of mutated samples) The numbers in parentheses are numbers of samples with mutation (nsSNVs). (TCGA somatic mutation (SNPs and small INDELs) data, version 2016-04-25) |
 |
| - nsSNVs sorted by frequency. |
| AAchange | Cancer type | # samples |
| p.R551H | READ | 1 |
| p.W467X | ESCA | 1 |
| p.P340A | ESCA | 1 |
| p.V448A | BRCA | 1 |
| p.K65M | SKCM | 1 |
| p.S10F | SKCM | 1 |
| p.E246K | BLCA | 1 |
| p.R345* | SKCM | 1 |
| p.E49K | BLCA | 1 |
| p.R140H | LGG | 1 |
| p.S169I | SARC | 1 |
| p.R56C | LGG | 1 |
| p.P655S | BLCA | 1 |
| p.T478I | COAD | 1 |
| p.A2S | LUSC | 1 |
| p.R534K | UCEC | 1 |
| p.V272L | ESCA | 1 |
| p.R650H | PRAD | 1 |
| p.H521Q | DLBC | 1 |
| p.P569A | SKCM | 1 |
| p.D191N | SKCM | 1 |
| p.L571H | SARC | 1 |
| p.G440A | ESCA | 1 |
| p.D155N | LUSC | 1 |
| p.H30Y | SKCM | 1 |
| p.W139C | COAD | 1 |
| p.Q570K | LUSC | 1 |
| p.F409I | SKCM | 1 |
| p.M354I | SKCM | 1 |
| p.L177M | LUSC | 1 |
| p.W68* | SKCM | 1 |
| p.D631V | PAAD | 1 |
| p.F214V | LUSC | 1 |
| p.A579V | LUAD | 1 |
| p.E512K | THCA | 1 |
| p.G145C | LUAD | 1 |
| p.G127C | COAD | 1 |
| p.N333D | LUAD | 1 |
| p.P653H | LUAD | 1 |
| p.G518_splice | LUSC | 1 |
| p.R58H | LUAD | 1 |
| p.E353K | LUSC | 1 |
| p.V18L | LUAD | 1 |
| p.S266F | SKCM | 1 |
| p.V94A | LIHC | 1 |
| p.L541F | SKCM | 1 |
| p.R41I | LUAD | 1 |
| p.K524Q | COAD | 1 |
| p.R41S | LUAD | 1 |
| p.K335M | LIHC | 1 |
| p.P303A | KIRP | 1 |
| p.L119I | LUAD | 1 |
| p.Q227H | LUAD | 1 |
| p.X664C | COAD | 1 |
| p.L105V | LUAD | 1 |
| p.R156W | BLCA | 1 |
| p.R56C | PCPG | 1 |
| p.W68X | SKCM | 1 |
| p.K575N | UCS | 1 |
| p.N528I | STAD | 1 |
| p.E508K | BLCA | 1 |
| p.R374S | ESCA | 1 |
| p.P655L | SKCM | 1 |
| p.D324G | READ | 1 |
| p.R56H | UCEC | 1 |
| p.R93K | COAD | 1 |
| p.R556W | THYM | 1 |
| p.L199F | BLCA | 1 |
| p.L619M | COAD | 1 |
| p.S45N | SKCM | 1 |
| p.Q178R | LUAD | 1 |
| p.M589T | HNSC | 1 |
| p.S415C | LIHC | 1 |
| p.E239X | LIHC | 1 |
| p.E24K | LUAD | 1 |
| p.R650H | UCEC | 1 |
| p.S45C | SKCM | 1 |
| p.D567N | COAD | 1 |
| p.G471S | SKCM | 1 |
| p.E279K | UCEC | 1 |
| p.E642K | SKCM | 1 |
| p.H159Y | SKCM | 1 |
| p.E144D | BLCA | 1 |
| p.K60E | CESC | 1 |
| p.R41M | LUAD | 1 |
| p.M76K | BRCA | 1 |
| p.Q8R | LUAD | 1 |
| p.E244* | OV | 1 |
| p.D260N | SKCM | 1 |
| p.E319D | UCEC | 1 |
| p.M296I | ESCA | 1 |
| p.L234M | SARC | 1 |
| p.N158S | SKCM | 1 |
| Top |
| TissGeneCNV for PADI1 |
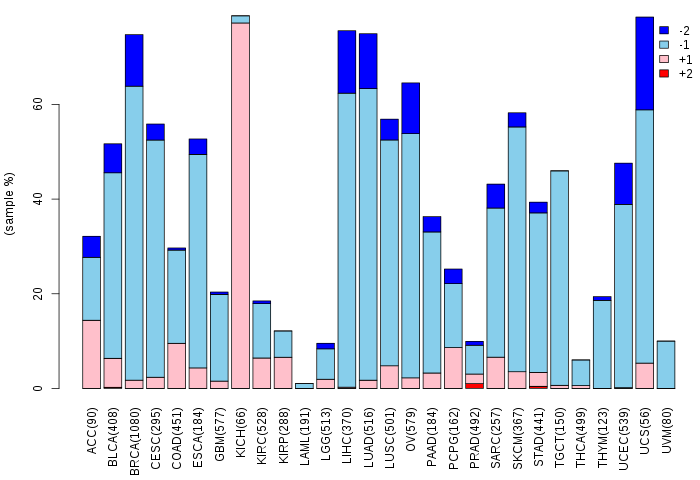
| Copy number variations of TissGene across 28 cancer types (X-axis: cancer type and Y-axis: % of CNV samples) (TCGA Gistic2_CopyNumber_Gistic2_all_data_by_genes, Gistic2 copy number data, version 2016-08-16) |
 |
| Top |
| TissGeneFusions for PADI1 |
| Fusion genes including TissGene (ChimerDB 3.0, 2016-12-01 and TCGA fusion Portal 2015-12-01) |
| Database | Src | Cancer type | Sample | Fusion gene | ORF | 5'-gene BP | 3'-gene BP |
| Chimerdb3.0 | FusionScan | ESCA | TCGA-L5-A4OS-01A | GRB2-PADI1 | In-Frame | chr17:73317739 | chr1:17570504 |
| TCGAfusionPortal | PRADA | BRCA | TCGA-A2-A25F-01A | C1orf135-PADI1 | Out-of-frame | Chr1:26185771 | Chr1:17548785 |
| Top |
| TissGeneNet for PADI1 |
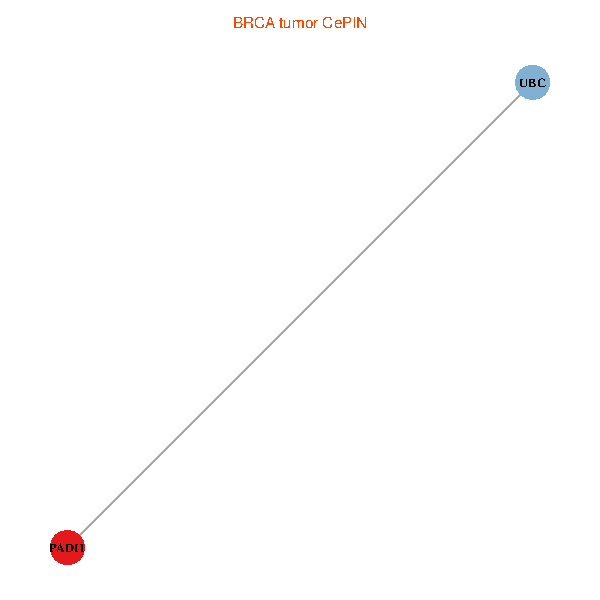
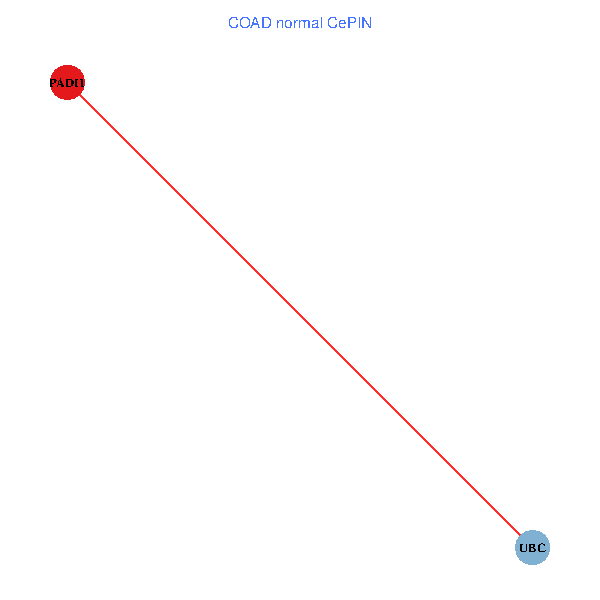
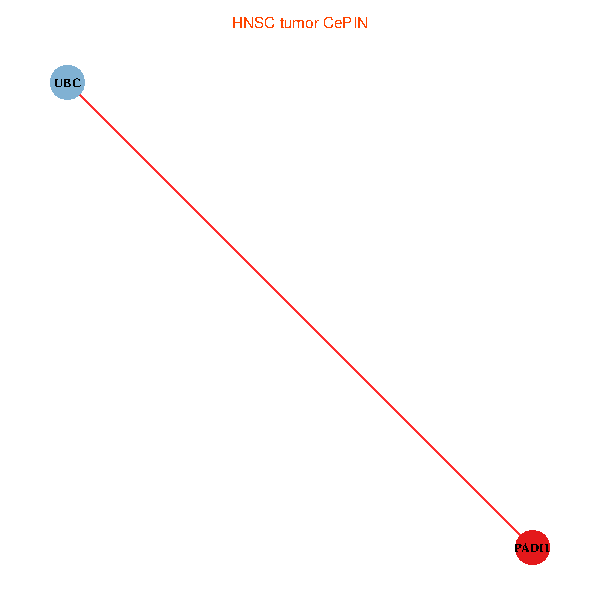
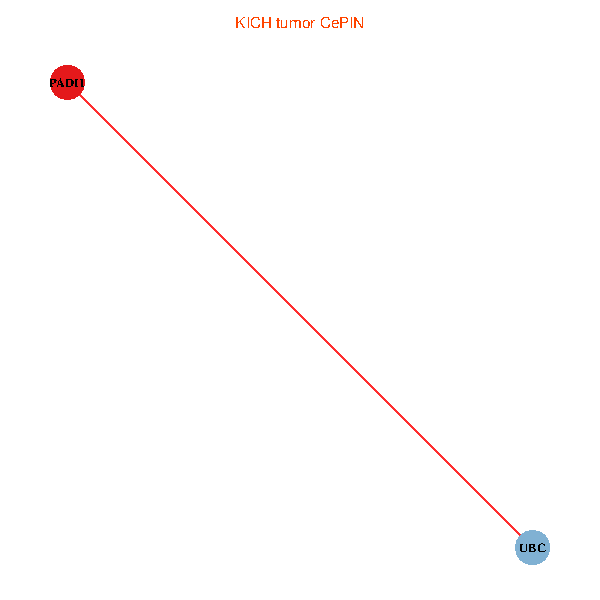
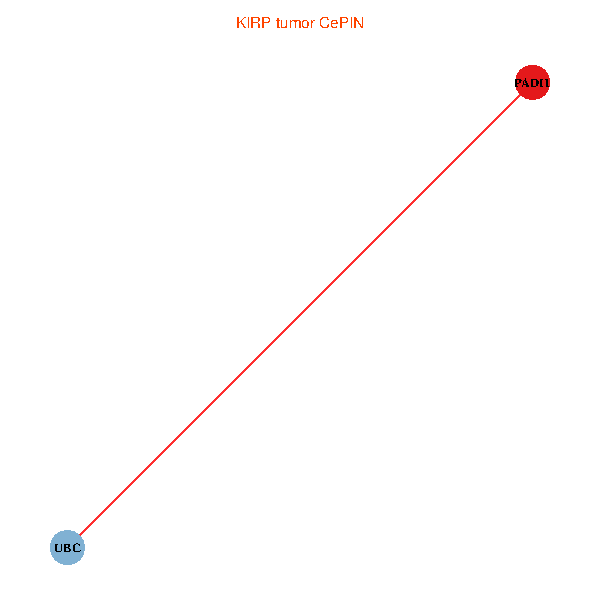
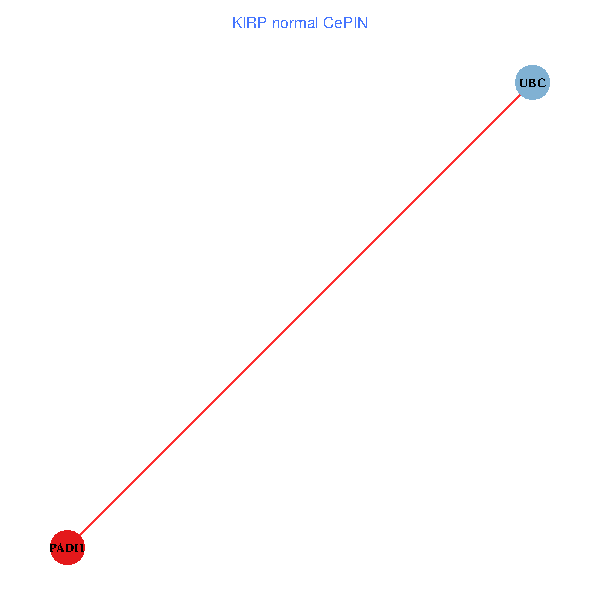
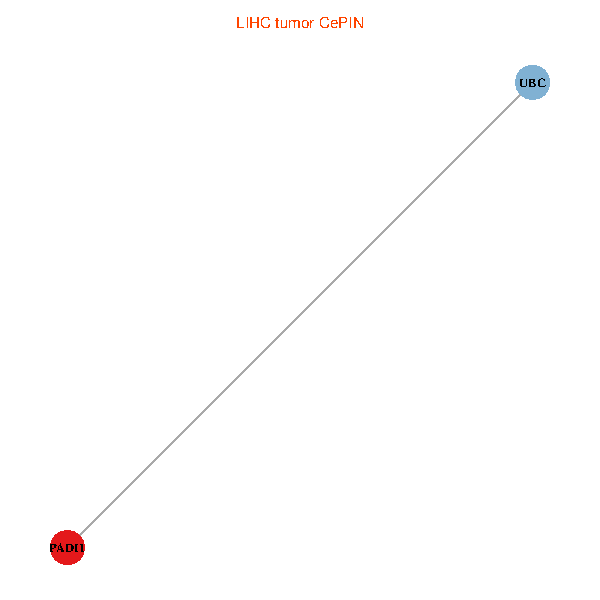
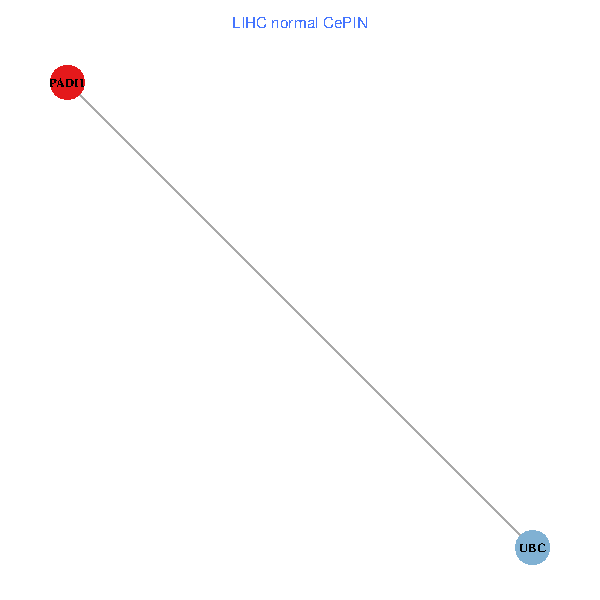
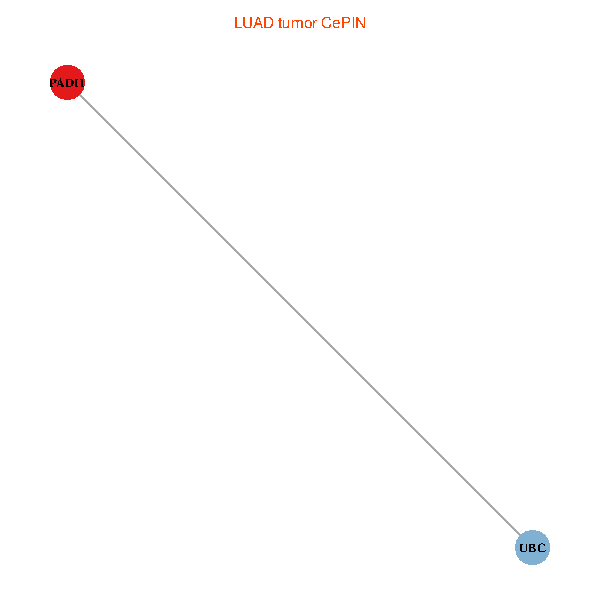
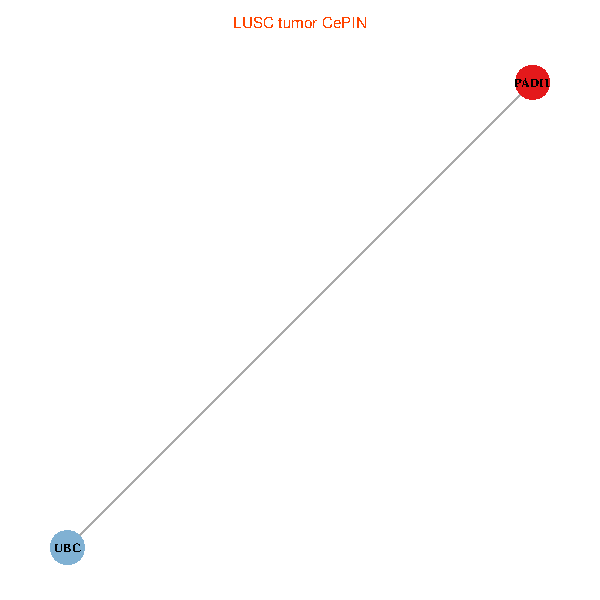
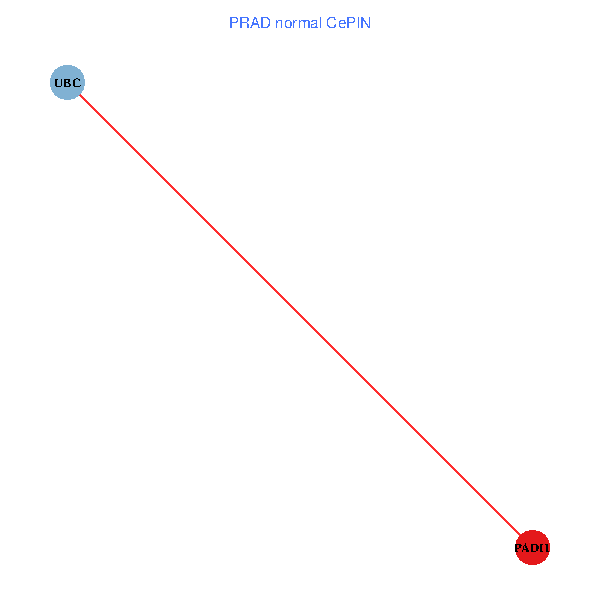
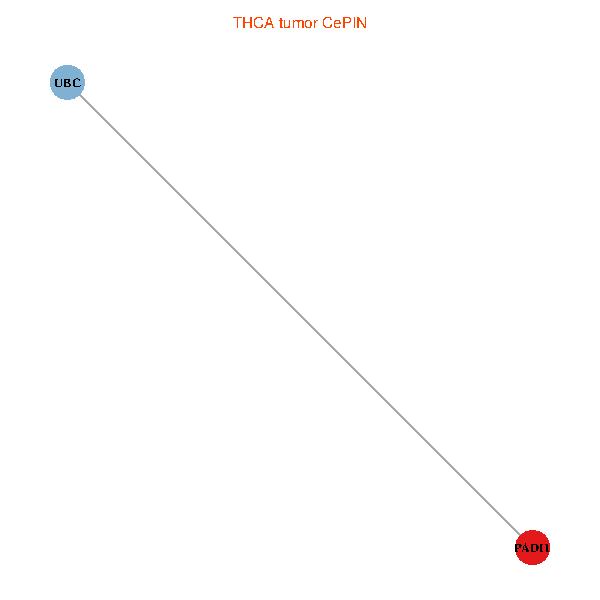
| Co-expressed gene networks based on protein-protein interaction data (CePIN) (TCGA IlluminaHiSeq_RNASeqV2, pan-cancer normalized log2(norm_counts+1) data, version 2016-08-16) (PINA2 ppi data) |
| BRCA (tumor) | BRCA (normal) |
| PADI1, UBC (tumor) | PADI1, UBC (normal) |
 |  |
| COAD (tumor) | COAD (normal) |
| PADI1, UBC (tumor) | PADI1, UBC (normal) |
 |  |
| HNSC (tumor) | HNSC (normal) |
| PADI1, UBC (tumor) | PADI1, UBC (normal) |
 |  |
| KICH (tumor) | KICH (normal) |
| PADI1, UBC (tumor) | PADI1, UBC (normal) |
 |  |
| KIRC (tumor) | KIRC (normal) |
| PADI1, UBC (tumor) | PADI1, UBC (normal) |
 |  |
| KIRP (tumor) | KIRP (normal) |
| PADI1, UBC (tumor) | PADI1, UBC (normal) |
 |  |
| LIHC (tumor) | LIHC (normal) |
| PADI1, UBC (tumor) | PADI1, UBC (normal) |
 |  |
| LUAD (tumor) | LUAD (normal) |
| PADI1, UBC (tumor) | PADI1, UBC (normal) |
 |  |
| LUSC (tumor) | LUSC (normal) |
| PADI1, UBC (tumor) | PADI1, UBC (normal) |
 |  |
| PRAD (tumor) | PRAD (normal) |
| PADI1, UBC (tumor) | PADI1, UBC (normal) |
 |  |
| STAD (tumor) | STAD (normal) |
| PADI1, UBC (tumor) | PADI1, UBC (normal) |
 |  |
| THCA (tumor) | THCA (normal) |
| PADI1, UBC (tumor) | PADI1, UBC (normal) |
 |  |
| Top |
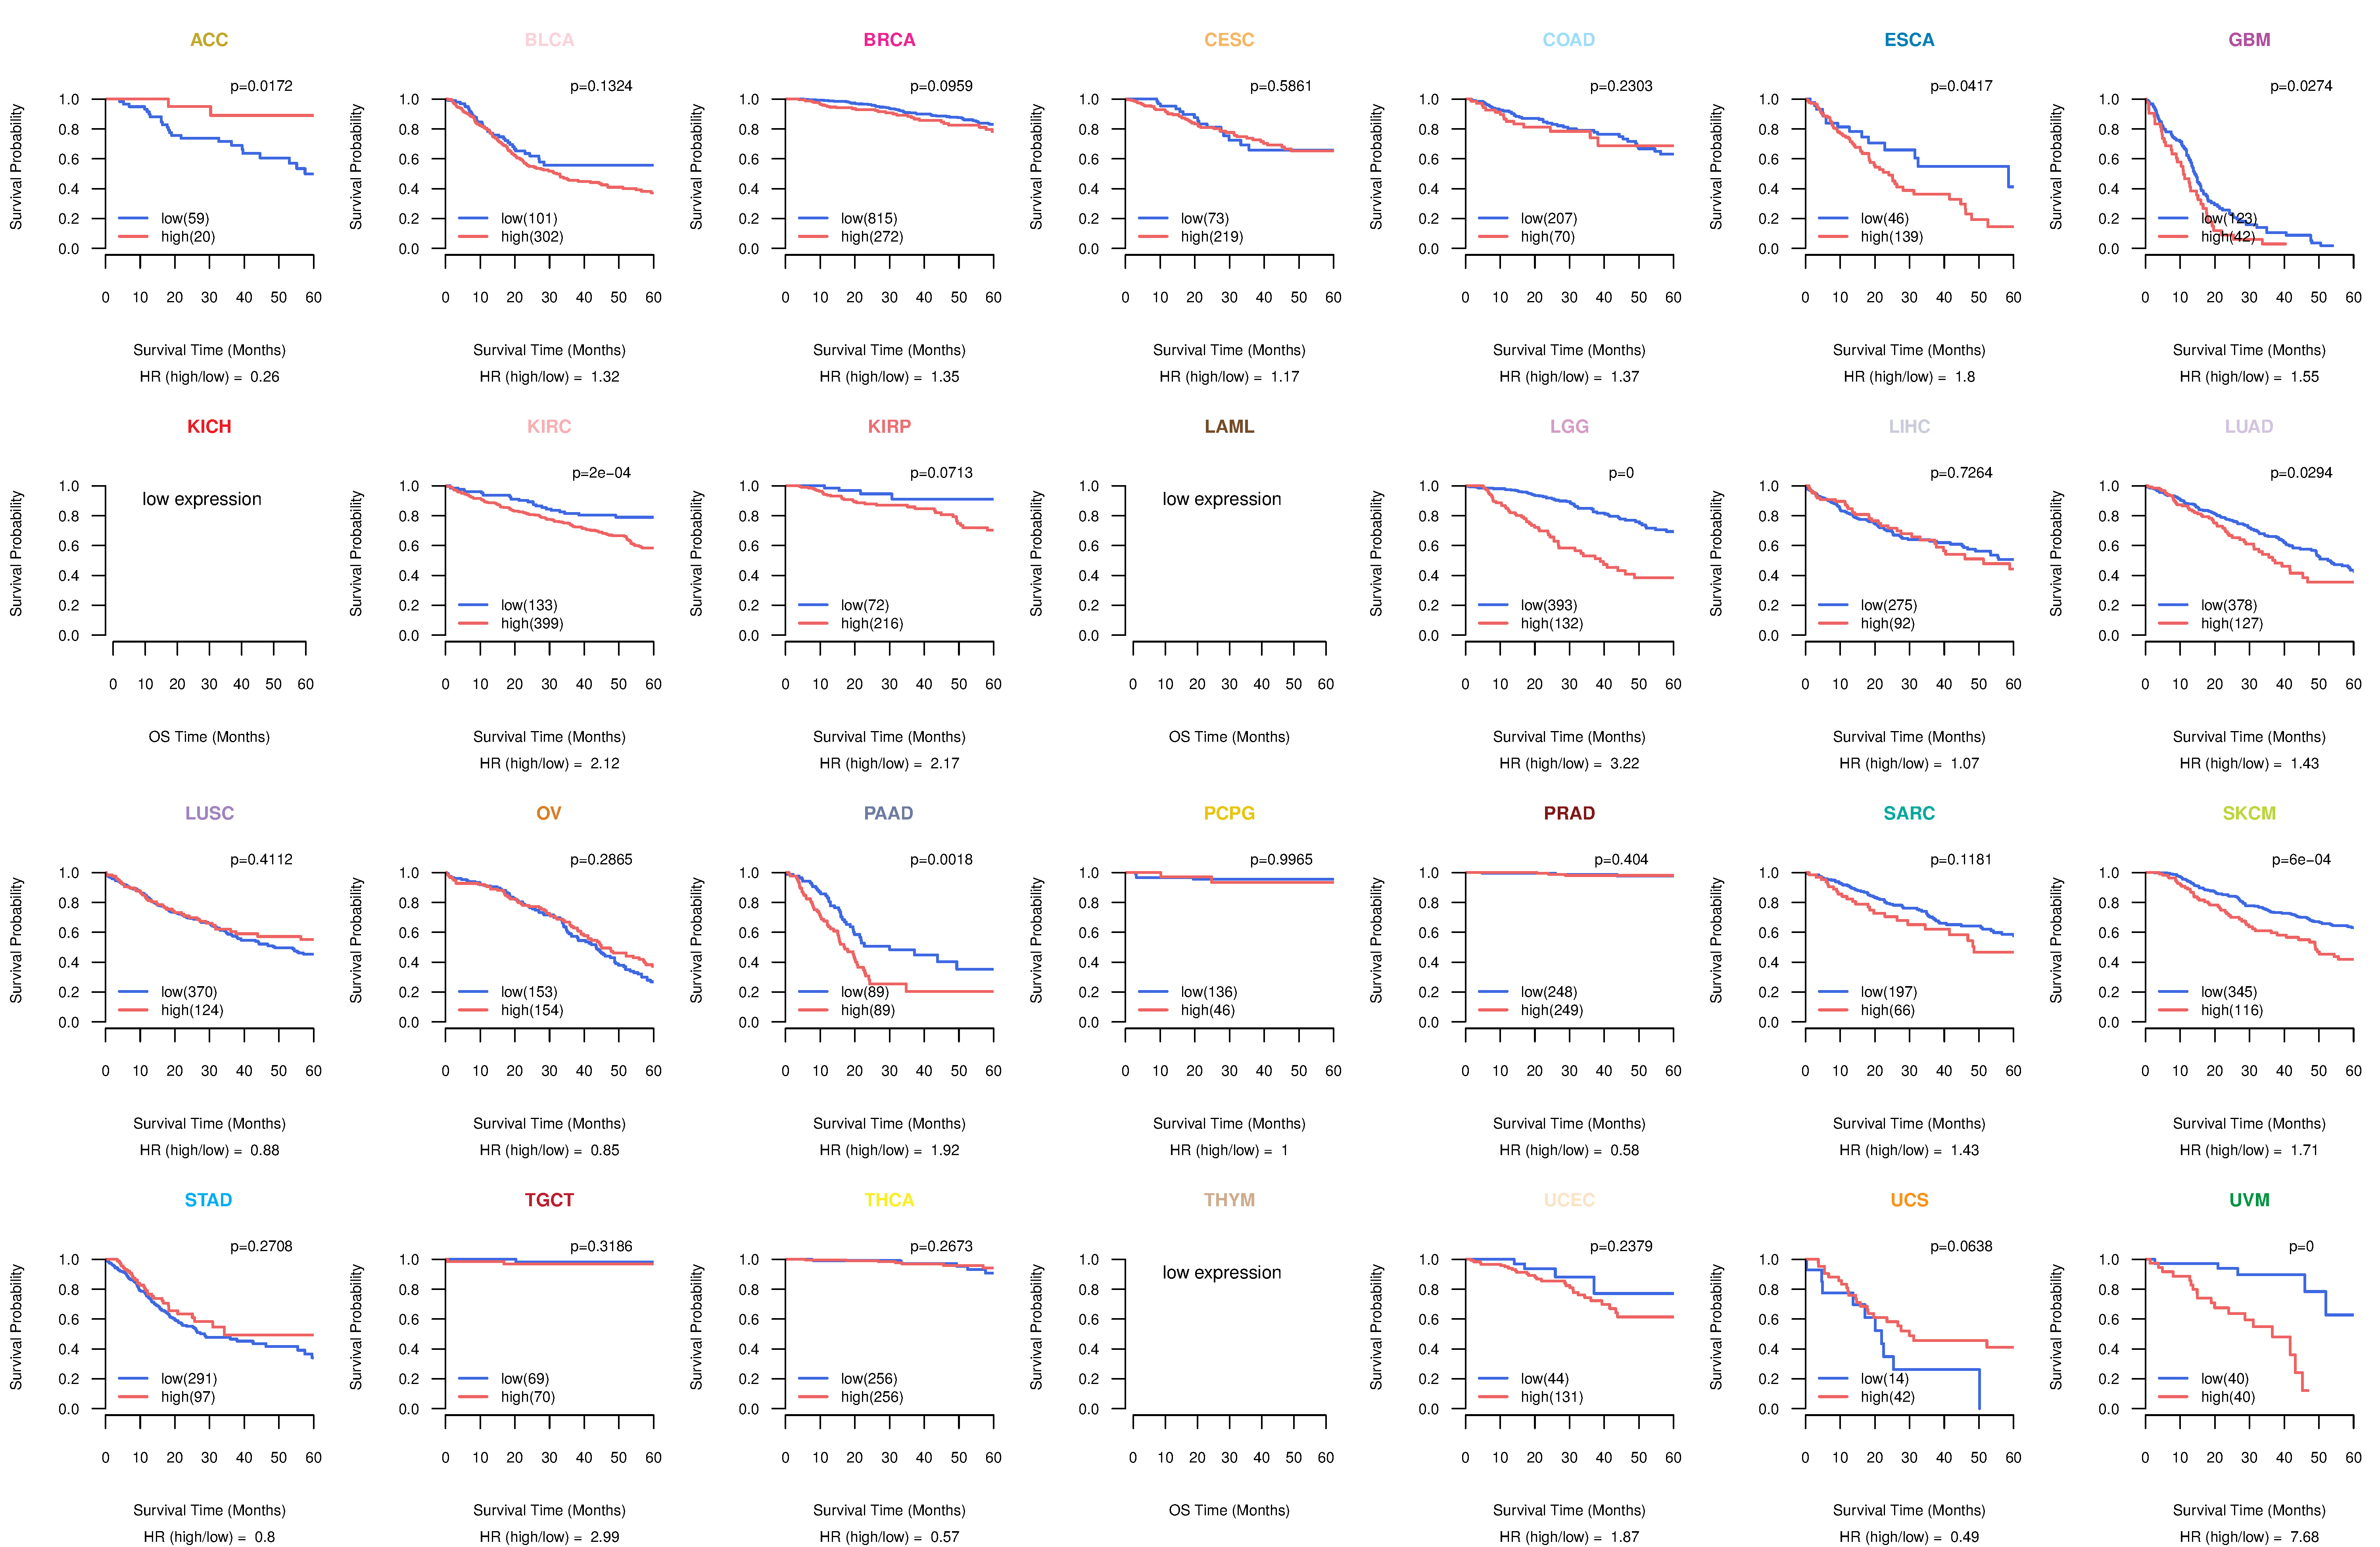
| TissGeneProg for PADI1 |
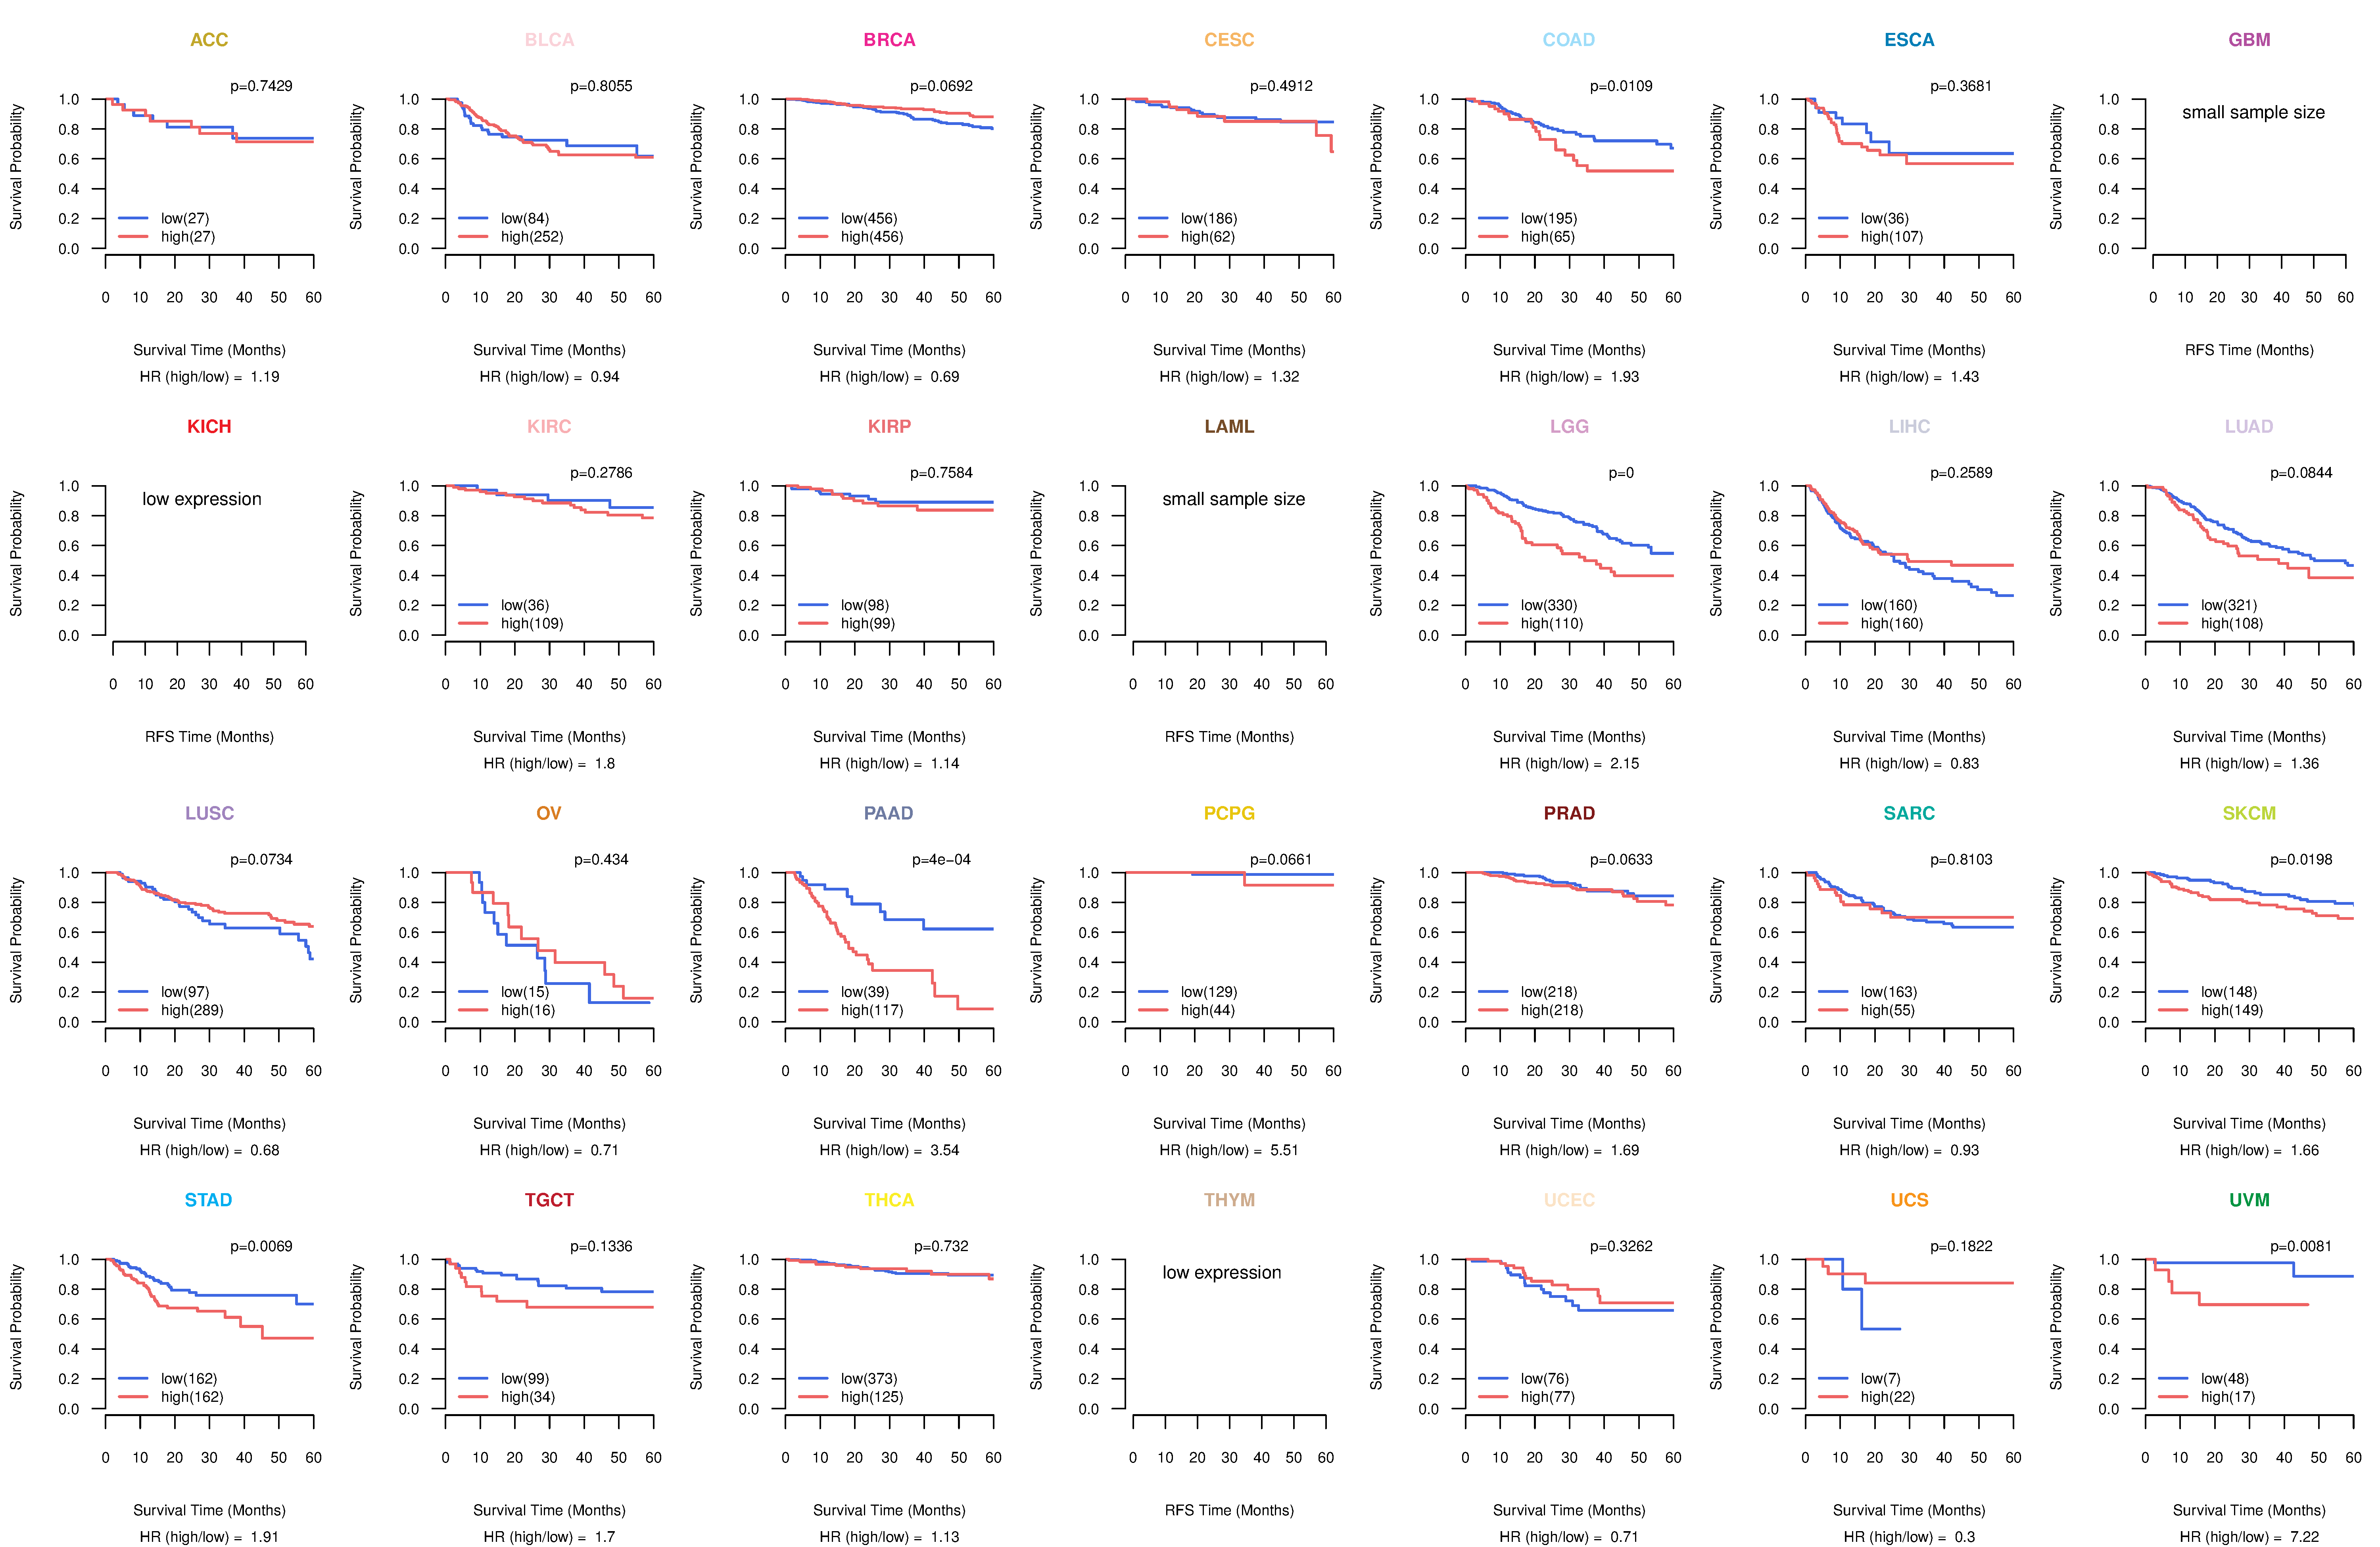
| Kaplan-Meier plots with logrank tests of overall survival (OS) using 28 cancer types (TCGA IlluminaHiSeq_RNASeqV2, pan-cancer normalized log2(norm_counts+1) data, version 2016-08-16) (TCGA clinicalMatrix, phenotype data, version 2016-04-27) * Click on the image to enlarge it in a new window. |
 |
| Kaplan-Meier plots with logrank test of relapse free survival (RFS) using 28 cancer types (TCGA IlluminaHiSeq_RNASeqV2, pan-cancer normalized log2(norm_counts+1) data, version 2016-08-16) (TCGA clinicalMatrix, phenotype data, version 2016-04-27) * Click on the image enlarge it in a new window. |
 |
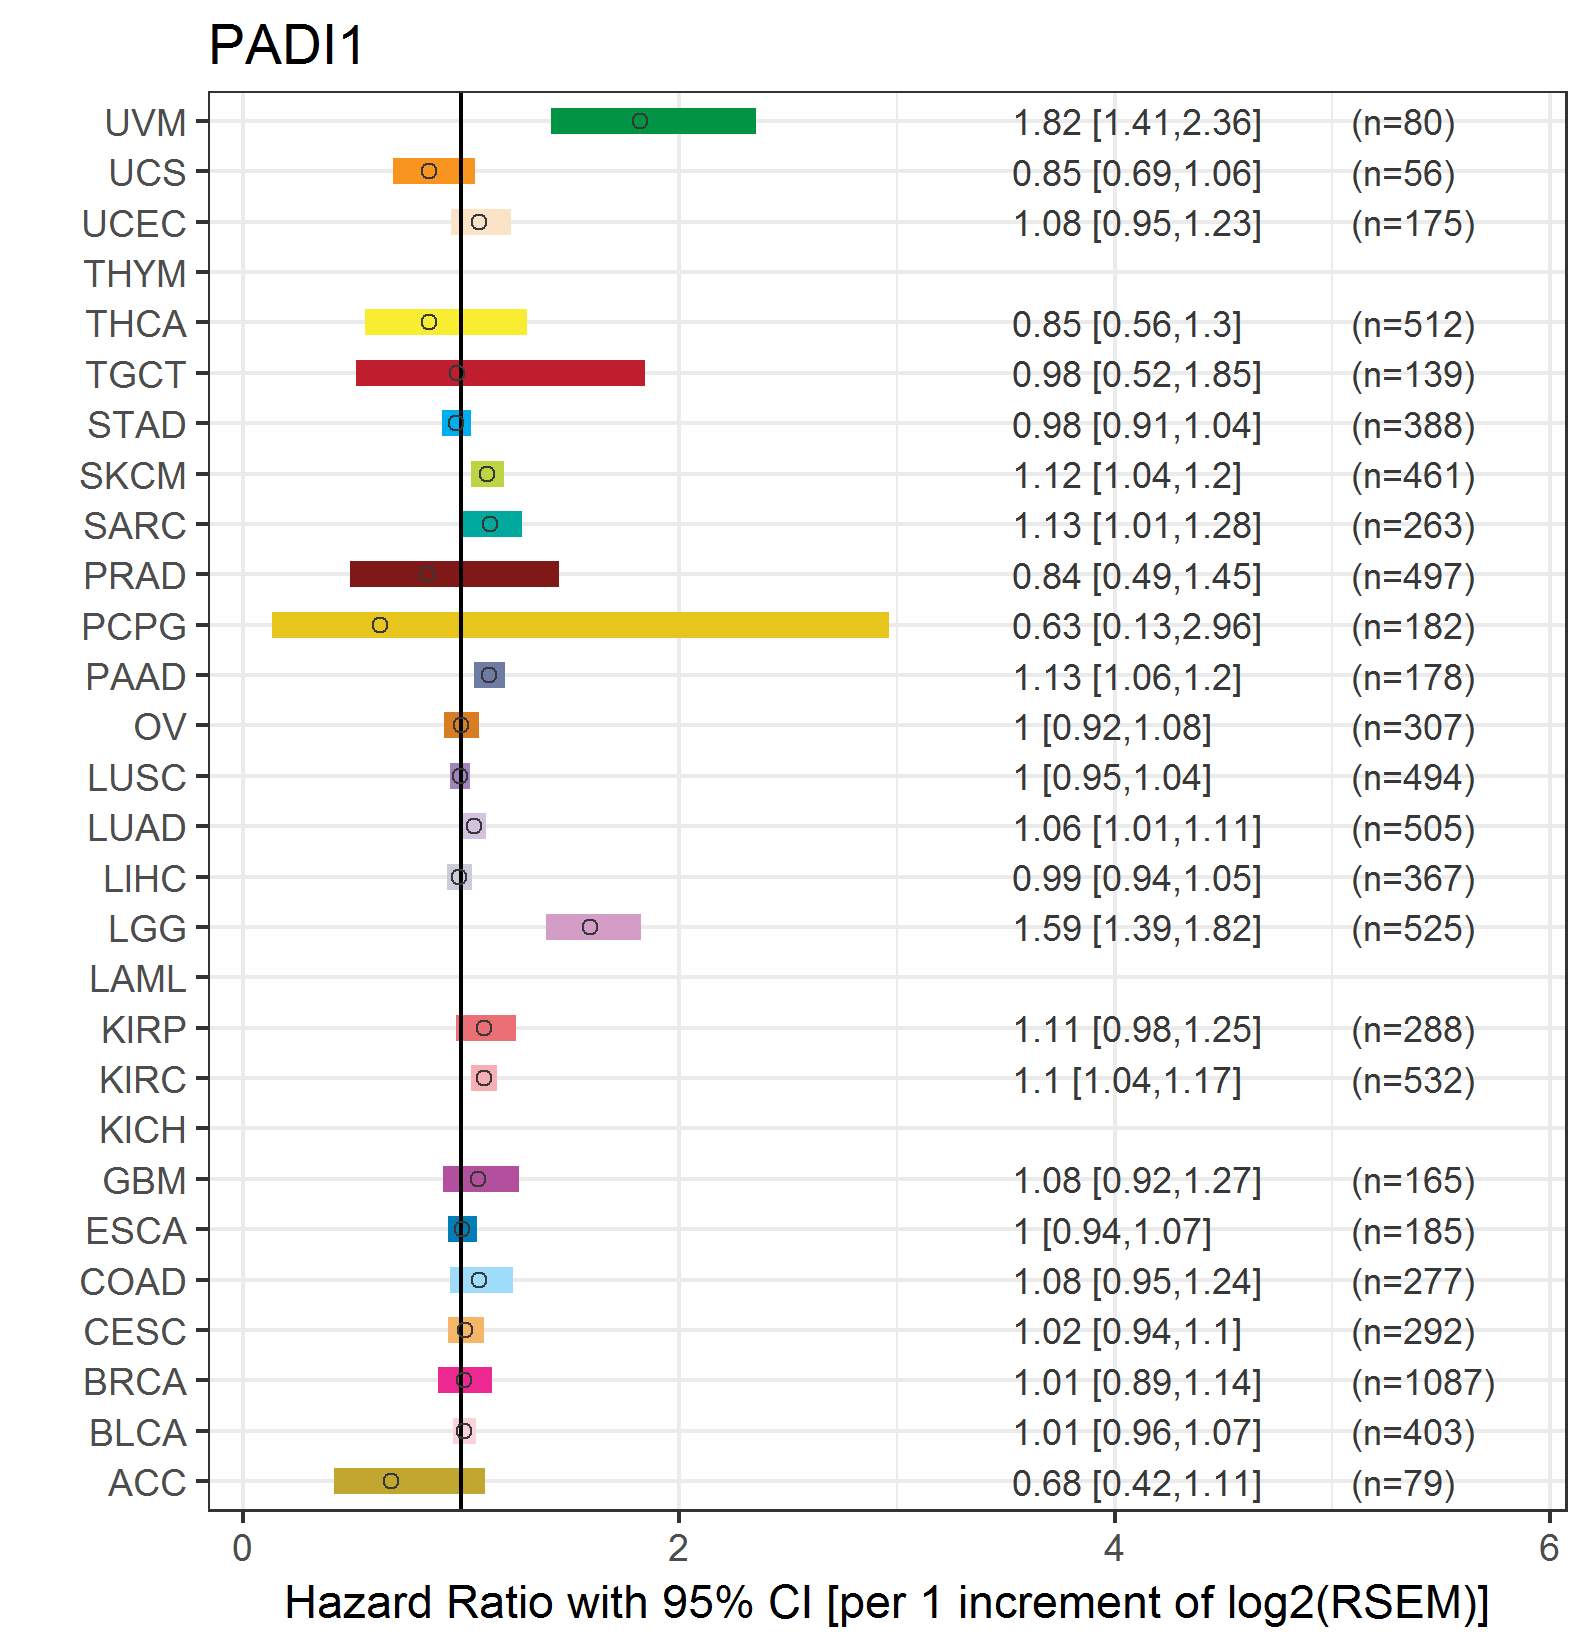
| Forest plot of Cox proportional hazard ratio (HR) and 95% CI of overall survival (OS) using 28 cancer types (TCGA IlluminaHiSeq_RNASeqV2, pan-cancer normalized log2(norm_counts+1) data, version 2016-08-16) (TCGA clinicalMatrix, phenotype data, version 2016-04-27) * Click on the image enlarge it in a new window. |
 |
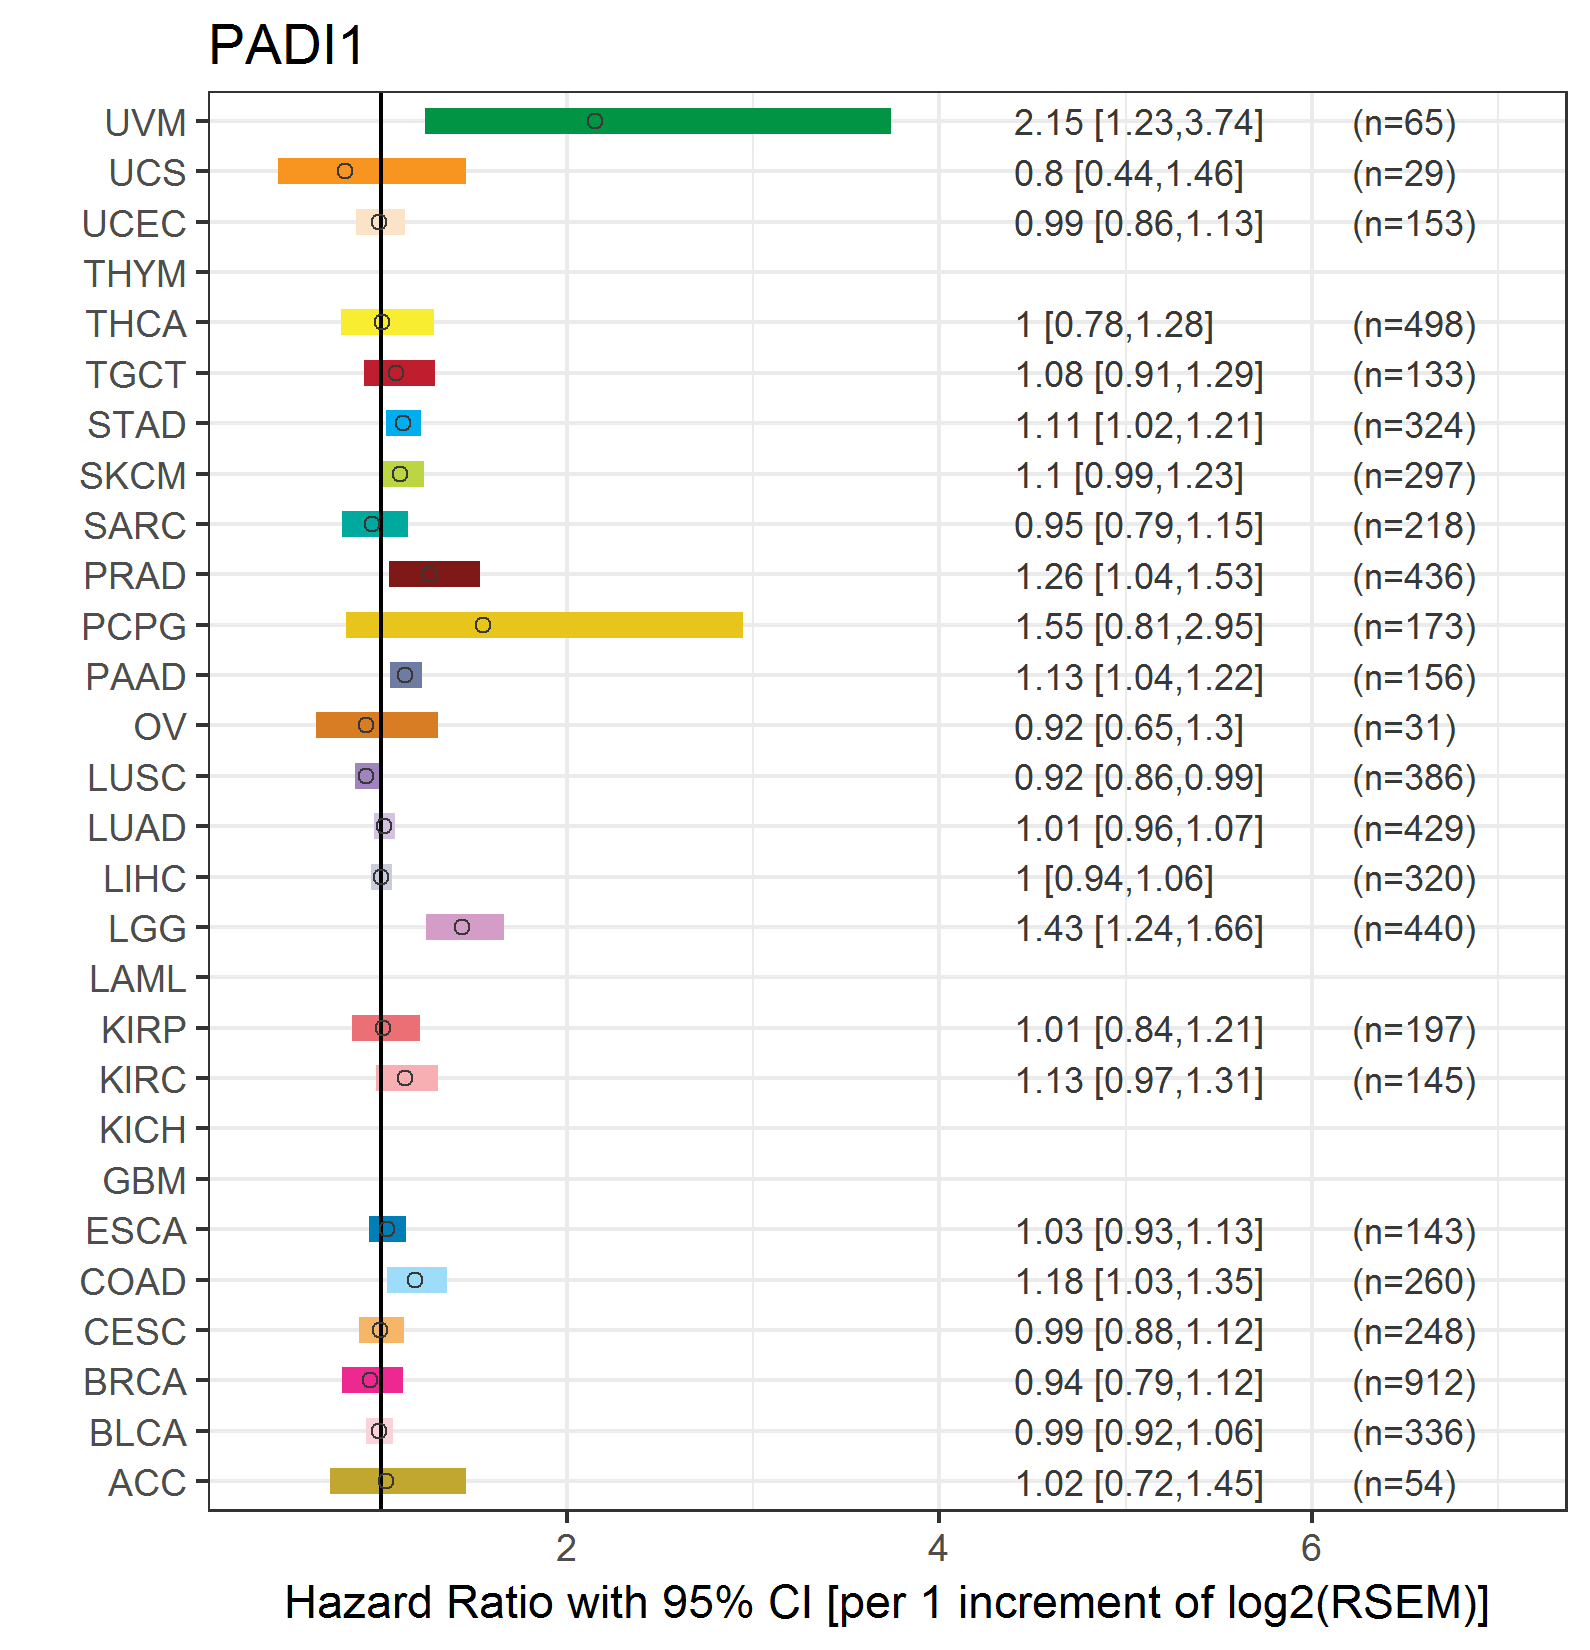
| Forest plot of Cox proportional hazard ratio (HR) and 95% CI of relapse free survival (RFS) using 28 cancer types (TCGA IlluminaHiSeq_RNASeqV2, pan-cancer normalized log2(norm_counts+1) data, version 2016-08-16) (TCGA clinicalMatrix, phenotype data, version 2016-04-27) * Click on the image enlarge it in a new window. |
 |
| Top |
| TissGeneClin for PADI1 |
| TissGeneDrug for PADI1 |
| Drug information targeting TissGene (DrugBank Version 5.0.6, 2017-04-01) |
| DrugBank ID | Drug name | Drug activity | Drug type | Drug status |
| DB00155 | L-Citrulline | Small molecule | Approved|Nutraceutical |
| Top |
| TissGeneDisease for PADI1 |
| Disease information associated with TissGene (DisGeNet, 2016-06-01) |
| Disease ID | Disease name | # pubmeds | Source |
| umls:C0003850 | Arteriosclerosis | 1 | BeFree |
| umls:C0003873 | Rheumatoid Arthritis | 1 | BeFree |
| umls:C0004153 | Atherosclerosis | 1 | BeFree |
| umls:C0006142 | Malignant neoplasm of breast | 1 | BeFree |
| umls:C0011847 | Diabetes | 1 | BeFree |
| umls:C0011849 | Diabetes Mellitus | 1 | BeFree |
| umls:C0011860 | Diabetes Mellitus, Non-Insulin-Dependent | 1 | BeFree |
| umls:C0021368 | Inflammation | 1 | LHGDN |
| umls:C0027627 | Neoplasm Metastasis | 1 | BeFree |
| umls:C0079504 | Hermanski-Pudlak Syndrome | 1 | BeFree |
| umls:C0375023 | Respiratory syncytial virus (RSV) infection in conditions classified elsewhere and of unspecified site | 1 | BeFree |
| umls:C0678222 | Breast Carcinoma | 1 | BeFree |
| umls:C2239176 | Liver carcinoma | 1 | BeFree |
|
Copyright 2016-Present - The University of Texas Health Science Center at Houston (UTHealth) Web File Viewing | How to Report, Fraud, Waste and Abuse | State of Texas | Statewide Search | Texas Homeland Security | Site Policies |