 |
| |
| |
| |
| |
| |
| |
|

| TissGeneSummary for DMGDH |
 Gene summary Gene summary |
| Basic gene information | Gene symbol | DMGDH |
| Gene name | dimethylglycine dehydrogenase | |
| Synonyms | DMGDHD|ME2GLYDH | |
| Cytomap | UCSC genome browser: 5q14.1 | |
| Type of gene | protein-coding | |
| RefGenes | NM_013391.3, NR_104002.1,NR_104003.1, | |
| Description | dimethylglycine dehydrogenase, mitochondrial | |
| Modification date | 20141211 | |
| dbXrefs | MIM : 605849 | |
| HGNC : HGNC | ||
| Ensembl : ENSG00000132837 | ||
| HPRD : 05789 | ||
| Vega : OTTHUMG00000108159 | ||
| Protein | UniProt: go to UniProt's Cross Reference DB Table | |
| Expression | CleanEX: HS_DMGDH | |
| BioGPS: 29958 | ||
| Pathway | NCI Pathway Interaction Database: DMGDH | |
| KEGG: DMGDH | ||
| REACTOME: DMGDH | ||
| Pathway Commons: DMGDH | ||
| Context | iHOP: DMGDH | |
| ligand binding site mutation search in PubMed: DMGDH | ||
| UCL Cancer Institute: DMGDH | ||
| Assigned class in TissGDB* | C | |
| Included tissue-specific gene expression resources | TiGER,GTEx | |
| Specific-tissues in normal samples (assigned by TissGDB using HPA, TiGER, and GTEx) | KidneyLiver | |
| Cancer types related to the specific-tissues in cancer samples (assigned by TissGDB using TCGA) | KIRC,KIRP,KICHLIHC | |
| Reference showing the relevant tissue of DMGDH | ||
| Description by TissGene annotations | Cancer gene | |
| * Class A consists of genes with literature evidence and is part of the cTissGenes. Class B consists of only cTissGenes without additional evidence. The remaining genes belong to Class C. |
| Gene ontology having evidence of Inferred from Direct Assay (IDA) from Entrez |
| GO ID | GO term | PubMed ID |
| Top |
| TissGeneExp for DMGDH |
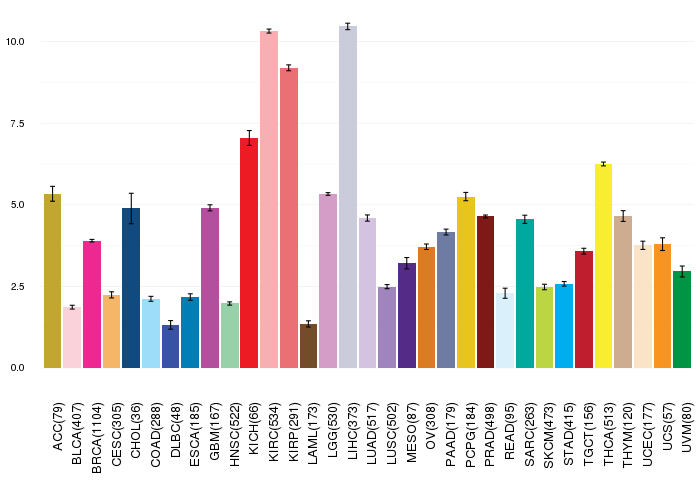
| Gene expressions across 28 cancer types (X-axis: cancer type and Y-axis: log2(norm_counts+1)) (TCGA IlluminaHiSeq_RNASeqV2, pan-cancer normalized log2(norm_counts+1) data, version 2016-08-16) |
 |
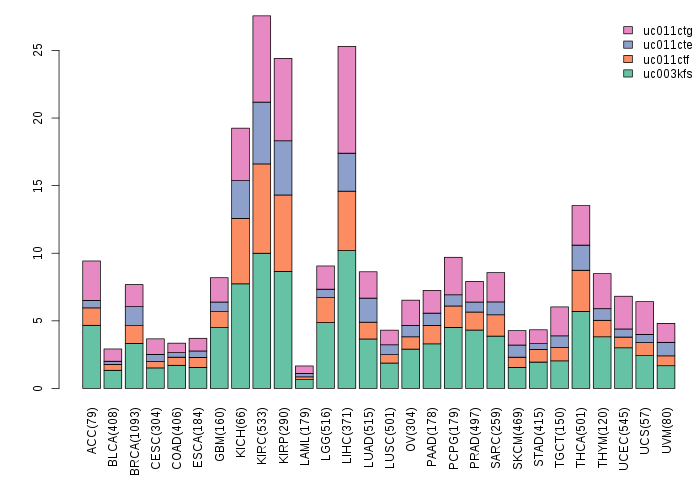
| Gene isoform expressions across 28 cancer types (X-axis: cancer type and Y-axis: log2(norm_counts+1)) (TCGA pan-cancer tcga_rsem_isoform_tpm, version 2016-09-01) |
 |
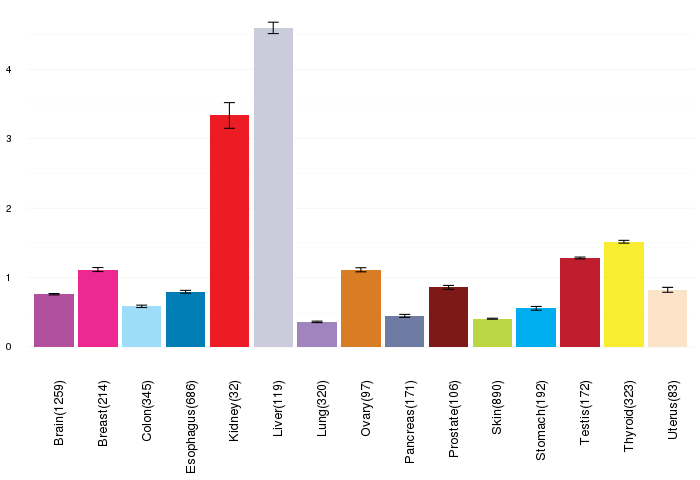
| Gene expressions across normal tissues of GTEx data (GTEx GTEx_Analysis_v6_RNA-seq_RNA-SeQCv1.1.8_gene_rpkm.gct) - Here, we shows the matched tissue types only among our 28 cancer types. |
 |
| Different expressions across 14 cancer types with more than 10 samples between matched tumors and normals (X-axis: cancer type and Y-axis: log2(norm_counts+1)) (TCGA IlluminaHiSeq_RNASeqV2, pan-cancer normalized log2(norm_counts+1) data, version 2016-08-16) |
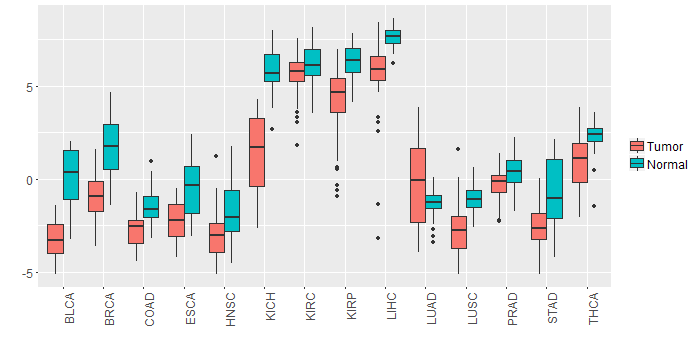 |
| - Significantly differentially expressed cancer types and information. (|Fold change|>1 and FDR<0.05) |
| Cancer type | Mean(exp) in tumor | Mean(exp) in matched normal | Log2FC | P-val. | FDR |
| BRCA | -0.928704029 | 1.646898603 | -2.575602632 | 5.46E-33 | 8.61E-32 |
| HNSC | -3.099784425 | -1.643449541 | -1.456334884 | 1.19E-05 | 6.68E-05 |
| LUSC | -2.76166053 | -1.107317393 | -1.654343137 | 1.62E-11 | 6.59E-11 |
| LIHC | 5.600297901 | 7.616453901 | -2.016156 | 5.92E-09 | 5.50E-08 |
| KICH | 1.408473901 | 5.741585901 | -4.333112 | 5.00E-11 | 4.21E-10 |
| KIRP | 3.945811651 | 6.344880401 | -2.39906875 | 7.57E-07 | 3.94E-06 |
| BLCA | -3.255629468 | -0.015139994 | -3.240489474 | 3.81E-08 | 2.65E-06 |
| THCA | 0.932077223 | 2.303297562 | -1.371220339 | 4.30E-09 | 2.26E-08 |
| COAD | -2.683070561 | -1.49885133 | -1.184219231 | 7.09E-05 | 0.00026905 |
| STAD | -2.533569599 | -0.774566474 | -1.759003125 | 2.10E-05 | 0.000212743 |
| Top |
| TissGene-miRNA for DMGDH |
| Significantly anti-correlated miRNAs of TissGene across 28 cancer types (Gene-miRNA relations from TargetScanHuman Relsease 7.1, Conserved_Site_Context_Scores.txt.zip, 06.01.2016) (TCGA IlluminaHiSeq_miRNASeq, log2(RPM+1) data, version 2016-11-21) (TCGA IlluminaHiSeq_RNASeqV2, log2(normalized_count+1) data, version 2016-08-16) (Spearman’s Rank Correlation (p-value<0.05 and coefficient<-0.25)) |
| Cancer type | miRNA id | miRNA accession | P-val. | Coeff. | # samples |
| Top |
| TissGeneMut for DMGDH |
| TissGeneSNV for DMGDH |
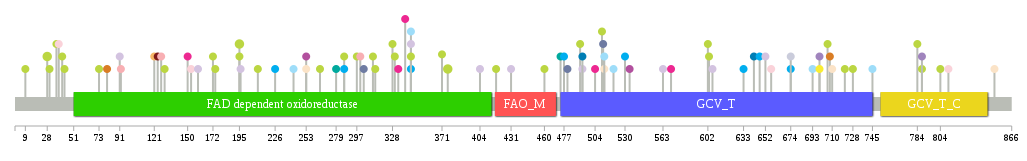
| nsSNV counts per each loci. Different colors of circles represent different cancer types. Circle size denotes number of samples. (TCGA somatic mutation (SNPs and small INDELs) data, version 2016-04-25) * Click on the image to enlarge it in a new window. |
 |
 |
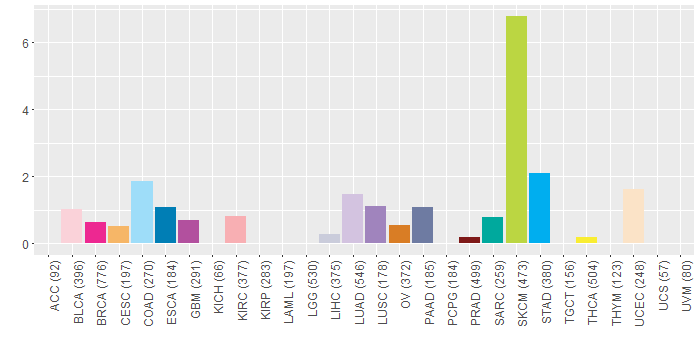
| Somatic nucleotide variants of TissGene across 28 cancer types (X-axis: cancer type and Y-axis: % of mutated samples) The numbers in parentheses are numbers of samples with mutation (nsSNVs). (TCGA somatic mutation (SNPs and small INDELs) data, version 2016-04-25) |
 |
| - nsSNVs sorted by frequency. |
| AAchange | Cancer type | # samples |
| p.P376S | SKCM | 2 |
| p.D28N | SKCM | 2 |
| p.P195L | SKCM | 2 |
| p.Q642K | ESCA | 1 |
| p.P188S | READ | 1 |
| p.P174S | SKCM | 1 |
| p.E36K | SKCM | 1 |
| p.E442G | HNSC | 1 |
| p.G563C | LUAD | 1 |
| p.E43K | SKCM | 1 |
| p.R344L | STAD | 1 |
| p.P371S | SKCM | 1 |
| p.F710C | UCEC | 1 |
| p.E80G | OV | 1 |
| p.N366S | DLBC | 1 |
| p.R477G | STAD | 1 |
| p.G418R | SKCM | 1 |
| p.R344* | HNSC | 1 |
| p.E851K | UCEC | 1 |
| p.G728R | SKCM | 1 |
| p.T512A | UCEC | 1 |
| p.P38T | BLCA | 1 |
| p.T159A | LUAD | 1 |
| p.S520P | COAD | 1 |
| p.R286X | STAD | 1 |
| p.E788D | LUSC | 1 |
| p.A92E | KIRC | 1 |
| p.G706R | SKCM | 1 |
| p.F333I | BRCA | 1 |
| p.M570V | BRCA | 1 |
| p.R253C | GBM | 1 |
| p.E303K | PAAD | 1 |
| p.Y196C | LUAD | 1 |
| p.L474I | SARC | 1 |
| p.R431S | LUAD | 1 |
| p.R344Q | LUAD | 1 |
| p.M699R | THCA | 1 |
| p.R510C | SKCM | 1 |
| p.L657V | BLCA | 1 |
| p.T512I | COAD | 1 |
| p.Q504* | BRCA | 1 |
| p.E460K | SKCM | 1 |
| p.P784L | SKCM | 1 |
| p.M172V | SKCM | 1 |
| p.P493L | ESCA | 1 |
| p.H130Y | SKCM | 1 |
| p.A530S | STAD | 1 |
| p.R286Q | SKCM | 1 |
| p.L265F | SKCM | 1 |
| p.V127L | KIRC | 1 |
| p.E647G | STAD | 1 |
| p.L592F | HNSC | 1 |
| p.S480F | PAAD | 1 |
| p.R511H | PAAD | 1 |
| p.E313K | SKCM | 1 |
| p.P330S | SKCM | 1 |
| p.R344Q | SKCM | 1 |
| p.P195S | SKCM | 1 |
| p.I674L | STAD | 1 |
| p.E491K | SKCM | 1 |
| p.Q150* | BRCA | 1 |
| p.G328R | SKCM | 1 |
| p.S297L | SKCM | 1 |
| p.D652N | LUAD | 1 |
| p.I674M | LIHC | 1 |
| p.A633S | STAD | 1 |
| p.A404S | LUAD | 1 |
| p.D603N | SKCM | 1 |
| p.S279F | SARC | 1 |
| p.P493Q | LUAD | 1 |
| p.R344X | COAD | 1 |
| p.R253C | UCEC | 1 |
| p.E788K | SKCM | 1 |
| p.N242I | COAD | 1 |
| p.D9N | SKCM | 1 |
| p.W46* | HNSC | 1 |
| p.H91Q | LUAD | 1 |
| p.M699I | LUSC | 1 |
| p.E721K | SKCM | 1 |
| p.A693V | COAD | 1 |
| p.K811N | BLCA | 1 |
| p.S804R | SKCM | 1 |
| p.R153Q | BLCA | 1 |
| p.L300F | KIRC | 1 |
| p.P311L | SKCM | 1 |
| p.T800M | HNSC | 1 |
| p.F745C | COAD | 1 |
| p.R286Q | HNSC | 1 |
| p.L534I | GBM | 1 |
| p.G124C | PRAD | 1 |
| p.A211V | SKCM | 1 |
| p.E339D | BRCA | 1 |
| p.S226P | STAD | 1 |
| p.H602Y | SKCM | 1 |
| p.D708H | OV | 1 |
| p.L592I | READ | 1 |
| p.W606S | LUAD | 1 |
| p.M73I | SKCM | 1 |
| p.E121K | CESC | 1 |
| p.S41F | SKCM | 1 |
| p.R30* | SKCM | 1 |
| Top |
| TissGeneCNV for DMGDH |
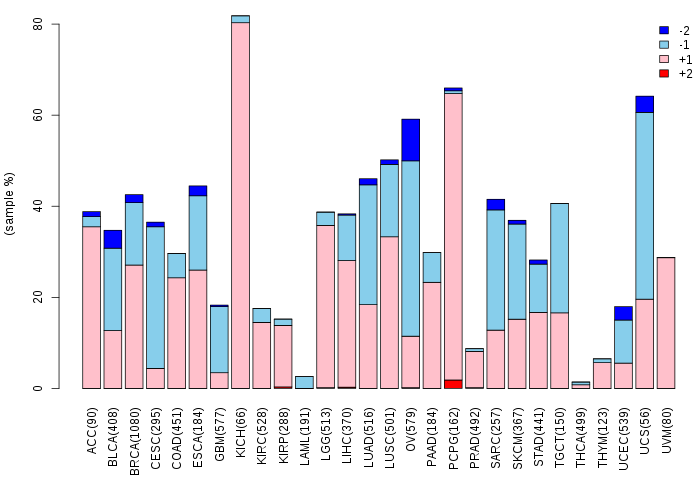
| Copy number variations of TissGene across 28 cancer types (X-axis: cancer type and Y-axis: % of CNV samples) (TCGA Gistic2_CopyNumber_Gistic2_all_data_by_genes, Gistic2 copy number data, version 2016-08-16) |
 |
| Top |
| TissGeneFusions for DMGDH |
| Fusion genes including TissGene (ChimerDB 3.0, 2016-12-01 and TCGA fusion Portal 2015-12-01) |
| Database | Src | Cancer type | Sample | Fusion gene | ORF | 5'-gene BP | 3'-gene BP |
| Chimerdb3.0 | FusionScan | KIRC | TCGA-CW-5589-01A | DMGDH-NMNAT2 | In-Frame | chr5:78301095 | chr1:183230438 |
| TCGAfusionPortal | PRADA | KIRC | TCGA-CW-5589-01A | DMGDH-NMNAT2 | In-frame | Chr5:78301096 | Chr1:183230438 |
| Top |
| TissGeneNet for DMGDH |
| Co-expressed gene networks based on protein-protein interaction data (CePIN) (TCGA IlluminaHiSeq_RNASeqV2, pan-cancer normalized log2(norm_counts+1) data, version 2016-08-16) (PINA2 ppi data) |
| Top |
| TissGeneProg for DMGDH |
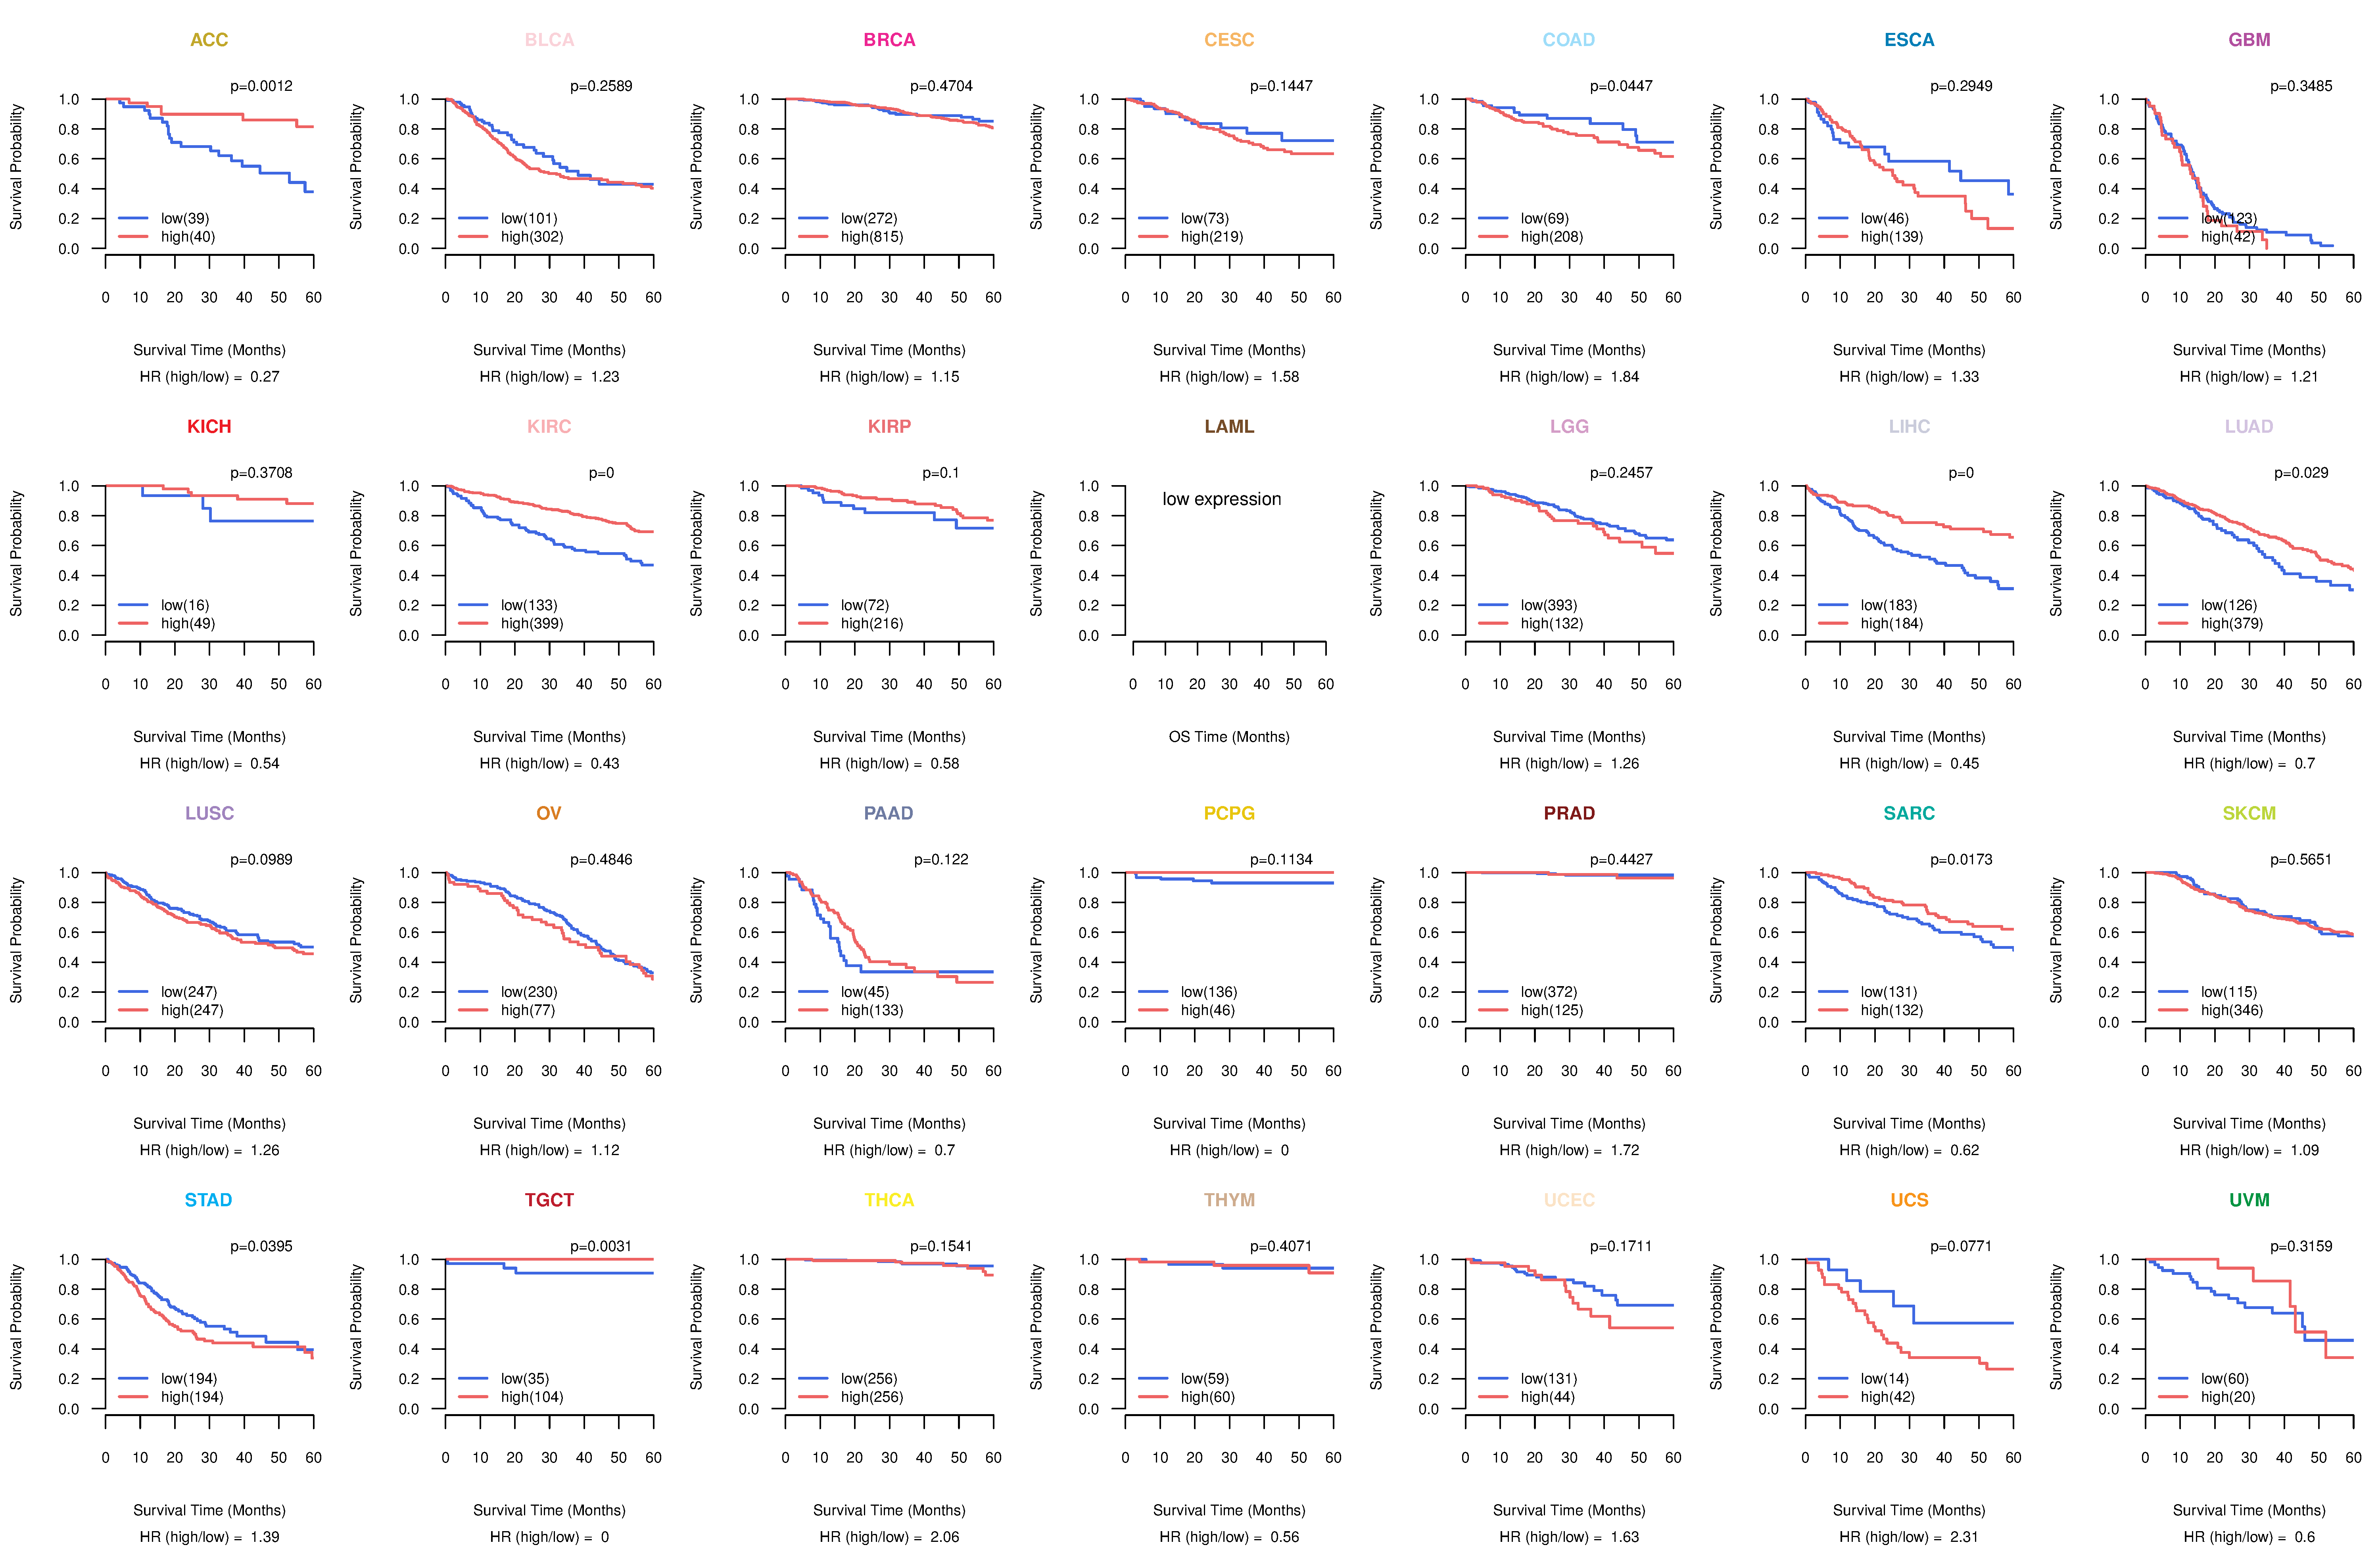
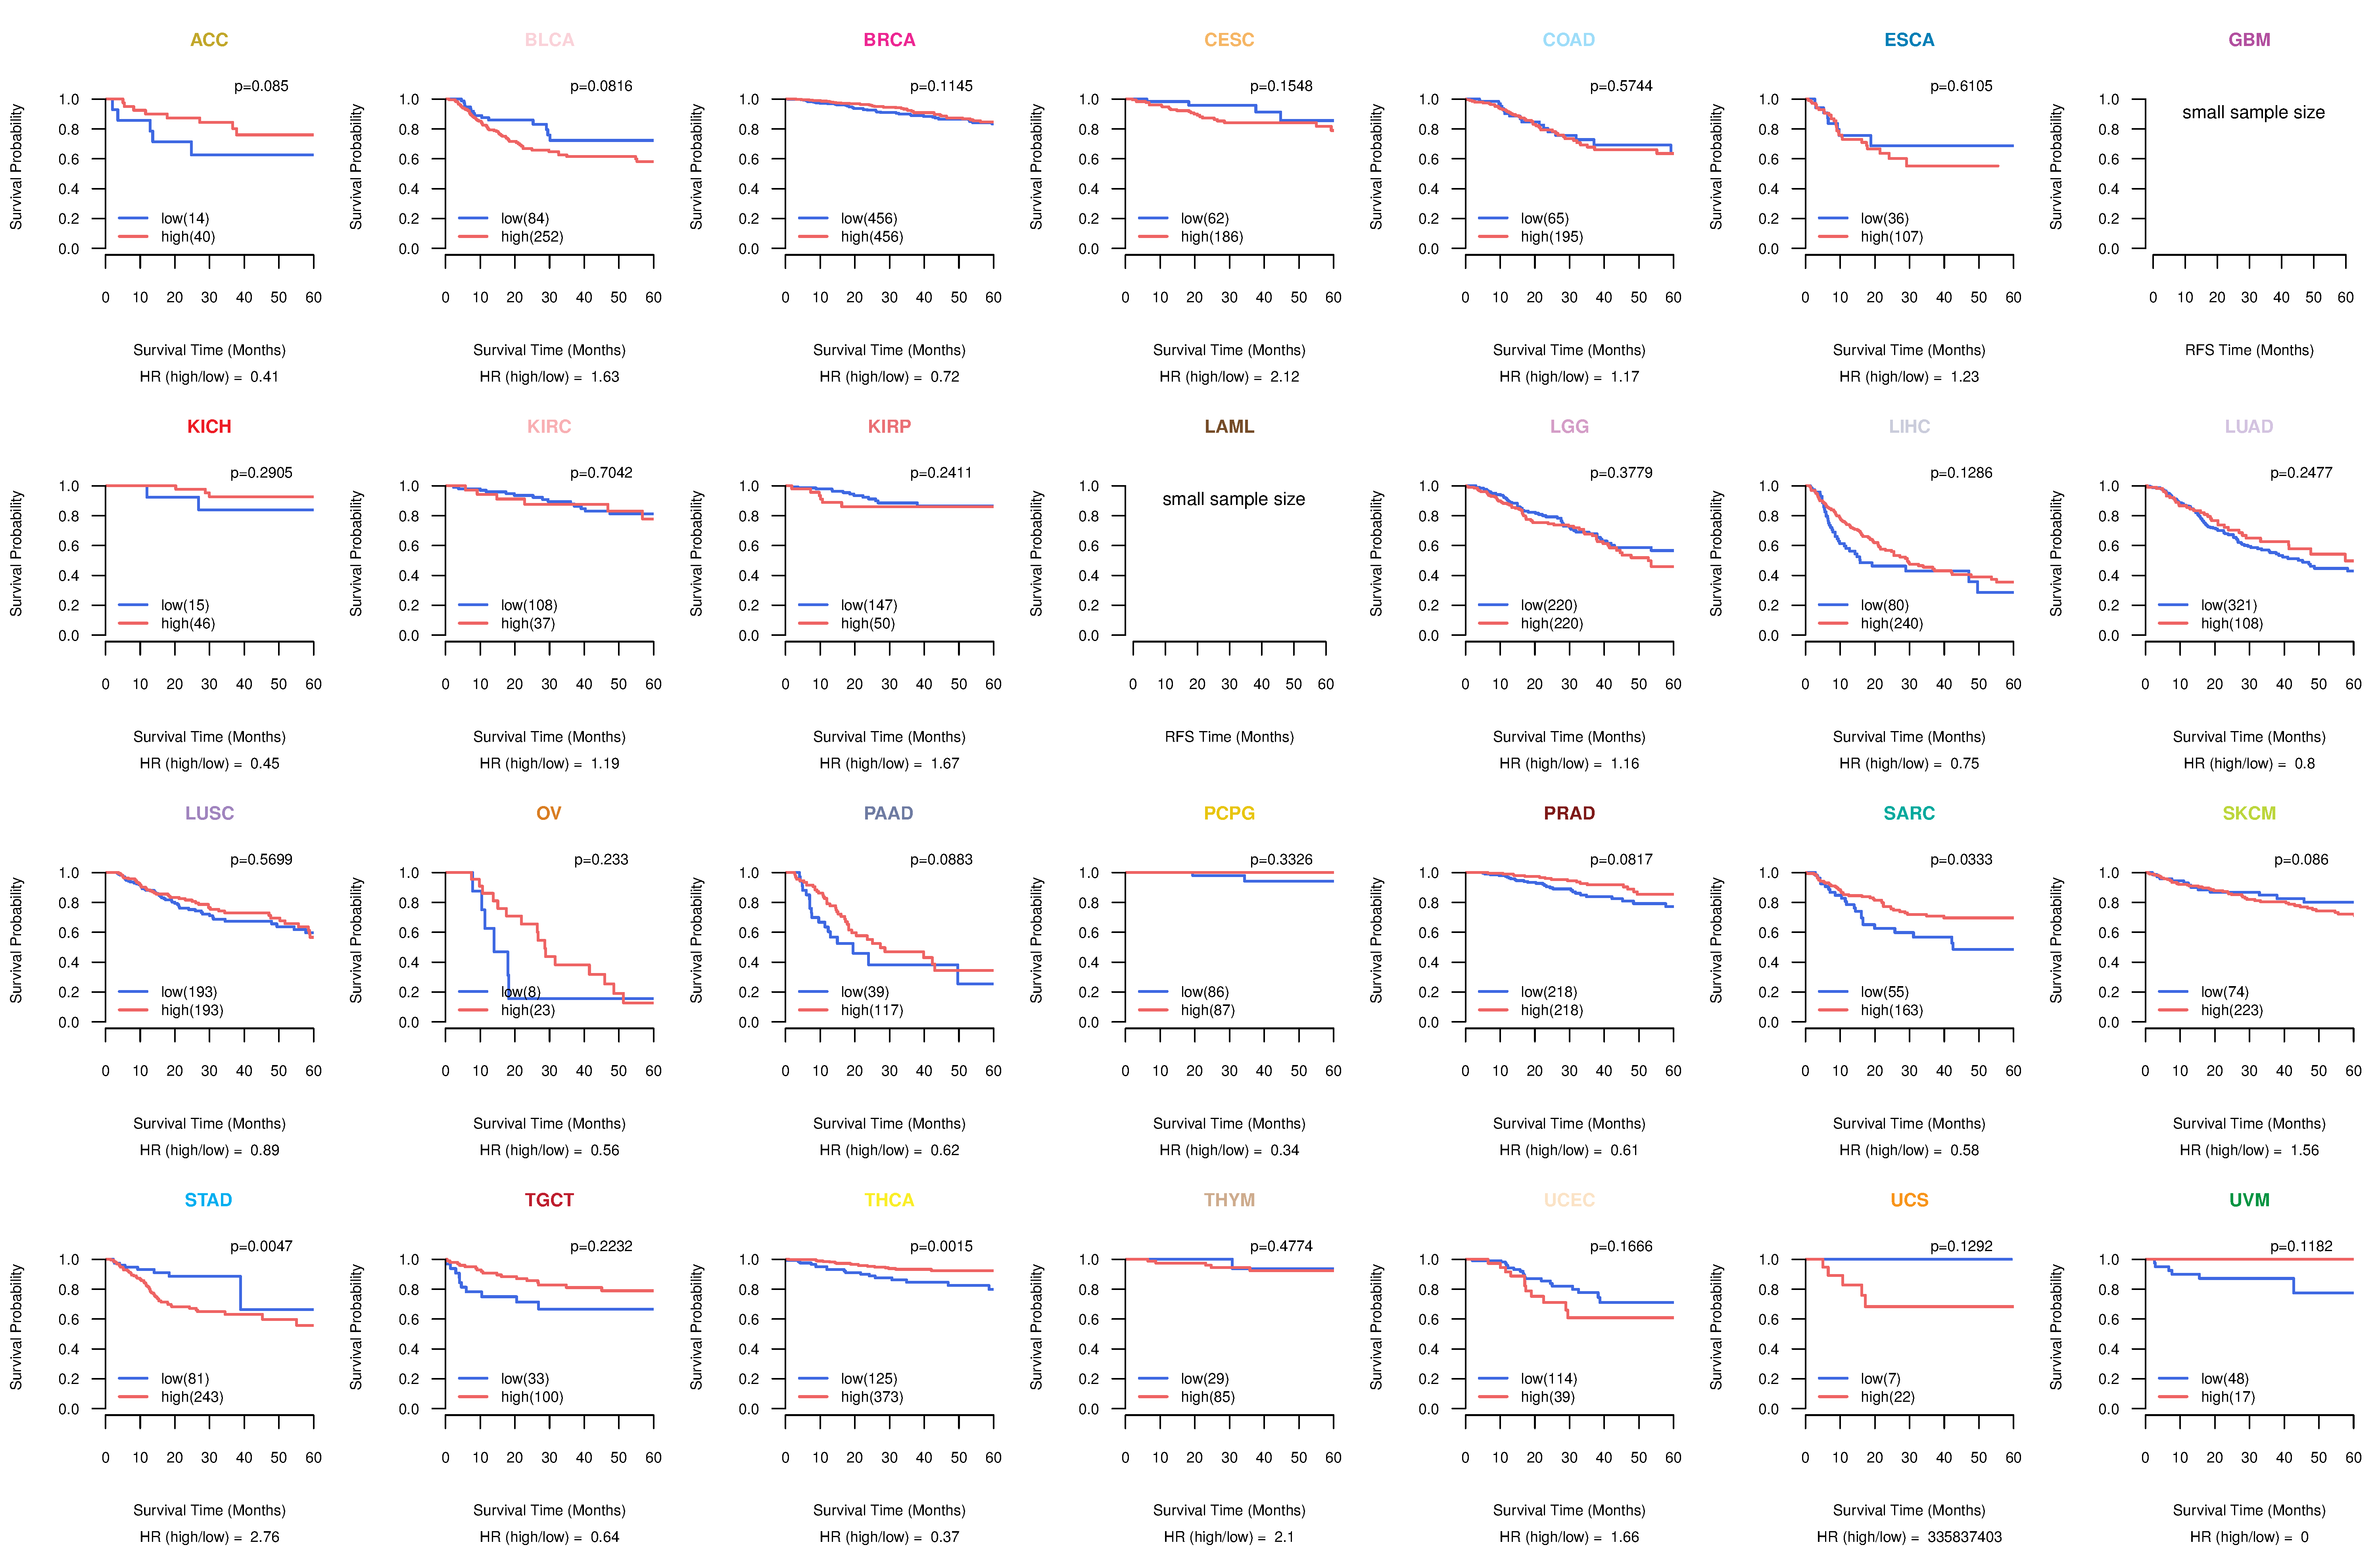
| Kaplan-Meier plots with logrank tests of overall survival (OS) using 28 cancer types (TCGA IlluminaHiSeq_RNASeqV2, pan-cancer normalized log2(norm_counts+1) data, version 2016-08-16) (TCGA clinicalMatrix, phenotype data, version 2016-04-27) * Click on the image to enlarge it in a new window. |
 |
| Kaplan-Meier plots with logrank test of relapse free survival (RFS) using 28 cancer types (TCGA IlluminaHiSeq_RNASeqV2, pan-cancer normalized log2(norm_counts+1) data, version 2016-08-16) (TCGA clinicalMatrix, phenotype data, version 2016-04-27) * Click on the image enlarge it in a new window. |
 |
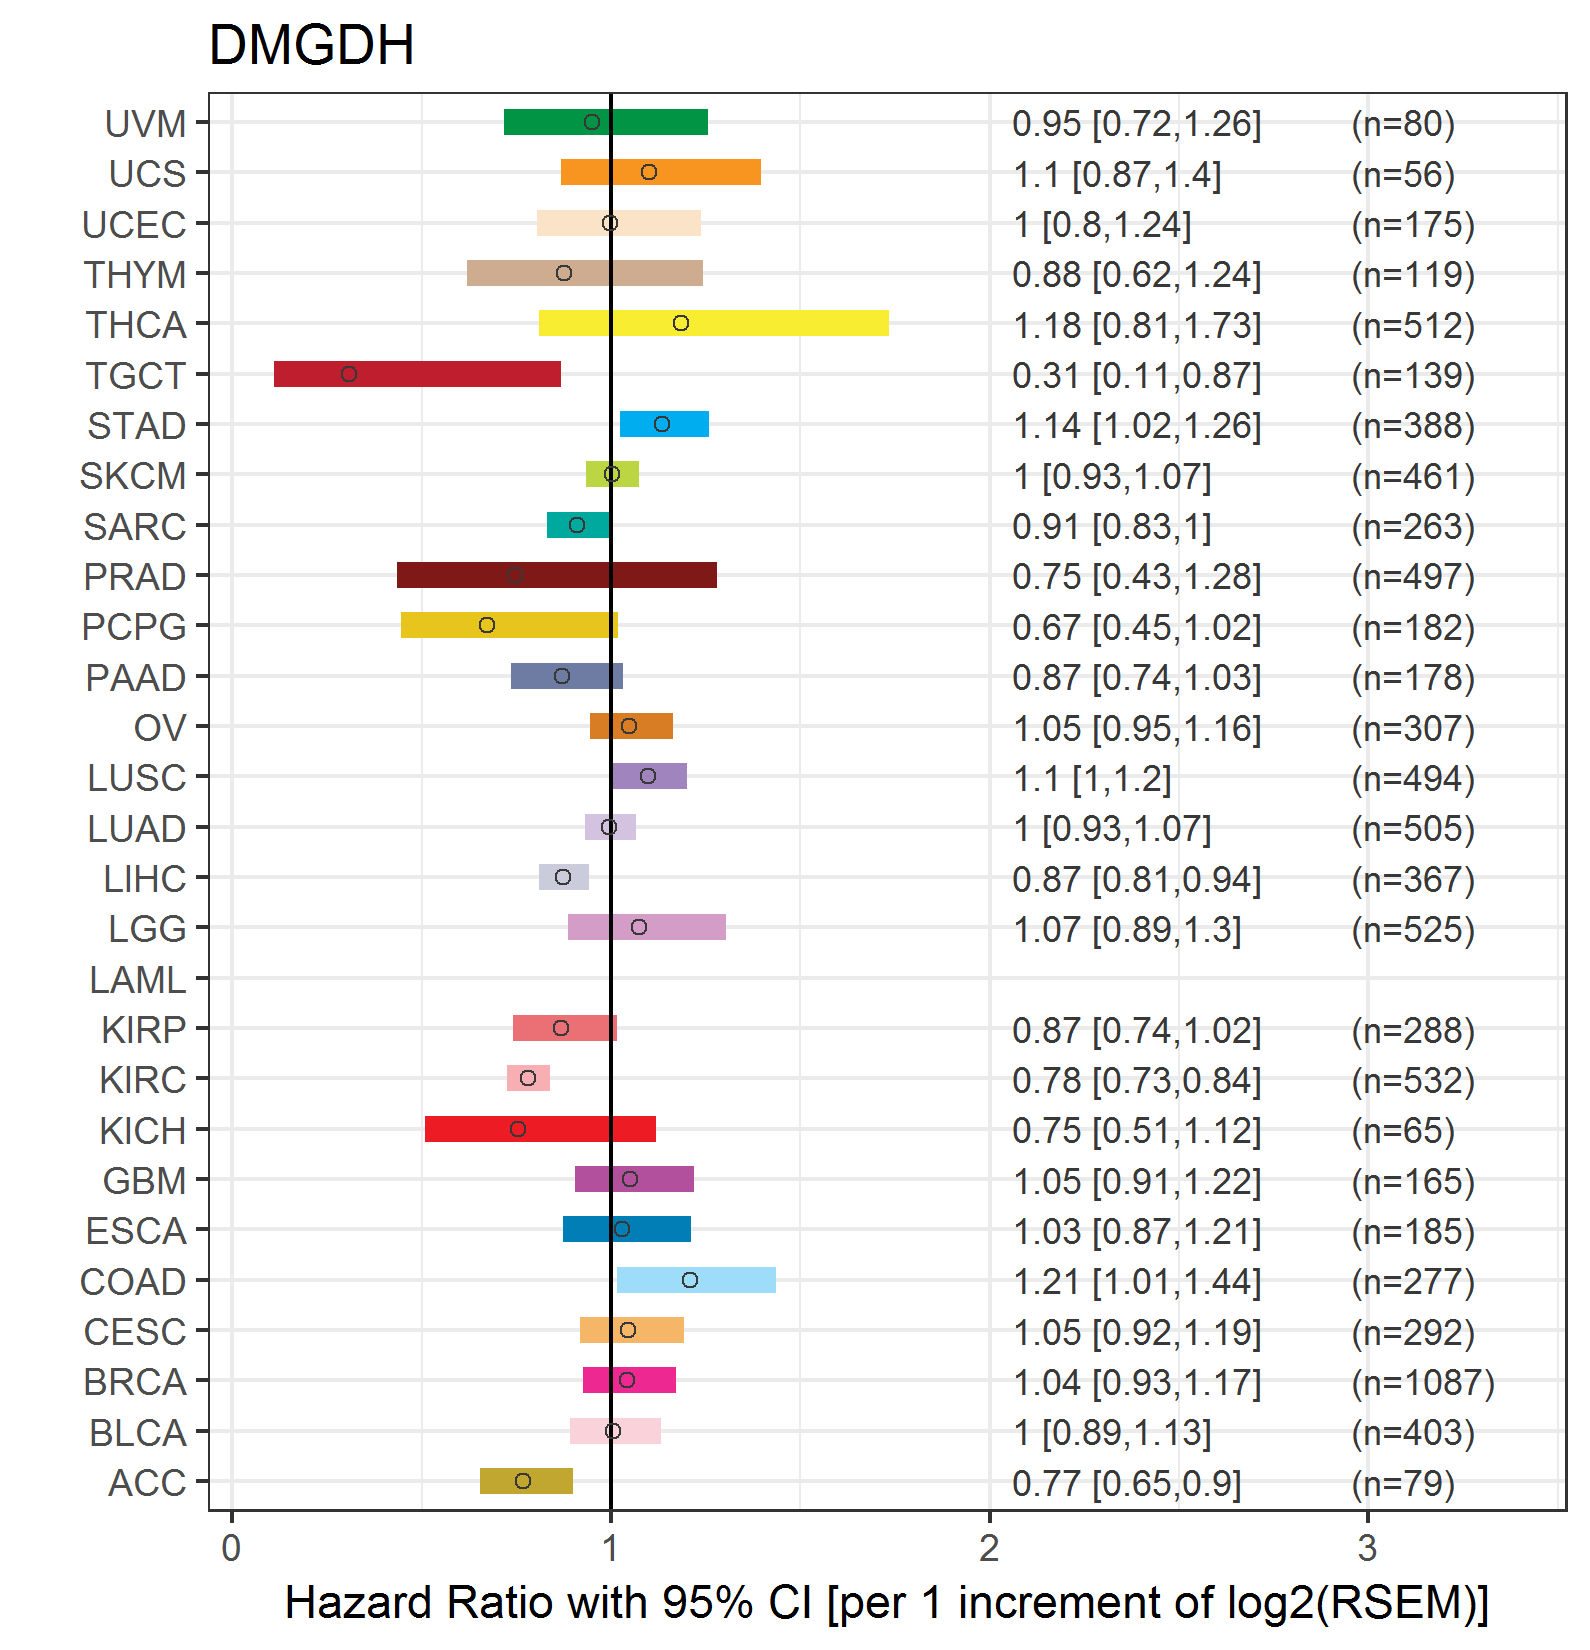
| Forest plot of Cox proportional hazard ratio (HR) and 95% CI of overall survival (OS) using 28 cancer types (TCGA IlluminaHiSeq_RNASeqV2, pan-cancer normalized log2(norm_counts+1) data, version 2016-08-16) (TCGA clinicalMatrix, phenotype data, version 2016-04-27) * Click on the image enlarge it in a new window. |
 |
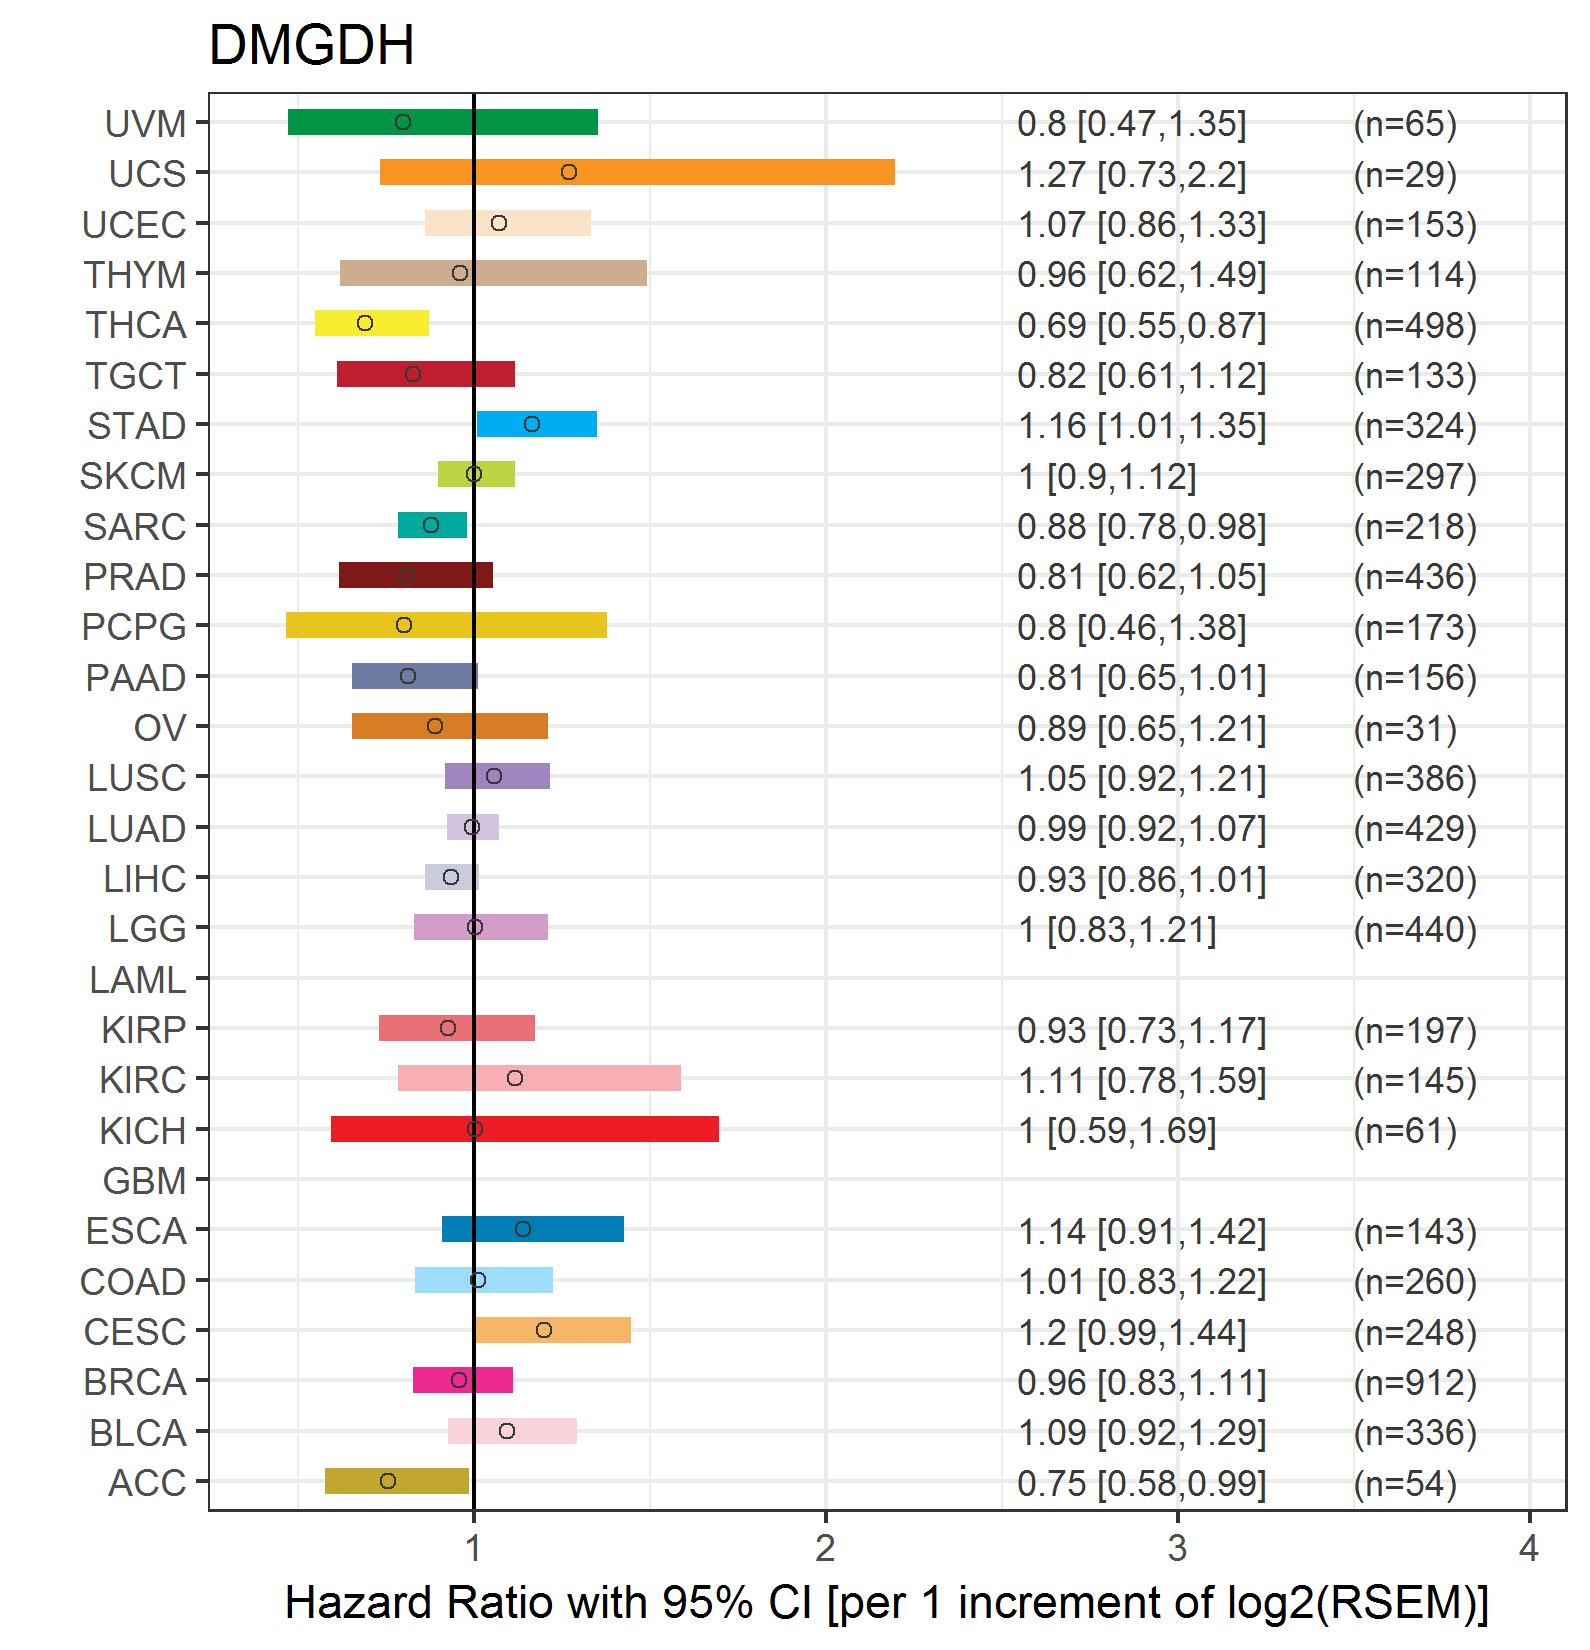
| Forest plot of Cox proportional hazard ratio (HR) and 95% CI of relapse free survival (RFS) using 28 cancer types (TCGA IlluminaHiSeq_RNASeqV2, pan-cancer normalized log2(norm_counts+1) data, version 2016-08-16) (TCGA clinicalMatrix, phenotype data, version 2016-04-27) * Click on the image enlarge it in a new window. |
 |
| Top |
| TissGeneClin for DMGDH |
| TissGeneDrug for DMGDH |
| Drug information targeting TissGene (DrugBank Version 5.0.6, 2017-04-01) |
| DrugBank ID | Drug name | Drug activity | Drug type | Drug status |
| Top |
| TissGeneDisease for DMGDH |
| Disease information associated with TissGene (DisGeNet, 2016-06-01) |
| Disease ID | Disease name | # pubmeds | Source |
| umls:C0008924 | Cleft Lip | 2 | GAD |
| umls:C0008925 | Cleft Palate | 2 | GAD |
| umls:C0025521 | Inborn Errors of Metabolism | 1 | BeFree |
| umls:C1271104 | Blood pressure finding | 1 | GAD |
| umls:C1272641 | Systemic arterial pressure | 1 | GAD |
| umls:C1853892 | Dimethylglycine Dehydrogenase Deficiency | 1 | CLINVAR,CTD_human,ORPHANET,UNIPROT |
|
Copyright 2016-Present - The University of Texas Health Science Center at Houston (UTHealth) Web File Viewing | How to Report, Fraud, Waste and Abuse | State of Texas | Statewide Search | Texas Homeland Security | Site Policies |