 |
| |
| |
| |
| |
| |
| |
|

| TissGeneSummary for GYS2 |
 Gene summary Gene summary |
| Basic gene information | Gene symbol | GYS2 |
| Gene name | glycogen synthase 2 (liver) | |
| Synonyms | - | |
| Cytomap | UCSC genome browser: 12p12.2 | |
| Type of gene | protein-coding | |
| RefGenes | NM_021957.3, | |
| Description | glycogen [starch] synthase, liver | |
| Modification date | 20141207 | |
| dbXrefs | MIM : 138571 | |
| HGNC : HGNC | ||
| Ensembl : ENSG00000111713 | ||
| HPRD : 00722 | ||
| Vega : OTTHUMG00000169135 | ||
| Protein | UniProt: go to UniProt's Cross Reference DB Table | |
| Expression | CleanEX: HS_GYS2 | |
| BioGPS: 2998 | ||
| Pathway | NCI Pathway Interaction Database: GYS2 | |
| KEGG: GYS2 | ||
| REACTOME: GYS2 | ||
| Pathway Commons: GYS2 | ||
| Context | iHOP: GYS2 | |
| ligand binding site mutation search in PubMed: GYS2 | ||
| UCL Cancer Institute: GYS2 | ||
| Assigned class in TissGDB* | A | |
| Included tissue-specific gene expression resources | HPA,TiGER,GTEx | |
| Specific-tissues in normal samples (assigned by TissGDB using HPA, TiGER, and GTEx) | Liver | |
| Cancer types related to the specific-tissues in cancer samples (assigned by TissGDB using TCGA) | LIHC | |
| Reference showing the relevant tissue of GYS2 | Zonation of nitrogen and glucose metabolism gene expression upon acute liver damage in mouse. Ghafoory S, Breitkopf-Heinlein K, Li Q, Scholl C, Dooley S, Wölfl S. PLoS One. 2013 Oct 17;8(10):e78262. doi: 10.1371/journal.pone.0078262. eCollection 2013. (pmid:24147127) go to article | |
| Description by TissGene annotations | TissgsKTS | |
| * Class A consists of genes with literature evidence and is part of the cTissGenes. Class B consists of only cTissGenes without additional evidence. The remaining genes belong to Class C. |
| Gene ontology having evidence of Inferred from Direct Assay (IDA) from Entrez |
| GO ID | GO term | PubMed ID | GO:0005978 | glycogen biosynthetic process | 1731614 | GO:0005978 | glycogen biosynthetic process | 1731614 |
| Top |
| TissGeneExp for GYS2 |
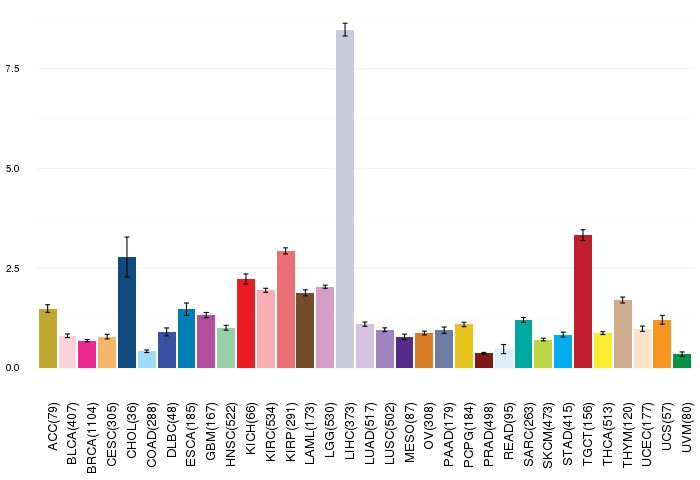
| Gene expressions across 28 cancer types (X-axis: cancer type and Y-axis: log2(norm_counts+1)) (TCGA IlluminaHiSeq_RNASeqV2, pan-cancer normalized log2(norm_counts+1) data, version 2016-08-16) |
 |
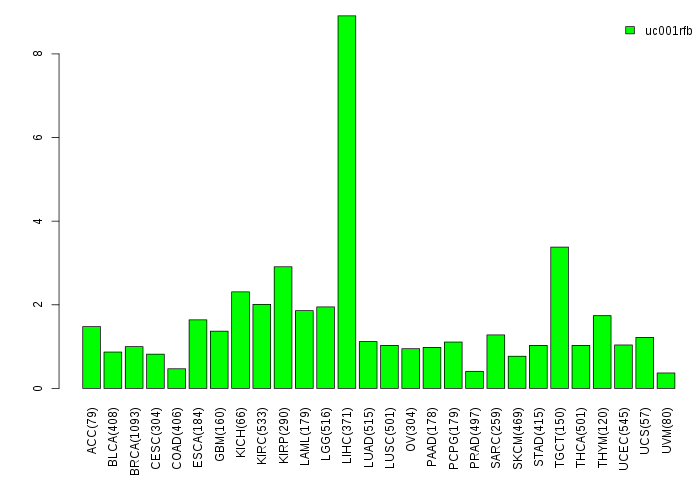
| Gene isoform expressions across 28 cancer types (X-axis: cancer type and Y-axis: log2(norm_counts+1)) (TCGA pan-cancer tcga_rsem_isoform_tpm, version 2016-09-01) |
 |
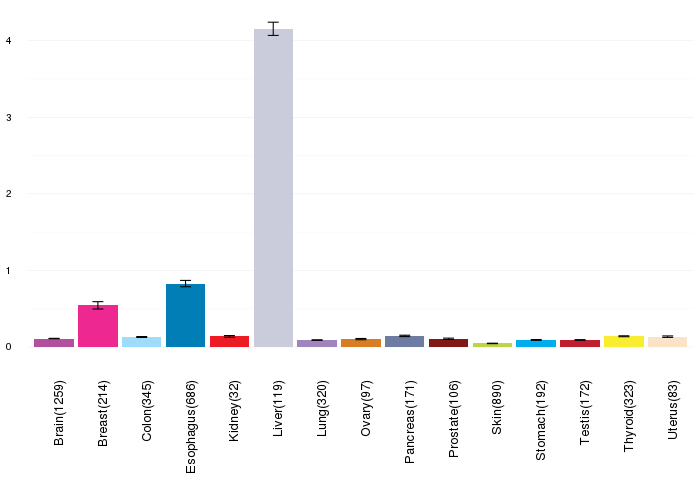
| Gene expressions across normal tissues of GTEx data (GTEx GTEx_Analysis_v6_RNA-seq_RNA-SeQCv1.1.8_gene_rpkm.gct) - Here, we shows the matched tissue types only among our 28 cancer types. |
 |
| Different expressions across 14 cancer types with more than 10 samples between matched tumors and normals (X-axis: cancer type and Y-axis: log2(norm_counts+1)) (TCGA IlluminaHiSeq_RNASeqV2, pan-cancer normalized log2(norm_counts+1) data, version 2016-08-16) |
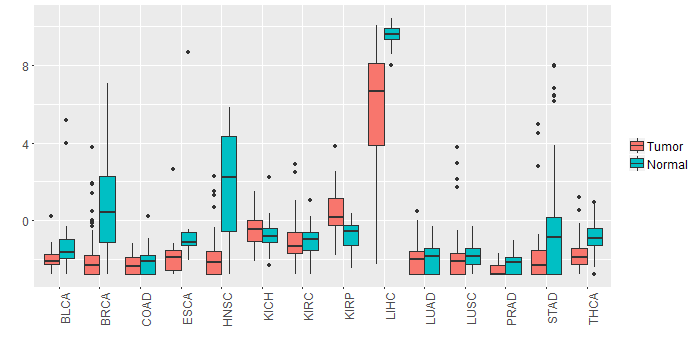 |
| - Significantly differentially expressed cancer types and information. (|Fold change|>1 and FDR<0.05) |
| Cancer type | Mean(exp) in tumor | Mean(exp) in matched normal | Log2FC | P-val. | FDR |
| LIHC | 5.669608338 | 9.543750338 | -3.874142 | 5.63E-11 | 7.53E-10 |
| BRCA | -2.013743241 | 0.879621671 | -2.893364912 | 8.01E-23 | 6.96E-22 |
| HNSC | -1.786010499 | 1.937177873 | -3.723188372 | 1.52E-11 | 3.76E-10 |
| KIRP | 0.409025838 | -0.708033537 | 1.117059375 | 6.89E-05 | 0.000247158 |
| Top |
| TissGene-miRNA for GYS2 |
| Significantly anti-correlated miRNAs of TissGene across 28 cancer types (Gene-miRNA relations from TargetScanHuman Relsease 7.1, Conserved_Site_Context_Scores.txt.zip, 06.01.2016) (TCGA IlluminaHiSeq_miRNASeq, log2(RPM+1) data, version 2016-11-21) (TCGA IlluminaHiSeq_RNASeqV2, log2(normalized_count+1) data, version 2016-08-16) (Spearman’s Rank Correlation (p-value<0.05 and coefficient<-0.25)) |
| Cancer type | miRNA id | miRNA accession | P-val. | Coeff. | # samples |
| Top |
| TissGeneMut for GYS2 |
| TissGeneSNV for GYS2 |
| nsSNV counts per each loci. Different colors of circles represent different cancer types. Circle size denotes number of samples. (TCGA somatic mutation (SNPs and small INDELs) data, version 2016-04-25) * Click on the image to enlarge it in a new window. |
 |
 |
| Somatic nucleotide variants of TissGene across 28 cancer types (X-axis: cancer type and Y-axis: % of mutated samples) The numbers in parentheses are numbers of samples with mutation (nsSNVs). (TCGA somatic mutation (SNPs and small INDELs) data, version 2016-04-25) |
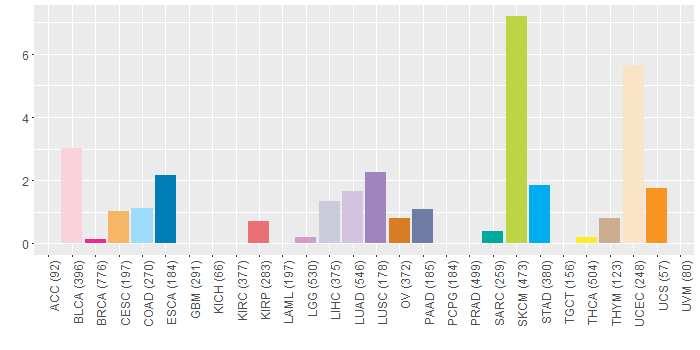 |
| - nsSNVs sorted by frequency. |
| AAchange | Cancer type | # samples |
| p.P197S | SKCM | 2 |
| p.D418N | SKCM | 2 |
| p.P414S | SKCM | 2 |
| p.S640F | SKCM | 1 |
| p.P455A | OV | 1 |
| p.I552M | OV | 1 |
| p.Y605C | LIHC | 1 |
| p.D219N | SKCM | 1 |
| p.G141D | KIRP | 1 |
| p.R3Q | STAD | 1 |
| p.W18L | LUAD | 1 |
| p.N228D | HNSC | 1 |
| p.P525H | LUAD | 1 |
| p.P24S | SKCM | 1 |
| p.A87V | SKCM | 1 |
| p.R309* | UCEC | 1 |
| p.D225H | BLCA | 1 |
| p.E82* | UCEC | 1 |
| p.G111E | SKCM | 1 |
| p.E673K | LUAD | 1 |
| p.E110X | STAD | 1 |
| p.D57N | UCS | 1 |
| p.W59* | ESCA | 1 |
| p.I367V | LIHC | 1 |
| p.I44M | LUSC | 1 |
| p.V497L | BLCA | 1 |
| p.A233S | LUAD | 1 |
| p.T257K | LUAD | 1 |
| p.M355I | THYM | 1 |
| p.V254M | SKCM | 1 |
| p.D669N | SKCM | 1 |
| p.P487S | SKCM | 1 |
| p.R309Q | SKCM | 1 |
| p.R469S | ESCA | 1 |
| p.G382R | SKCM | 1 |
| p.Y701C | COAD | 1 |
| p.D665Y | STAD | 1 |
| p.E58G | UCEC | 1 |
| p.H223Y | SKCM | 1 |
| p.R90K | STAD | 1 |
| p.Y242H | BLCA | 1 |
| p.I524V | LIHC | 1 |
| p.E378K | LIHC | 1 |
| p.R309* | SKCM | 1 |
| p.E398K | SKCM | 1 |
| p.N680H | BLCA | 1 |
| p.G281S | BRCA | 1 |
| p.N376K | LUAD | 1 |
| p.P143S | SKCM | 1 |
| p.R580H | OV | 1 |
| p.A149T | LGG | 1 |
| p.V176I | UCEC | 1 |
| p.E518Q | CESC | 1 |
| p.E22* | UCEC | 1 |
| p.E110* | STAD | 1 |
| p.R558H | HNSC | 1 |
| p.S6C | LIHC | 1 |
| p.L440F | CESC | 1 |
| p.S483F | SKCM | 1 |
| p.P637S | SKCM | 1 |
| p.L127M | SKCM | 1 |
| p.V308F | BLCA | 1 |
| p.R246* | PAAD | 1 |
| p.D669N | READ | 1 |
| p.R558H | PAAD | 1 |
| p.R241Q | BLCA | 1 |
| p.L343V | ESCA | 1 |
| p.S434L | SKCM | 1 |
| p.E265K | BLCA | 1 |
| p.P490L | SKCM | 1 |
| p.L29M | KIRP | 1 |
| p.E590V | UCEC | 1 |
| p.R678W | STAD | 1 |
| p.A263E | SARC | 1 |
| p.R386Q | SKCM | 1 |
| p.C251Y | UCEC | 1 |
| p.R580C | HNSC | 1 |
| p.R469S | CHOL | 1 |
| p.R580H | UCEC | 1 |
| p.G111E | HNSC | 1 |
| p.R558C | LUSC | 1 |
| p.R422X | READ | 1 |
| p.E540D | UCEC | 1 |
| p.E21Q | BLCA | 1 |
| p.E71Q | THCA | 1 |
| p.D492H | LUSC | 1 |
| p.E412K | SKCM | 1 |
| p.D594A | COAD | 1 |
| p.A651T | SKCM | 1 |
| p.R309* | BLCA | 1 |
| p.P68S | SKCM | 1 |
| p.N350H | SKCM | 1 |
| p.L23F | SKCM | 1 |
| p.R667K | LUSC | 1 |
| p.A216E | ESCA | 1 |
| p.V254M | BLCA | 1 |
| p.F312L | UCEC | 1 |
| p.K397N | READ | 1 |
| p.T379S | LUAD | 1 |
| p.R241G | HNSC | 1 |
| p.I413S | UCEC | 1 |
| p.E265* | UCEC | 1 |
| p.R147Q | UCEC | 1 |
| p.L224R | HNSC | 1 |
| p.E110X | READ | 1 |
| p.K357T | UCEC | 1 |
| p.G503R | SKCM | 1 |
| p.Y332N | LUAD | 1 |
| p.Q294E | BLCA | 1 |
| p.R462W | STAD | 1 |
| p.R422* | SKCM | 1 |
| p.K694N | UCEC | 1 |
| p.T76I | UCEC | 1 |
| p.S593L | BLCA | 1 |
| p.V249I | STAD | 1 |
| p.T256I | SKCM | 1 |
| p.T546N | LUAD | 1 |
| p.K322N | COAD | 1 |
| p.P68L | SKCM | 1 |
| p.R192* | SKCM | 1 |
| p.D544N | SKCM | 1 |
| p.E181K | SKCM | 1 |
| Top |
| TissGeneCNV for GYS2 |
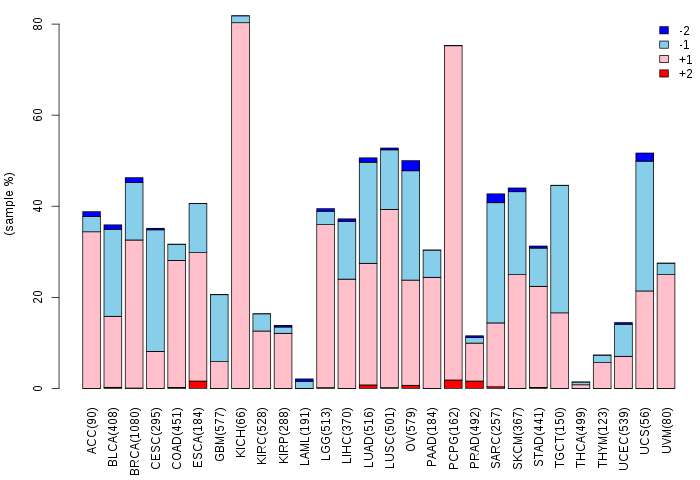
| Copy number variations of TissGene across 28 cancer types (X-axis: cancer type and Y-axis: % of CNV samples) (TCGA Gistic2_CopyNumber_Gistic2_all_data_by_genes, Gistic2 copy number data, version 2016-08-16) |
 |
| Top |
| TissGeneFusions for GYS2 |
| Fusion genes including TissGene (ChimerDB 3.0, 2016-12-01 and TCGA fusion Portal 2015-12-01) |
| Database | Src | Cancer type | Sample | Fusion gene | ORF | 5'-gene BP | 3'-gene BP |
| Chimerdb3.0 | ChiTaRs | NA | BG563177 | SAA3P-GYS2 | chr11:18270182 | chr12:21689697 | |
| TCGAfusionPortal | PRADA | LUAD | TCGA-95-8494-01A | C17orf63-GYS2 | 5UTR-CDS | Chr17:27139227 | Chr12:21721943 |
| TCGAfusionPortal | PRADA | LUAD | TCGA-97-7554-01A | EPS8-GYS2 | 5UTR-CDS | Chr12:15942095 | Chr12:21733457 |
| Top |
| TissGeneNet for GYS2 |
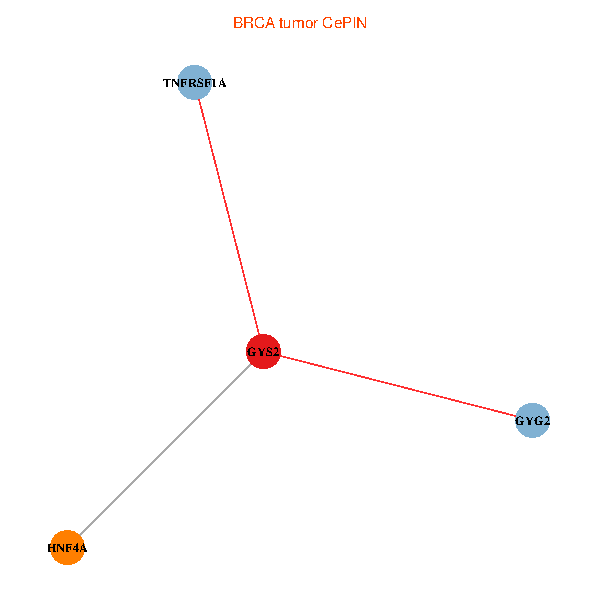
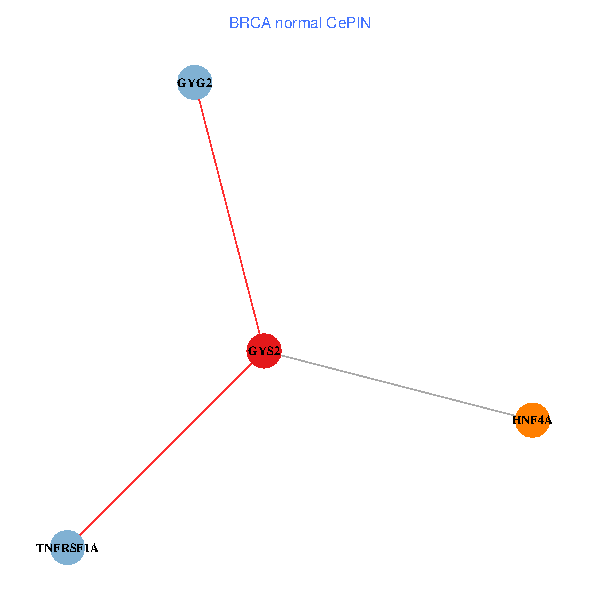
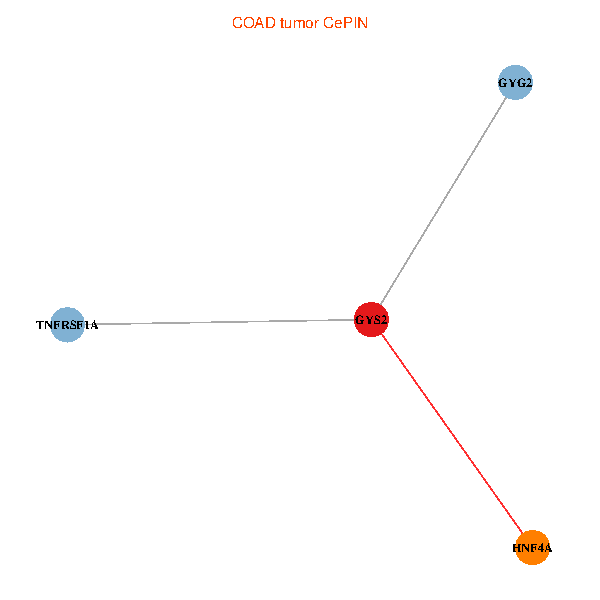
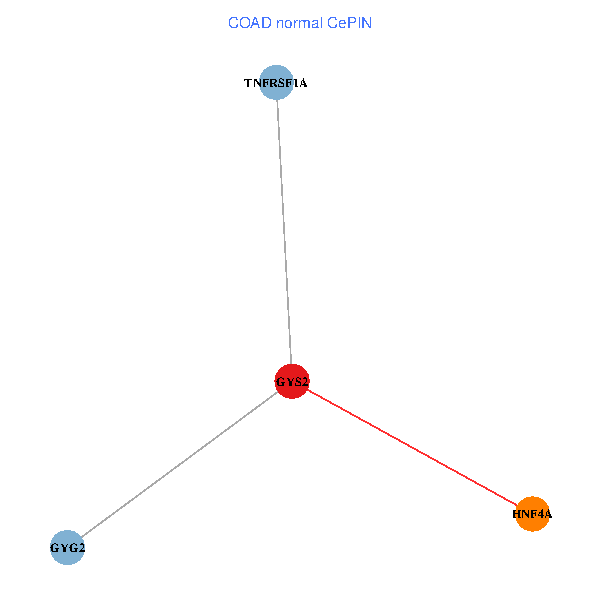
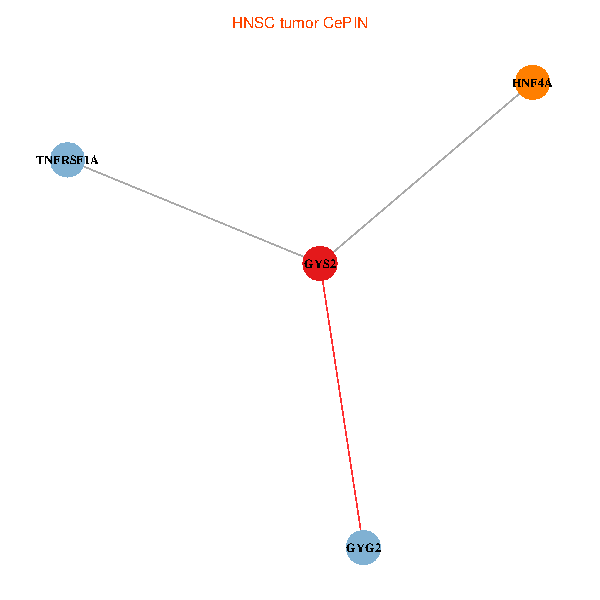
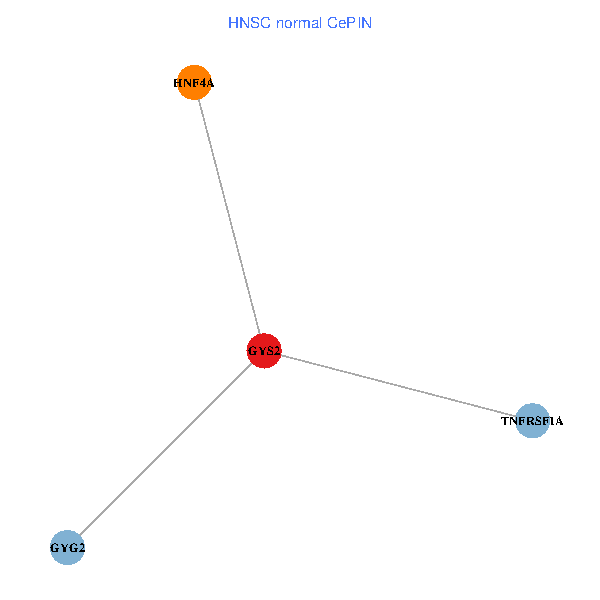
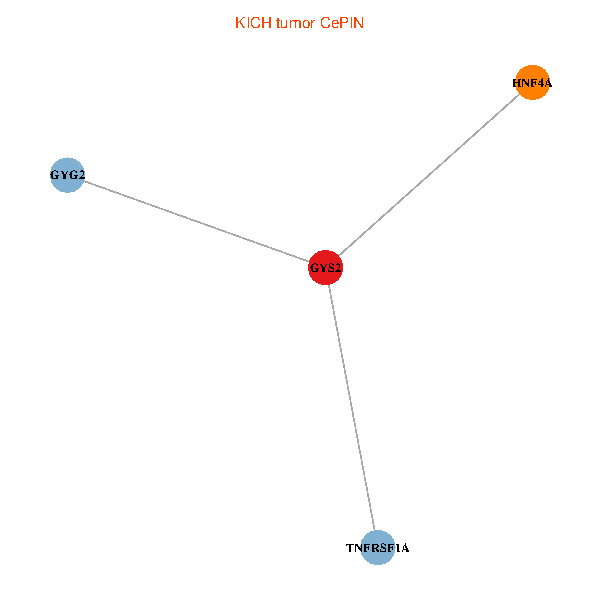
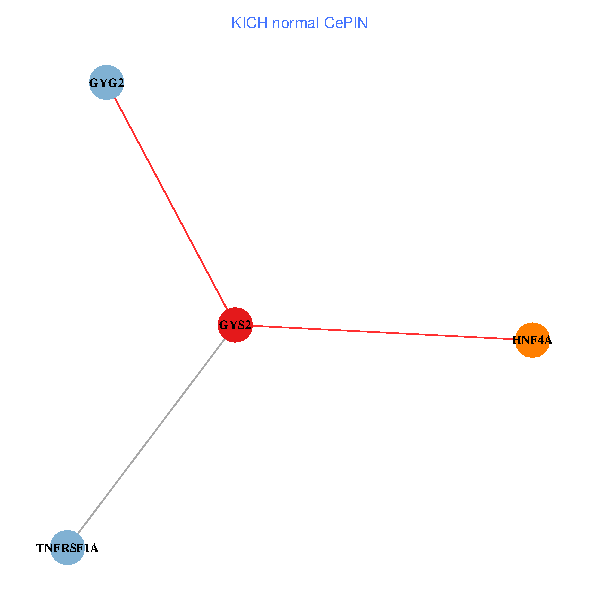
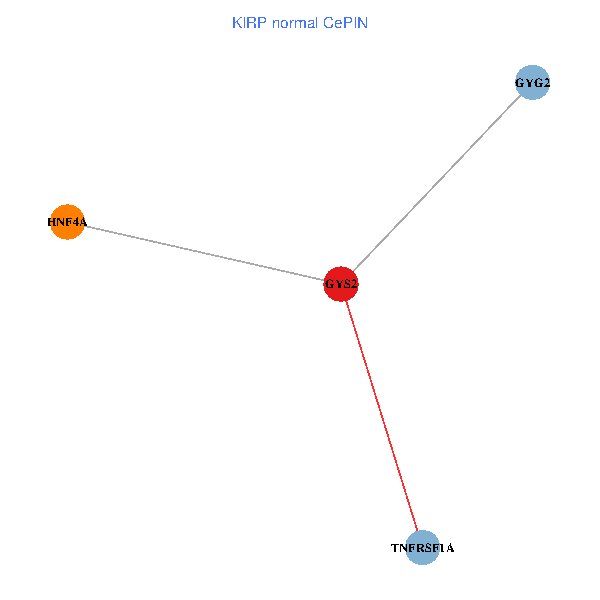
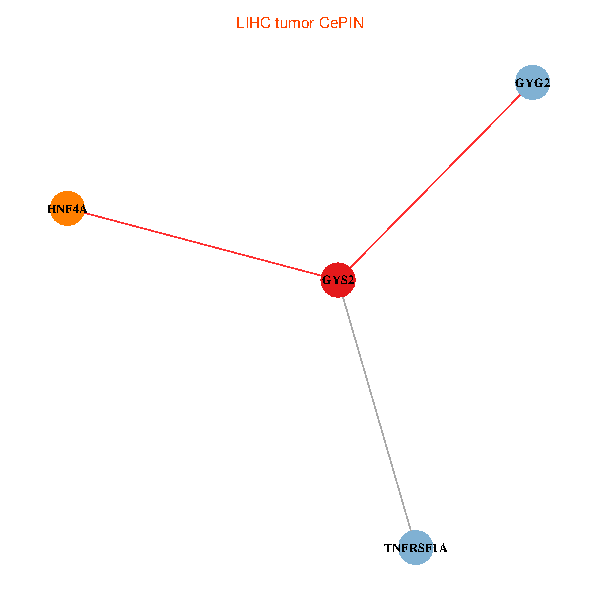
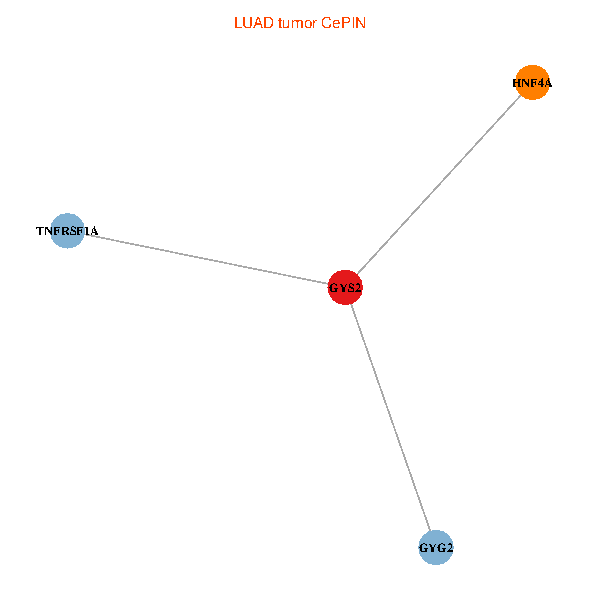
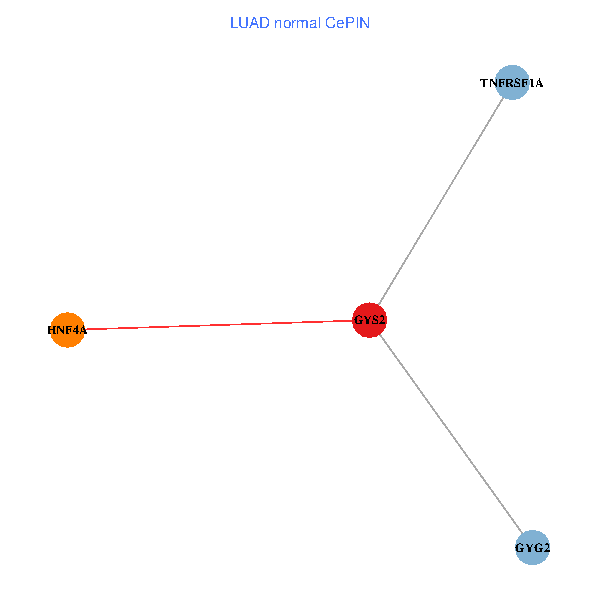
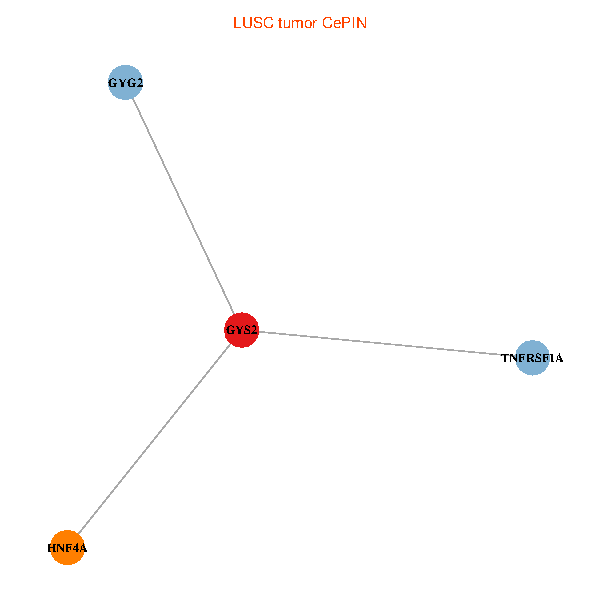
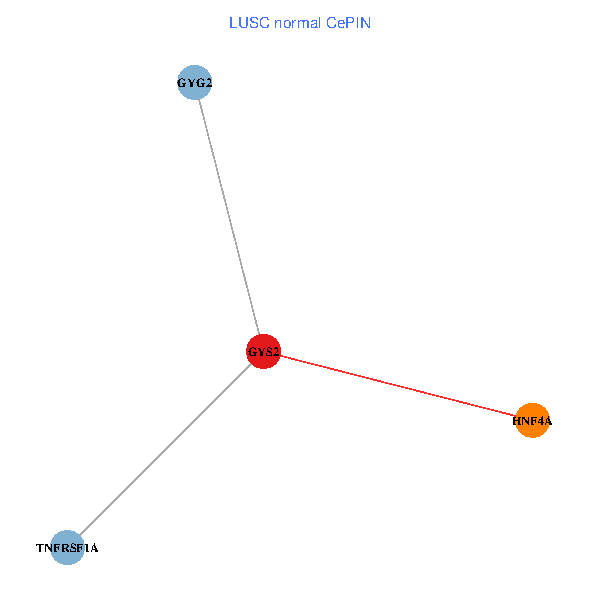
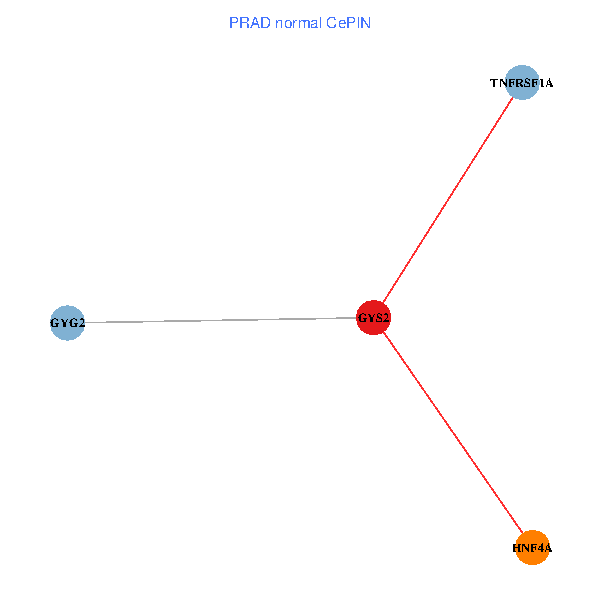
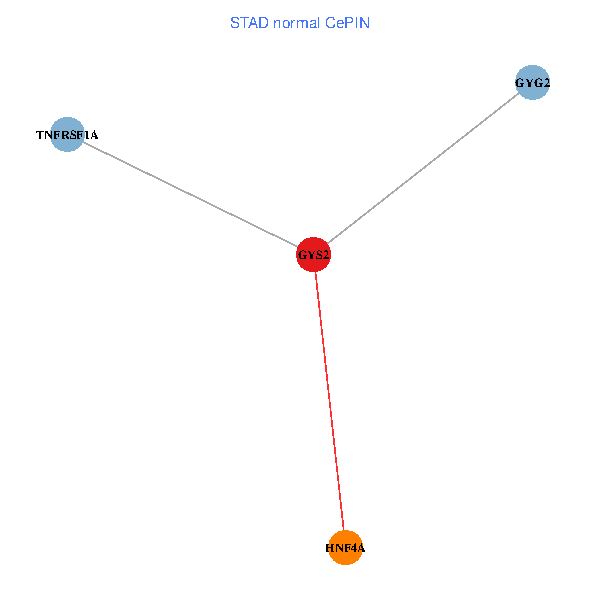
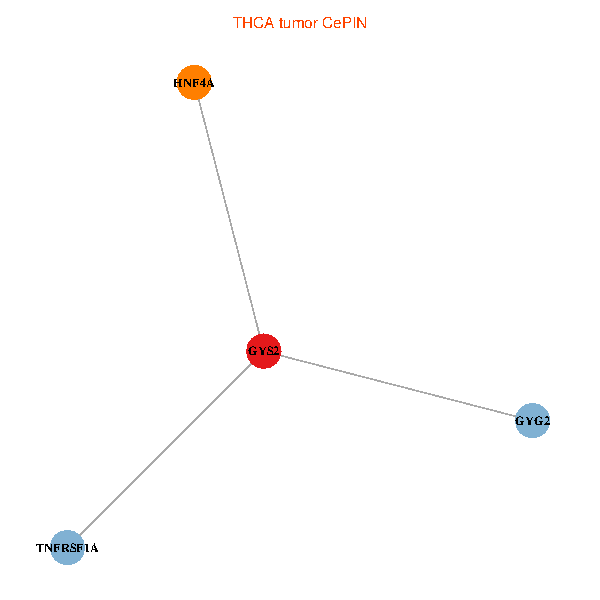
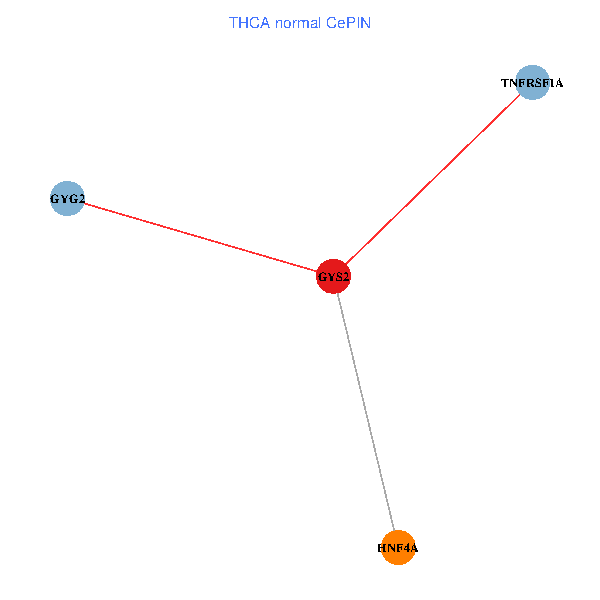
| Co-expressed gene networks based on protein-protein interaction data (CePIN) (TCGA IlluminaHiSeq_RNASeqV2, pan-cancer normalized log2(norm_counts+1) data, version 2016-08-16) (PINA2 ppi data) |
| BRCA (tumor) | BRCA (normal) |
| GYS2, HNF4A, TNFRSF1A, GYG2 (tumor) | GYS2, HNF4A, TNFRSF1A, GYG2 (normal) |
 |  |
| COAD (tumor) | COAD (normal) |
| GYS2, HNF4A, TNFRSF1A, GYG2 (tumor) | GYS2, HNF4A, TNFRSF1A, GYG2 (normal) |
 |  |
| HNSC (tumor) | HNSC (normal) |
| GYS2, HNF4A, TNFRSF1A, GYG2 (tumor) | GYS2, HNF4A, TNFRSF1A, GYG2 (normal) |
 |  |
| KICH (tumor) | KICH (normal) |
| GYS2, HNF4A, TNFRSF1A, GYG2 (tumor) | GYS2, HNF4A, TNFRSF1A, GYG2 (normal) |
 |  |
| KIRC (tumor) | KIRC (normal) |
| GYS2, HNF4A, TNFRSF1A, GYG2 (tumor) | GYS2, HNF4A, TNFRSF1A, GYG2 (normal) |
 |  |
| KIRP (tumor) | KIRP (normal) |
| GYS2, HNF4A, TNFRSF1A, GYG2 (tumor) | GYS2, HNF4A, TNFRSF1A, GYG2 (normal) |
 |  |
| LIHC (tumor) | LIHC (normal) |
| GYS2, HNF4A, TNFRSF1A, GYG2 (tumor) | GYS2, HNF4A, TNFRSF1A, GYG2 (normal) |
 |  |
| LUAD (tumor) | LUAD (normal) |
| GYS2, HNF4A, TNFRSF1A, GYG2 (tumor) | GYS2, HNF4A, TNFRSF1A, GYG2 (normal) |
 |  |
| LUSC (tumor) | LUSC (normal) |
| GYS2, HNF4A, TNFRSF1A, GYG2 (tumor) | GYS2, HNF4A, TNFRSF1A, GYG2 (normal) |
 |  |
| PRAD (tumor) | PRAD (normal) |
| GYS2, HNF4A, TNFRSF1A, GYG2 (tumor) | GYS2, HNF4A, TNFRSF1A, GYG2 (normal) |
 |  |
| STAD (tumor) | STAD (normal) |
| GYS2, HNF4A, TNFRSF1A, GYG2 (tumor) | GYS2, HNF4A, TNFRSF1A, GYG2 (normal) |
 |  |
| THCA (tumor) | THCA (normal) |
| GYS2, HNF4A, TNFRSF1A, GYG2 (tumor) | GYS2, HNF4A, TNFRSF1A, GYG2 (normal) |
 |  |
| Top |
| TissGeneProg for GYS2 |
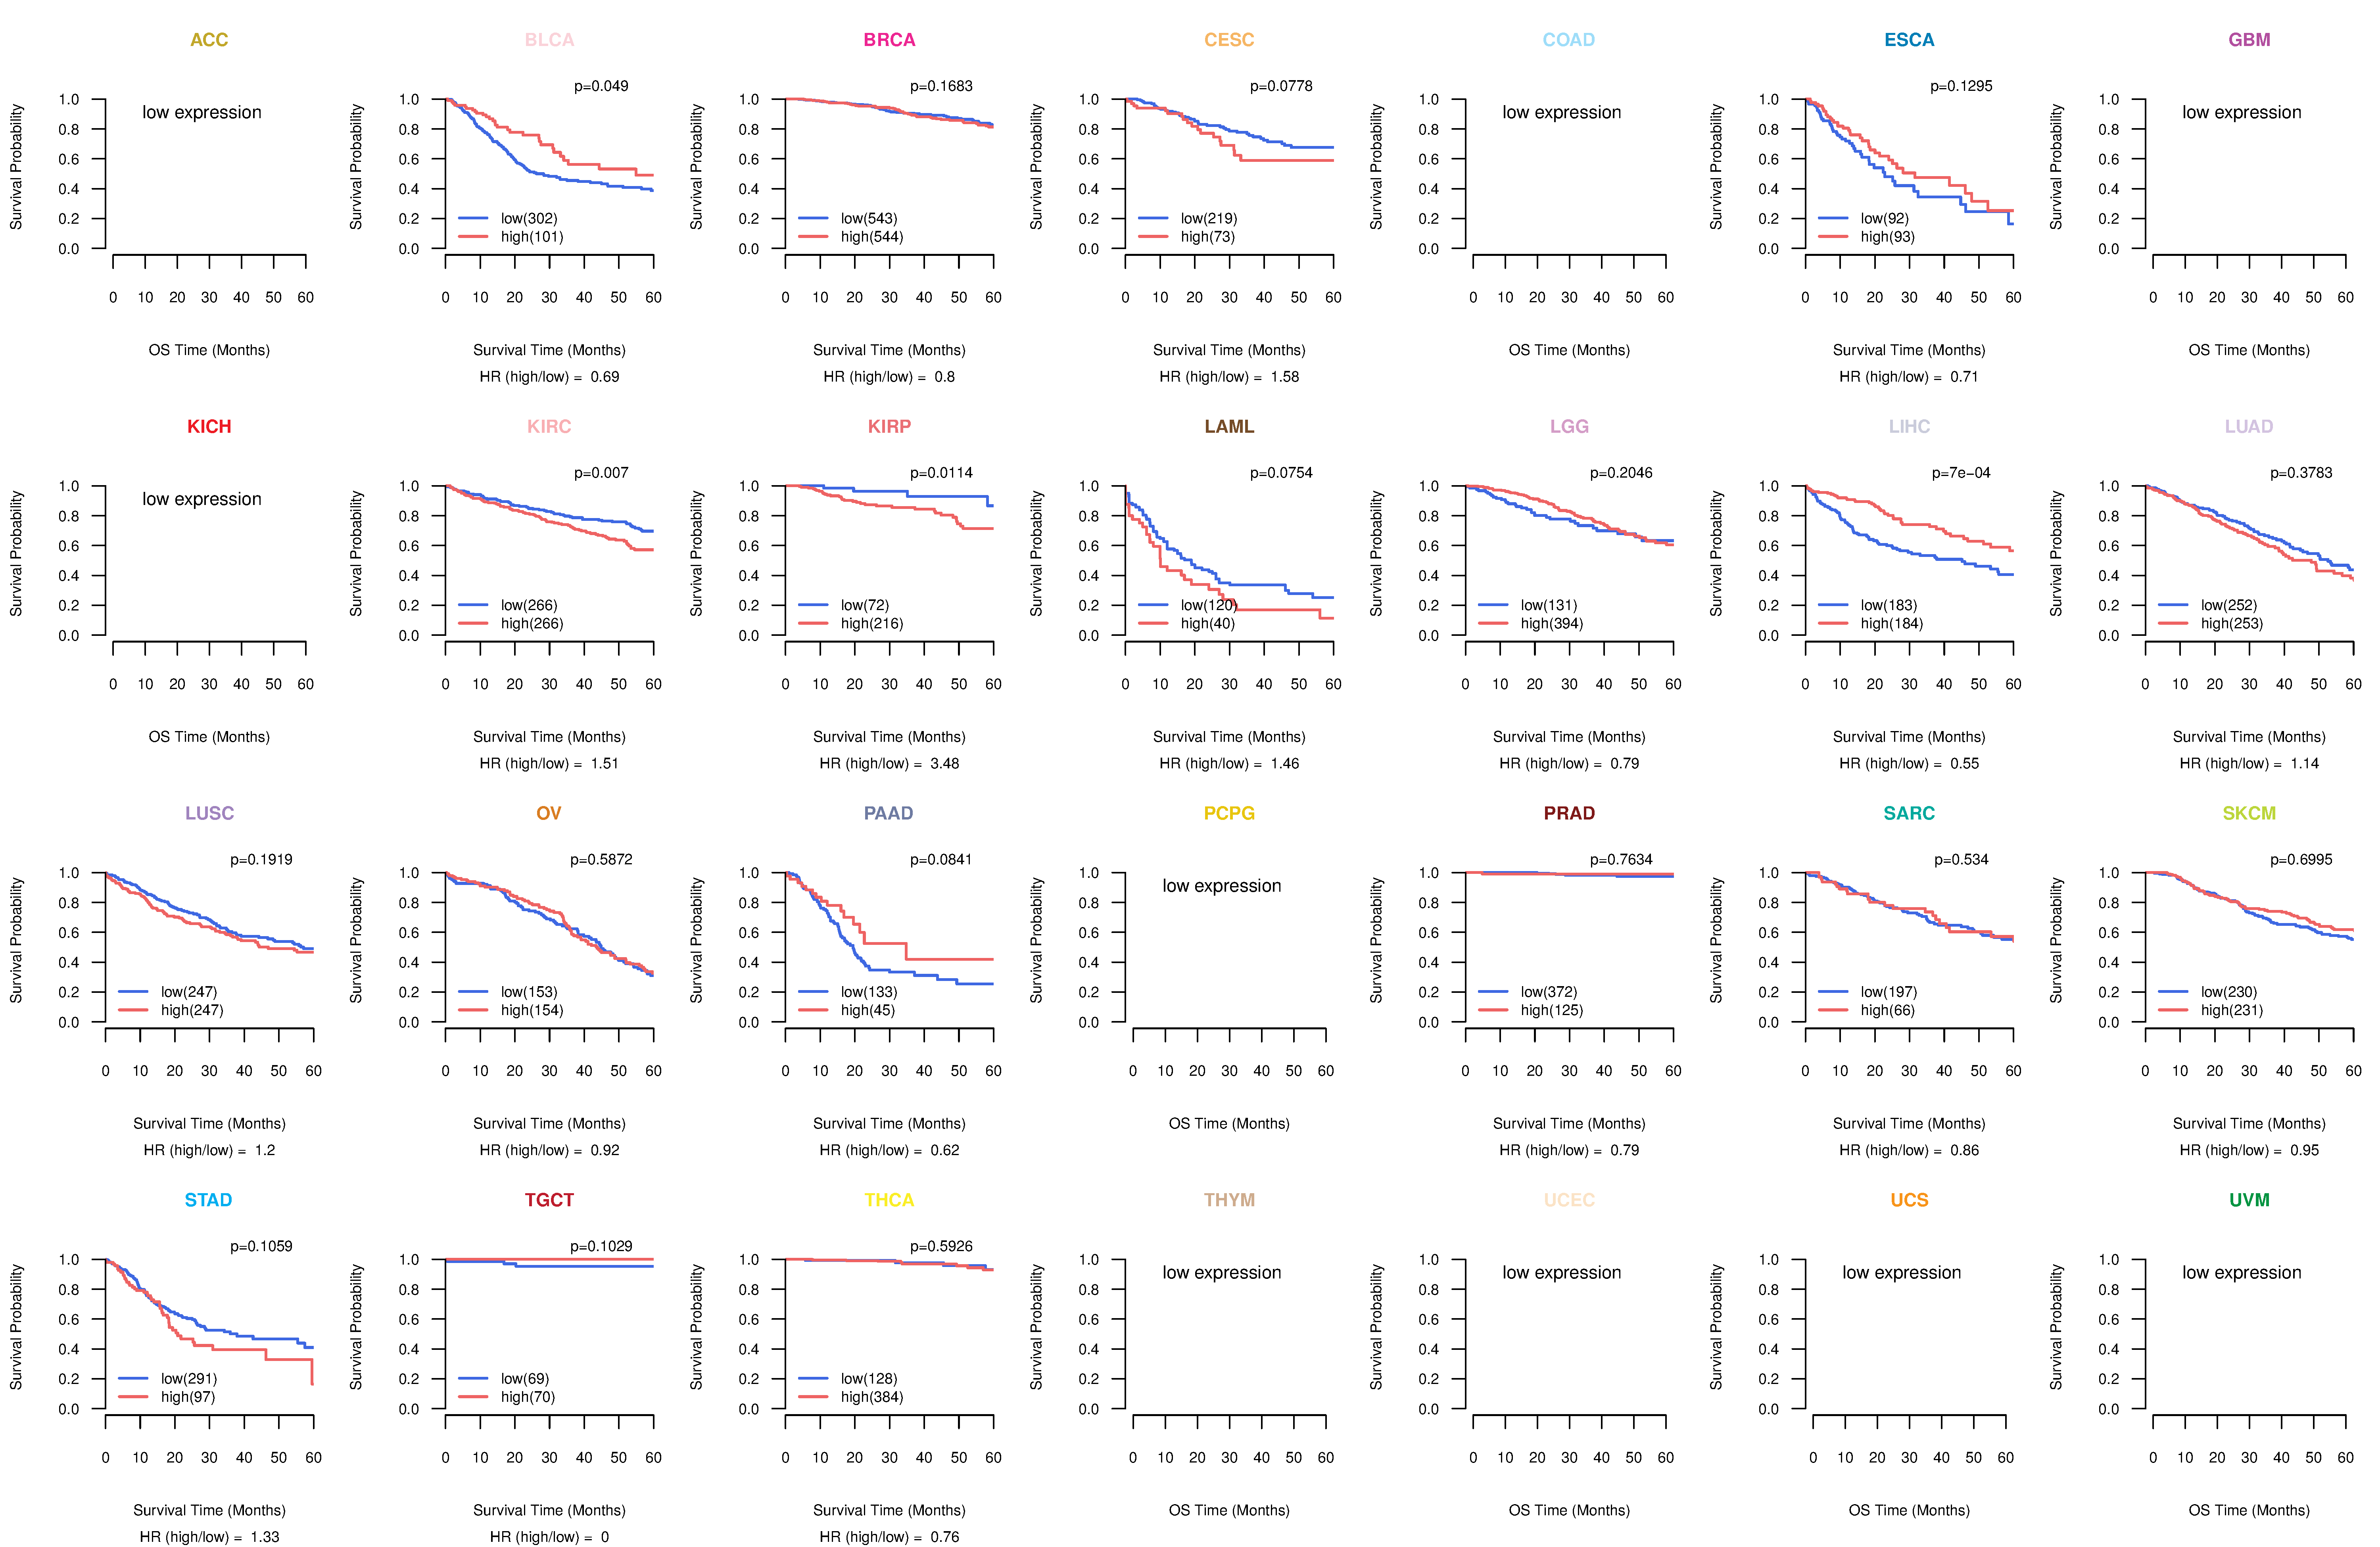
| Kaplan-Meier plots with logrank tests of overall survival (OS) using 28 cancer types (TCGA IlluminaHiSeq_RNASeqV2, pan-cancer normalized log2(norm_counts+1) data, version 2016-08-16) (TCGA clinicalMatrix, phenotype data, version 2016-04-27) * Click on the image to enlarge it in a new window. |
 |
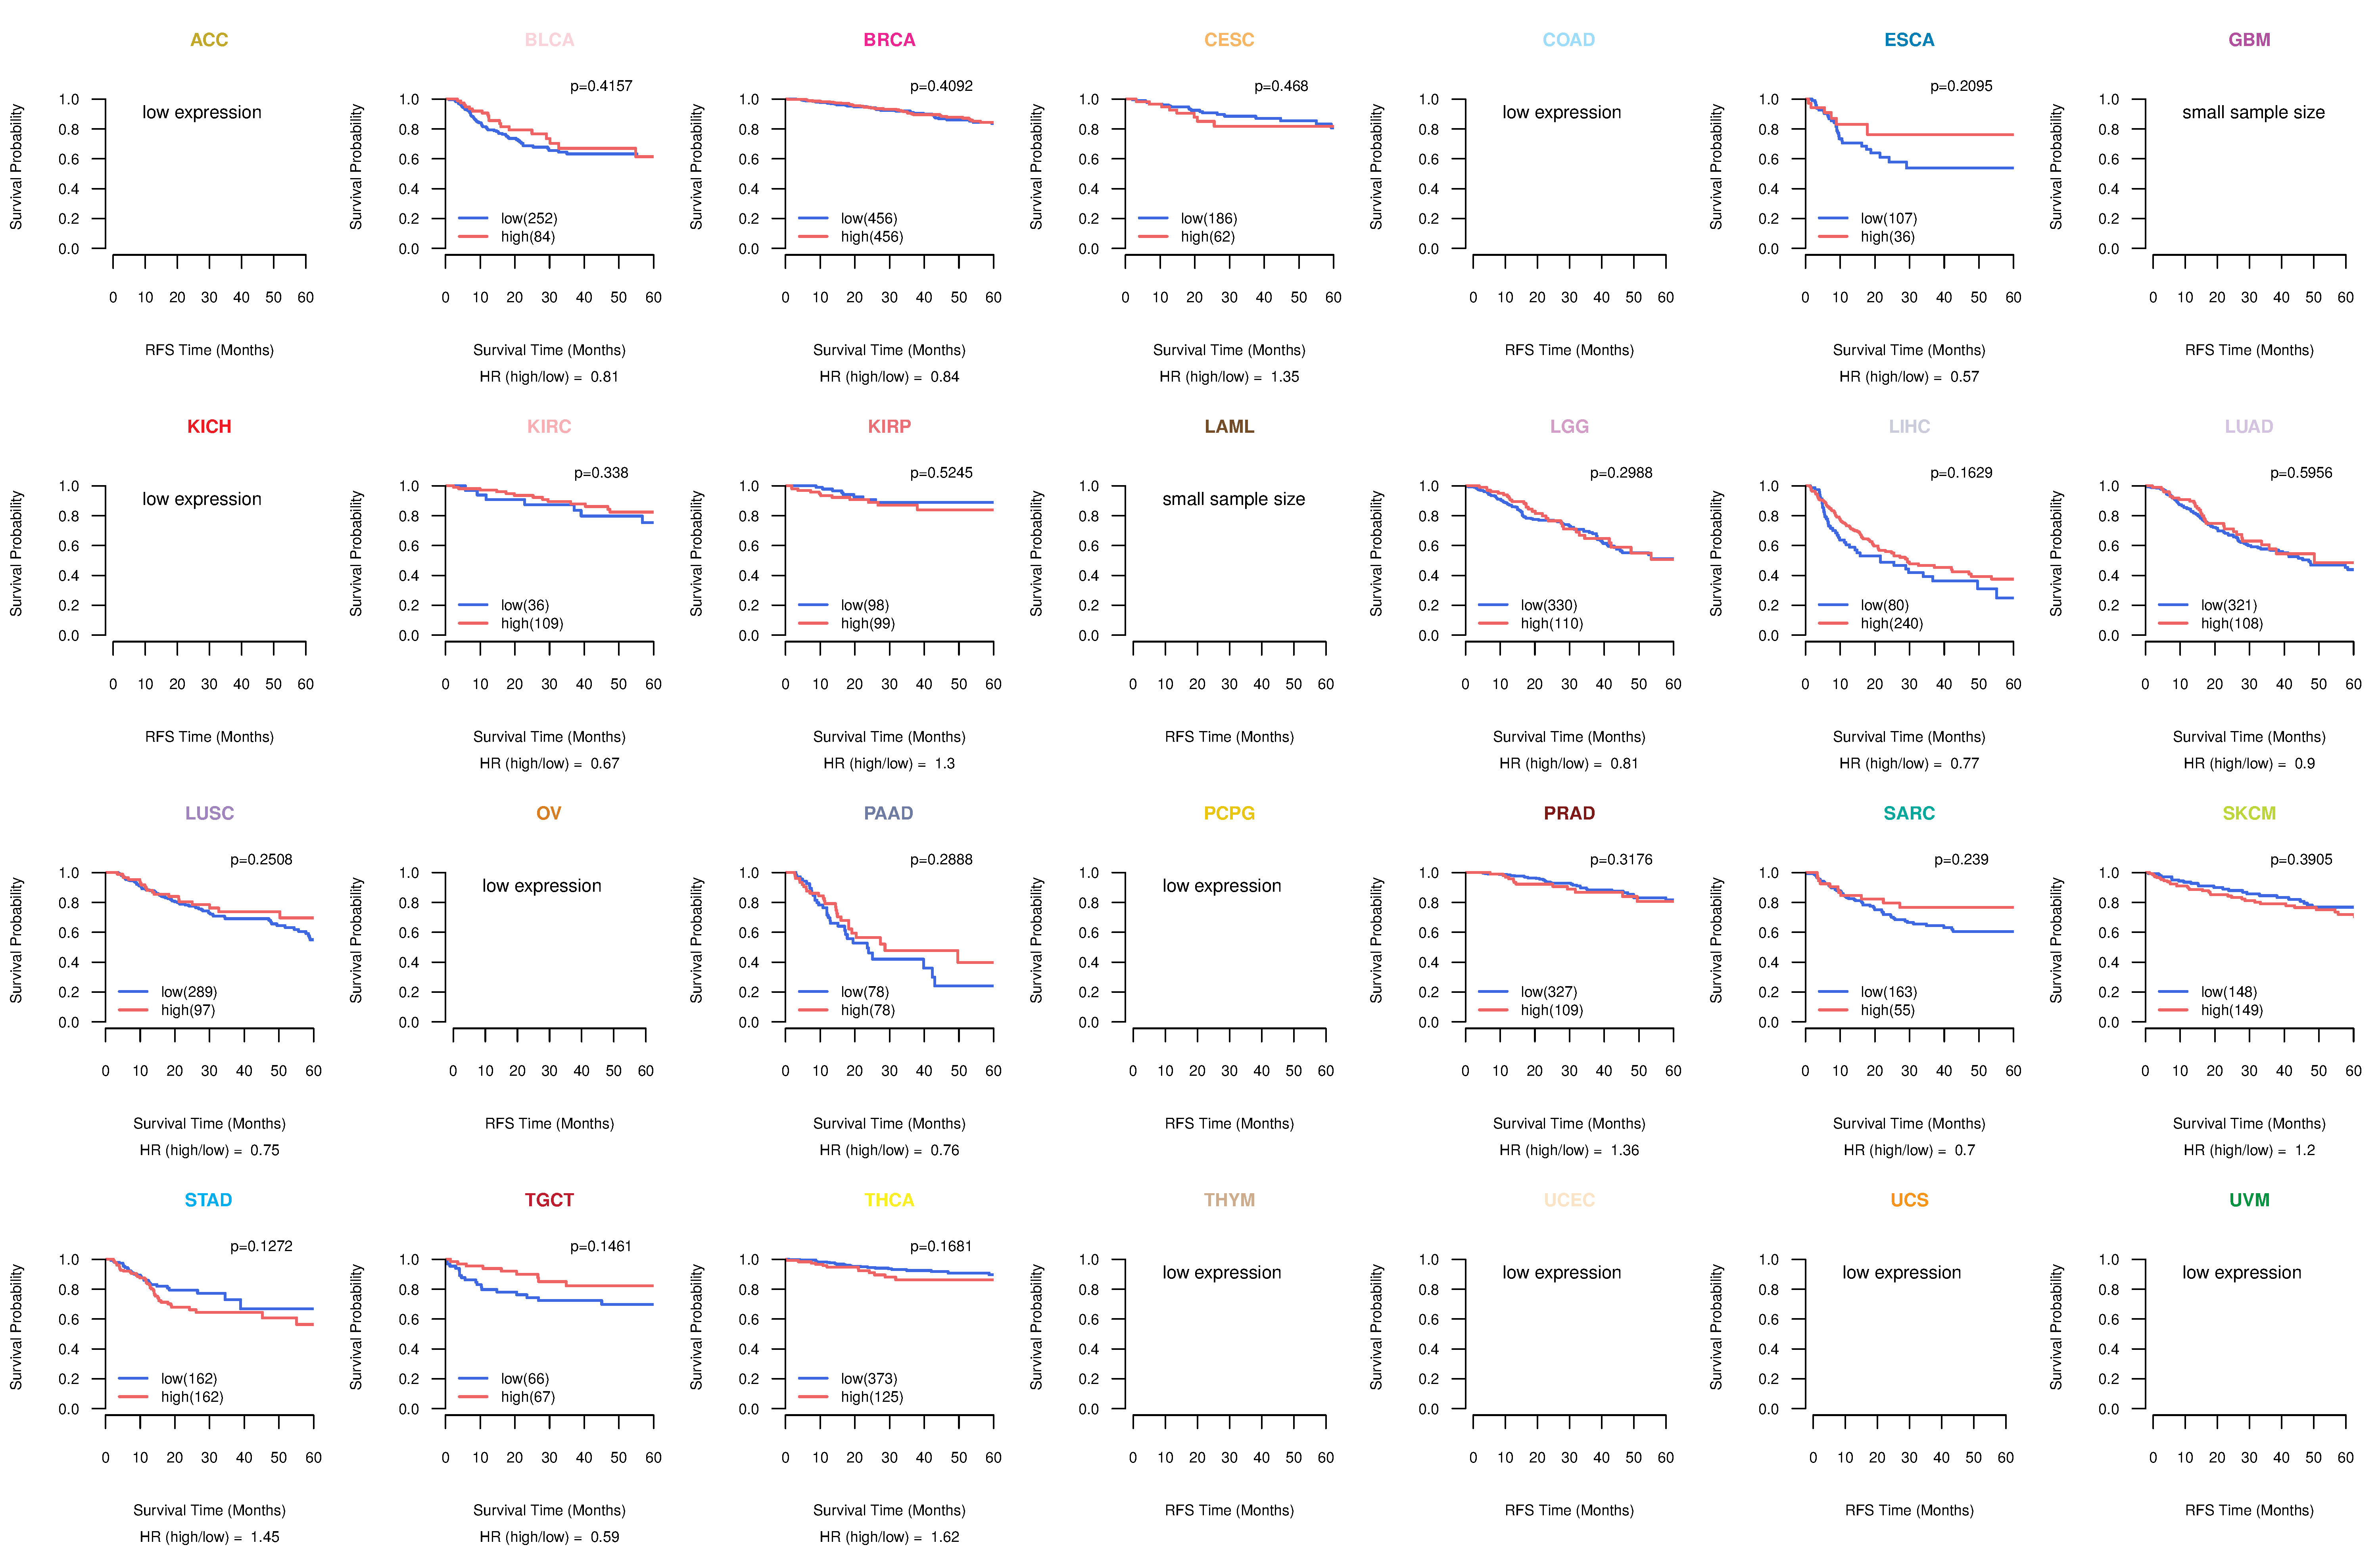
| Kaplan-Meier plots with logrank test of relapse free survival (RFS) using 28 cancer types (TCGA IlluminaHiSeq_RNASeqV2, pan-cancer normalized log2(norm_counts+1) data, version 2016-08-16) (TCGA clinicalMatrix, phenotype data, version 2016-04-27) * Click on the image enlarge it in a new window. |
 |
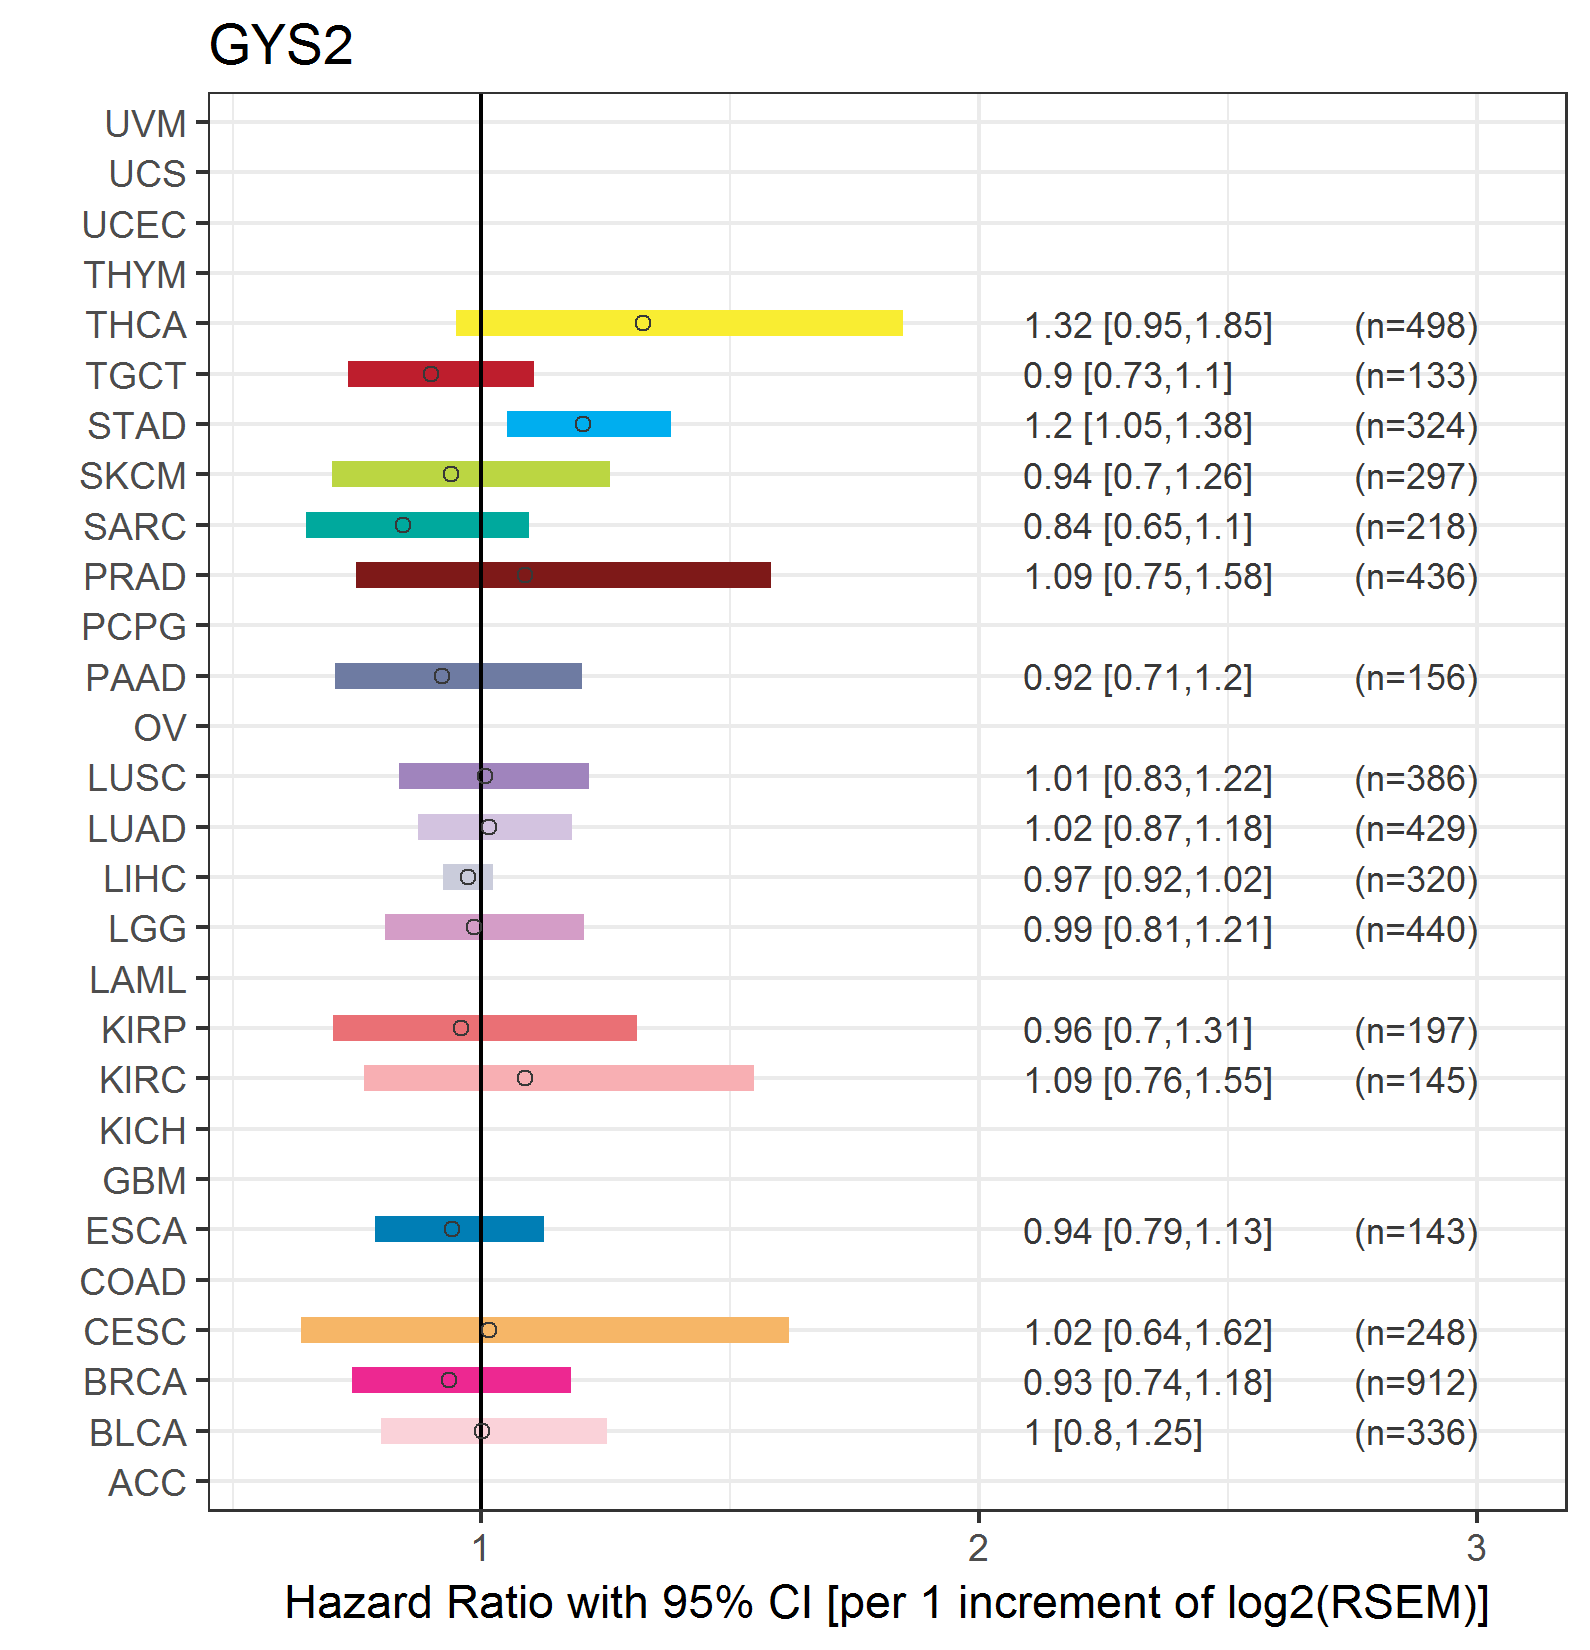
| Forest plot of Cox proportional hazard ratio (HR) and 95% CI of overall survival (OS) using 28 cancer types (TCGA IlluminaHiSeq_RNASeqV2, pan-cancer normalized log2(norm_counts+1) data, version 2016-08-16) (TCGA clinicalMatrix, phenotype data, version 2016-04-27) * Click on the image enlarge it in a new window. |
 |
| Forest plot of Cox proportional hazard ratio (HR) and 95% CI of relapse free survival (RFS) using 28 cancer types (TCGA IlluminaHiSeq_RNASeqV2, pan-cancer normalized log2(norm_counts+1) data, version 2016-08-16) (TCGA clinicalMatrix, phenotype data, version 2016-04-27) * Click on the image enlarge it in a new window. |
 |
| Top |
| TissGeneClin for GYS2 |
| TissGeneDrug for GYS2 |
| Drug information targeting TissGene (DrugBank Version 5.0.6, 2017-04-01) |
| DrugBank ID | Drug name | Drug activity | Drug type | Drug status |
| Top |
| TissGeneDisease for GYS2 |
| Disease information associated with TissGene (DisGeNet, 2016-06-01) |
| Disease ID | Disease name | # pubmeds | Source |
| umls:C0342748 | Glycogen synthase deficiency | 2 | BeFree |
| umls:C1855861 | Glycogen Storage Disease 0, Liver | 2 | BeFree,CLINVAR,CTD_human,MGD,ORPHANET,UNIPROT |
| umls:C0011860 | Diabetes Mellitus, Non-Insulin-Dependent | 1 | GAD |
| umls:C0023895 | Liver diseases | 1 | GAD |
| umls:C0028754 | Obesity | 1 | BeFree |
| umls:C0029928 | Ovarian Diseases | 1 | BeFree |
| umls:C0032460 | Polycystic Ovary Syndrome | 1 | BeFree |
| umls:C0036341 | Schizophrenia | 1 | GAD |
| umls:C0040336 | Tobacco Use Disorder | 1 | GAD |
| umls:C0085207 | Gestational Diabetes | 1 | BeFree |
| umls:C2362324 | Pediatric Obesity | 1 | BeFree |
|
Copyright 2016-Present - The University of Texas Health Science Center at Houston (UTHealth) Web File Viewing | How to Report, Fraud, Waste and Abuse | State of Texas | Statewide Search | Texas Homeland Security | Site Policies |