 |
| |
| |
| |
| |
| |
| |
|

| TissGeneSummary for MNX1 |
 Gene summary Gene summary |
| Basic gene information | Gene symbol | MNX1 |
| Gene name | motor neuron and pancreas homeobox 1 | |
| Synonyms | HB9|HLXB9|HOXHB9|SCRA1 | |
| Cytomap | UCSC genome browser: 7q36 | |
| Type of gene | protein-coding | |
| RefGenes | NM_001165255.1, NM_005515.3, | |
| Description | homeobox HB9homeobox protein HB9motor neuron and pancreas homeobox protein 1 | |
| Modification date | 20141207 | |
| dbXrefs | MIM : 142994 | |
| HGNC : HGNC | ||
| Ensembl : ENSG00000130675 | ||
| HPRD : 00874 | ||
| Vega : OTTHUMG00000157181 | ||
| Protein | UniProt: go to UniProt's Cross Reference DB Table | |
| Expression | CleanEX: HS_MNX1 | |
| BioGPS: 3110 | ||
| Pathway | NCI Pathway Interaction Database: MNX1 | |
| KEGG: MNX1 | ||
| REACTOME: MNX1 | ||
| Pathway Commons: MNX1 | ||
| Context | iHOP: MNX1 | |
| ligand binding site mutation search in PubMed: MNX1 | ||
| UCL Cancer Institute: MNX1 | ||
| Assigned class in TissGDB* | C | |
| Included tissue-specific gene expression resources | TiGER,GTEx | |
| Specific-tissues in normal samples (assigned by TissGDB using HPA, TiGER, and GTEx) | ColonPancreas | |
| Cancer types related to the specific-tissues in cancer samples (assigned by TissGDB using TCGA) | COADPAAD | |
| Reference showing the relevant tissue of MNX1 | ||
| Description by TissGene annotations | Cancer gene Have significant anti-correlated miRNA | |
| * Class A consists of genes with literature evidence and is part of the cTissGenes. Class B consists of only cTissGenes without additional evidence. The remaining genes belong to Class C. |
| Gene ontology having evidence of Inferred from Direct Assay (IDA) from Entrez |
| GO ID | GO term | PubMed ID |
| Top |
| TissGeneExp for MNX1 |
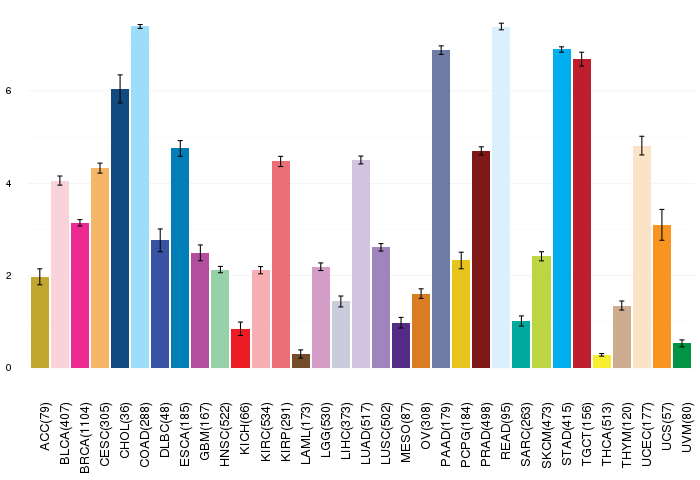
| Gene expressions across 28 cancer types (X-axis: cancer type and Y-axis: log2(norm_counts+1)) (TCGA IlluminaHiSeq_RNASeqV2, pan-cancer normalized log2(norm_counts+1) data, version 2016-08-16) |
 |
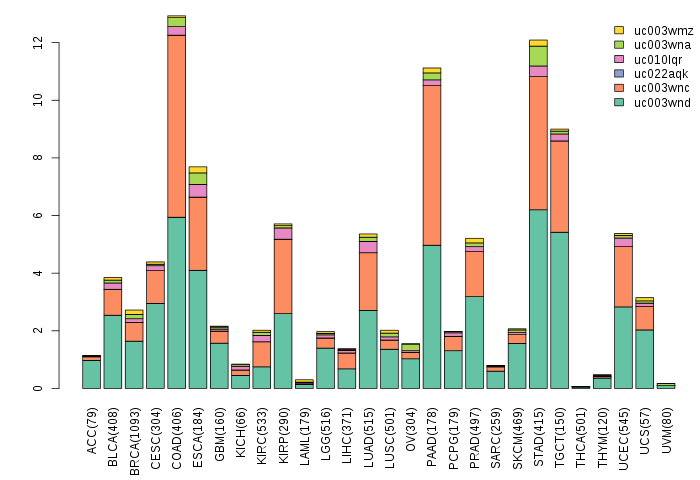
| Gene isoform expressions across 28 cancer types (X-axis: cancer type and Y-axis: log2(norm_counts+1)) (TCGA pan-cancer tcga_rsem_isoform_tpm, version 2016-09-01) |
 |
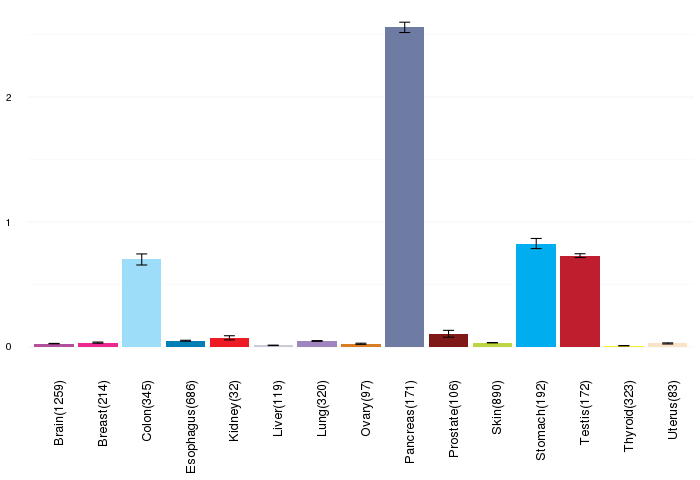
| Gene expressions across normal tissues of GTEx data (GTEx GTEx_Analysis_v6_RNA-seq_RNA-SeQCv1.1.8_gene_rpkm.gct) - Here, we shows the matched tissue types only among our 28 cancer types. |
 |
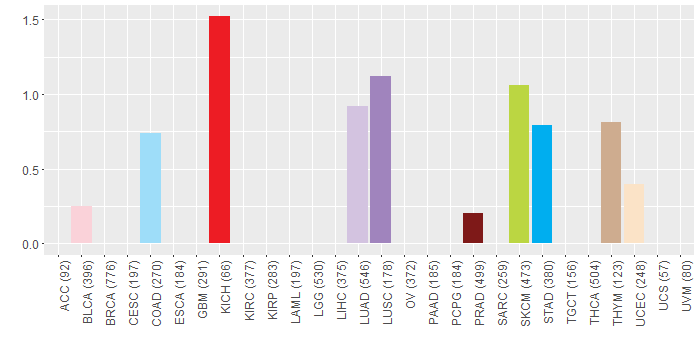
| Different expressions across 14 cancer types with more than 10 samples between matched tumors and normals (X-axis: cancer type and Y-axis: log2(norm_counts+1)) (TCGA IlluminaHiSeq_RNASeqV2, pan-cancer normalized log2(norm_counts+1) data, version 2016-08-16) |
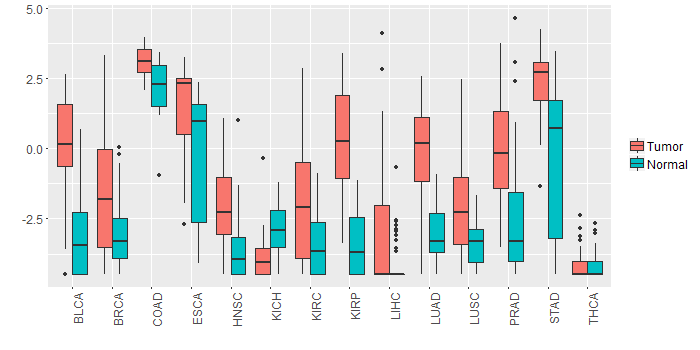 |
| - Significantly differentially expressed cancer types and information. (|Fold change|>1 and FDR<0.05) |
| Cancer type | Mean(exp) in tumor | Mean(exp) in matched normal | Log2FC | P-val. | FDR |
| STAD | 2.348880802 | -0.317172323 | 2.666053125 | 7.63E-06 | 9.23E-05 |
| HNSC | -2.062651901 | -3.58330539 | 1.520653488 | 9.99E-07 | 7.59E-06 |
| KIRC | -2.032426837 | -3.439483781 | 1.407056944 | 2.59E-07 | 6.97E-07 |
| LUAD | -0.153491396 | -3.162132775 | 3.008641379 | 2.52E-20 | 5.49E-19 |
| KIRP | 0.335458927 | -3.374394198 | 3.709853125 | 2.64E-13 | 4.74E-12 |
| PRAD | -0.103311025 | -2.505403332 | 2.402092308 | 2.06E-08 | 2.34E-07 |
| LUSC | -2.077175203 | -3.376483046 | 1.299307843 | 6.87E-06 | 1.59E-05 |
| BRCA | -1.671031807 | -3.019984439 | 1.348952632 | 3.37E-09 | 1.16E-08 |
| BLCA | -0.088748474 | -3.176916895 | 3.088168421 | 6.68E-06 | 0.000142849 |
| Top |
| TissGene-miRNA for MNX1 |
| Significantly anti-correlated miRNAs of TissGene across 28 cancer types (Gene-miRNA relations from TargetScanHuman Relsease 7.1, Conserved_Site_Context_Scores.txt.zip, 06.01.2016) (TCGA IlluminaHiSeq_miRNASeq, log2(RPM+1) data, version 2016-11-21) (TCGA IlluminaHiSeq_RNASeqV2, log2(normalized_count+1) data, version 2016-08-16) (Spearman’s Rank Correlation (p-value<0.05 and coefficient<-0.25)) |
| Cancer type | miRNA id | miRNA accession | P-val. | Coeff. | # samples |
| ACC | hsa-miR-381-3p | MIMAT0000736 | 0.0073 | -0.3 | 78 |
| ACC | hsa-miR-381-3p | MIMAT0000736 | 0.0073 | -0.3 | 78 |
| LUAD | hsa-miR-410-3p | MIMAT0002171 | 0.0043 | -0.37 | 60 |
| LUAD | hsa-miR-381-3p | MIMAT0000736 | 0.0021 | -0.39 | 60 |
| Top |
| TissGeneMut for MNX1 |
| TissGeneSNV for MNX1 |
| nsSNV counts per each loci. Different colors of circles represent different cancer types. Circle size denotes number of samples. (TCGA somatic mutation (SNPs and small INDELs) data, version 2016-04-25) * Click on the image to enlarge it in a new window. |
 |
 |
| Somatic nucleotide variants of TissGene across 28 cancer types (X-axis: cancer type and Y-axis: % of mutated samples) The numbers in parentheses are numbers of samples with mutation (nsSNVs). (TCGA somatic mutation (SNPs and small INDELs) data, version 2016-04-25) |
 |
| - nsSNVs sorted by frequency. |
| AAchange | Cancer type | # samples |
| p.G373C | LUAD | 1 |
| p.Q313H | BLCA | 1 |
| p.L28P | STAD | 1 |
| p.C383R | SKCM | 1 |
| p.D228N | DLBC | 1 |
| p.G329E | LUSC | 1 |
| p.Q284E | LUAD | 1 |
| p.S344G | STAD | 1 |
| p.E362K | SKCM | 1 |
| p.E357K | STAD | 1 |
| p.E304G | LUSC | 1 |
| p.P200L | SKCM | 1 |
| p.A307V | PRAD | 1 |
| p.A310V | LUAD | 1 |
| p.S25N | LUAD | 1 |
| p.R56W | KICH | 1 |
| p.S142N | COAD | 1 |
| p.R245C | UCEC | 1 |
| p.G2E | MESO | 1 |
| p.R346C | SKCM | 1 |
| p.R245H | THYM | 1 |
| p.Q24H | HNSC | 1 |
| p.R293W | LUAD | 1 |
| p.I222N | COAD | 1 |
| p.E273* | SKCM | 1 |
| Top |
| TissGeneCNV for MNX1 |
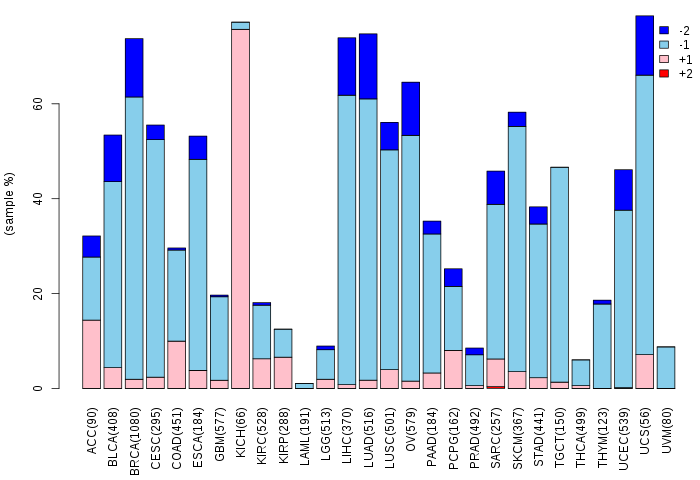
| Copy number variations of TissGene across 28 cancer types (X-axis: cancer type and Y-axis: % of CNV samples) (TCGA Gistic2_CopyNumber_Gistic2_all_data_by_genes, Gistic2 copy number data, version 2016-08-16) |
 |
| Top |
| TissGeneFusions for MNX1 |
| Fusion genes including TissGene (ChimerDB 3.0, 2016-12-01 and TCGA fusion Portal 2015-12-01) |
| Database | Src | Cancer type | Sample | Fusion gene | ORF | 5'-gene BP | 3'-gene BP |
| Top |
| TissGeneNet for MNX1 |
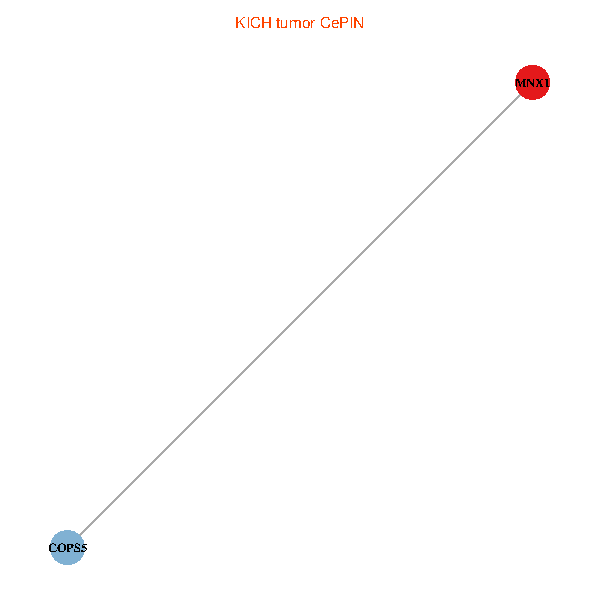
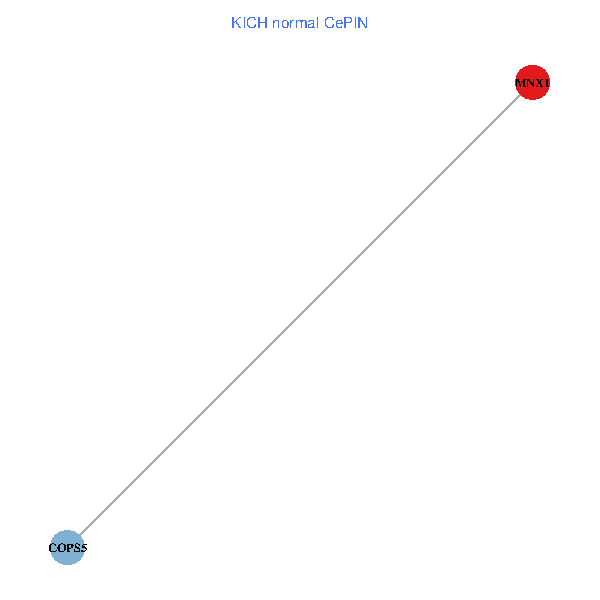
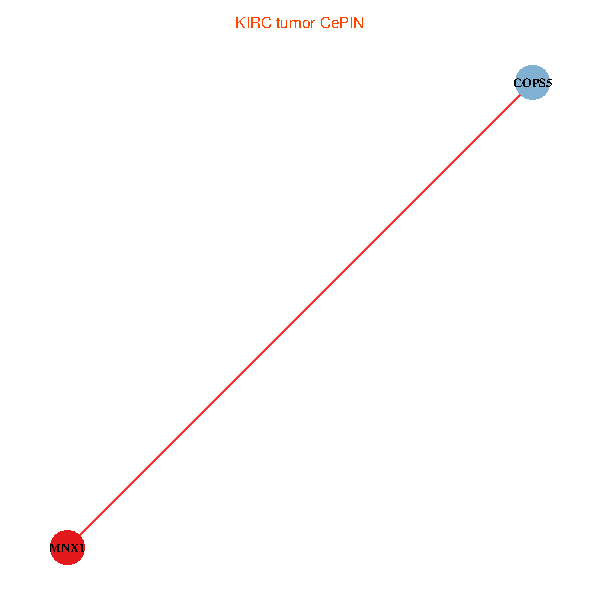
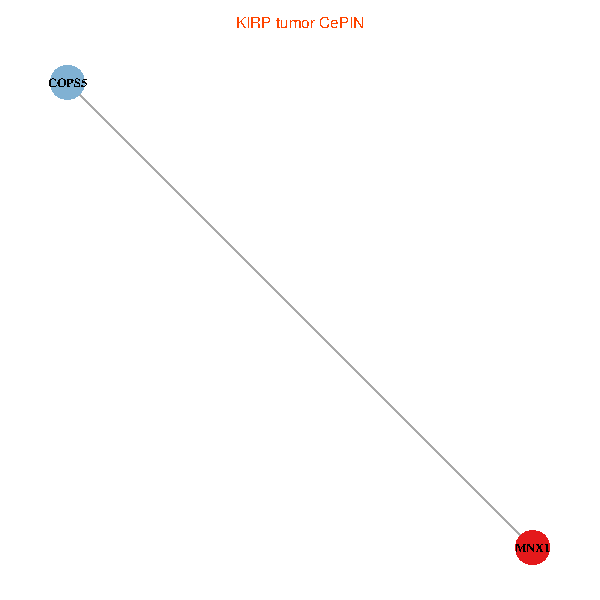
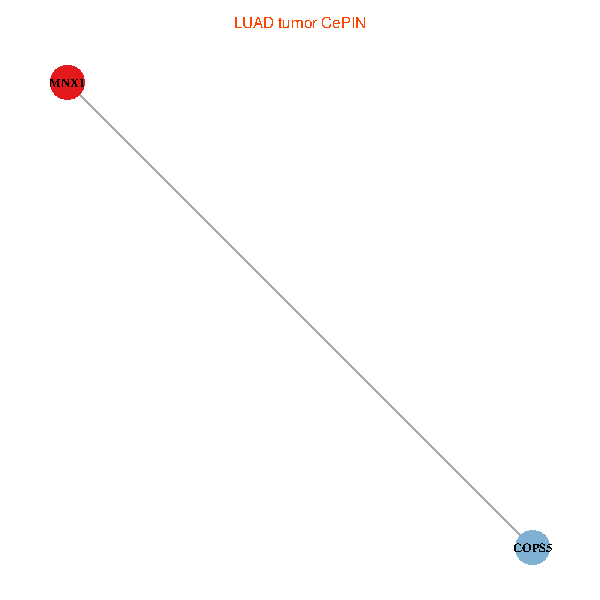
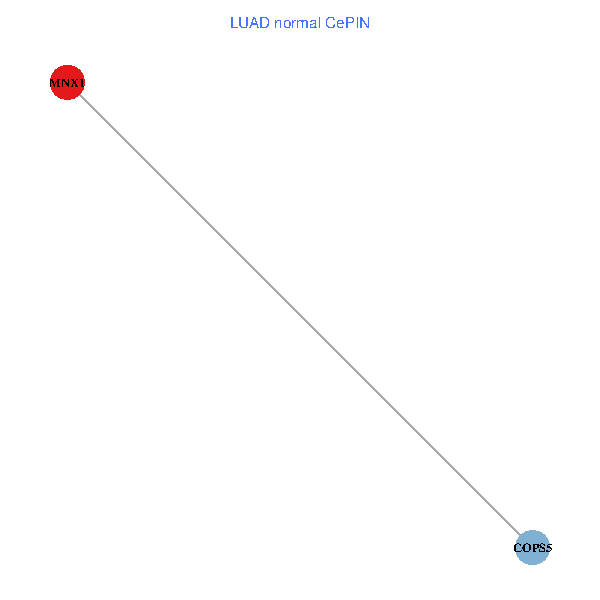
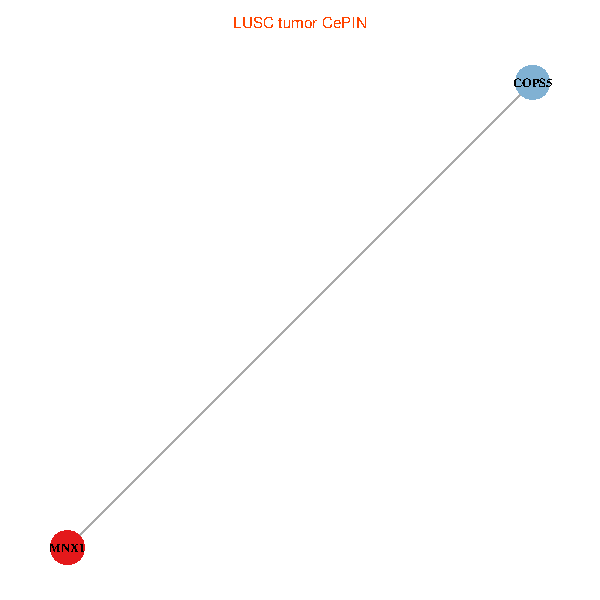
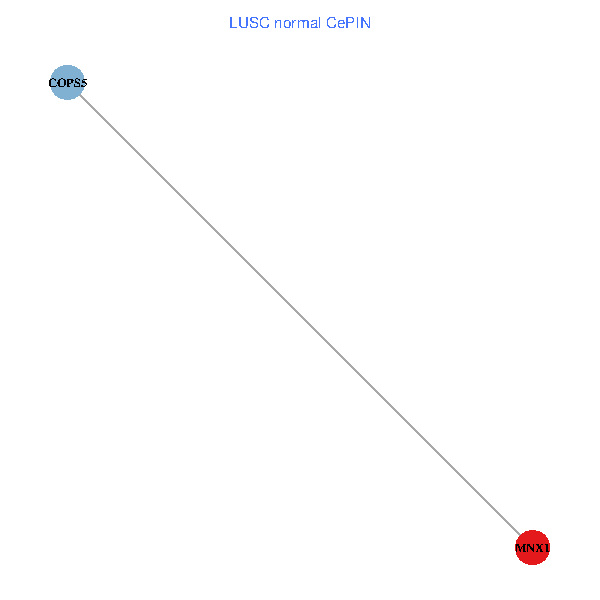
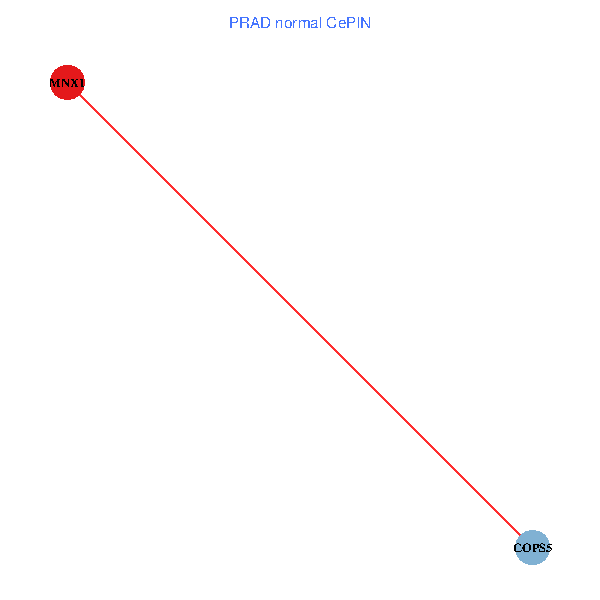
| Co-expressed gene networks based on protein-protein interaction data (CePIN) (TCGA IlluminaHiSeq_RNASeqV2, pan-cancer normalized log2(norm_counts+1) data, version 2016-08-16) (PINA2 ppi data) |
| BRCA (tumor) | BRCA (normal) |
| MNX1, COPS5 (tumor) | MNX1, COPS5 (normal) |
 |  |
| COAD (tumor) | COAD (normal) |
| MNX1, COPS5 (tumor) | MNX1, COPS5 (normal) |
 |  |
| HNSC (tumor) | HNSC (normal) |
| MNX1, COPS5 (tumor) | MNX1, COPS5 (normal) |
 |  |
| KICH (tumor) | KICH (normal) |
| MNX1, COPS5 (tumor) | MNX1, COPS5 (normal) |
 |  |
| KIRC (tumor) | KIRC (normal) |
| MNX1, COPS5 (tumor) | MNX1, COPS5 (normal) |
 |  |
| KIRP (tumor) | KIRP (normal) |
| MNX1, COPS5 (tumor) | MNX1, COPS5 (normal) |
 |  |
| LIHC (tumor) | LIHC (normal) |
| MNX1, COPS5 (tumor) | MNX1, COPS5 (normal) |
 |  |
| LUAD (tumor) | LUAD (normal) |
| MNX1, COPS5 (tumor) | MNX1, COPS5 (normal) |
 |  |
| LUSC (tumor) | LUSC (normal) |
| MNX1, COPS5 (tumor) | MNX1, COPS5 (normal) |
 |  |
| PRAD (tumor) | PRAD (normal) |
| MNX1, COPS5 (tumor) | MNX1, COPS5 (normal) |
 |  |
| STAD (tumor) | STAD (normal) |
| MNX1, COPS5 (tumor) | MNX1, COPS5 (normal) |
 |  |
| THCA (tumor) | THCA (normal) |
| MNX1, COPS5 (tumor) | MNX1, COPS5 (normal) |
 |  |
| Top |
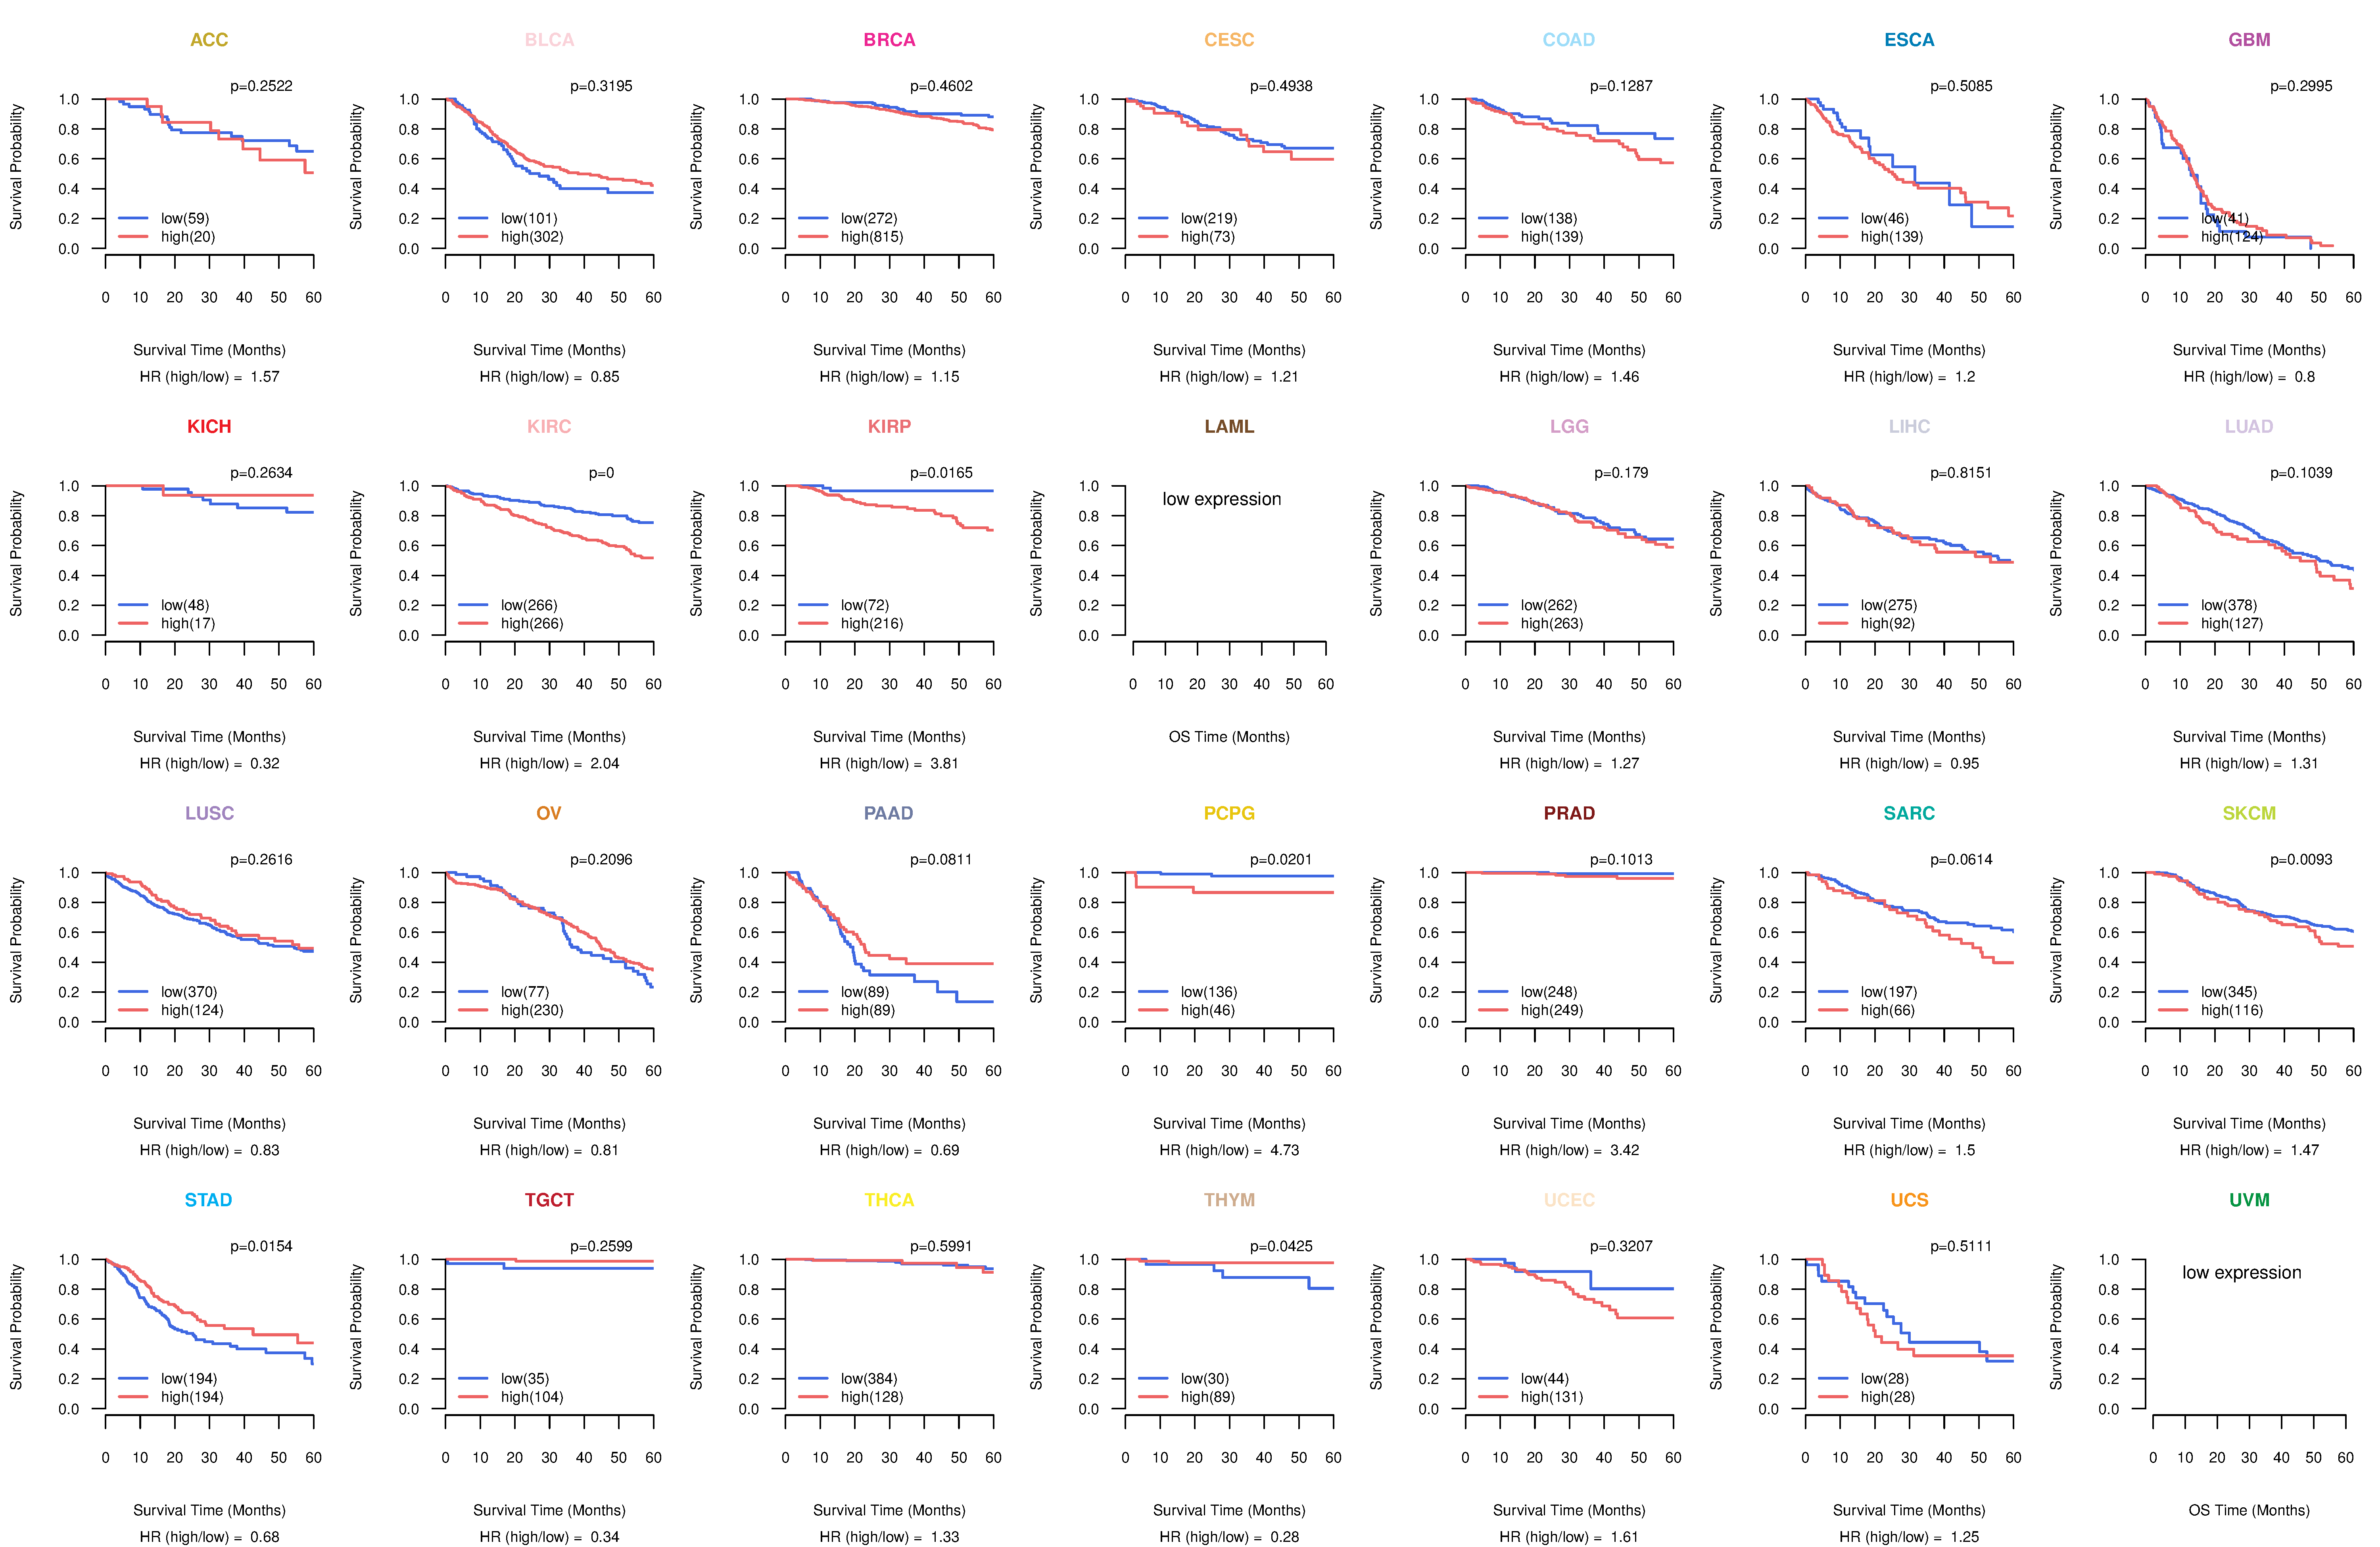
| TissGeneProg for MNX1 |
| Kaplan-Meier plots with logrank tests of overall survival (OS) using 28 cancer types (TCGA IlluminaHiSeq_RNASeqV2, pan-cancer normalized log2(norm_counts+1) data, version 2016-08-16) (TCGA clinicalMatrix, phenotype data, version 2016-04-27) * Click on the image to enlarge it in a new window. |
 |
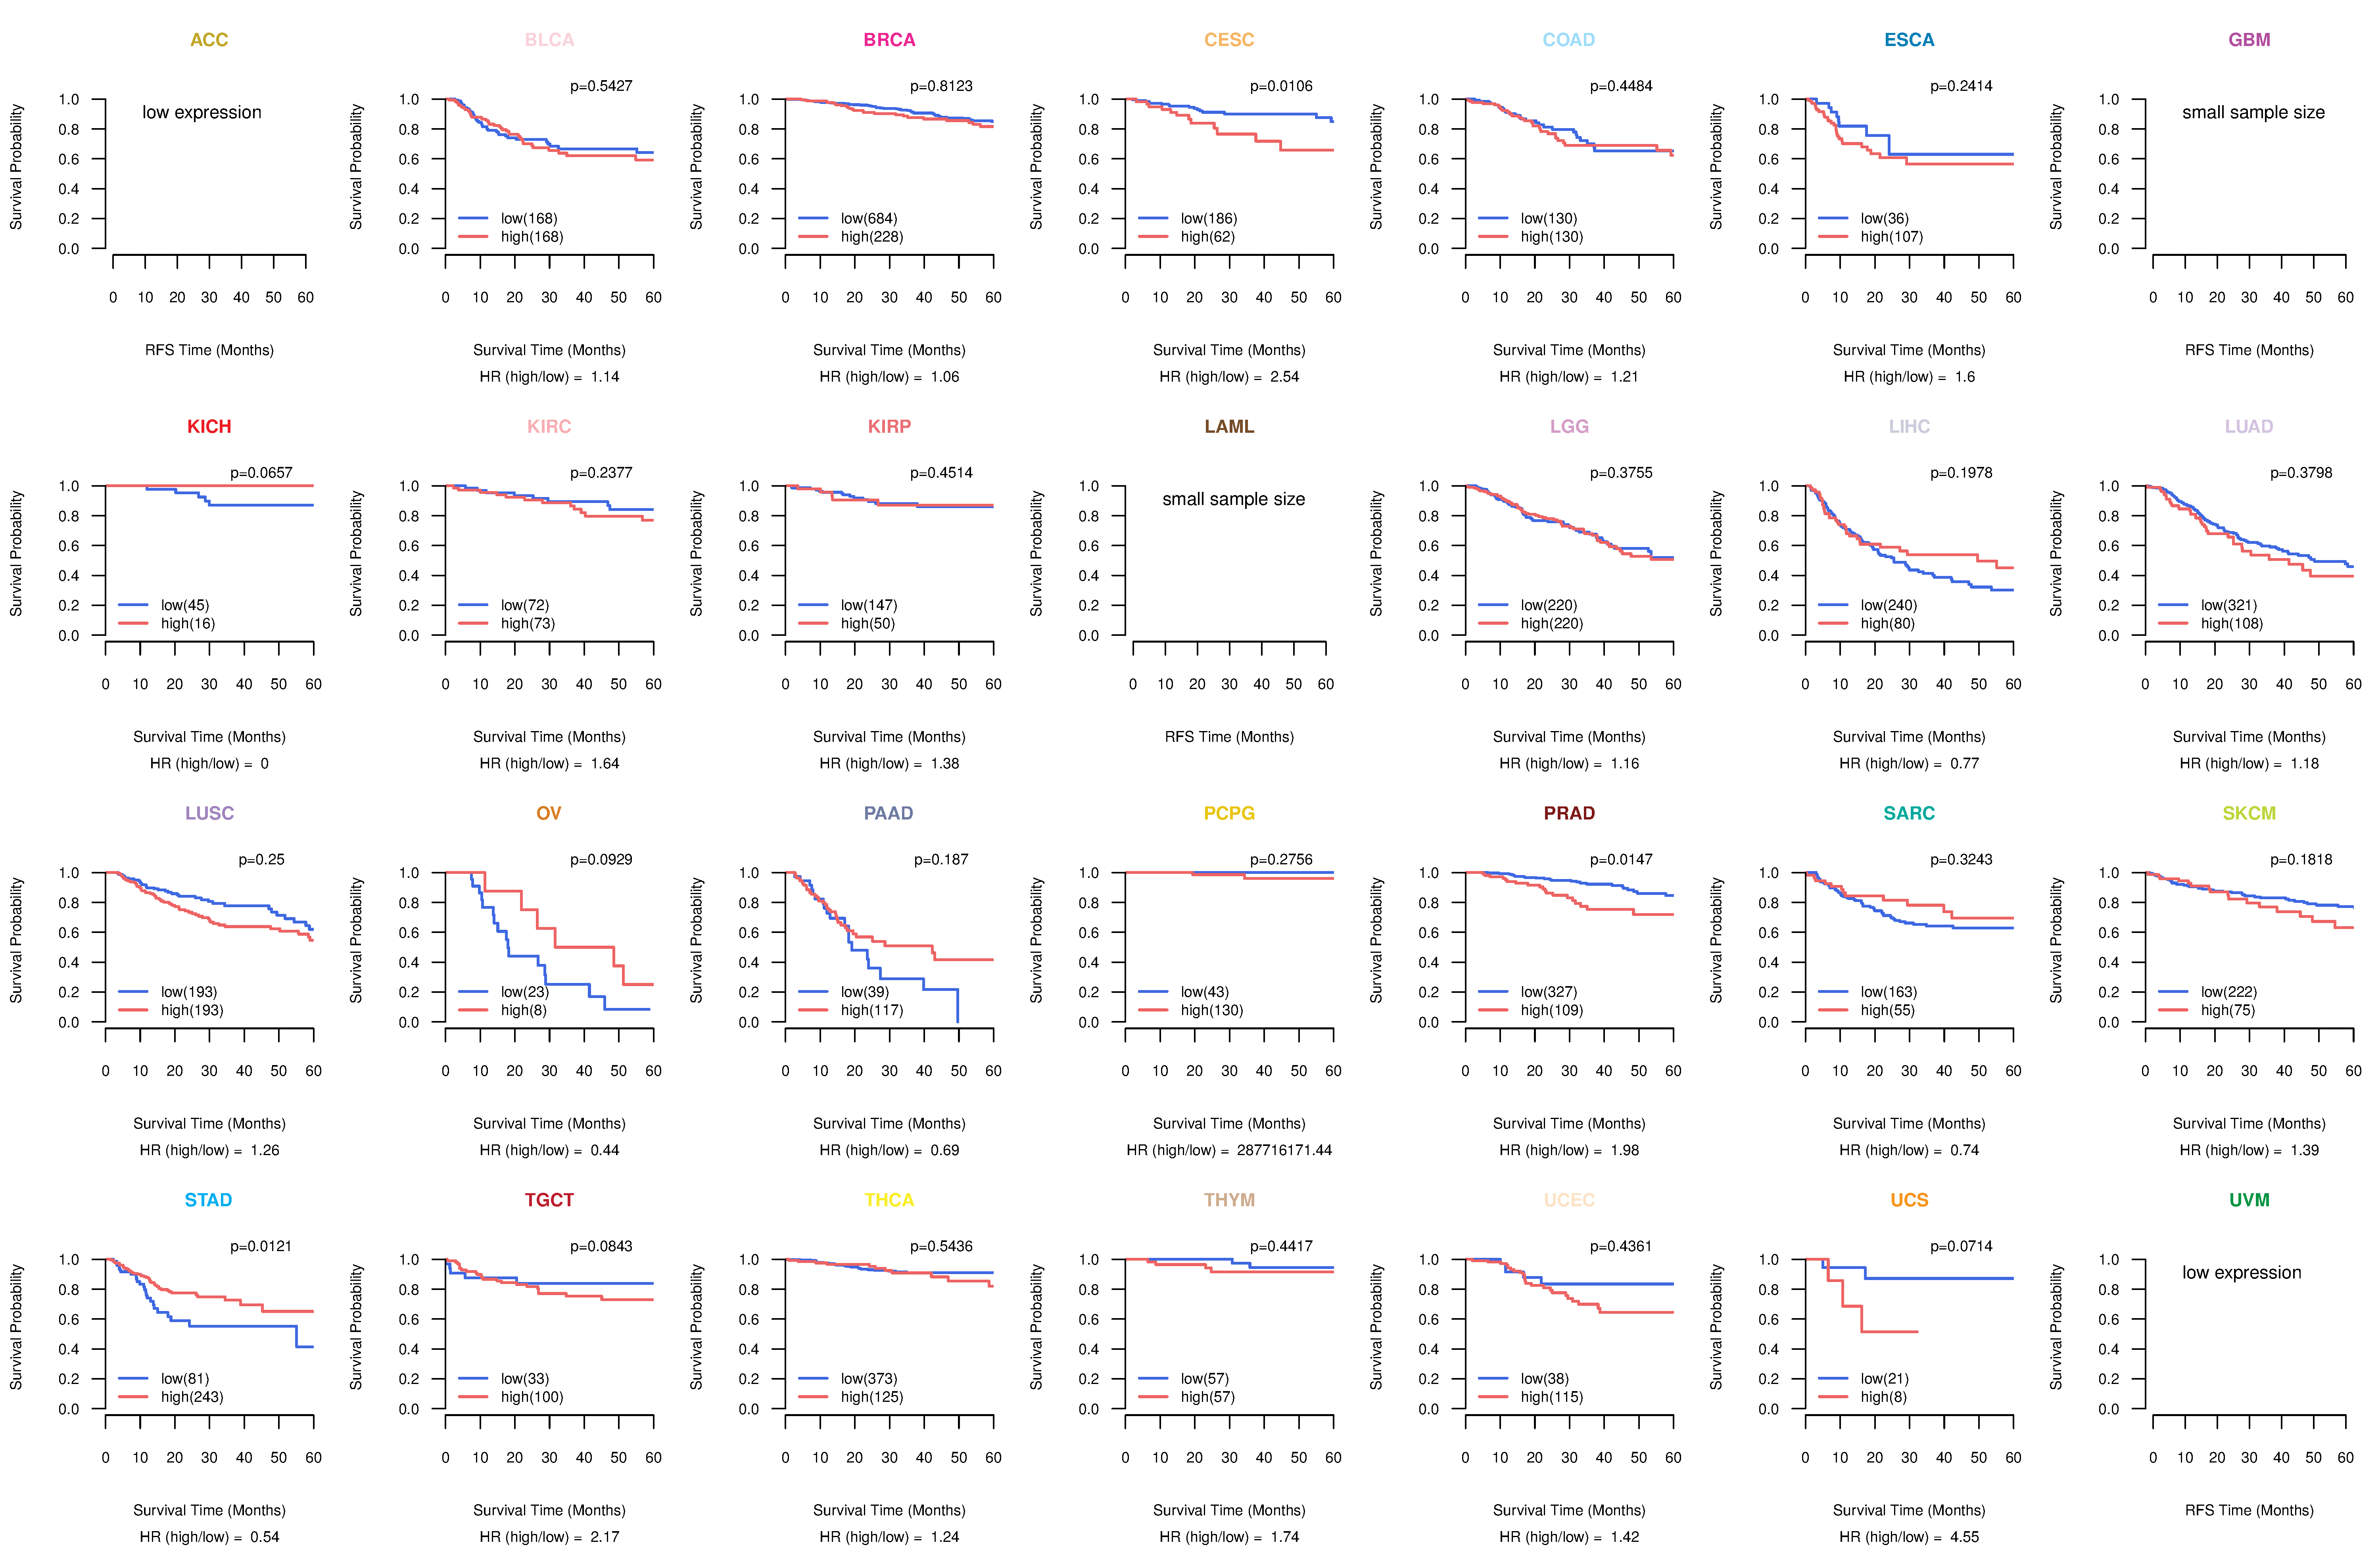
| Kaplan-Meier plots with logrank test of relapse free survival (RFS) using 28 cancer types (TCGA IlluminaHiSeq_RNASeqV2, pan-cancer normalized log2(norm_counts+1) data, version 2016-08-16) (TCGA clinicalMatrix, phenotype data, version 2016-04-27) * Click on the image enlarge it in a new window. |
 |
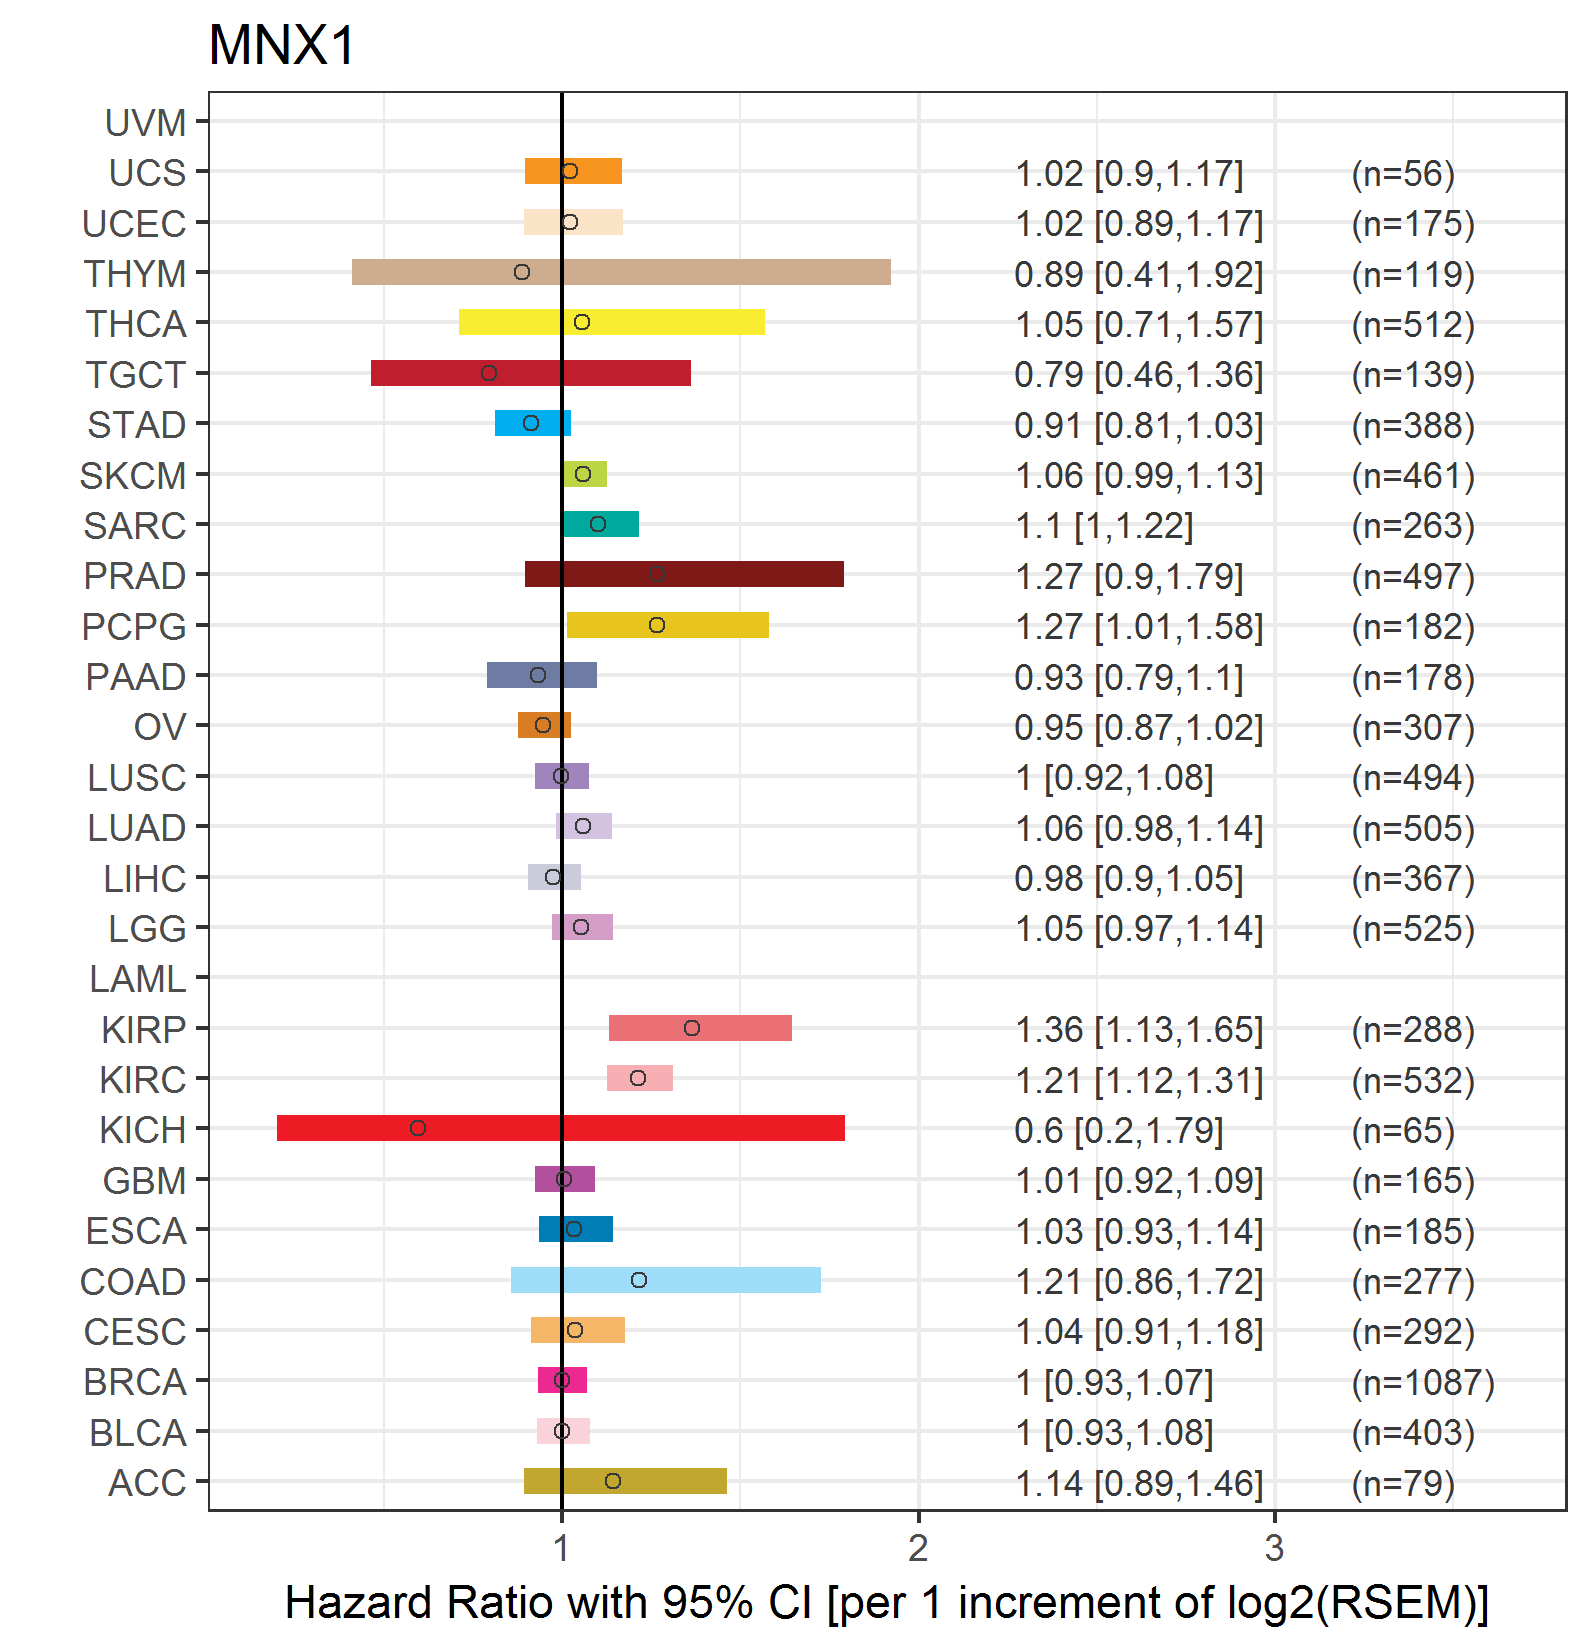
| Forest plot of Cox proportional hazard ratio (HR) and 95% CI of overall survival (OS) using 28 cancer types (TCGA IlluminaHiSeq_RNASeqV2, pan-cancer normalized log2(norm_counts+1) data, version 2016-08-16) (TCGA clinicalMatrix, phenotype data, version 2016-04-27) * Click on the image enlarge it in a new window. |
 |
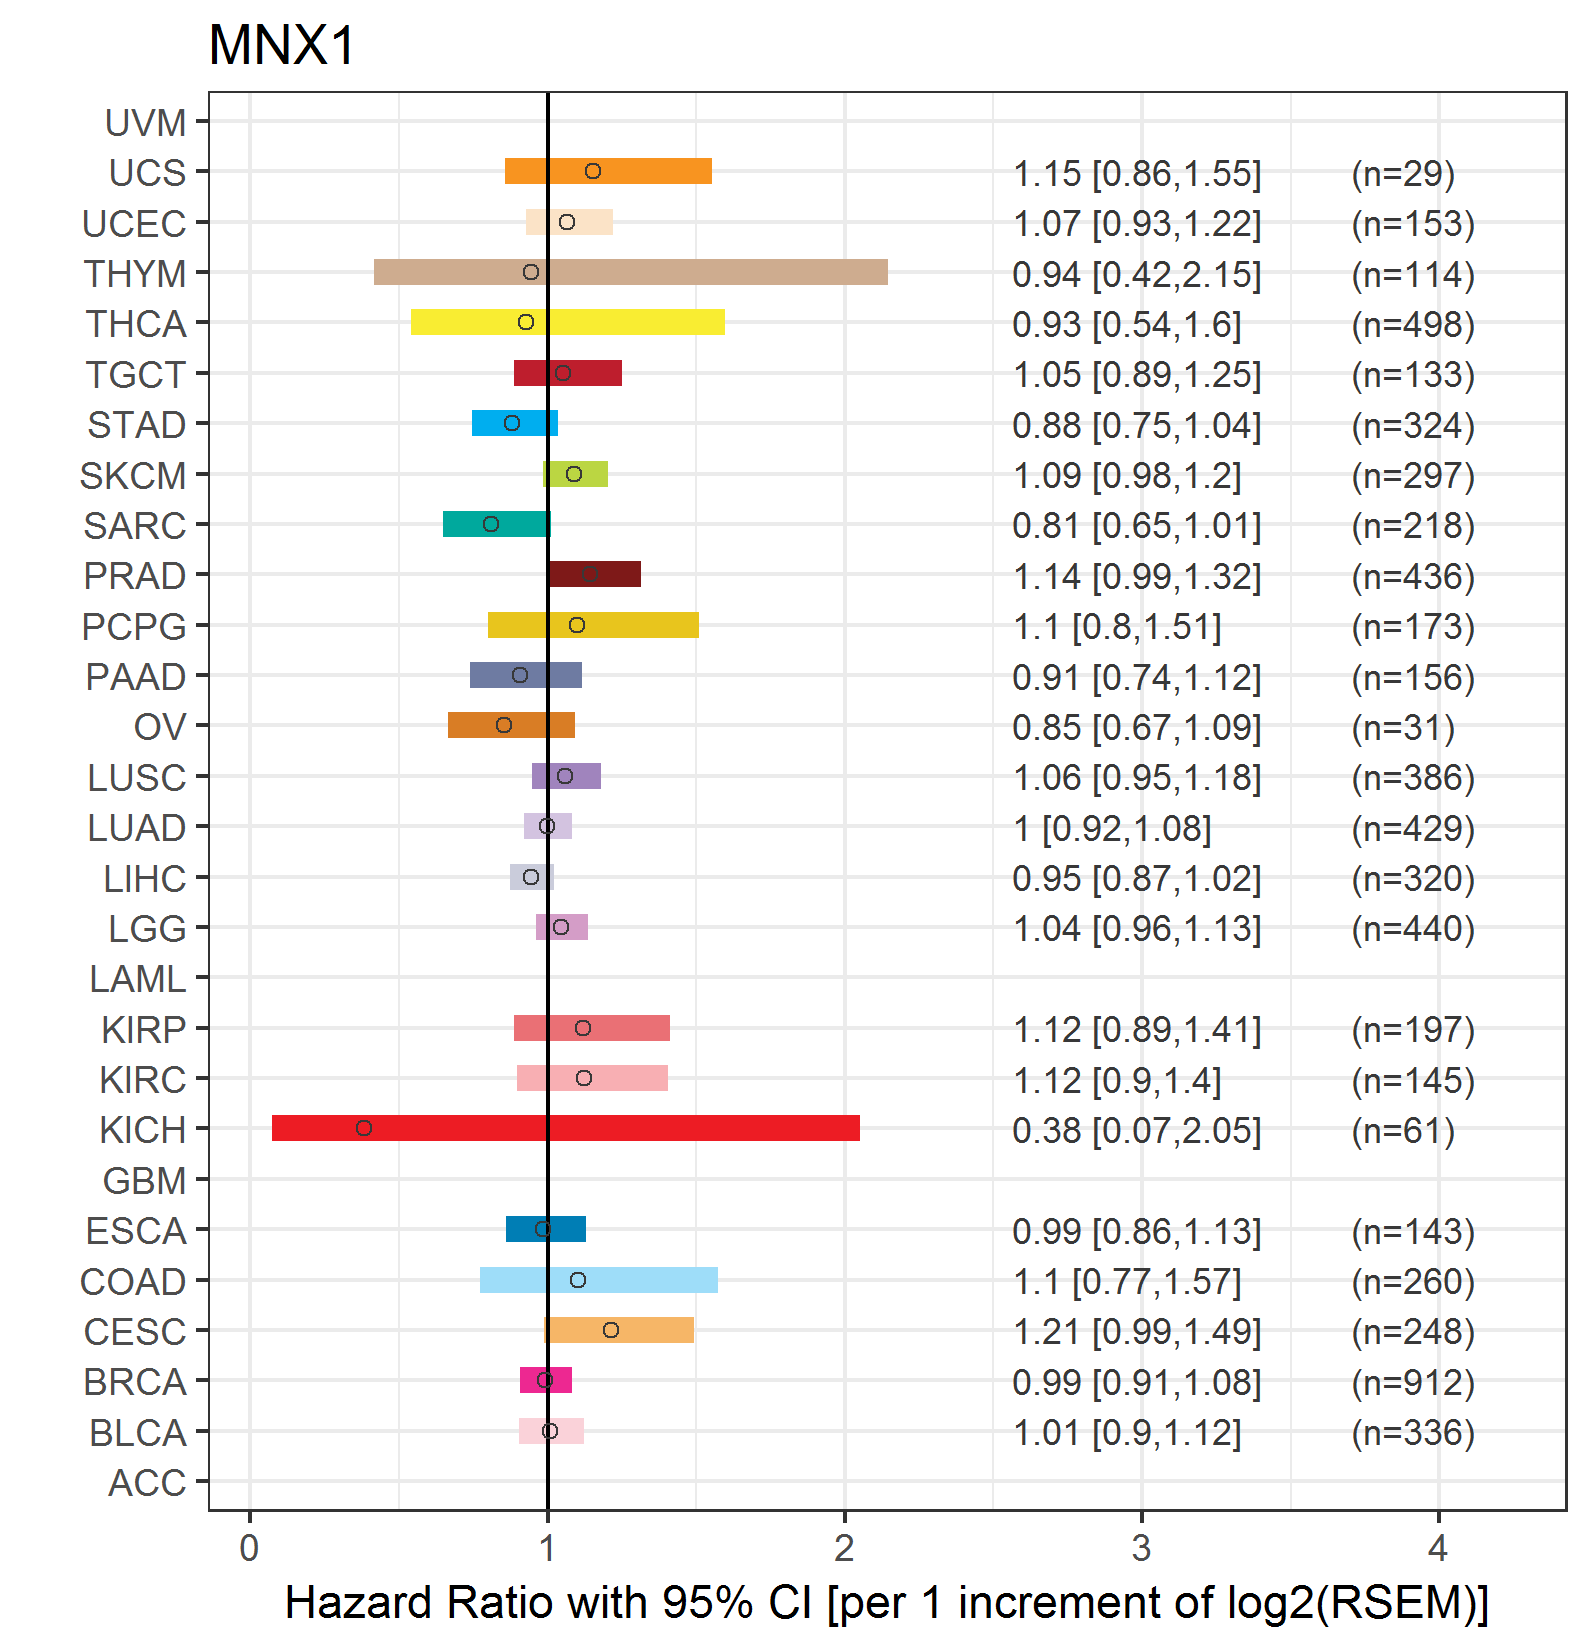
| Forest plot of Cox proportional hazard ratio (HR) and 95% CI of relapse free survival (RFS) using 28 cancer types (TCGA IlluminaHiSeq_RNASeqV2, pan-cancer normalized log2(norm_counts+1) data, version 2016-08-16) (TCGA clinicalMatrix, phenotype data, version 2016-04-27) * Click on the image enlarge it in a new window. |
 |
| Top |
| TissGeneClin for MNX1 |
| TissGeneDrug for MNX1 |
| Drug information targeting TissGene (DrugBank Version 5.0.6, 2017-04-01) |
| DrugBank ID | Drug name | Drug activity | Drug type | Drug status |
| Top |
| TissGeneDisease for MNX1 |
| Disease information associated with TissGene (DisGeNet, 2016-06-01) |
| Disease ID | Disease name | # pubmeds | Source |
| umls:C1531773 | Currarino triad | 17 | BeFree,CLINVAR,CTD_human,ORPHANET,UNIPROT |
| umls:C0023467 | Leukemia, Myelocytic, Acute | 7 | BeFree |
| umls:C0023418 | leukemia | 5 | BeFree |
| umls:C0300948 | Caudal Regression Syndrome | 5 | BeFree |
| umls:C0344490 | Sacral agenesis | 3 | BeFree |
| umls:C0000768 | Congenital Abnormality | 2 | BeFree |
| umls:C0021670 | insulinoma | 2 | BeFree |
| umls:C0079541 | Holoprosencephaly | 2 | BeFree |
| umls:C0158981 | Neonatal diabetes mellitus | 2 | BeFree |
| umls:C3495676 | Anorectal Anomalies | 2 | BeFree |
| umls:C0002736 | Amyotrophic Lateral Sclerosis | 1 | BeFree |
| umls:C0009730 | Spinal meningocele | 1 | BeFree |
| umls:C0011847 | Diabetes | 1 | BeFree |
| umls:C0011849 | Diabetes Mellitus | 1 | BeFree |
| umls:C0019829 | Hodgkin Disease | 1 | BeFree,LHGDN |
| umls:C0023434 | Chronic Lymphocytic Leukemia | 1 | BeFree |
| umls:C0023452 | Leukemia, Lymphocytic, Acute, L1 | 1 | BeFree |
| umls:C0023462 | Acute Megakaryocytic Leukemias | 1 | BeFree,LHGDN |
| umls:C0023470 | Myeloid Leukemia | 1 | LHGDN |
| umls:C0025299 | Meningocele | 1 | BeFree |
| umls:C0027819 | Neuroblastoma | 1 | BeFree |
| umls:C0037221 | Situs Inversus | 1 | BeFree |
| umls:C0085207 | Gestational Diabetes | 1 | BeFree |
| umls:C0220810 | Congenital defects | 1 | BeFree |
| umls:C0266642 | Situs ambiguus | 1 | BeFree |
| umls:C0334634 | Malignant lymphoma, lymphocytic, intermediate differentiation, diffuse | 1 | BeFree |
| umls:C0345354 | Radial polydactyly | 1 | BeFree |
| umls:C0376545 | Hematologic Neoplasms | 1 | BeFree |
| umls:C0598766 | Leukemogenesis | 1 | BeFree |
| umls:C0700095 | Central neuroblastoma | 1 | BeFree |
| umls:C1261470 | Congenital meningocele | 1 | BeFree |
| umls:C1332977 | Childhood Leukemia | 1 | BeFree |
| umls:C1833104 | DIABETES MELLITUS, PERMANENT NEONATAL | 1 | BeFree |
| umls:C2239176 | Liver carcinoma | 1 | BeFree |
| umls:C3273035 | Poorly Differentiated Hepatocellular Carcinoma | 1 | BeFree |
|
Copyright 2016-Present - The University of Texas Health Science Center at Houston (UTHealth) Web File Viewing | How to Report, Fraud, Waste and Abuse | State of Texas | Statewide Search | Texas Homeland Security | Site Policies |