 |
| |
| |
| |
| |
| |
| |
|

| TissGeneSummary for HMGCS2 |
 Gene summary Gene summary |
| Basic gene information | Gene symbol | HMGCS2 |
| Gene name | 3-hydroxy-3-methylglutaryl-CoA synthase 2 (mitochondrial) | |
| Synonyms | - | |
| Cytomap | UCSC genome browser: 1p13-p12 | |
| Type of gene | protein-coding | |
| RefGenes | NM_001166107.1, NM_005518.3, | |
| Description | 3-hydroxy-3-methylglutaryl-Coenzyme A synthase 2 (mitochondrial)HMG-CoA synthasehydroxymethylglutaryl-CoA synthase, mitochondrial | |
| Modification date | 20141207 | |
| dbXrefs | MIM : 600234 | |
| HGNC : HGNC | ||
| Ensembl : ENSG00000134240 | ||
| HPRD : 02580 | ||
| Vega : OTTHUMG00000012101 | ||
| Protein | UniProt: go to UniProt's Cross Reference DB Table | |
| Expression | CleanEX: HS_HMGCS2 | |
| BioGPS: 3158 | ||
| Pathway | NCI Pathway Interaction Database: HMGCS2 | |
| KEGG: HMGCS2 | ||
| REACTOME: HMGCS2 | ||
| Pathway Commons: HMGCS2 | ||
| Context | iHOP: HMGCS2 | |
| ligand binding site mutation search in PubMed: HMGCS2 | ||
| UCL Cancer Institute: HMGCS2 | ||
| Assigned class in TissGDB* | C | |
| Included tissue-specific gene expression resources | TiGER,GTEx | |
| Specific-tissues in normal samples (assigned by TissGDB using HPA, TiGER, and GTEx) | Liver | |
| Cancer types related to the specific-tissues in cancer samples (assigned by TissGDB using TCGA) | LIHC | |
| Reference showing the relevant tissue of HMGCS2 | ||
| Description by TissGene annotations | ||
| * Class A consists of genes with literature evidence and is part of the cTissGenes. Class B consists of only cTissGenes without additional evidence. The remaining genes belong to Class C. |
| Gene ontology having evidence of Inferred from Direct Assay (IDA) from Entrez |
| GO ID | GO term | PubMed ID |
| Top |
| TissGeneExp for HMGCS2 |
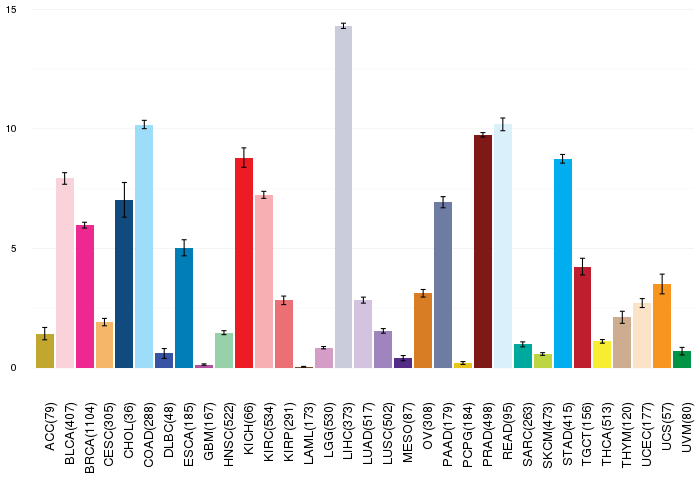
| Gene expressions across 28 cancer types (X-axis: cancer type and Y-axis: log2(norm_counts+1)) (TCGA IlluminaHiSeq_RNASeqV2, pan-cancer normalized log2(norm_counts+1) data, version 2016-08-16) |
 |
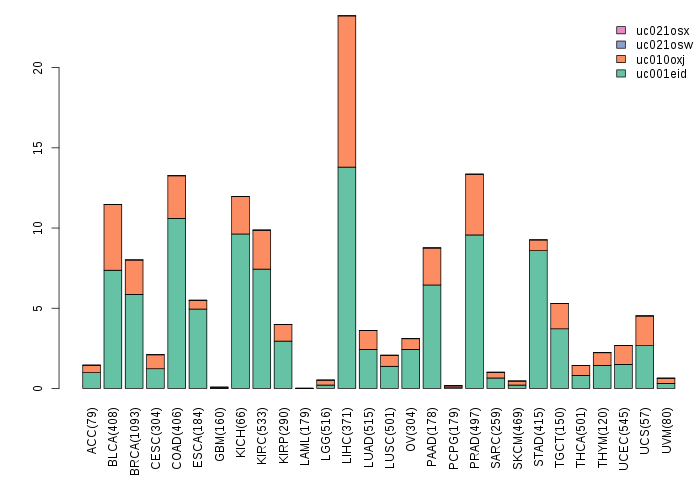
| Gene isoform expressions across 28 cancer types (X-axis: cancer type and Y-axis: log2(norm_counts+1)) (TCGA pan-cancer tcga_rsem_isoform_tpm, version 2016-09-01) |
 |
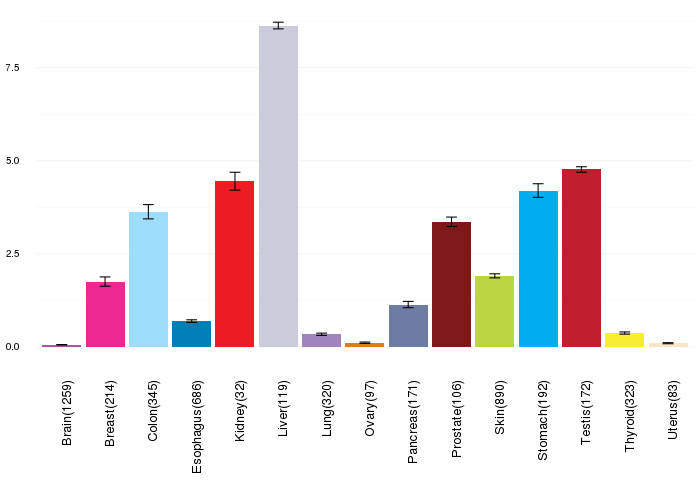
| Gene expressions across normal tissues of GTEx data (GTEx GTEx_Analysis_v6_RNA-seq_RNA-SeQCv1.1.8_gene_rpkm.gct) - Here, we shows the matched tissue types only among our 28 cancer types. |
 |
| Different expressions across 14 cancer types with more than 10 samples between matched tumors and normals (X-axis: cancer type and Y-axis: log2(norm_counts+1)) (TCGA IlluminaHiSeq_RNASeqV2, pan-cancer normalized log2(norm_counts+1) data, version 2016-08-16) |
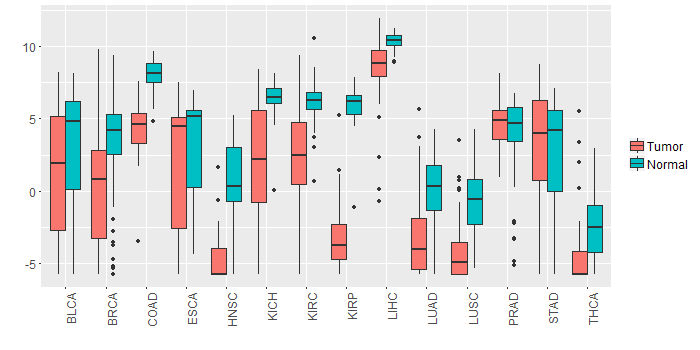 |
| - Significantly differentially expressed cancer types and information. (|Fold change|>1 and FDR<0.05) |
| Cancer type | Mean(exp) in tumor | Mean(exp) in matched normal | Log2FC | P-val. | FDR |
| LIHC | 8.445832478 | 10.35654048 | -1.910708 | 1.61E-06 | 8.30E-06 |
| KIRP | -3.064835272 | 5.883433478 | -8.94826875 | 7.26E-24 | 7.75E-22 |
| LUSC | -4.19651211 | -0.82648858 | -3.370023529 | 1.77E-11 | 7.16E-11 |
| LUAD | -3.188793246 | -0.063634625 | -3.125158621 | 1.07E-09 | 5.63E-09 |
| THCA | -4.491031352 | -2.383012708 | -2.108018644 | 1.31E-06 | 4.88E-06 |
| KICH | 2.143758478 | 6.282994478 | -4.139236 | 1.47E-05 | 4.49E-05 |
| BRCA | 0.323538303 | 3.284213742 | -2.960675439 | 1.32E-08 | 4.26E-08 |
| HNSC | -4.739557801 | 0.811786385 | -5.551344186 | 3.15E-20 | 3.54E-17 |
| KIRC | 2.052590423 | 6.180619589 | -4.128029167 | 5.83E-15 | 2.92E-14 |
| COAD | 4.19664694 | 8.063685401 | -3.867038462 | 1.09E-09 | 1.21E-08 |
| Top |
| TissGene-miRNA for HMGCS2 |
| Significantly anti-correlated miRNAs of TissGene across 28 cancer types (Gene-miRNA relations from TargetScanHuman Relsease 7.1, Conserved_Site_Context_Scores.txt.zip, 06.01.2016) (TCGA IlluminaHiSeq_miRNASeq, log2(RPM+1) data, version 2016-11-21) (TCGA IlluminaHiSeq_RNASeqV2, log2(normalized_count+1) data, version 2016-08-16) (Spearman’s Rank Correlation (p-value<0.05 and coefficient<-0.25)) |
| Cancer type | miRNA id | miRNA accession | P-val. | Coeff. | # samples |
| Top |
| TissGeneMut for HMGCS2 |
| TissGeneSNV for HMGCS2 |
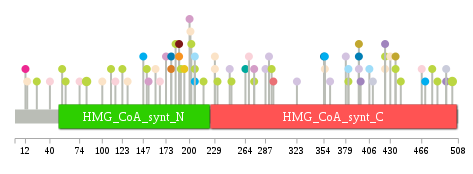
| nsSNV counts per each loci. Different colors of circles represent different cancer types. Circle size denotes number of samples. (TCGA somatic mutation (SNPs and small INDELs) data, version 2016-04-25) * Click on the image to enlarge it in a new window. |
 |
 |
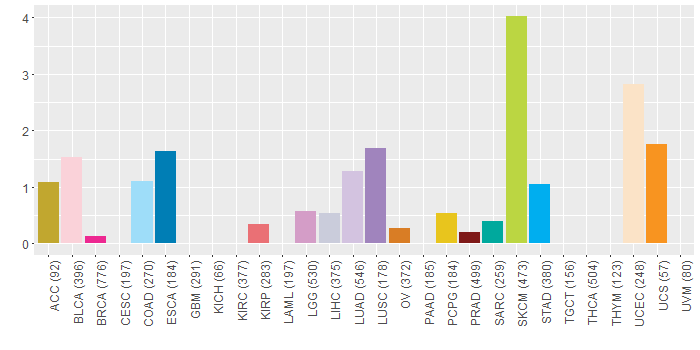
| Somatic nucleotide variants of TissGene across 28 cancer types (X-axis: cancer type and Y-axis: % of mutated samples) The numbers in parentheses are numbers of samples with mutation (nsSNVs). (TCGA somatic mutation (SNPs and small INDELs) data, version 2016-04-25) |
 |
| - nsSNVs sorted by frequency. |
| AAchange | Cancer type | # samples |
| p.R501Q | SKCM | 2 |
| p.G82E | SKCM | 2 |
| p.R206H | COAD | 1 |
| p.R264W | SARC | 1 |
| p.A58V | SKCM | 1 |
| p.V110M | SKCM | 1 |
| p.R188C | UCS | 1 |
| p.G153C | LGG | 1 |
| p.P201H | UCEC | 1 |
| p.S202C | SKCM | 1 |
| p.H396_splice | LUSC | 1 |
| p.R27H | READ | 1 |
| p.A399S | HNSC | 1 |
| p.C166F | BLCA | 1 |
| p.A355S | STAD | 1 |
| p.D394H | ACC | 1 |
| p.D122N | HNSC | 1 |
| p.A17V | HNSC | 1 |
| p.L246* | LUAD | 1 |
| p.R424Q | UCEC | 1 |
| p.G229W | UCEC | 1 |
| p.C194F | PCPG | 1 |
| p.R188H | PRAD | 1 |
| p.A355T | UCEC | 1 |
| p.W179* | OV | 1 |
| p.R206H | STAD | 1 |
| p.P478S | SKCM | 1 |
| p.A323G | LUAD | 1 |
| p.L12P | BRCA | 1 |
| p.S484N | SKCM | 1 |
| p.D151N | SKCM | 1 |
| p.L394M | ESCA | 1 |
| p.R494L | LIHC | 1 |
| p.R494P | LUSC | 1 |
| p.R274C | SKCM | 1 |
| p.F470V | STAD | 1 |
| p.R274H | LGG | 1 |
| p.L14P | UCEC | 1 |
| p.P25L | SKCM | 1 |
| p.E147K | STAD | 1 |
| p.D287E | LUAD | 1 |
| p.S206L | SKCM | 1 |
| p.S123F | SKCM | 1 |
| p.T291N | LUAD | 1 |
| p.L173F | LGG | 1 |
| p.Q361E | LUAD | 1 |
| p.R268Q | BLCA | 1 |
| p.S184A | SKCM | 1 |
| p.V129I | UCEC | 1 |
| p.E115K | BLCA | 1 |
| p.G229_splice | UCEC | 1 |
| p.R406C | COAD | 1 |
| p.G190E | SKCM | 1 |
| p.A430D | UCEC | 1 |
| p.S40F | BLCA | 1 |
| p.Y200* | LGG | 1 |
| p.W179X | ESCA | 1 |
| p.P436S | SKCM | 1 |
| p.D161Y | UCEC | 1 |
| p.E74Q | BLCA | 1 |
| p.R382X | SKCM | 1 |
| p.F410S | LIHC | 1 |
| p.R500C | DLBC | 1 |
| p.R382X | COAD | 1 |
| p.K354N | ESCA | 1 |
| p.S248L | SKCM | 1 |
| p.D436H | ACC | 1 |
| p.D294N | SKCM | 1 |
| p.V54M | SKCM | 1 |
| p.L394V | LUAD | 1 |
| p.G379L | LUAD | 1 |
| p.S216F | SKCM | 1 |
| p.R424L | LUSC | 1 |
| p.R424* | SKCM | 1 |
| p.Q466R | BLCA | 1 |
| p.S442N | SKCM | 1 |
| p.Q296X | KIRP | 1 |
| p.E100K | UCEC | 1 |
| p.G232E | SKCM | 1 |
| Top |
| TissGeneCNV for HMGCS2 |
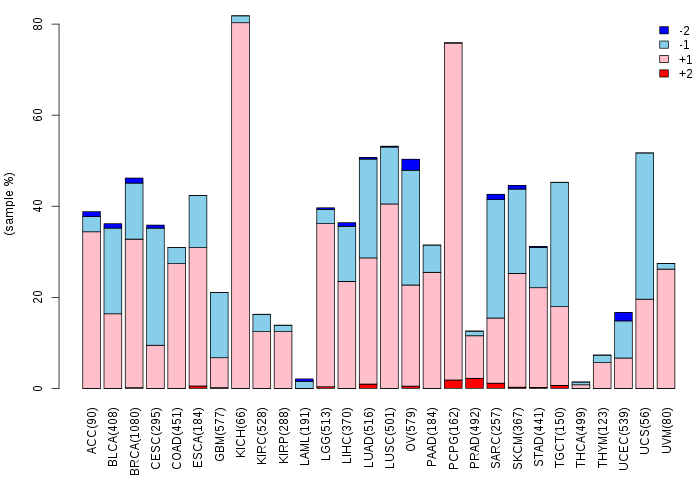
| Copy number variations of TissGene across 28 cancer types (X-axis: cancer type and Y-axis: % of CNV samples) (TCGA Gistic2_CopyNumber_Gistic2_all_data_by_genes, Gistic2 copy number data, version 2016-08-16) |
 |
| Top |
| TissGeneFusions for HMGCS2 |
| Fusion genes including TissGene (ChimerDB 3.0, 2016-12-01 and TCGA fusion Portal 2015-12-01) |
| Database | Src | Cancer type | Sample | Fusion gene | ORF | 5'-gene BP | 3'-gene BP |
| Chimerdb3.0 | TopHat-Fusion | LUSC | TCGA-85-8277-01A | PHGDH-HMGCS2 | In-Frame | chr1:120283140 | chr1:120295296 |
| Top |
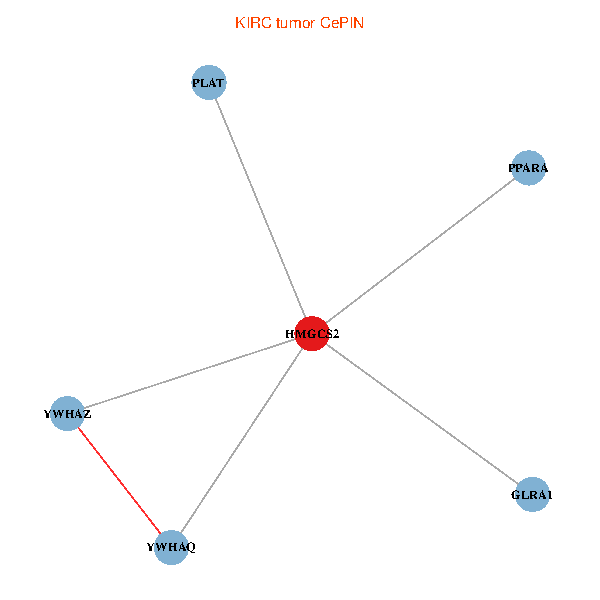
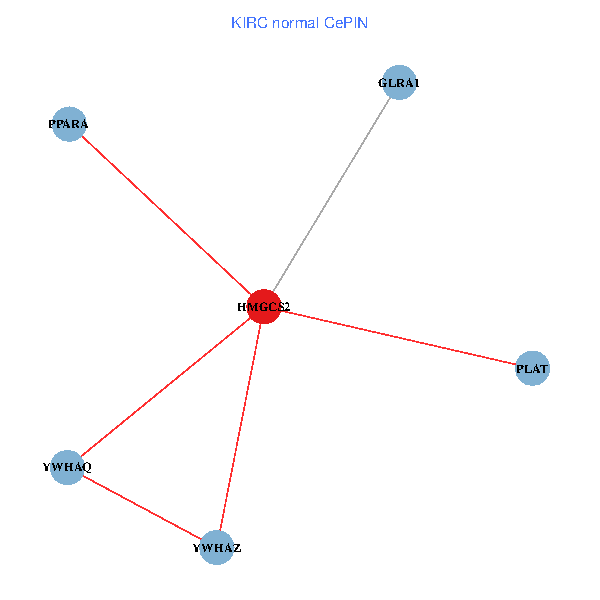
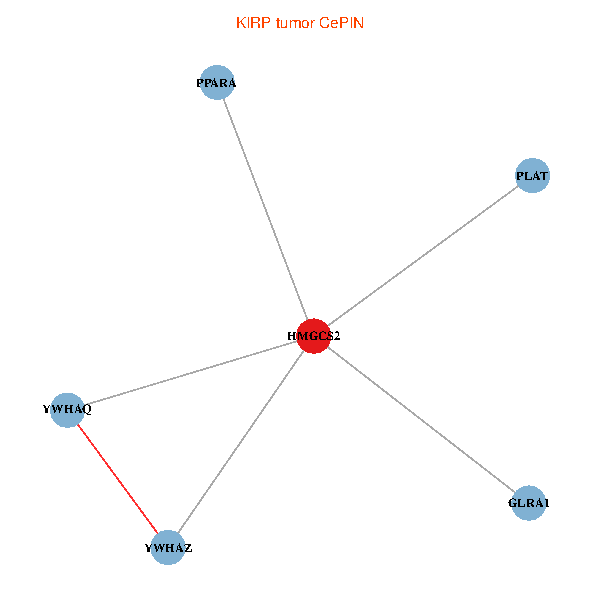
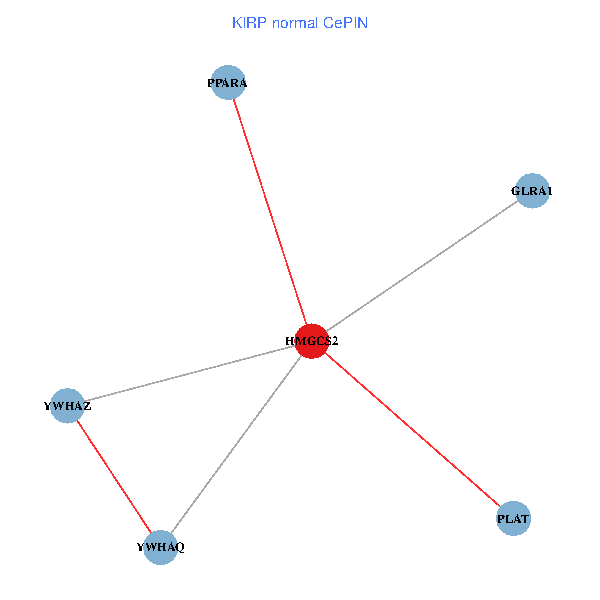
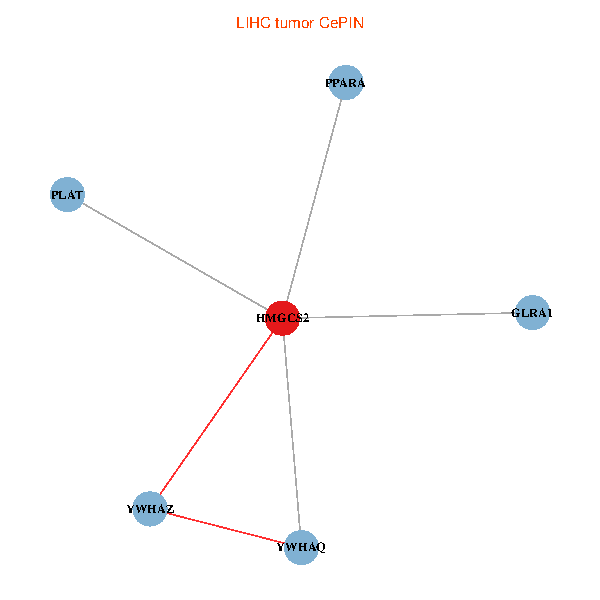
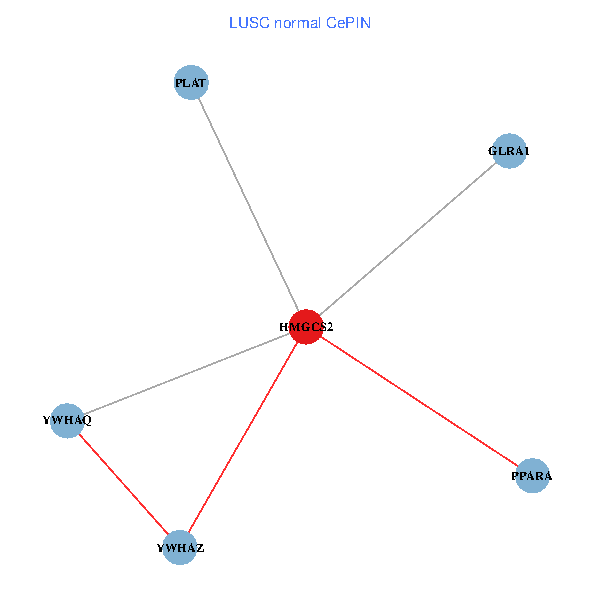
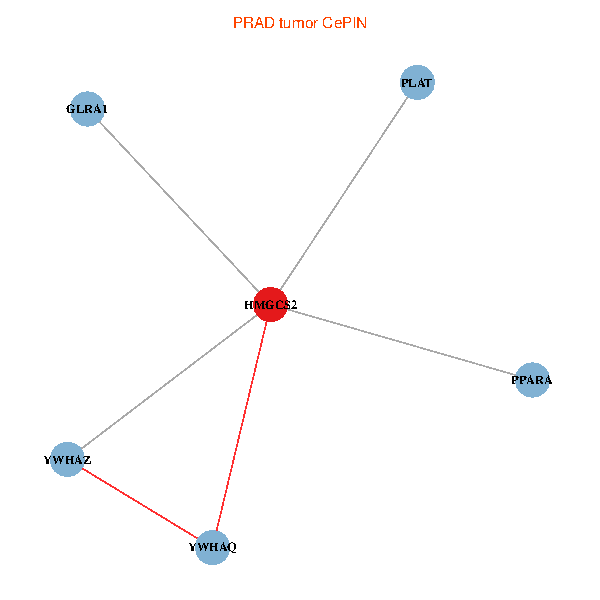
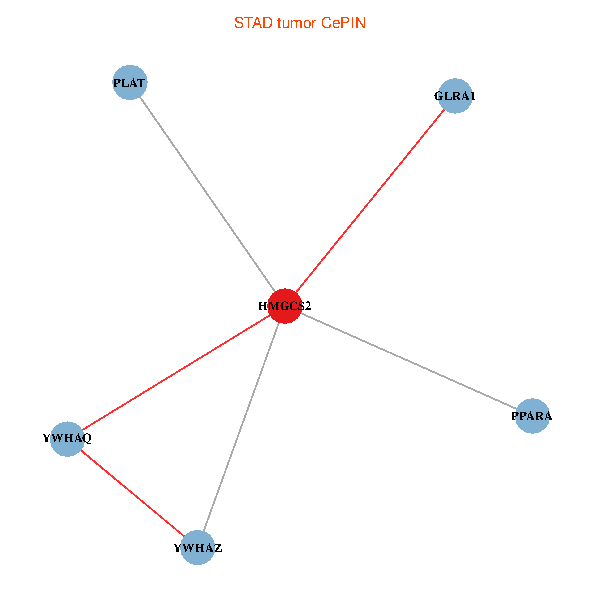
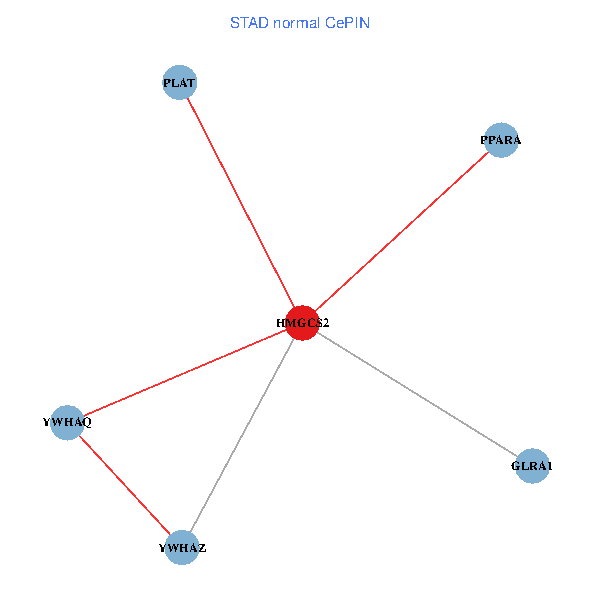
| TissGeneNet for HMGCS2 |
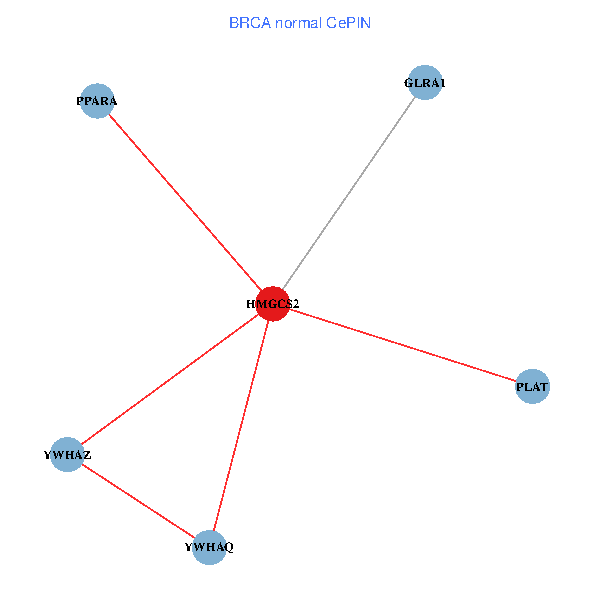
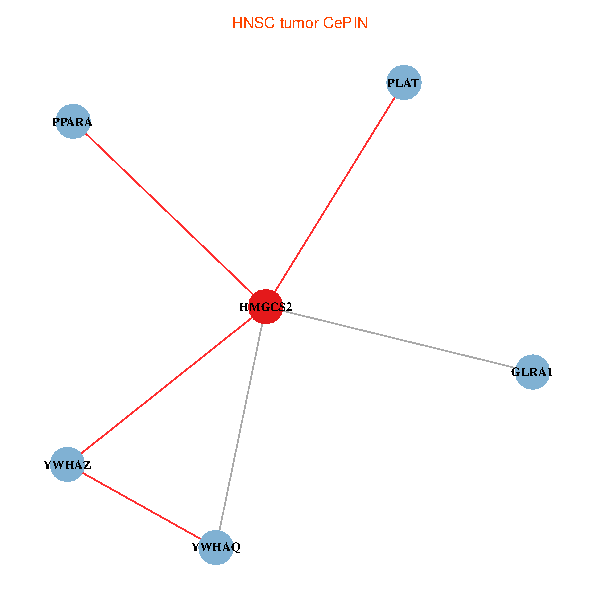
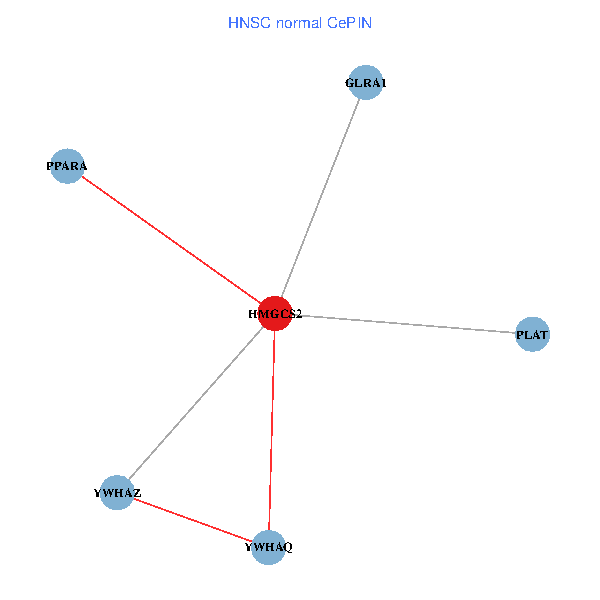
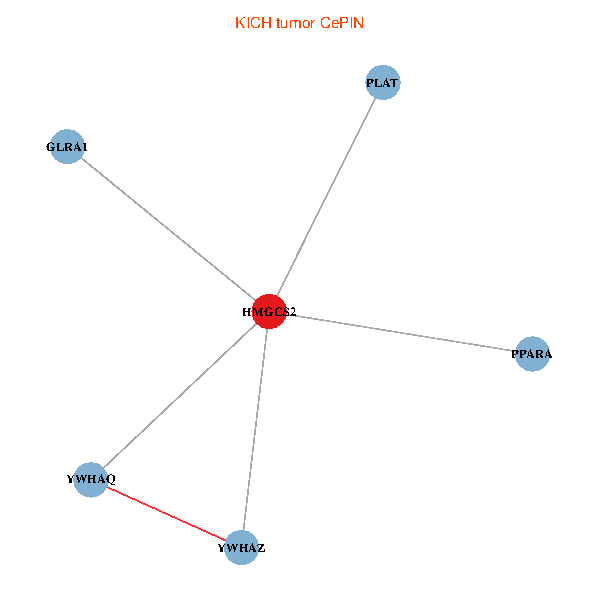
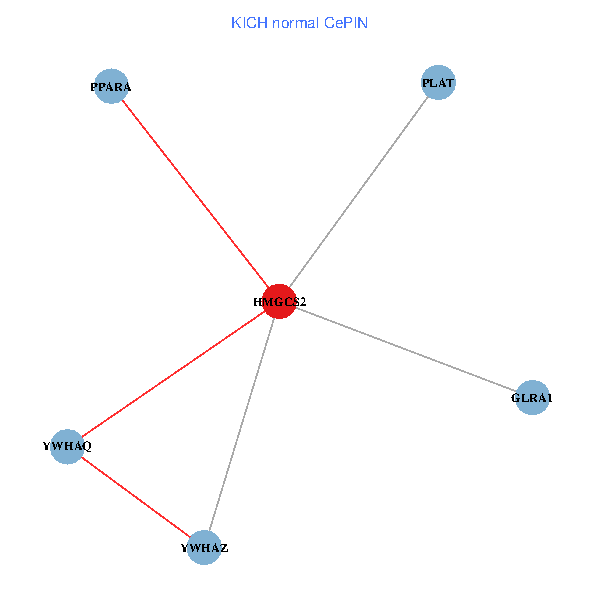
| Co-expressed gene networks based on protein-protein interaction data (CePIN) (TCGA IlluminaHiSeq_RNASeqV2, pan-cancer normalized log2(norm_counts+1) data, version 2016-08-16) (PINA2 ppi data) |
| BRCA (tumor) | BRCA (normal) |
| HMGCS2, YWHAZ, YWHAQ, PLAT, GLRA1, PPARA (tumor) | HMGCS2, YWHAZ, YWHAQ, PLAT, GLRA1, PPARA (normal) |
 |  |
| COAD (tumor) | COAD (normal) |
| HMGCS2, YWHAZ, YWHAQ, PLAT, GLRA1, PPARA (tumor) | HMGCS2, YWHAZ, YWHAQ, PLAT, GLRA1, PPARA (normal) |
 |  |
| HNSC (tumor) | HNSC (normal) |
| HMGCS2, YWHAZ, YWHAQ, PLAT, GLRA1, PPARA (tumor) | HMGCS2, YWHAZ, YWHAQ, PLAT, GLRA1, PPARA (normal) |
 |  |
| KICH (tumor) | KICH (normal) |
| HMGCS2, YWHAZ, YWHAQ, PLAT, GLRA1, PPARA (tumor) | HMGCS2, YWHAZ, YWHAQ, PLAT, GLRA1, PPARA (normal) |
 |  |
| KIRC (tumor) | KIRC (normal) |
| HMGCS2, YWHAZ, YWHAQ, PLAT, GLRA1, PPARA (tumor) | HMGCS2, YWHAZ, YWHAQ, PLAT, GLRA1, PPARA (normal) |
 |  |
| KIRP (tumor) | KIRP (normal) |
| HMGCS2, YWHAZ, YWHAQ, PLAT, GLRA1, PPARA (tumor) | HMGCS2, YWHAZ, YWHAQ, PLAT, GLRA1, PPARA (normal) |
 |  |
| LIHC (tumor) | LIHC (normal) |
| HMGCS2, YWHAZ, YWHAQ, PLAT, GLRA1, PPARA (tumor) | HMGCS2, YWHAZ, YWHAQ, PLAT, GLRA1, PPARA (normal) |
 |  |
| LUAD (tumor) | LUAD (normal) |
| HMGCS2, YWHAZ, YWHAQ, PLAT, GLRA1, PPARA (tumor) | HMGCS2, YWHAZ, YWHAQ, PLAT, GLRA1, PPARA (normal) |
 |  |
| LUSC (tumor) | LUSC (normal) |
| HMGCS2, YWHAZ, YWHAQ, PLAT, GLRA1, PPARA (tumor) | HMGCS2, YWHAZ, YWHAQ, PLAT, GLRA1, PPARA (normal) |
 |  |
| PRAD (tumor) | PRAD (normal) |
| HMGCS2, YWHAZ, YWHAQ, PLAT, GLRA1, PPARA (tumor) | HMGCS2, YWHAZ, YWHAQ, PLAT, GLRA1, PPARA (normal) |
 |  |
| STAD (tumor) | STAD (normal) |
| HMGCS2, YWHAZ, YWHAQ, PLAT, GLRA1, PPARA (tumor) | HMGCS2, YWHAZ, YWHAQ, PLAT, GLRA1, PPARA (normal) |
 |  |
| THCA (tumor) | THCA (normal) |
| HMGCS2, YWHAZ, YWHAQ, PLAT, GLRA1, PPARA (tumor) | HMGCS2, YWHAZ, YWHAQ, PLAT, GLRA1, PPARA (normal) |
 |  |
| Top |
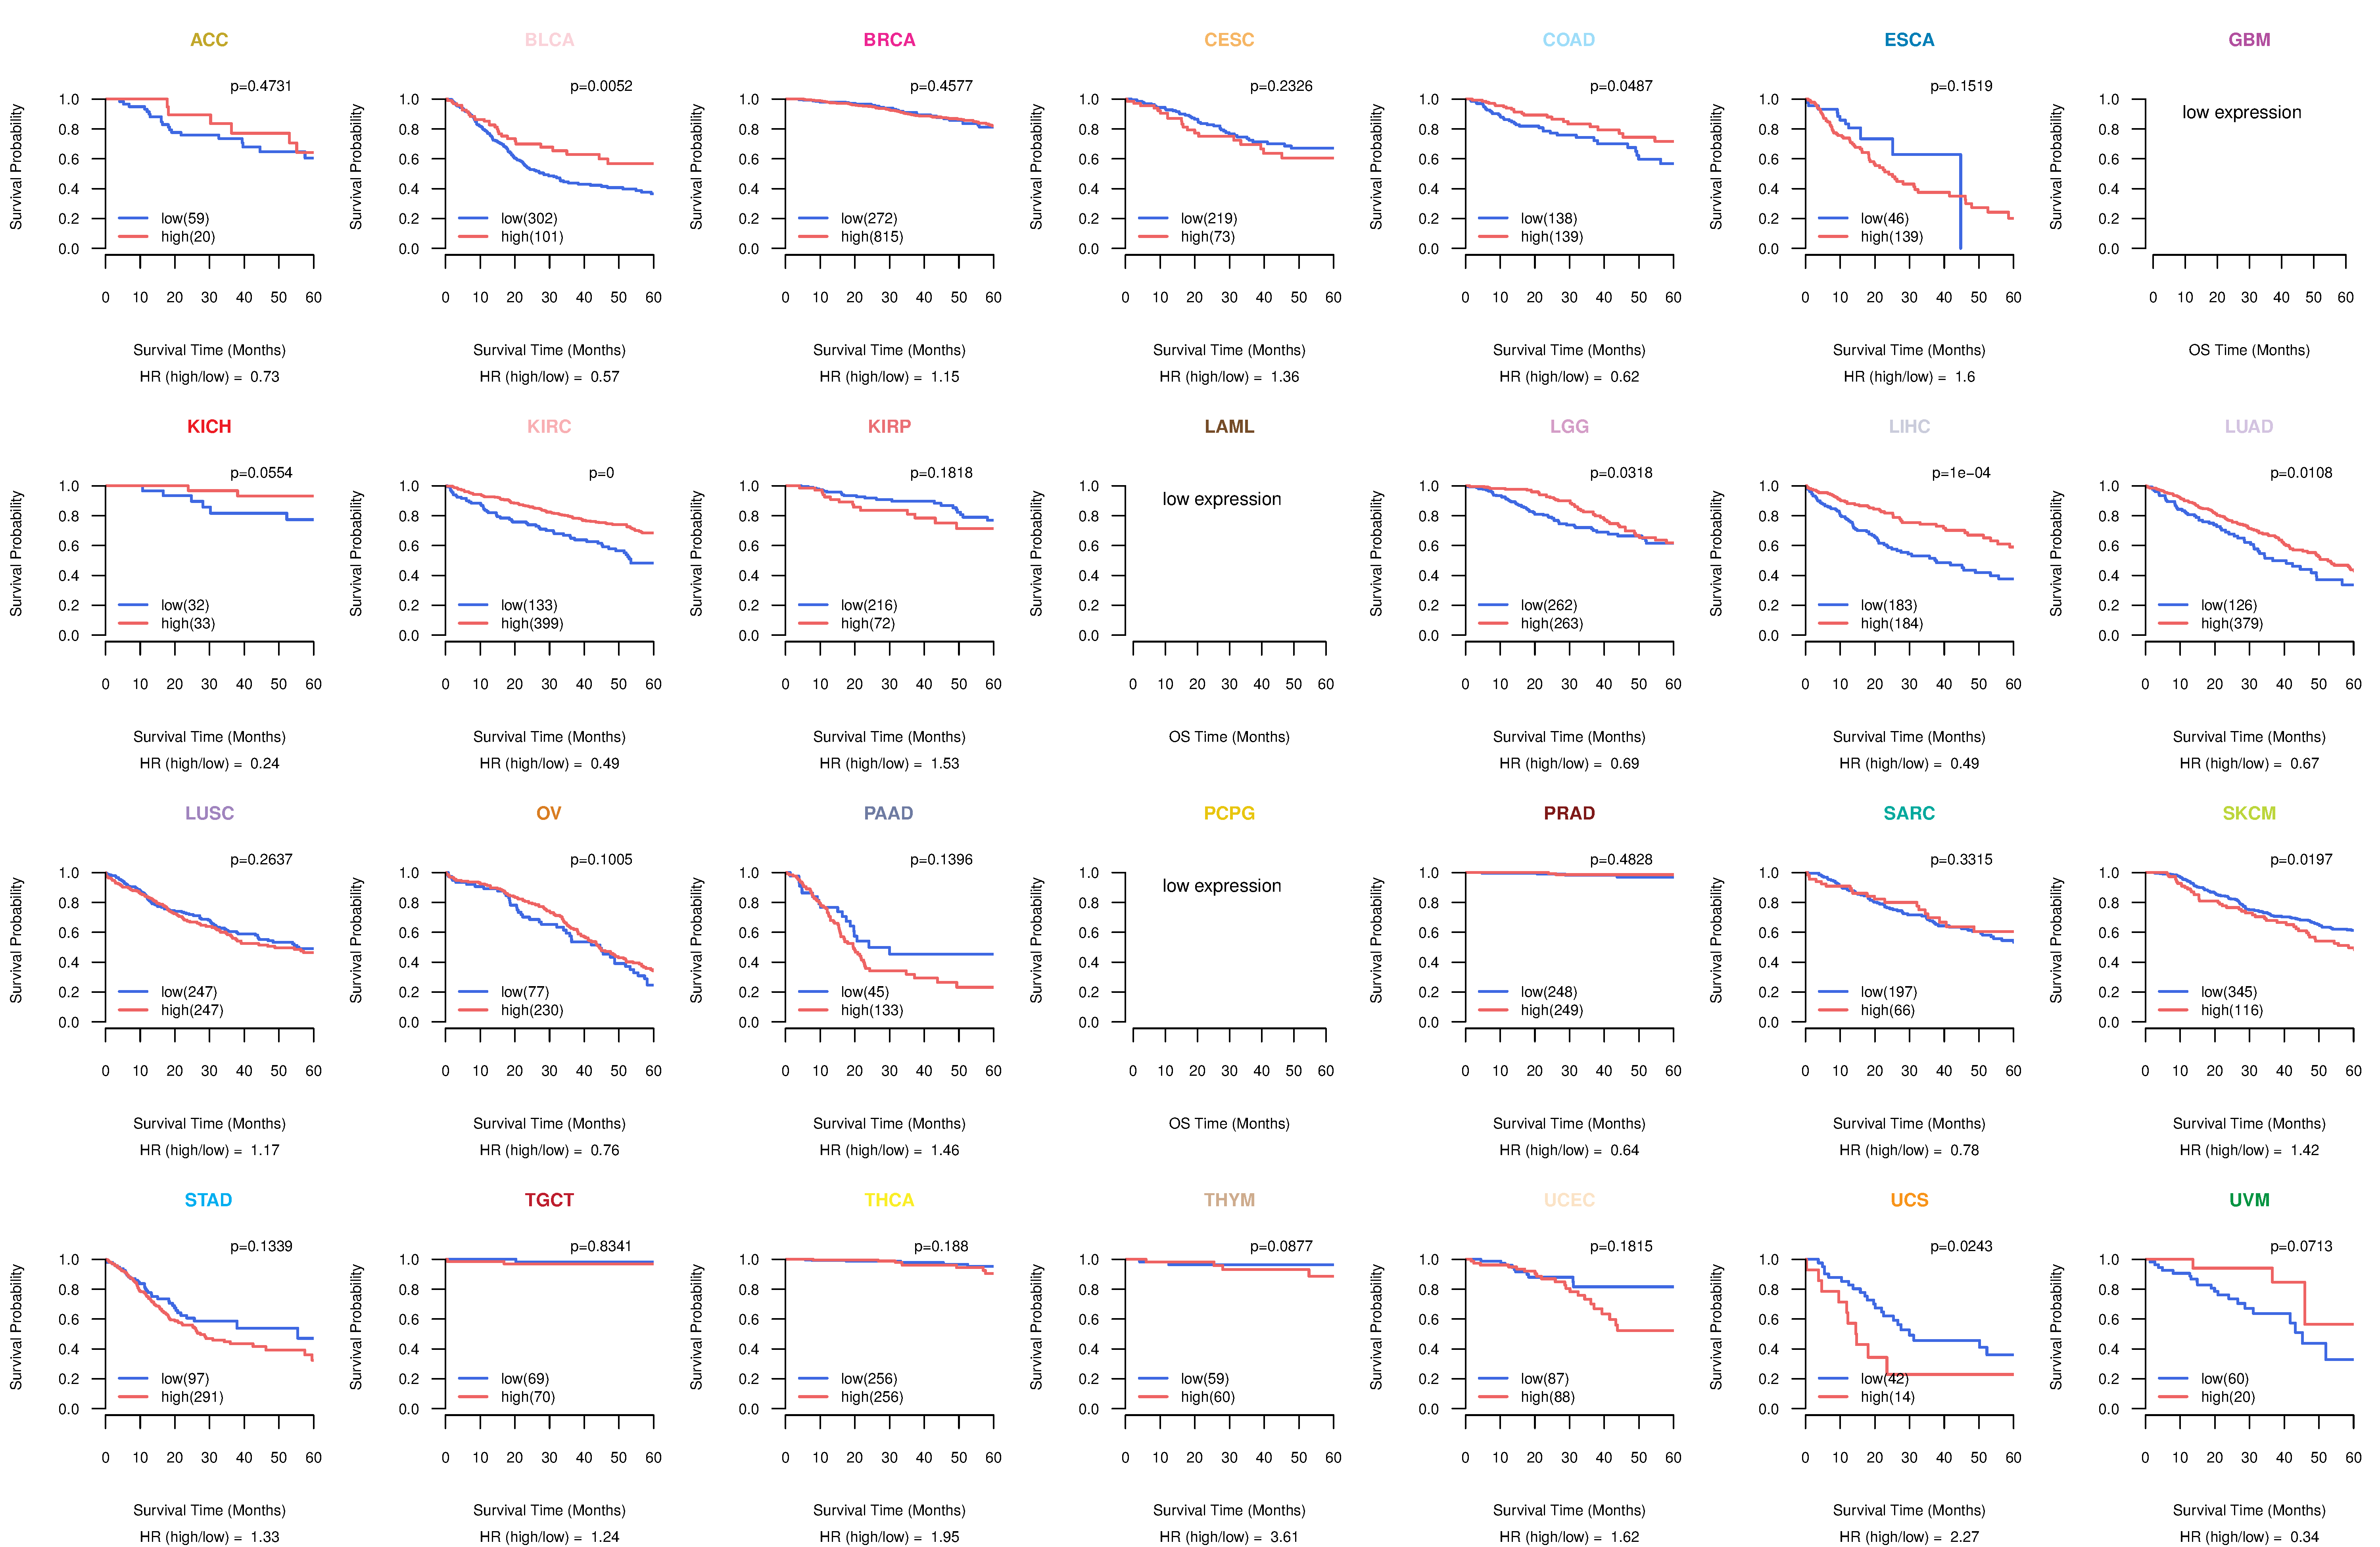
| TissGeneProg for HMGCS2 |
| Kaplan-Meier plots with logrank tests of overall survival (OS) using 28 cancer types (TCGA IlluminaHiSeq_RNASeqV2, pan-cancer normalized log2(norm_counts+1) data, version 2016-08-16) (TCGA clinicalMatrix, phenotype data, version 2016-04-27) * Click on the image to enlarge it in a new window. |
 |
| Kaplan-Meier plots with logrank test of relapse free survival (RFS) using 28 cancer types (TCGA IlluminaHiSeq_RNASeqV2, pan-cancer normalized log2(norm_counts+1) data, version 2016-08-16) (TCGA clinicalMatrix, phenotype data, version 2016-04-27) * Click on the image enlarge it in a new window. |
 |
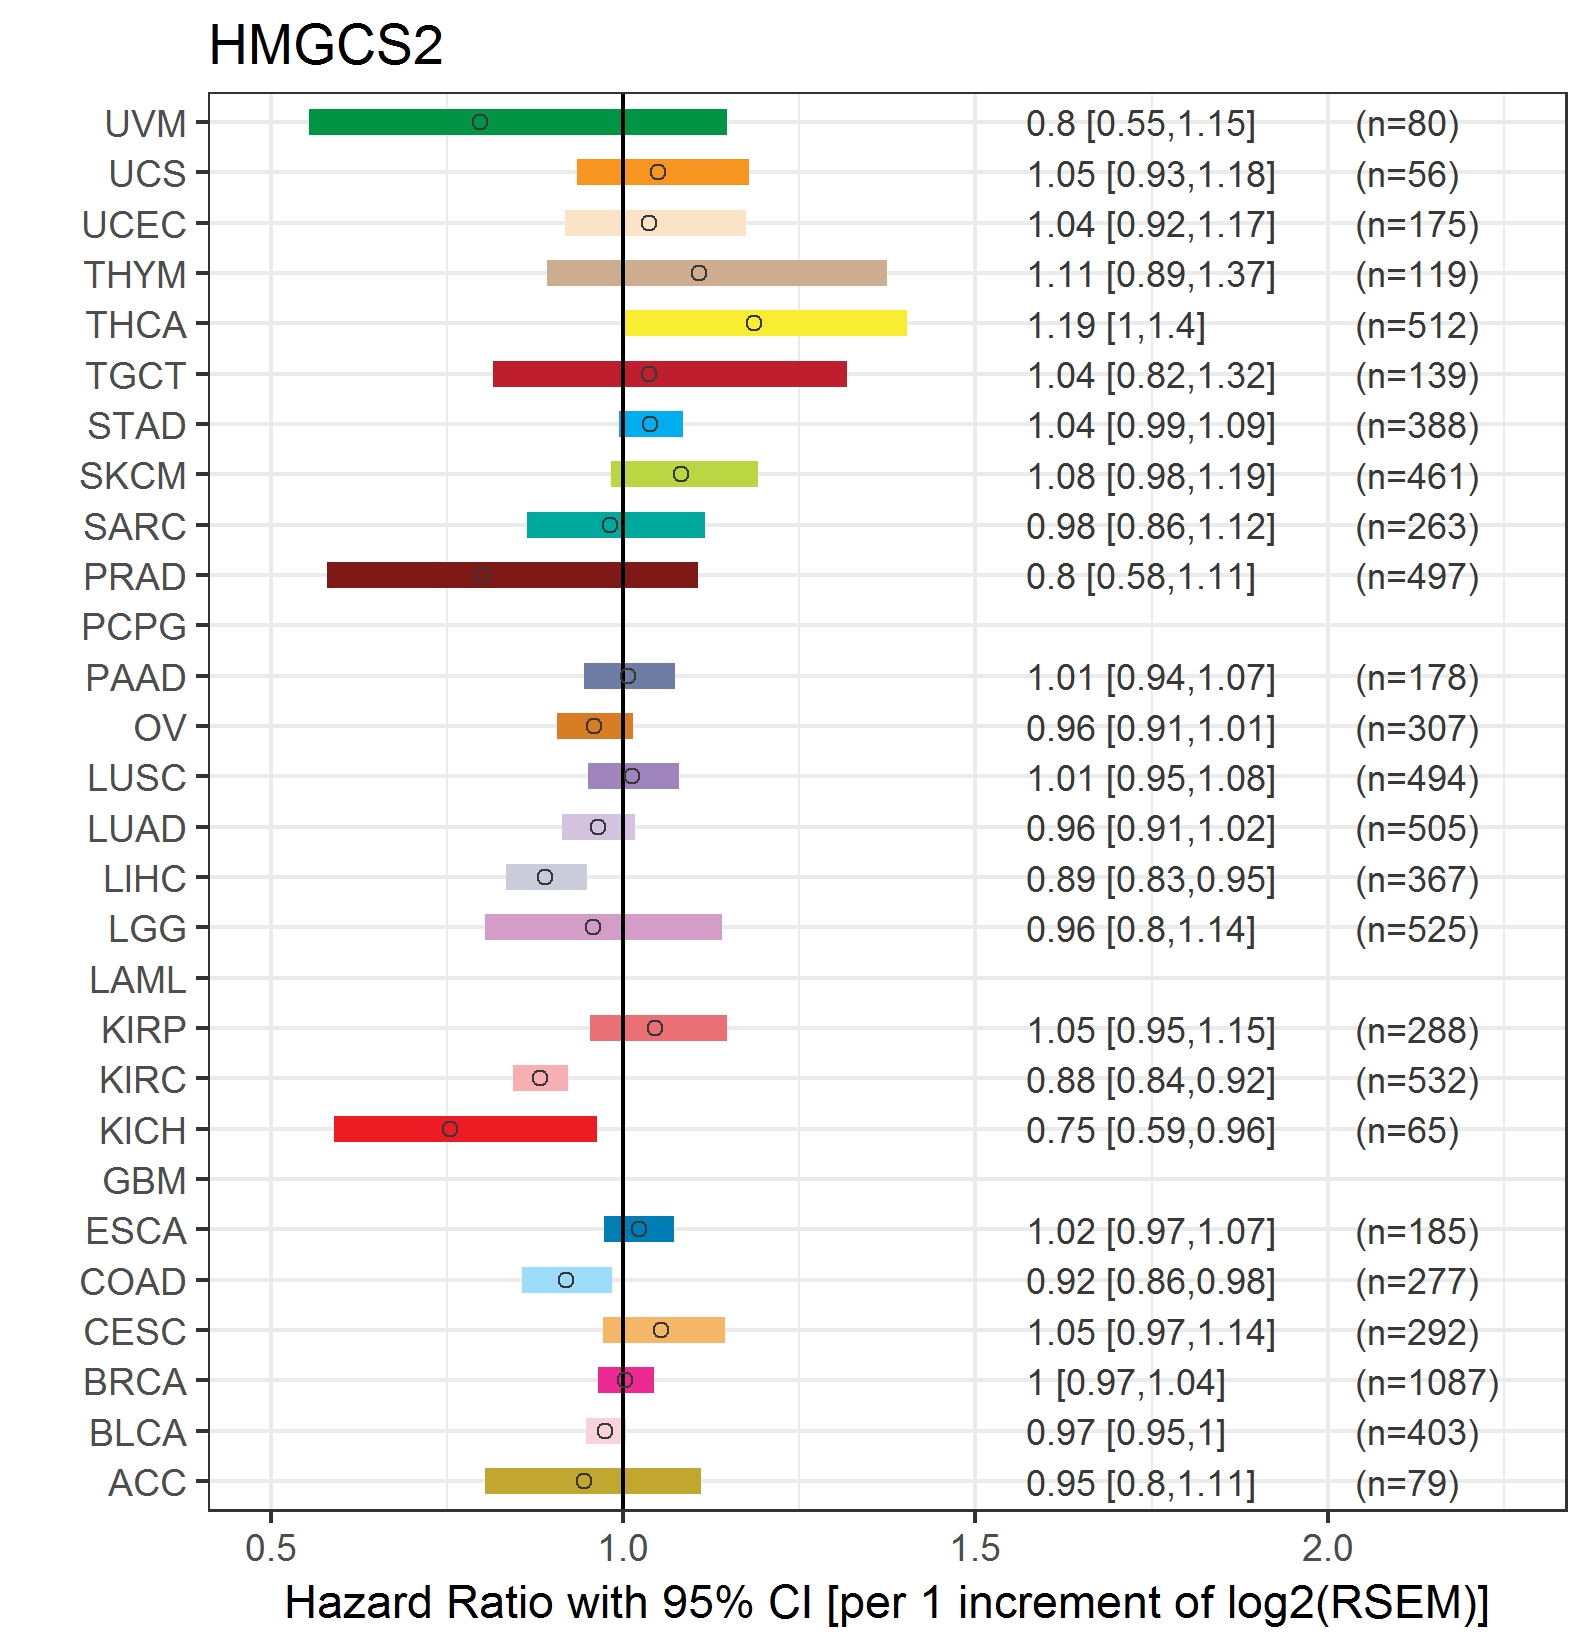
| Forest plot of Cox proportional hazard ratio (HR) and 95% CI of overall survival (OS) using 28 cancer types (TCGA IlluminaHiSeq_RNASeqV2, pan-cancer normalized log2(norm_counts+1) data, version 2016-08-16) (TCGA clinicalMatrix, phenotype data, version 2016-04-27) * Click on the image enlarge it in a new window. |
 |
| Forest plot of Cox proportional hazard ratio (HR) and 95% CI of relapse free survival (RFS) using 28 cancer types (TCGA IlluminaHiSeq_RNASeqV2, pan-cancer normalized log2(norm_counts+1) data, version 2016-08-16) (TCGA clinicalMatrix, phenotype data, version 2016-04-27) * Click on the image enlarge it in a new window. |
 |
| Top |
| TissGeneClin for HMGCS2 |
| TissGeneDrug for HMGCS2 |
| Drug information targeting TissGene (DrugBank Version 5.0.6, 2017-04-01) |
| DrugBank ID | Drug name | Drug activity | Drug type | Drug status |
| Top |
| TissGeneDisease for HMGCS2 |
| Disease information associated with TissGene (DisGeNet, 2016-06-01) |
| Disease ID | Disease name | # pubmeds | Source |
| umls:C2751532 | 3-Hydroxy-3-Methylglutaryl-CoA Synthase 2 Deficiency | 3 | CLINVAR,CTD_human,ORPHANET,UNIPROT |
| umls:C0002395 | Alzheimer's Disease | 2 | GAD |
| umls:C0007102 | Malignant tumor of colon | 2 | BeFree |
| umls:C0003873 | Rheumatoid Arthritis | 1 | GAD |
| umls:C0005398 | Cholestasis, Extrahepatic | 1 | RGD |
| umls:C0006142 | Malignant neoplasm of breast | 1 | BeFree |
| umls:C0007113 | Rectal Carcinoma | 1 | BeFree |
| umls:C0009375 | Colonic Neoplasms | 1 | CTD_human |
| umls:C0010346 | Crohn Disease | 1 | GAD |
| umls:C0011853 | Diabetes Mellitus, Experimental | 1 | RGD |
| umls:C0011854 | Diabetes Mellitus, Insulin-Dependent | 1 | GAD |
| umls:C0011860 | Diabetes Mellitus, Non-Insulin-Dependent | 1 | GAD |
| umls:C0019209 | Hepatomegaly | 1 | RGD |
| umls:C0020538 | Hypertensive disease | 1 | GAD |
| umls:C0023903 | Liver neoplasms | 1 | BeFree |
| umls:C0024305 | Lymphoma, Non-Hodgkin | 1 | GAD |
| umls:C0027627 | Neoplasm Metastasis | 1 | BeFree |
| umls:C0034885 | Rectal Neoplasms | 1 | BeFree |
| umls:C0151744 | Myocardial Ischemia | 1 | CTD_human |
| umls:C0279626 | Squamous cell carcinoma of esophagus | 1 | BeFree |
| umls:C0678222 | Breast Carcinoma | 1 | BeFree |
| umls:C0699790 | Colon Carcinoma | 1 | BeFree |
| umls:C1956346 | Coronary Artery Disease | 1 | GAD |
| umls:C2239176 | Liver carcinoma | 1 | BeFree |
|
Copyright 2016-Present - The University of Texas Health Science Center at Houston (UTHealth) Web File Viewing | How to Report, Fraud, Waste and Abuse | State of Texas | Statewide Search | Texas Homeland Security | Site Policies |