 |
| |
| |
| |
| |
| |
| |
|

| TissGeneSummary for FOXA3 |
 Gene summary Gene summary |
| Basic gene information | Gene symbol | FOXA3 |
| Gene name | forkhead box A3 | |
| Synonyms | FKHH3|HNF3G|TCF3G | |
| Cytomap | UCSC genome browser: 19q13.32 | |
| Type of gene | protein-coding | |
| RefGenes | NM_004497.2, | |
| Description | HNF-3-gammaHNF-3GTCF-3Gfork head-related protein FKH H3forkhead box protein A3hepatocyte nuclear factor 3, gammahepatocyte nuclear factor 3-gammatranscription factor 3G | |
| Modification date | 20141207 | |
| dbXrefs | MIM : 602295 | |
| HGNC : HGNC | ||
| Ensembl : ENSG00000170608 | ||
| HPRD : 03802 | ||
| Vega : OTTHUMG00000182484 | ||
| Protein | UniProt: go to UniProt's Cross Reference DB Table | |
| Expression | CleanEX: HS_FOXA3 | |
| BioGPS: 3171 | ||
| Pathway | NCI Pathway Interaction Database: FOXA3 | |
| KEGG: FOXA3 | ||
| REACTOME: FOXA3 | ||
| Pathway Commons: FOXA3 | ||
| Context | iHOP: FOXA3 | |
| ligand binding site mutation search in PubMed: FOXA3 | ||
| UCL Cancer Institute: FOXA3 | ||
| Assigned class in TissGDB* | C | |
| Included tissue-specific gene expression resources | TiGER,GTEx | |
| Specific-tissues in normal samples (assigned by TissGDB using HPA, TiGER, and GTEx) | ColonLiver | |
| Cancer types related to the specific-tissues in cancer samples (assigned by TissGDB using TCGA) | COADLIHC | |
| Reference showing the relevant tissue of FOXA3 | ||
| Description by TissGene annotations | ||
| * Class A consists of genes with literature evidence and is part of the cTissGenes. Class B consists of only cTissGenes without additional evidence. The remaining genes belong to Class C. |
| Gene ontology having evidence of Inferred from Direct Assay (IDA) from Entrez |
| GO ID | GO term | PubMed ID | GO:0045944 | positive regulation of transcription from RNA polymerase II promoter | 12695546 | GO:0045944 | positive regulation of transcription from RNA polymerase II promoter | 12695546 |
| Top |
| TissGeneExp for FOXA3 |
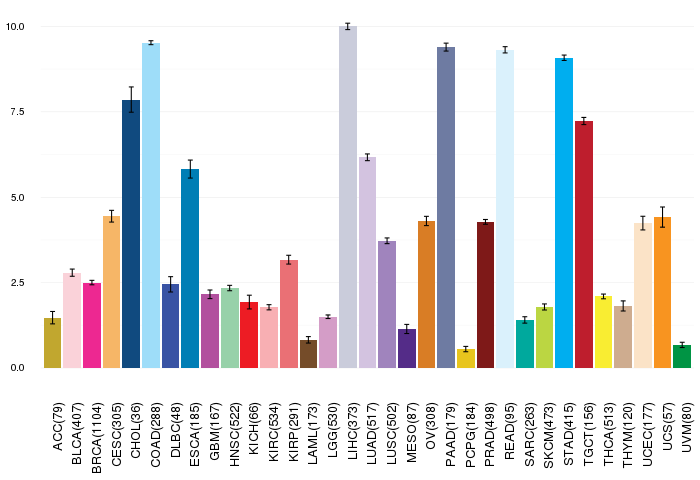
| Gene expressions across 28 cancer types (X-axis: cancer type and Y-axis: log2(norm_counts+1)) (TCGA IlluminaHiSeq_RNASeqV2, pan-cancer normalized log2(norm_counts+1) data, version 2016-08-16) |
 |
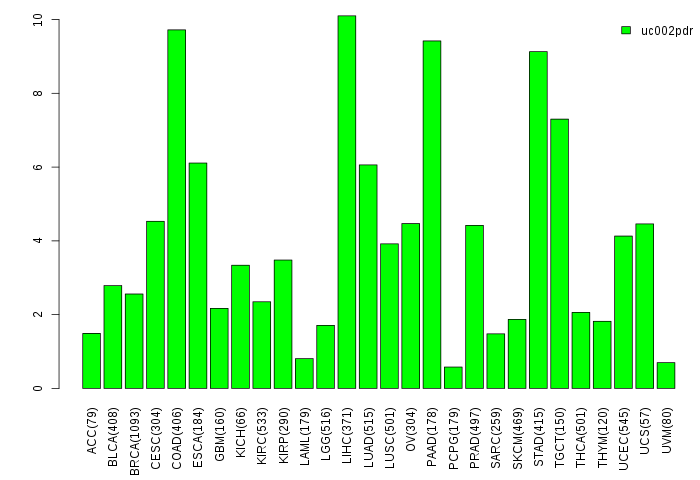
| Gene isoform expressions across 28 cancer types (X-axis: cancer type and Y-axis: log2(norm_counts+1)) (TCGA pan-cancer tcga_rsem_isoform_tpm, version 2016-09-01) |
 |
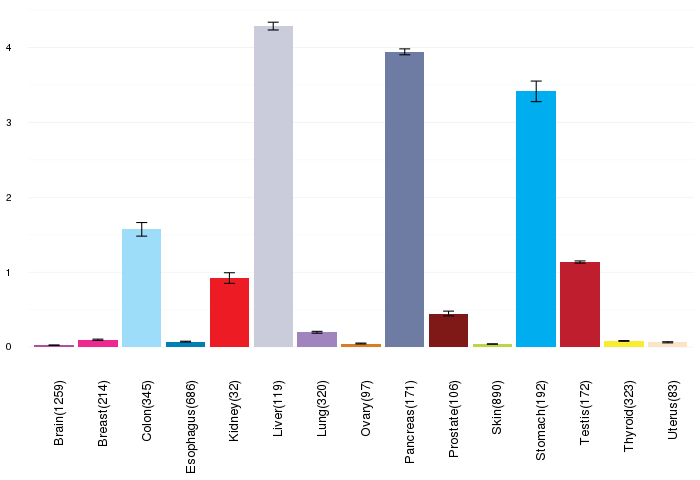
| Gene expressions across normal tissues of GTEx data (GTEx GTEx_Analysis_v6_RNA-seq_RNA-SeQCv1.1.8_gene_rpkm.gct) - Here, we shows the matched tissue types only among our 28 cancer types. |
 |
| Different expressions across 14 cancer types with more than 10 samples between matched tumors and normals (X-axis: cancer type and Y-axis: log2(norm_counts+1)) (TCGA IlluminaHiSeq_RNASeqV2, pan-cancer normalized log2(norm_counts+1) data, version 2016-08-16) |
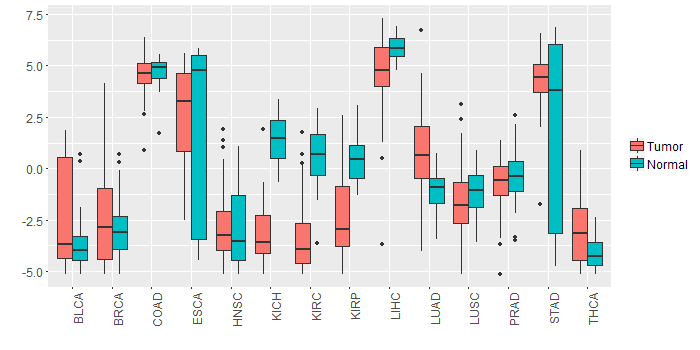 |
| - Significantly differentially expressed cancer types and information. (|Fold change|>1 and FDR<0.05) |
| Cancer type | Mean(exp) in tumor | Mean(exp) in matched normal | Log2FC | P-val. | FDR |
| LIHC | 4.592886837 | 5.904588837 | -1.311702 | 2.02E-05 | 8.00E-05 |
| KIRC | -3.417020775 | 0.656572281 | -4.073593056 | 2.09E-33 | 5.04E-32 |
| KICH | -3.121715163 | 1.423052837 | -4.544768 | 2.61E-14 | 4.23E-13 |
| KIRP | -2.198797163 | 0.446243462 | -2.645040625 | 6.54E-08 | 4.12E-07 |
| THCA | -3.038338689 | -4.144294621 | 1.105955932 | 1.02E-05 | 3.32E-05 |
| LUAD | 0.77581663 | -1.01588337 | 1.7917 | 7.96E-08 | 3.14E-07 |
| STAD | 4.271712212 | 1.862080962 | 2.40963125 | 0.00539 | 0.020615833 |
| Top |
| TissGene-miRNA for FOXA3 |
| Significantly anti-correlated miRNAs of TissGene across 28 cancer types (Gene-miRNA relations from TargetScanHuman Relsease 7.1, Conserved_Site_Context_Scores.txt.zip, 06.01.2016) (TCGA IlluminaHiSeq_miRNASeq, log2(RPM+1) data, version 2016-11-21) (TCGA IlluminaHiSeq_RNASeqV2, log2(normalized_count+1) data, version 2016-08-16) (Spearman’s Rank Correlation (p-value<0.05 and coefficient<-0.25)) |
| Cancer type | miRNA id | miRNA accession | P-val. | Coeff. | # samples |
| Top |
| TissGeneMut for FOXA3 |
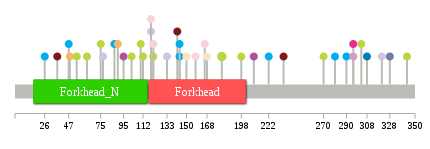
| TissGeneSNV for FOXA3 |
| nsSNV counts per each loci. Different colors of circles represent different cancer types. Circle size denotes number of samples. (TCGA somatic mutation (SNPs and small INDELs) data, version 2016-04-25) * Click on the image to enlarge it in a new window. |
 |
 |
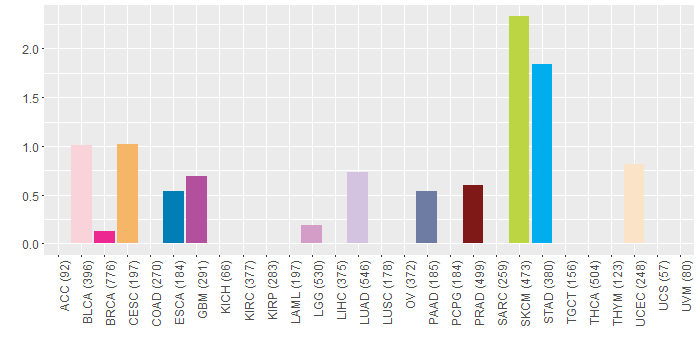
| Somatic nucleotide variants of TissGene across 28 cancer types (X-axis: cancer type and Y-axis: % of mutated samples) The numbers in parentheses are numbers of samples with mutation (nsSNVs). (TCGA somatic mutation (SNPs and small INDELs) data, version 2016-04-25) |
 |
| - nsSNVs sorted by frequency. |
| AAchange | Cancer type | # samples |
| p.S181F | SKCM | 2 |
| p.G54E | SKCM | 1 |
| p.A244T | DLBC | 1 |
| p.R209H | GBM | 1 |
| p.G75E | SKCM | 1 |
| p.S343F | SKCM | 1 |
| p.Q158* | BLCA | 1 |
| p.G102E | SKCM | 1 |
| p.T280A | STAD | 1 |
| p.S343F | HNSC | 1 |
| p.S48C | CESC | 1 |
| p.G63R | SKCM | 1 |
| p.T77A | LUAD | 1 |
| p.G290E | STAD | 1 |
| p.A296V | LGG | 1 |
| p.A133T | LUAD | 1 |
| p.S47G | STAD | 1 |
| p.S121C | BLCA | 1 |
| p.N308K | ESCA | 1 |
| p.L150F | UCEC | 1 |
| p.G222E | STAD | 1 |
| p.P119L | LUAD | 1 |
| p.E142D | PRAD | 1 |
| p.S87G | STAD | 1 |
| p.P95L | GBM | 1 |
| p.S168L | UCEC | 1 |
| p.P303H | SKCM | 1 |
| p.Y144* | STAD | 1 |
| p.S26L | STAD | 1 |
| p.L37I | PRAD | 1 |
| p.A270V | SKCM | 1 |
| p.R110W | SKCM | 1 |
| p.G328R | PAAD | 1 |
| p.G198E | SKCM | 1 |
| p.D321Y | LUAD | 1 |
| p.S121F | SKCM | 1 |
| p.S90F | CESC | 1 |
| p.G235R | PRAD | 1 |
| p.P119L | BLCA | 1 |
| p.Y144X | STAD | 1 |
| p.A296V | BRCA | 1 |
| p.P112L | SKCM | 1 |
| p.R166C | BLCA | 1 |
| Top |
| TissGeneCNV for FOXA3 |
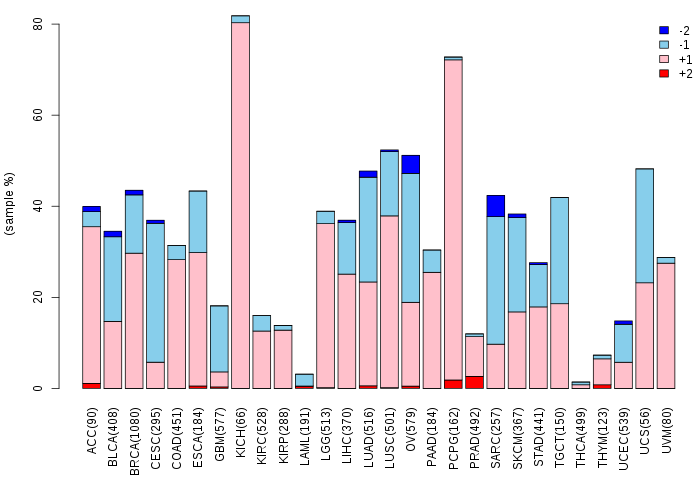
| Copy number variations of TissGene across 28 cancer types (X-axis: cancer type and Y-axis: % of CNV samples) (TCGA Gistic2_CopyNumber_Gistic2_all_data_by_genes, Gistic2 copy number data, version 2016-08-16) |
 |
| Top |
| TissGeneFusions for FOXA3 |
| Fusion genes including TissGene (ChimerDB 3.0, 2016-12-01 and TCGA fusion Portal 2015-12-01) |
| Database | Src | Cancer type | Sample | Fusion gene | ORF | 5'-gene BP | 3'-gene BP |
| Chimerdb3.0 | TopHat-Fusion | UCEC | TCGA-PG-A915-01A | URI1-FOXA3 | Out-of-Frame | chr19:30477323 | chr19:46375332 |
| Top |
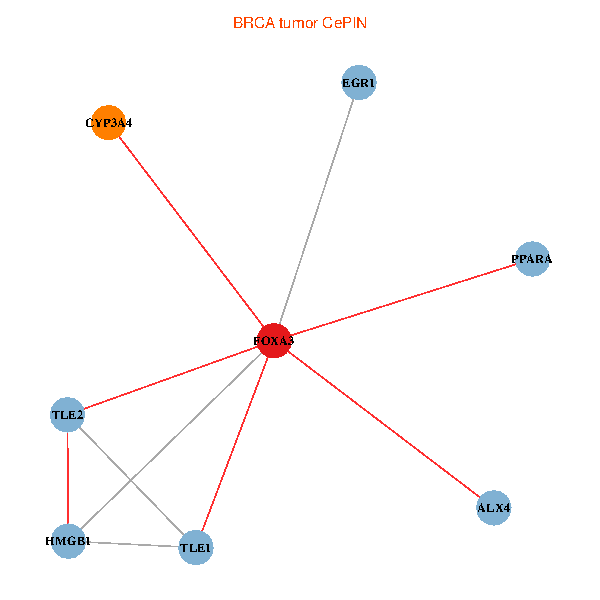
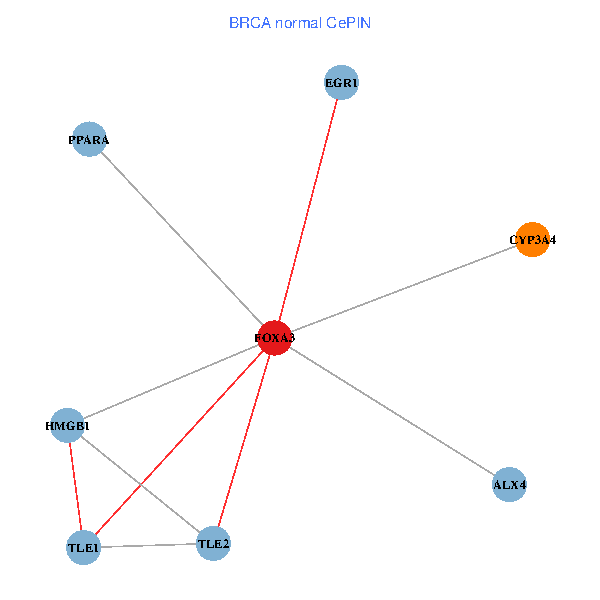
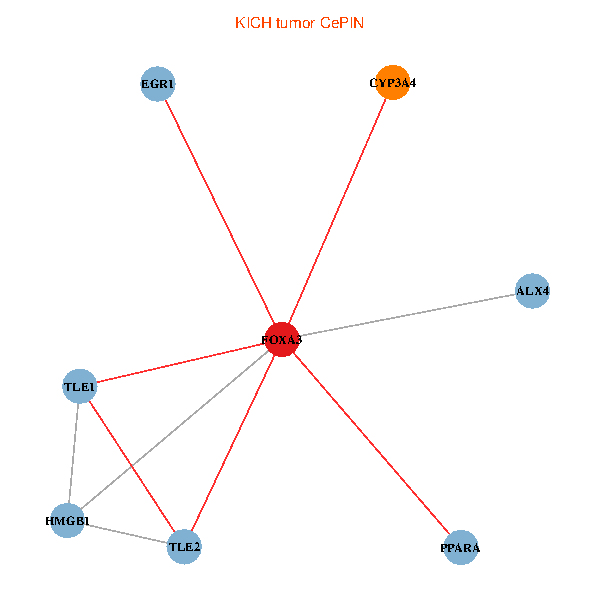
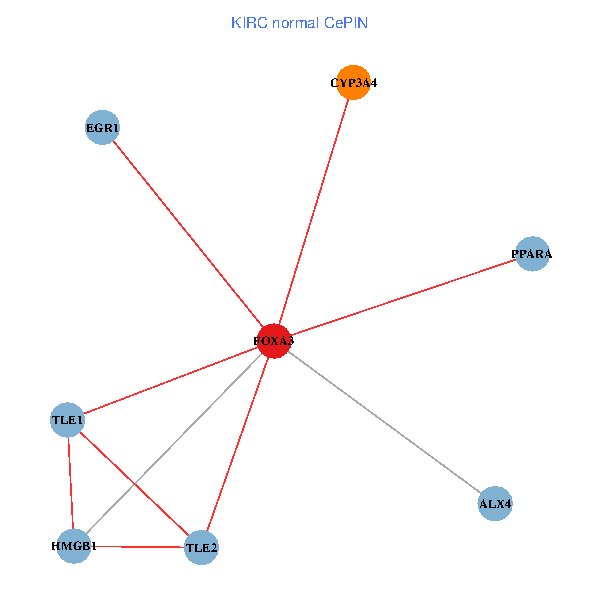
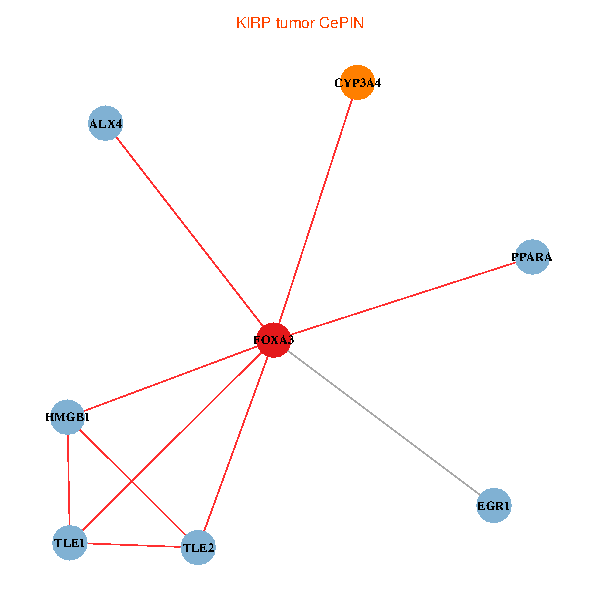
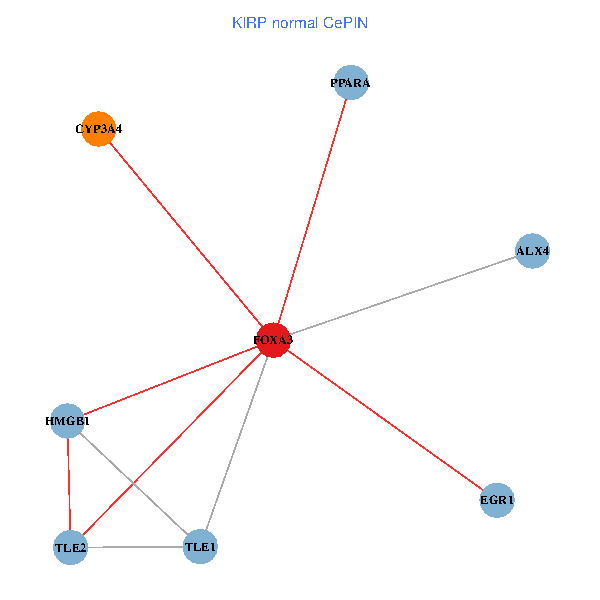
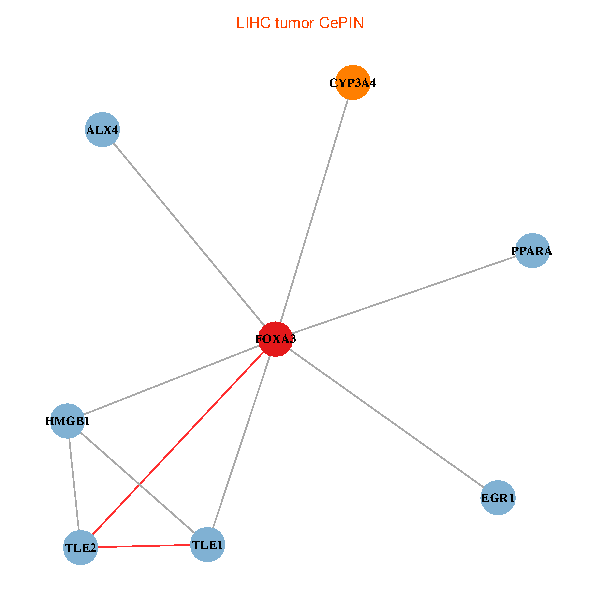
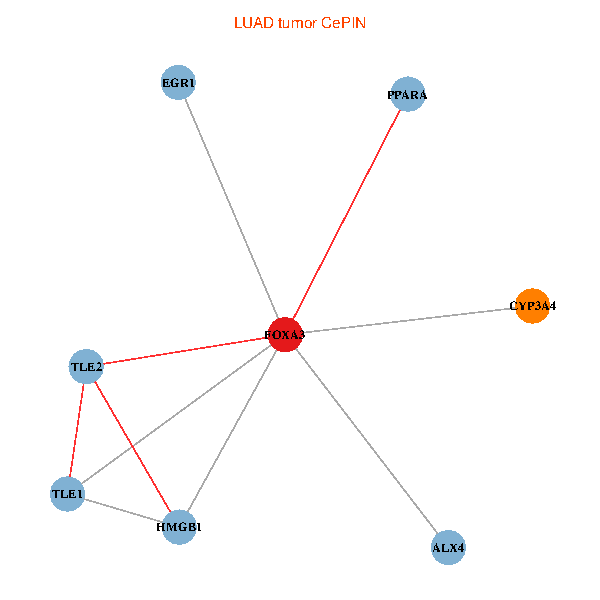
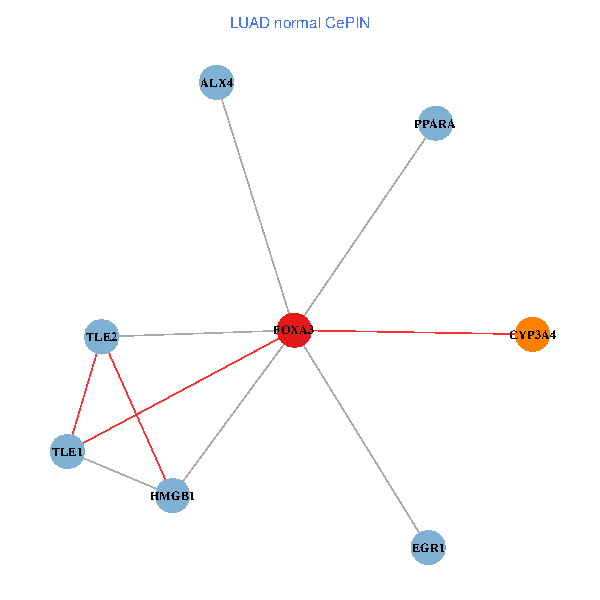
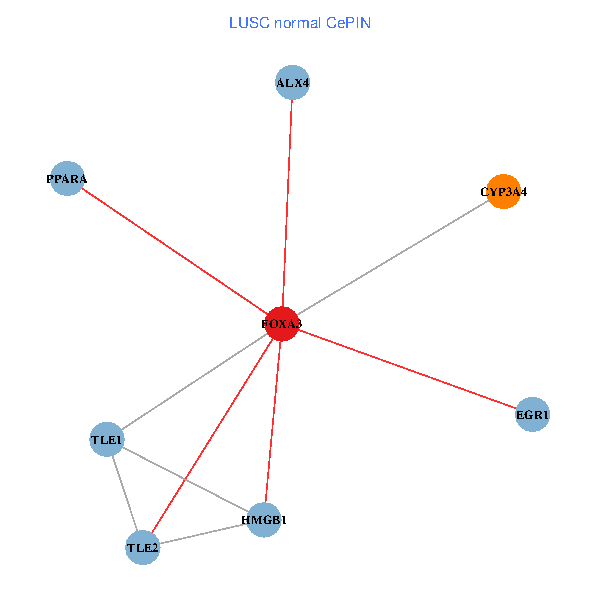
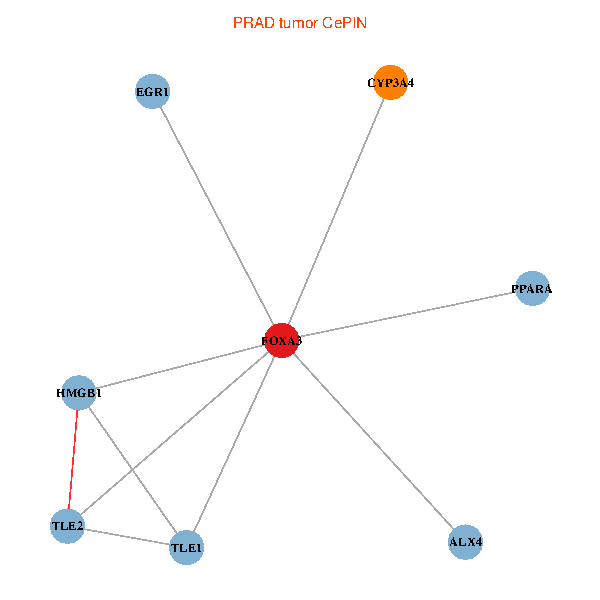
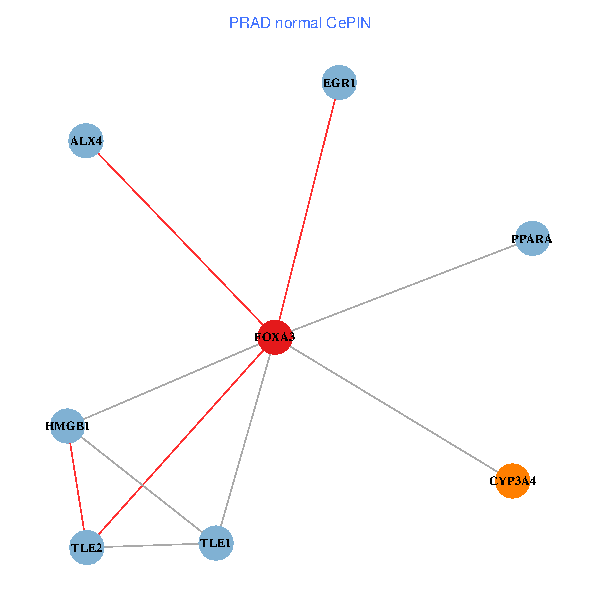
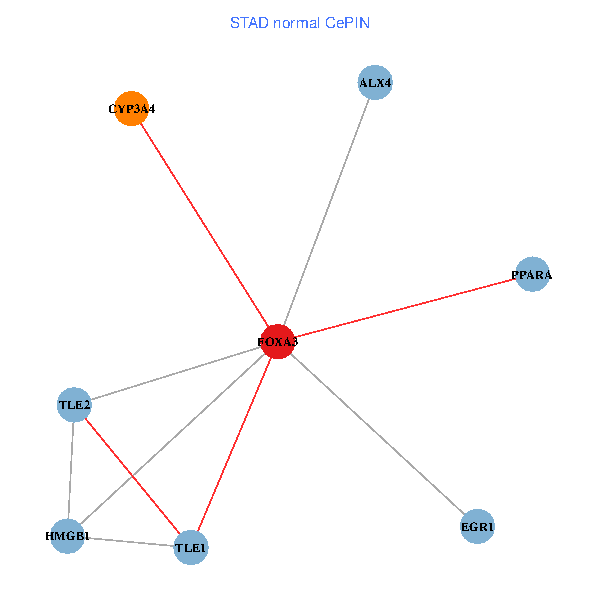
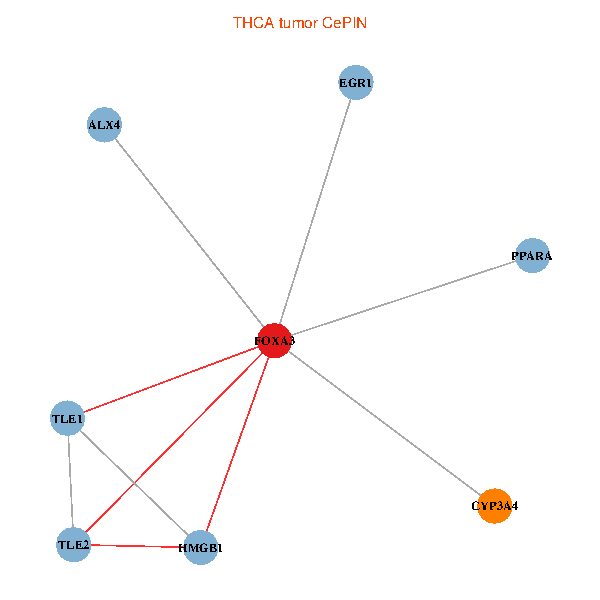
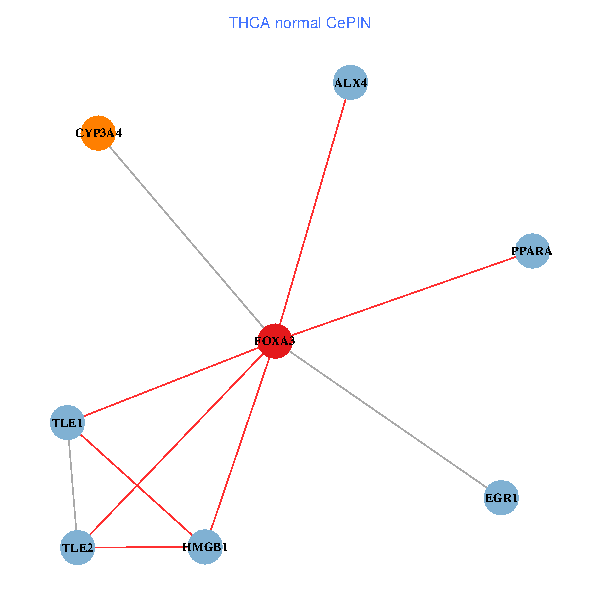
| TissGeneNet for FOXA3 |
| Co-expressed gene networks based on protein-protein interaction data (CePIN) (TCGA IlluminaHiSeq_RNASeqV2, pan-cancer normalized log2(norm_counts+1) data, version 2016-08-16) (PINA2 ppi data) |
| BRCA (tumor) | BRCA (normal) |
| FOXA3, HMGB1, TLE2, EGR1, PPARA, TLE1, CYP3A4, ALX4 (tumor) | FOXA3, HMGB1, TLE2, EGR1, PPARA, TLE1, CYP3A4, ALX4 (normal) |
 |  |
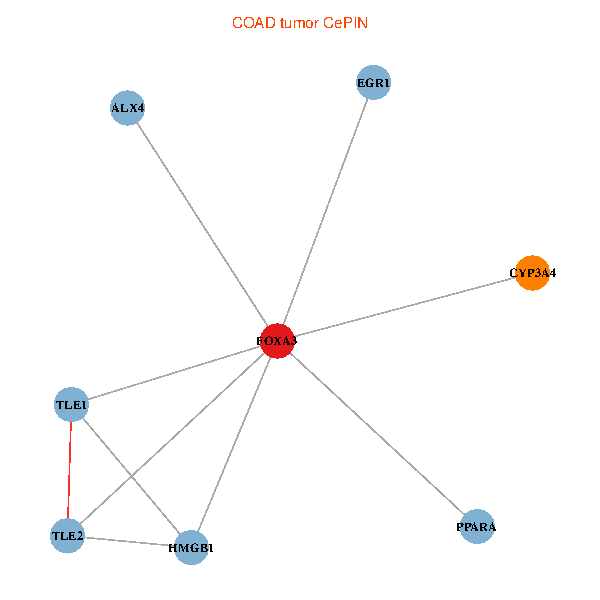
| COAD (tumor) | COAD (normal) |
| FOXA3, HMGB1, TLE2, EGR1, PPARA, TLE1, CYP3A4, ALX4 (tumor) | FOXA3, HMGB1, TLE2, EGR1, PPARA, TLE1, CYP3A4, ALX4 (normal) |
 |  |
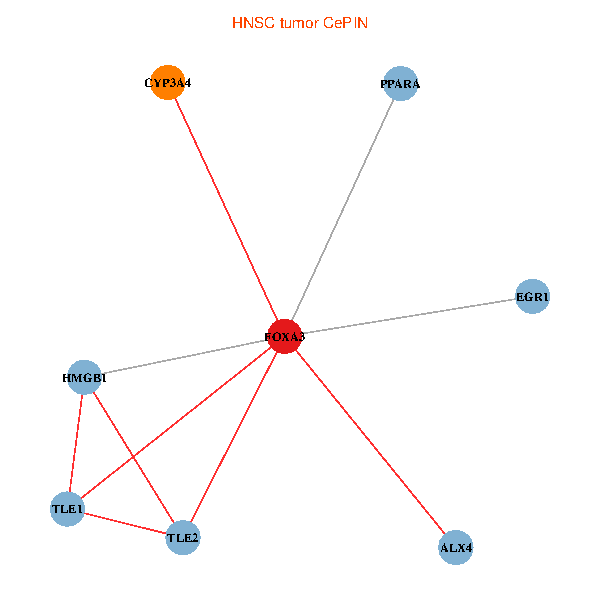
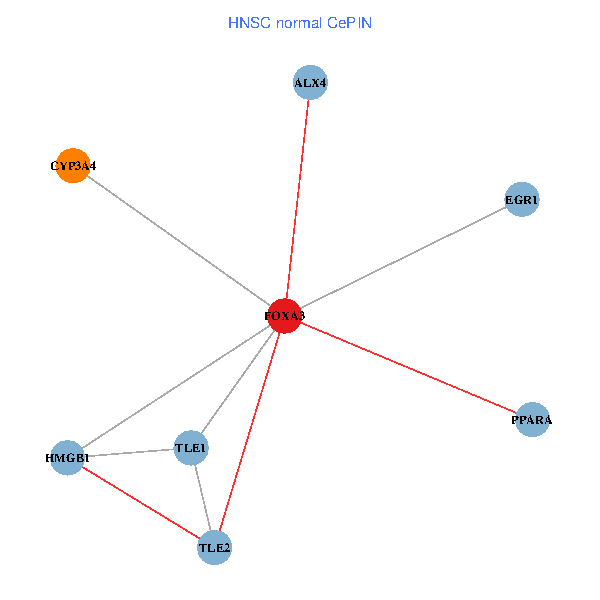
| HNSC (tumor) | HNSC (normal) |
| FOXA3, HMGB1, TLE2, EGR1, PPARA, TLE1, CYP3A4, ALX4 (tumor) | FOXA3, HMGB1, TLE2, EGR1, PPARA, TLE1, CYP3A4, ALX4 (normal) |
 |  |
| KICH (tumor) | KICH (normal) |
| FOXA3, HMGB1, TLE2, EGR1, PPARA, TLE1, CYP3A4, ALX4 (tumor) | FOXA3, HMGB1, TLE2, EGR1, PPARA, TLE1, CYP3A4, ALX4 (normal) |
 |  |
| KIRC (tumor) | KIRC (normal) |
| FOXA3, HMGB1, TLE2, EGR1, PPARA, TLE1, CYP3A4, ALX4 (tumor) | FOXA3, HMGB1, TLE2, EGR1, PPARA, TLE1, CYP3A4, ALX4 (normal) |
 |  |
| KIRP (tumor) | KIRP (normal) |
| FOXA3, HMGB1, TLE2, EGR1, PPARA, TLE1, CYP3A4, ALX4 (tumor) | FOXA3, HMGB1, TLE2, EGR1, PPARA, TLE1, CYP3A4, ALX4 (normal) |
 |  |
| LIHC (tumor) | LIHC (normal) |
| FOXA3, HMGB1, TLE2, EGR1, PPARA, TLE1, CYP3A4, ALX4 (tumor) | FOXA3, HMGB1, TLE2, EGR1, PPARA, TLE1, CYP3A4, ALX4 (normal) |
 |  |
| LUAD (tumor) | LUAD (normal) |
| FOXA3, HMGB1, TLE2, EGR1, PPARA, TLE1, CYP3A4, ALX4 (tumor) | FOXA3, HMGB1, TLE2, EGR1, PPARA, TLE1, CYP3A4, ALX4 (normal) |
 |  |
| LUSC (tumor) | LUSC (normal) |
| FOXA3, HMGB1, TLE2, EGR1, PPARA, TLE1, CYP3A4, ALX4 (tumor) | FOXA3, HMGB1, TLE2, EGR1, PPARA, TLE1, CYP3A4, ALX4 (normal) |
 |  |
| PRAD (tumor) | PRAD (normal) |
| FOXA3, HMGB1, TLE2, EGR1, PPARA, TLE1, CYP3A4, ALX4 (tumor) | FOXA3, HMGB1, TLE2, EGR1, PPARA, TLE1, CYP3A4, ALX4 (normal) |
 |  |
| STAD (tumor) | STAD (normal) |
| FOXA3, HMGB1, TLE2, EGR1, PPARA, TLE1, CYP3A4, ALX4 (tumor) | FOXA3, HMGB1, TLE2, EGR1, PPARA, TLE1, CYP3A4, ALX4 (normal) |
 |  |
| THCA (tumor) | THCA (normal) |
| FOXA3, HMGB1, TLE2, EGR1, PPARA, TLE1, CYP3A4, ALX4 (tumor) | FOXA3, HMGB1, TLE2, EGR1, PPARA, TLE1, CYP3A4, ALX4 (normal) |
 |  |
| Top |
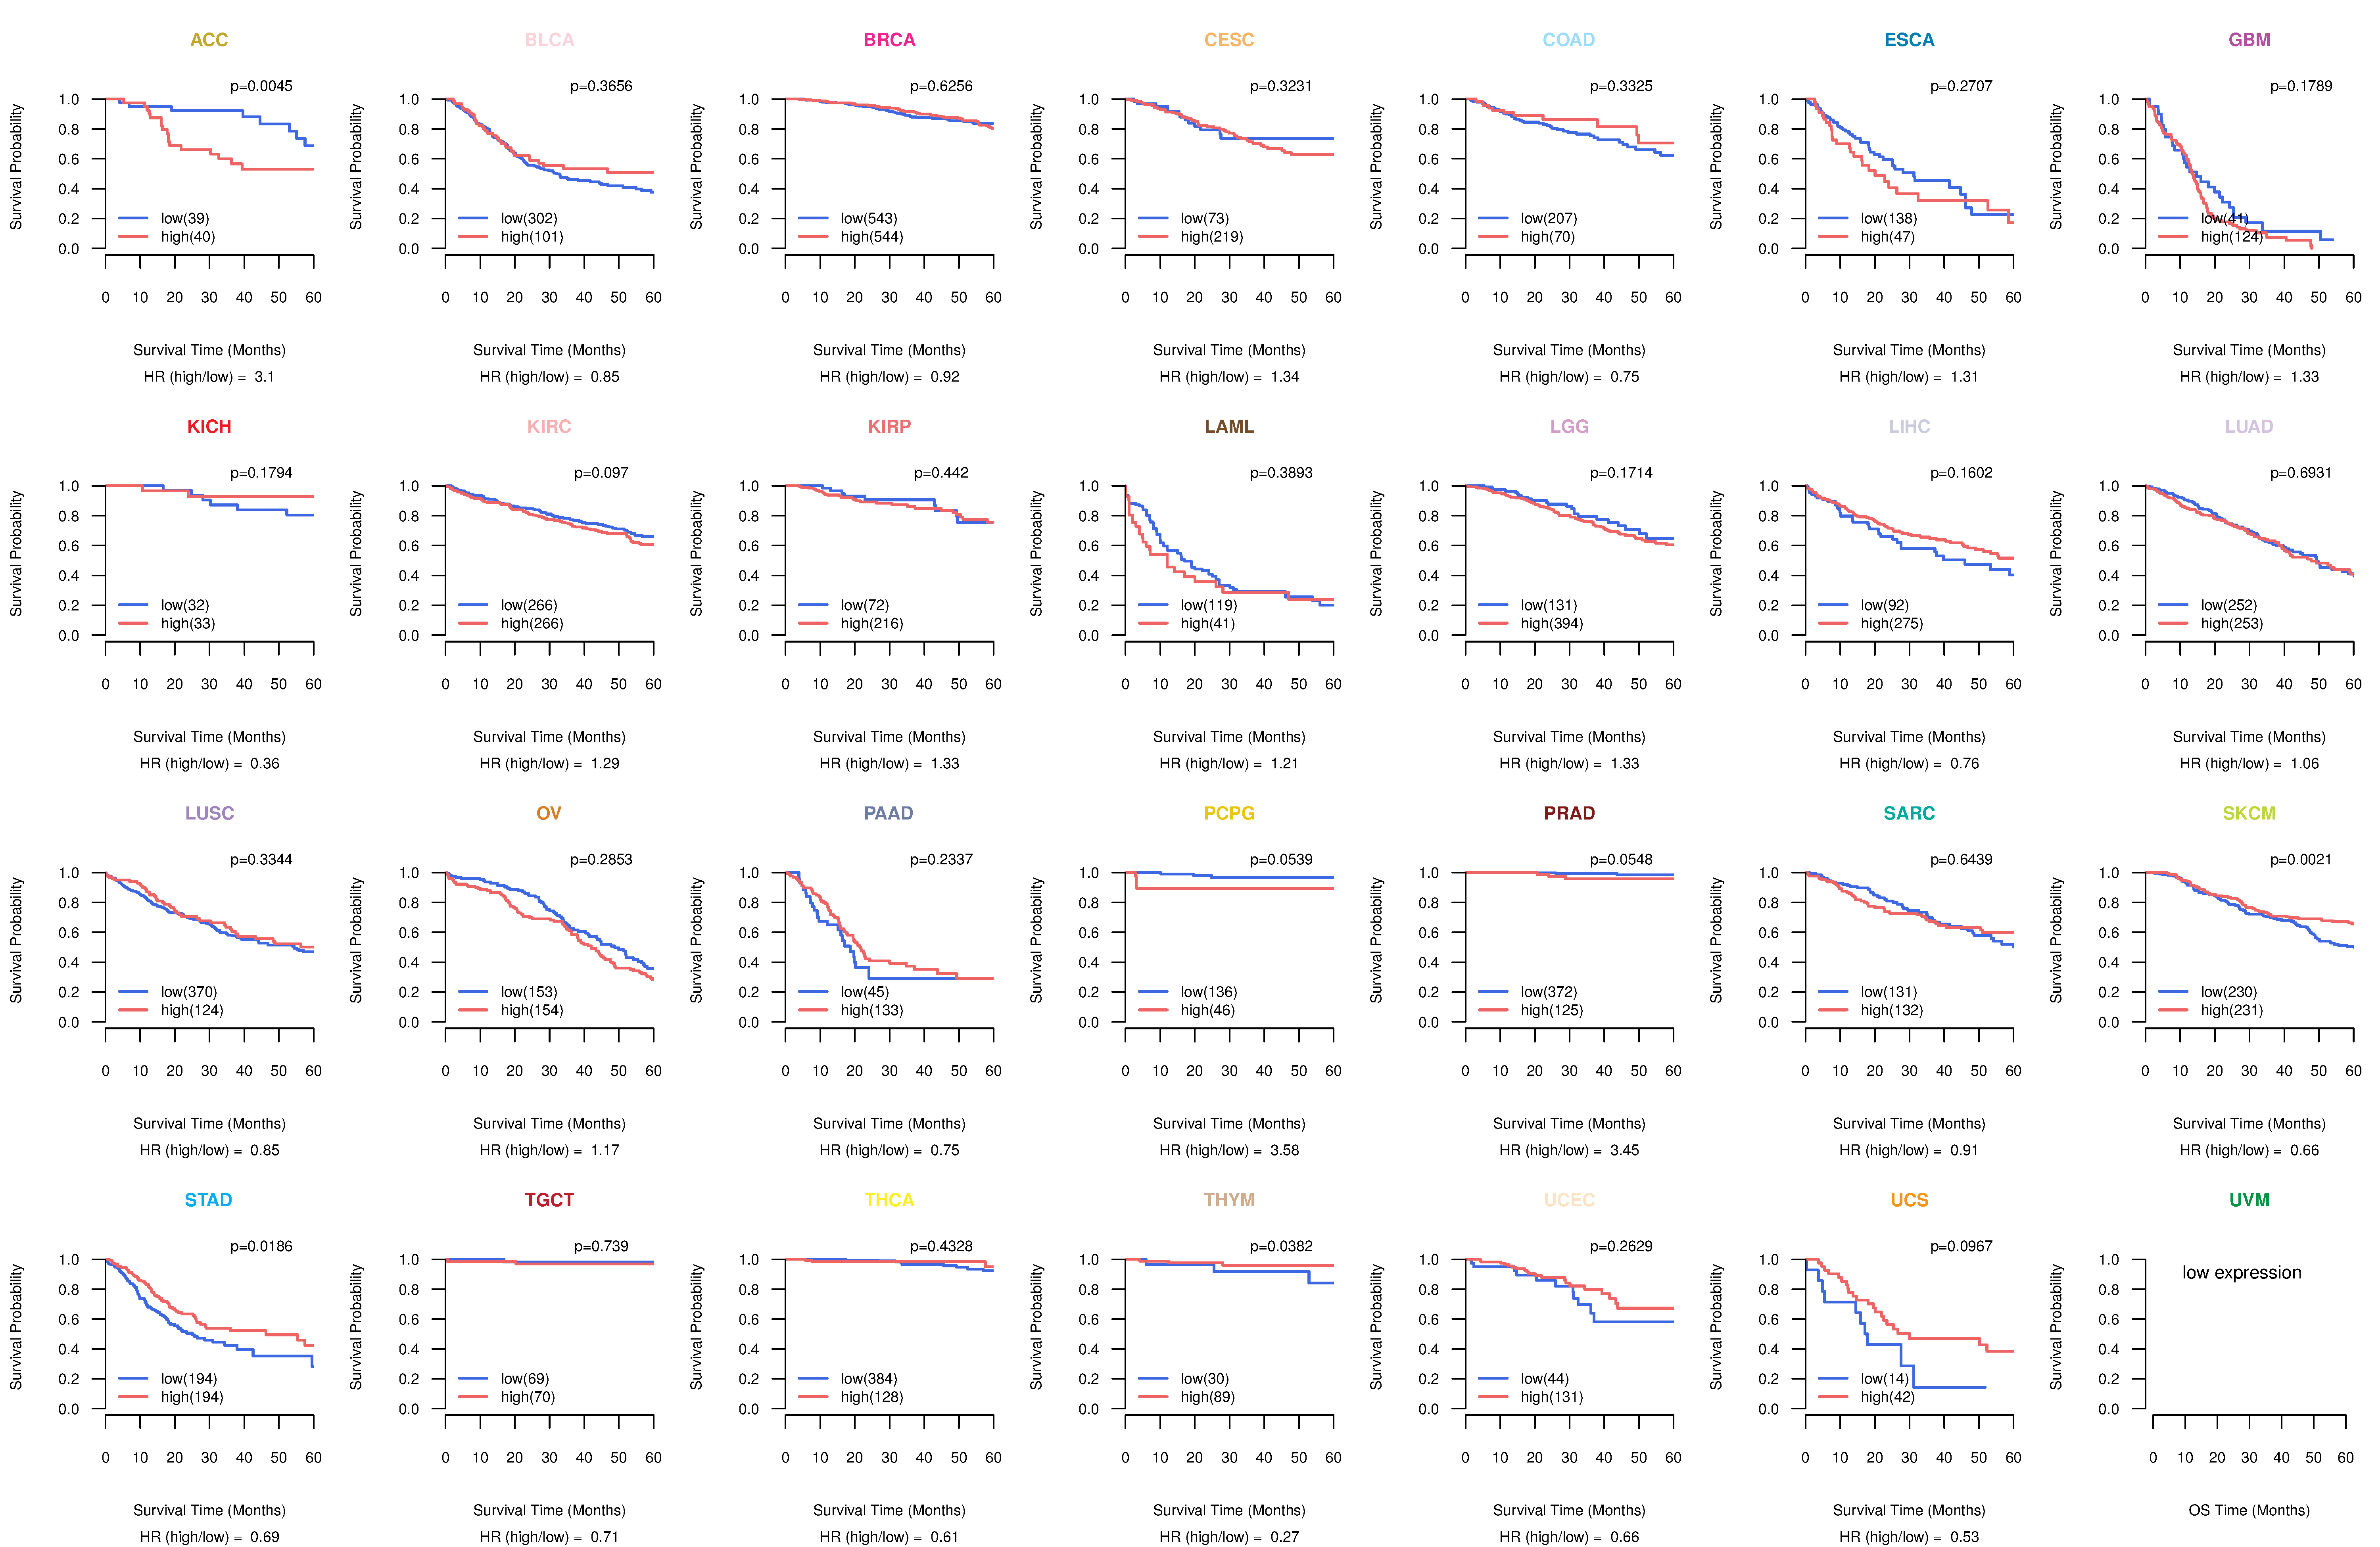
| TissGeneProg for FOXA3 |
| Kaplan-Meier plots with logrank tests of overall survival (OS) using 28 cancer types (TCGA IlluminaHiSeq_RNASeqV2, pan-cancer normalized log2(norm_counts+1) data, version 2016-08-16) (TCGA clinicalMatrix, phenotype data, version 2016-04-27) * Click on the image to enlarge it in a new window. |
 |
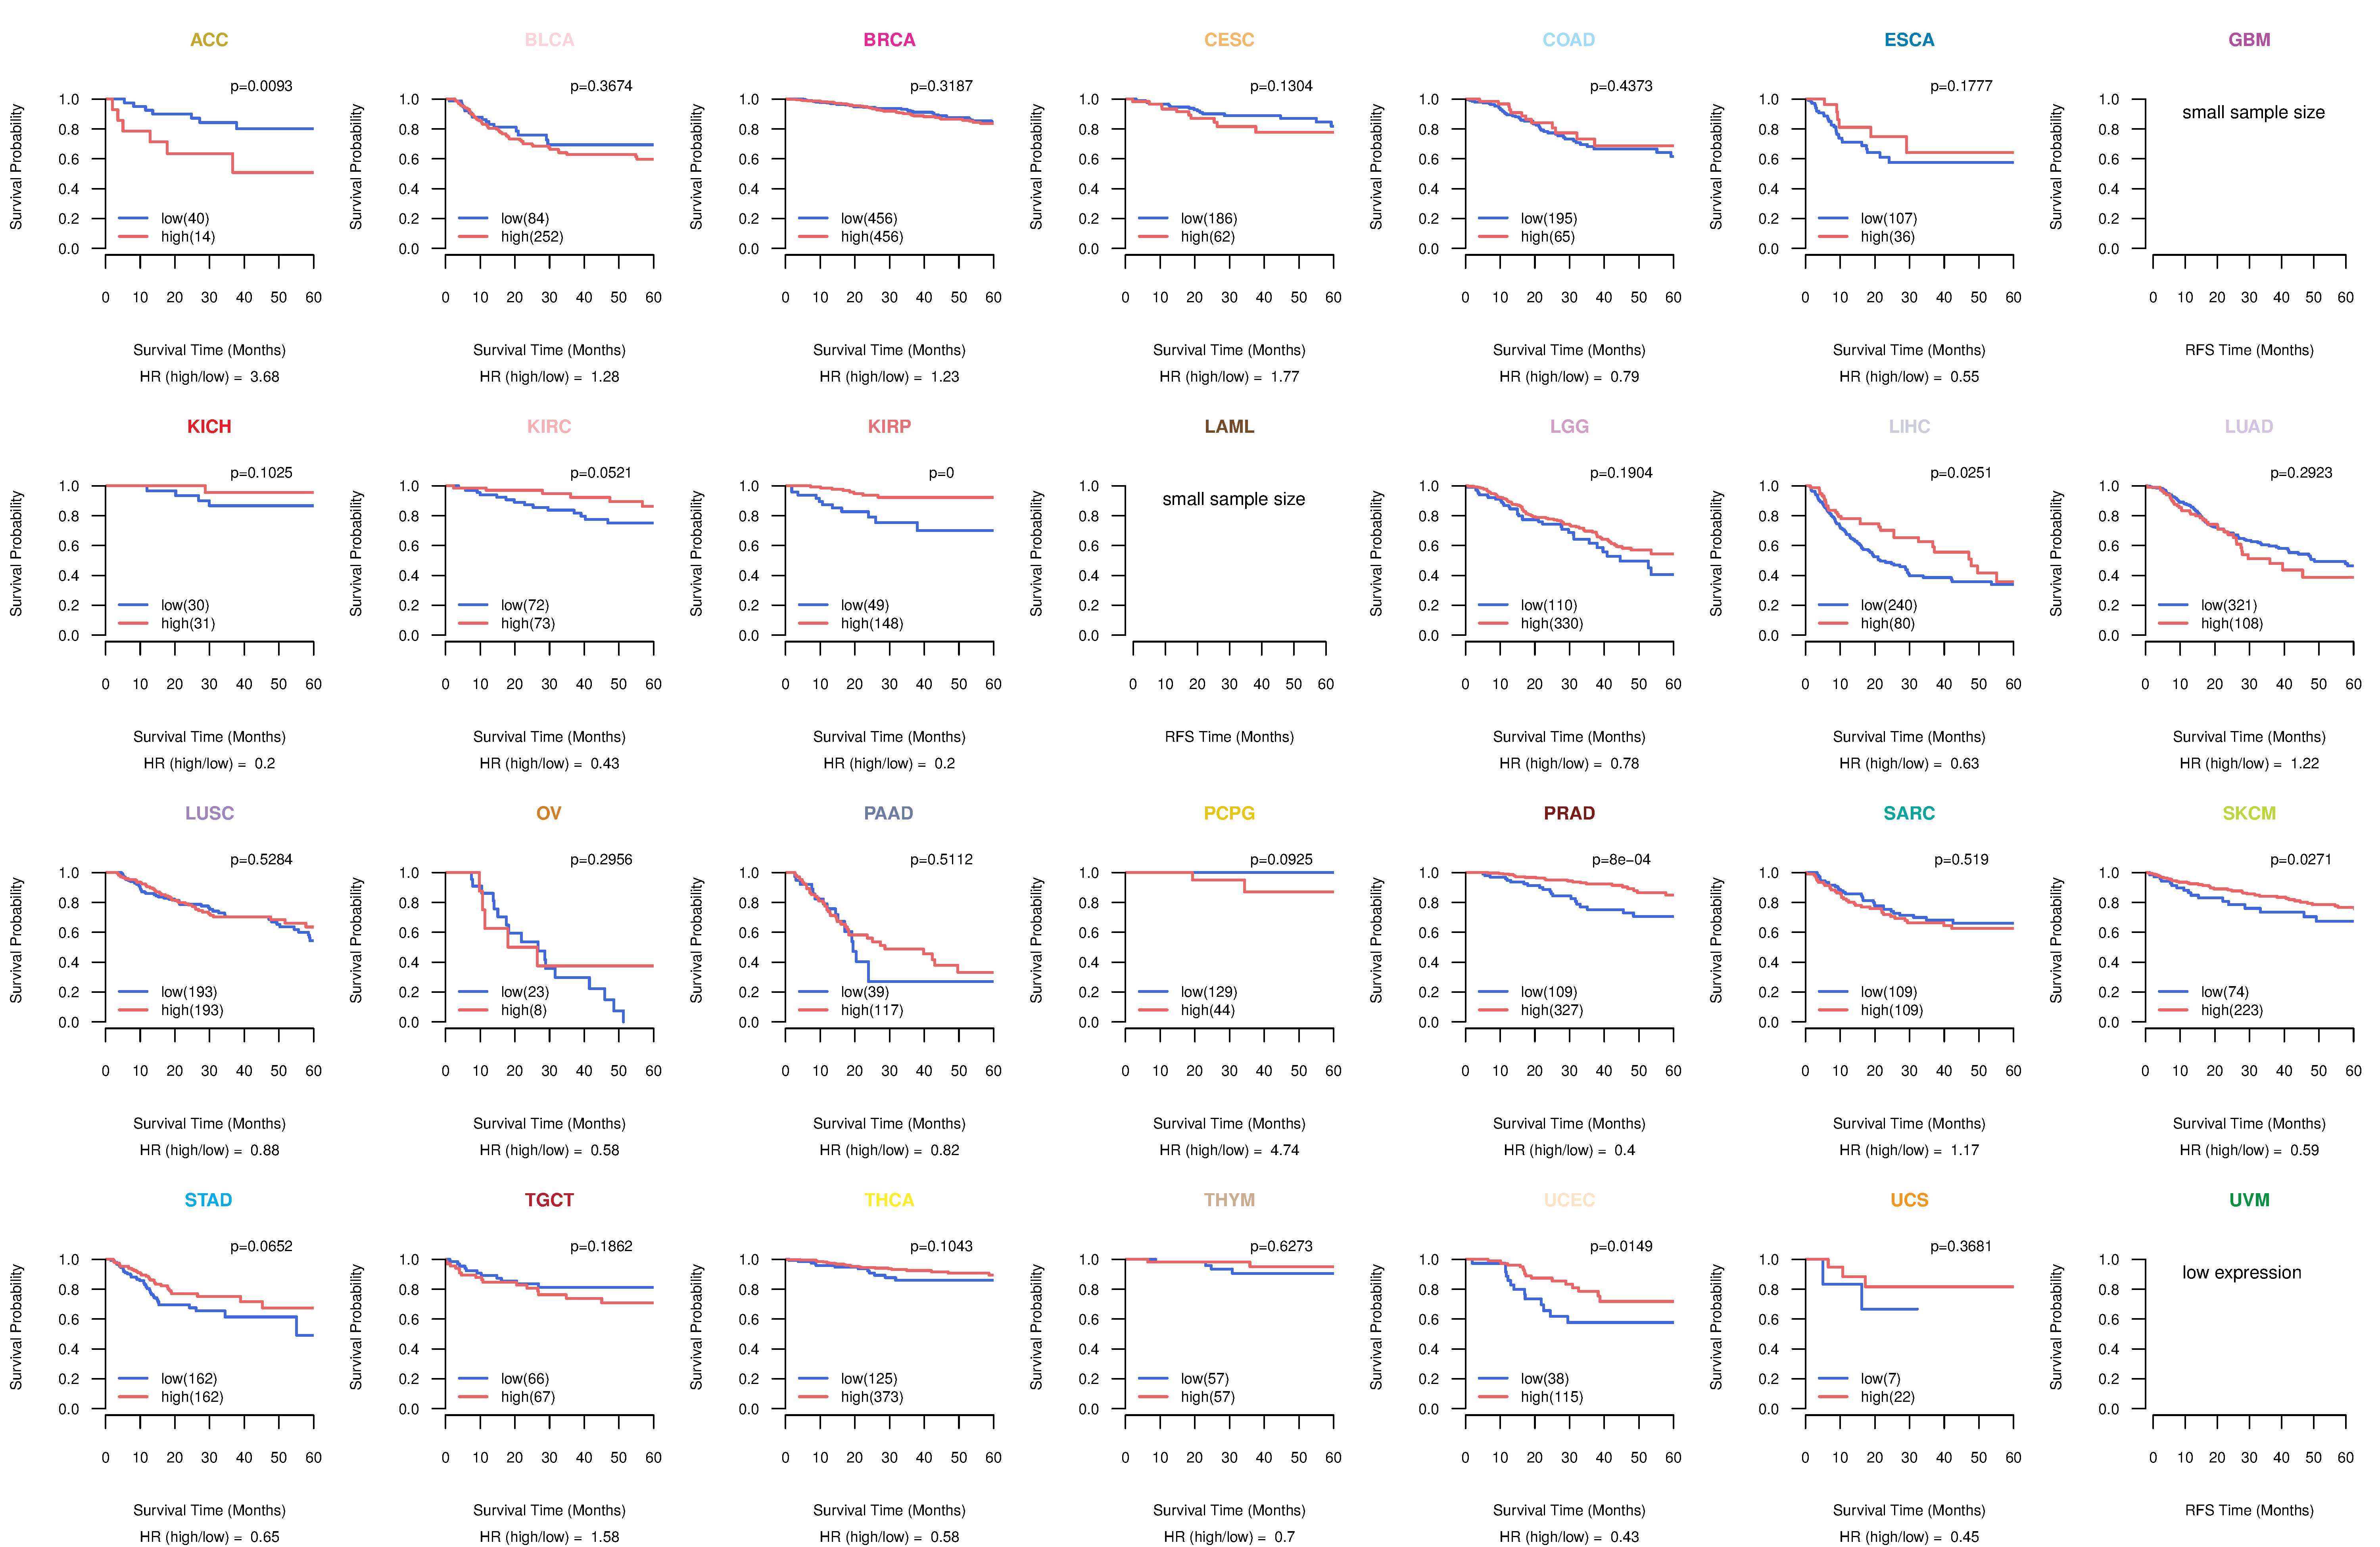
| Kaplan-Meier plots with logrank test of relapse free survival (RFS) using 28 cancer types (TCGA IlluminaHiSeq_RNASeqV2, pan-cancer normalized log2(norm_counts+1) data, version 2016-08-16) (TCGA clinicalMatrix, phenotype data, version 2016-04-27) * Click on the image enlarge it in a new window. |
 |
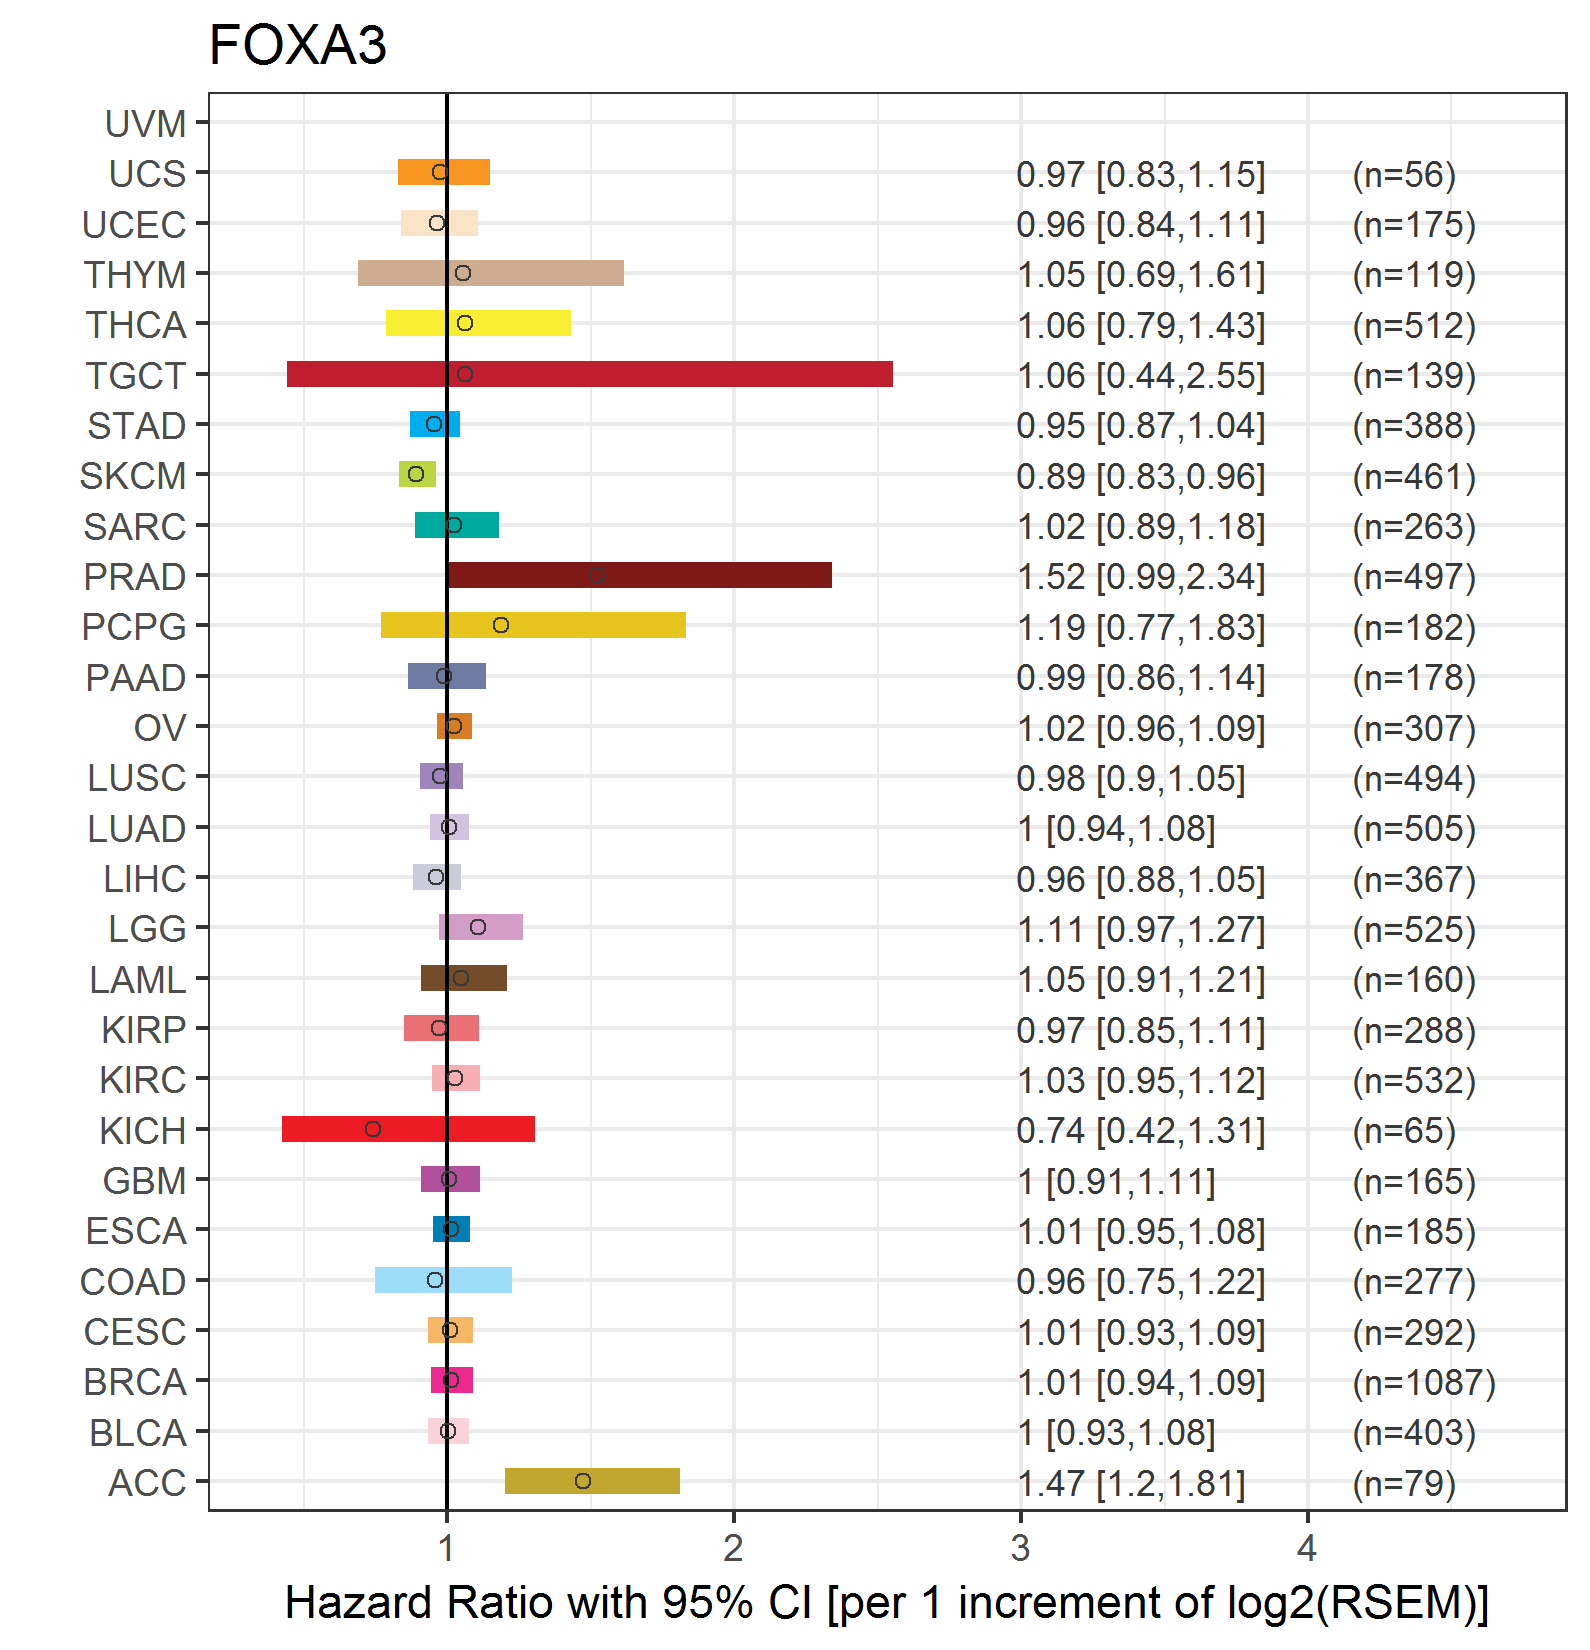
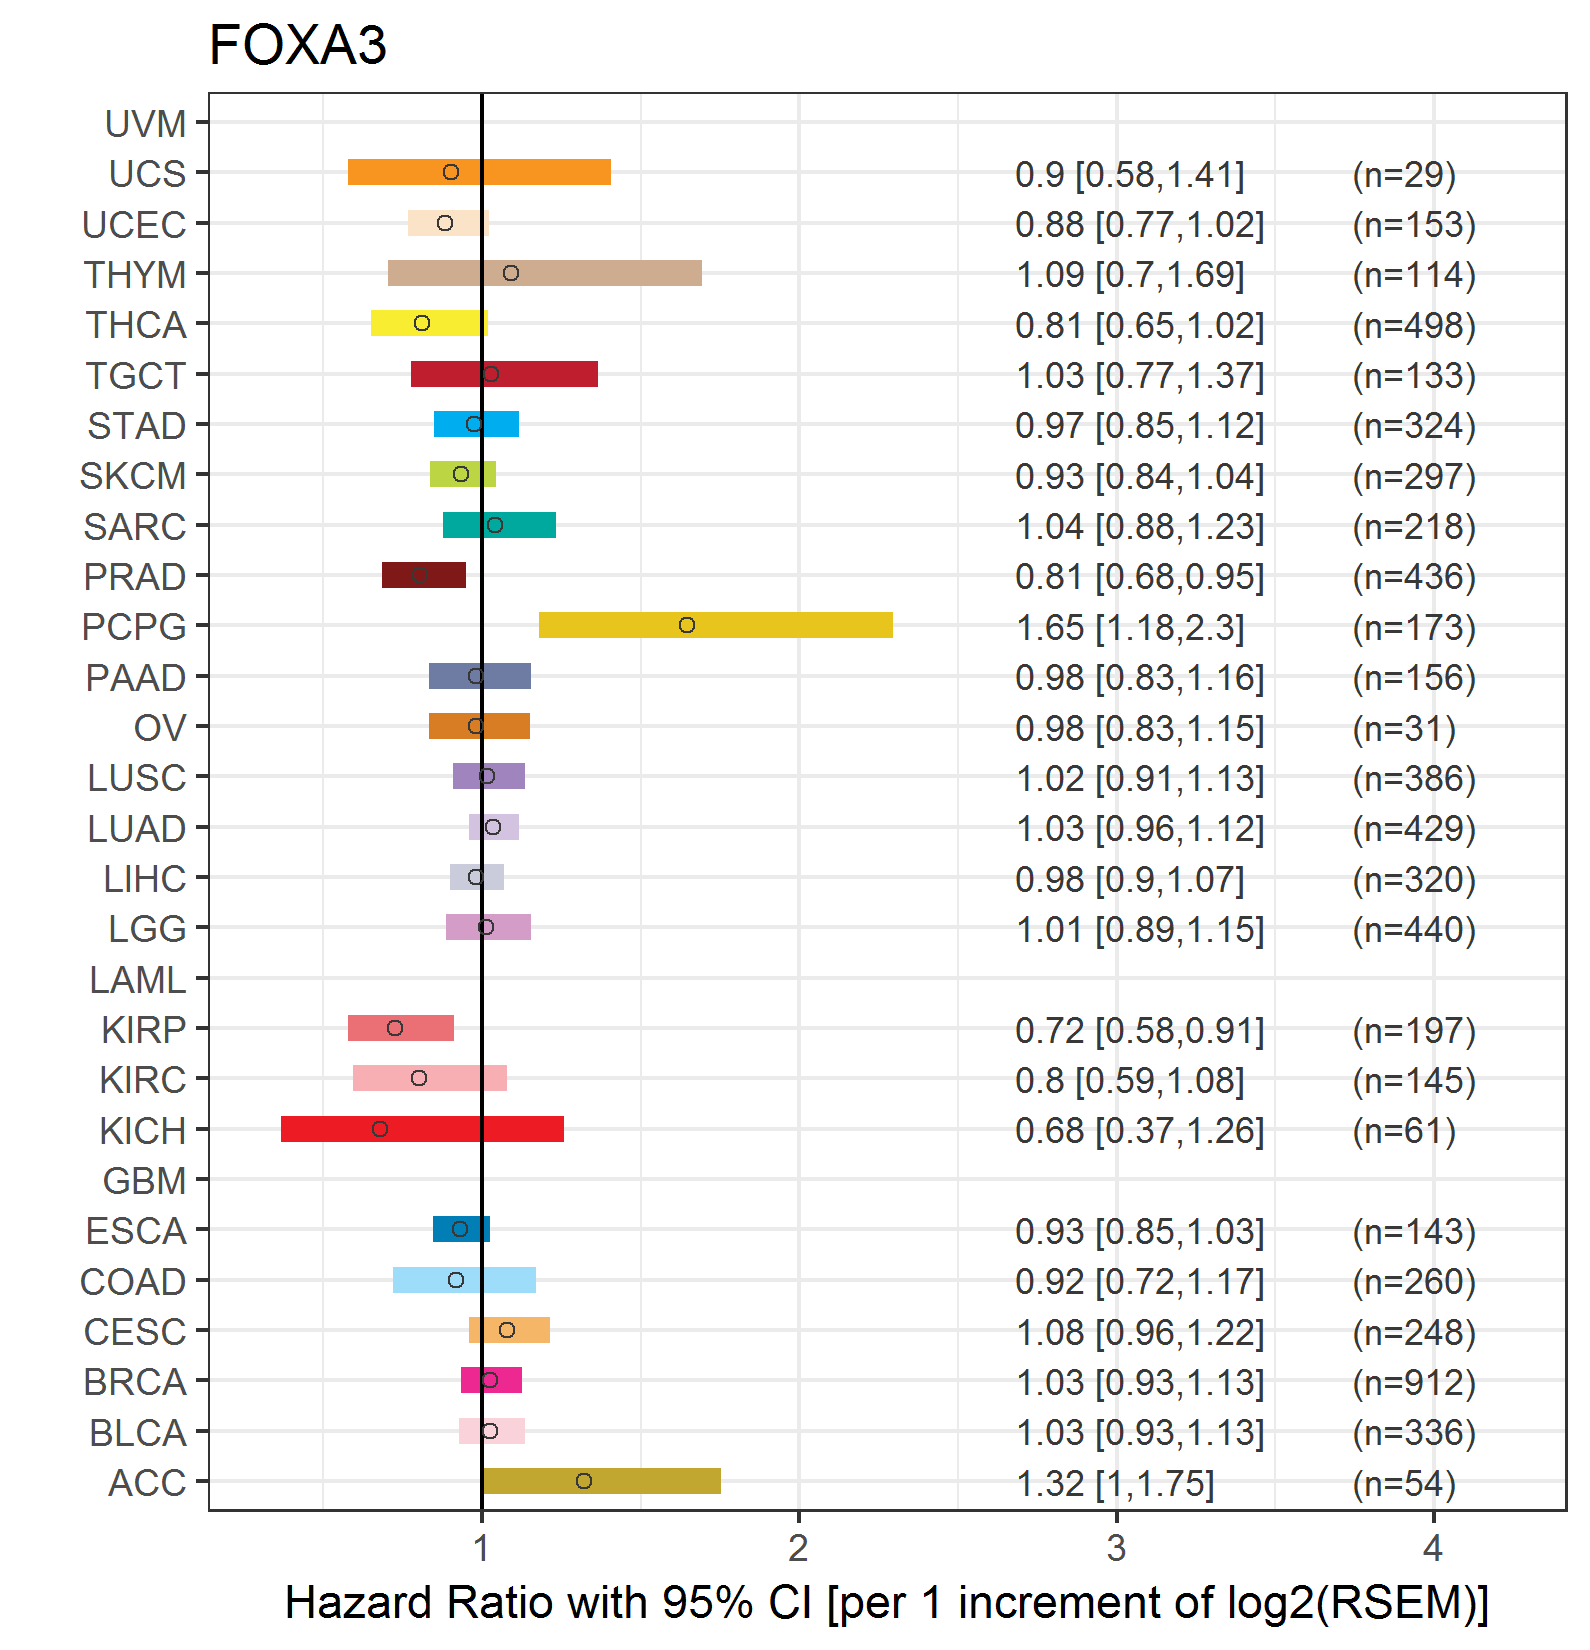
| Forest plot of Cox proportional hazard ratio (HR) and 95% CI of overall survival (OS) using 28 cancer types (TCGA IlluminaHiSeq_RNASeqV2, pan-cancer normalized log2(norm_counts+1) data, version 2016-08-16) (TCGA clinicalMatrix, phenotype data, version 2016-04-27) * Click on the image enlarge it in a new window. |
 |
| Forest plot of Cox proportional hazard ratio (HR) and 95% CI of relapse free survival (RFS) using 28 cancer types (TCGA IlluminaHiSeq_RNASeqV2, pan-cancer normalized log2(norm_counts+1) data, version 2016-08-16) (TCGA clinicalMatrix, phenotype data, version 2016-04-27) * Click on the image enlarge it in a new window. |
 |
| Top |
| TissGeneClin for FOXA3 |
| TissGeneDrug for FOXA3 |
| Drug information targeting TissGene (DrugBank Version 5.0.6, 2017-04-01) |
| DrugBank ID | Drug name | Drug activity | Drug type | Drug status |
| Top |
| TissGeneDisease for FOXA3 |
| Disease information associated with TissGene (DisGeNet, 2016-06-01) |
| Disease ID | Disease name | # pubmeds | Source |
| umls:C0011853 | Diabetes Mellitus, Experimental | 1 | RGD |
| umls:C0023903 | Liver neoplasms | 1 | BeFree |
| umls:C0024115 | Lung diseases | 1 | BeFree |
| umls:C0033578 | Prostatic Neoplasms | 1 | CTD_human |
| umls:C2239176 | Liver carcinoma | 1 | BeFree |
|
Copyright 2016-Present - The University of Texas Health Science Center at Houston (UTHealth) Web File Viewing | How to Report, Fraud, Waste and Abuse | State of Texas | Statewide Search | Texas Homeland Security | Site Policies |