 |
| |
| |
| |
| |
| |
| |
|

| TissGeneSummary for HOXC13 |
 Gene summary Gene summary |
| Basic gene information | Gene symbol | HOXC13 |
| Gene name | homeobox C13 | |
| Synonyms | ECTD9|HOX3|HOX3G | |
| Cytomap | UCSC genome browser: 12q13.3 | |
| Type of gene | protein-coding | |
| RefGenes | NM_017410.2, | |
| Description | NUP98/HOXC13homeo box 3Ghomeobox protein Hox-3Ghomeobox protein Hox-C13 | |
| Modification date | 20141207 | |
| dbXrefs | MIM : 142976 | |
| HGNC : HGNC | ||
| Ensembl : ENSG00000123364 | ||
| HPRD : 00862 | ||
| Vega : OTTHUMG00000160008 | ||
| Protein | UniProt: go to UniProt's Cross Reference DB Table | |
| Expression | CleanEX: HS_HOXC13 | |
| BioGPS: 3229 | ||
| Pathway | NCI Pathway Interaction Database: HOXC13 | |
| KEGG: HOXC13 | ||
| REACTOME: HOXC13 | ||
| Pathway Commons: HOXC13 | ||
| Context | iHOP: HOXC13 | |
| ligand binding site mutation search in PubMed: HOXC13 | ||
| UCL Cancer Institute: HOXC13 | ||
| Assigned class in TissGDB* | B | |
| Included tissue-specific gene expression resources | HPA,TiGER,GTEx | |
| Specific-tissues in normal samples (assigned by TissGDB using HPA, TiGER, and GTEx) | CervixSkin | |
| Cancer types related to the specific-tissues in cancer samples (assigned by TissGDB using TCGA) | CESCSKCM | |
| Reference showing the relevant tissue of HOXC13 | ||
| Description by TissGene annotations | Cancer gene Fused withTSGene | |
| * Class A consists of genes with literature evidence and is part of the cTissGenes. Class B consists of only cTissGenes without additional evidence. The remaining genes belong to Class C. |
| Gene ontology having evidence of Inferred from Direct Assay (IDA) from Entrez |
| GO ID | GO term | PubMed ID |
| Top |
| TissGeneExp for HOXC13 |
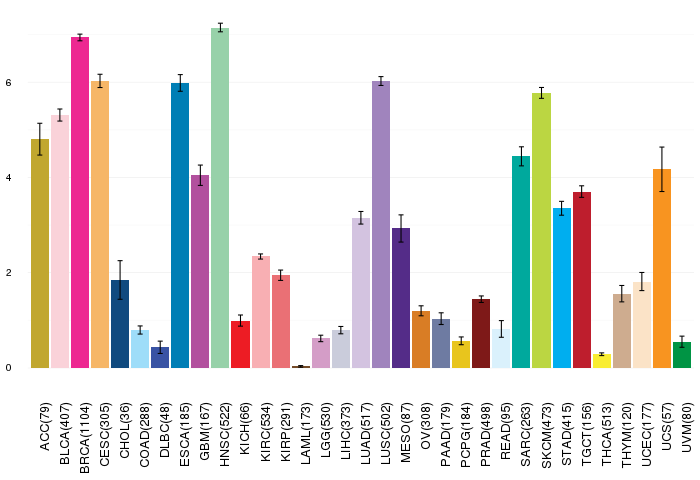
| Gene expressions across 28 cancer types (X-axis: cancer type and Y-axis: log2(norm_counts+1)) (TCGA IlluminaHiSeq_RNASeqV2, pan-cancer normalized log2(norm_counts+1) data, version 2016-08-16) |
 |
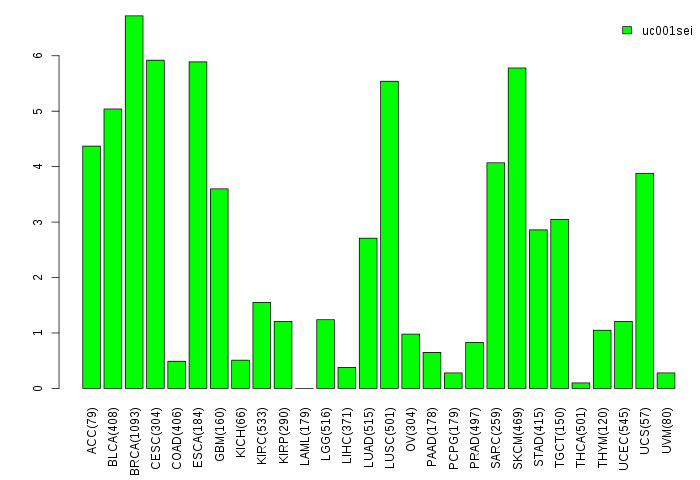
| Gene isoform expressions across 28 cancer types (X-axis: cancer type and Y-axis: log2(norm_counts+1)) (TCGA pan-cancer tcga_rsem_isoform_tpm, version 2016-09-01) |
 |
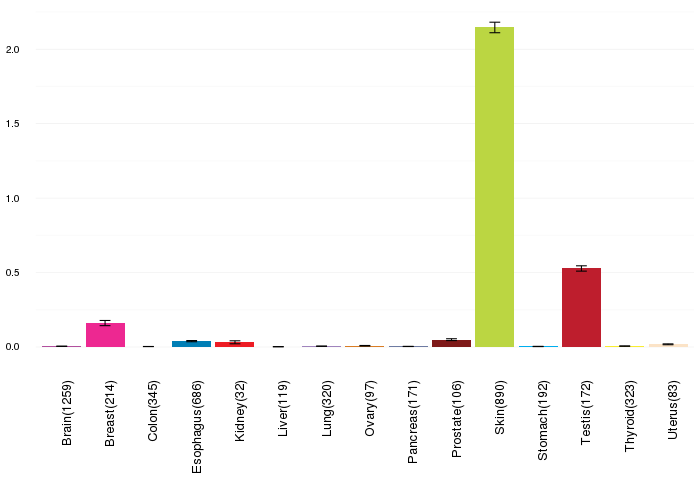
| Gene expressions across normal tissues of GTEx data (GTEx GTEx_Analysis_v6_RNA-seq_RNA-SeQCv1.1.8_gene_rpkm.gct) - Here, we shows the matched tissue types only among our 28 cancer types. |
 |
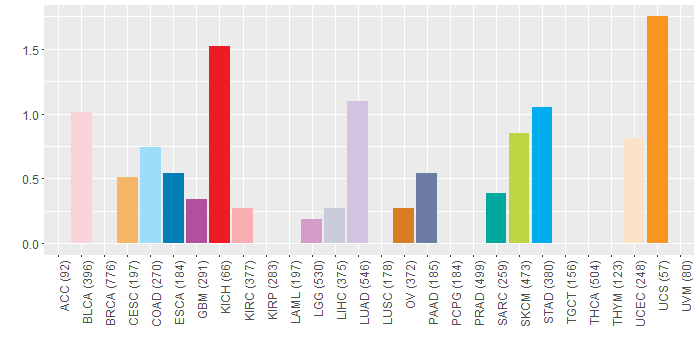
| Different expressions across 14 cancer types with more than 10 samples between matched tumors and normals (X-axis: cancer type and Y-axis: log2(norm_counts+1)) (TCGA IlluminaHiSeq_RNASeqV2, pan-cancer normalized log2(norm_counts+1) data, version 2016-08-16) |
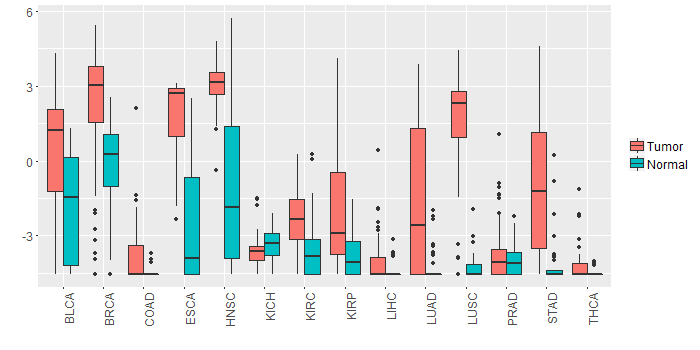 |
| - Significantly differentially expressed cancer types and information. (|Fold change|>1 and FDR<0.05) |
| Cancer type | Mean(exp) in tumor | Mean(exp) in matched normal | Log2FC | P-val. | FDR |
| KIRC | -2.323840839 | -3.619656116 | 1.295815278 | 2.05E-11 | 7.75E-11 |
| HNSC | 3.073827282 | -1.262993649 | 4.33682093 | 2.29E-12 | 7.47E-11 |
| BRCA | 2.335531749 | -0.163358602 | 2.498890351 | 5.16E-19 | 3.43E-18 |
| LUSC | 1.64331921 | -4.301412162 | 5.944731373 | 9.91E-27 | 2.72E-25 |
| LUAD | -1.621078051 | -4.298179775 | 2.677101724 | 3.26E-09 | 1.58E-08 |
| STAD | -0.978646047 | -4.066727297 | 3.08808125 | 9.26E-07 | 1.52E-05 |
| BLCA | 0.469639644 | -1.680318251 | 2.149957895 | 0.00739 | 0.035729043 |
| ESCA | 1.632649692 | -2.475559399 | 4.108209091 | 0.00084 | 0.012883862 |
| KIRP | -1.907167922 | -3.731289797 | 1.824121875 | 0.000362 | 0.001098246 |
| Top |
| TissGene-miRNA for HOXC13 |
| Significantly anti-correlated miRNAs of TissGene across 28 cancer types (Gene-miRNA relations from TargetScanHuman Relsease 7.1, Conserved_Site_Context_Scores.txt.zip, 06.01.2016) (TCGA IlluminaHiSeq_miRNASeq, log2(RPM+1) data, version 2016-11-21) (TCGA IlluminaHiSeq_RNASeqV2, log2(normalized_count+1) data, version 2016-08-16) (Spearman’s Rank Correlation (p-value<0.05 and coefficient<-0.25)) |
| Cancer type | miRNA id | miRNA accession | P-val. | Coeff. | # samples |
| ACC | hsa-miR-876-5p | MIMAT0004924 | 0.025 | -0.26 | 78 |
| ACC | hsa-miR-876-5p | MIMAT0004924 | 0.025 | -0.26 | 78 |
| Top |
| TissGeneMut for HOXC13 |
| TissGeneSNV for HOXC13 |
| nsSNV counts per each loci. Different colors of circles represent different cancer types. Circle size denotes number of samples. (TCGA somatic mutation (SNPs and small INDELs) data, version 2016-04-25) * Click on the image to enlarge it in a new window. |
 |
 |
| Somatic nucleotide variants of TissGene across 28 cancer types (X-axis: cancer type and Y-axis: % of mutated samples) The numbers in parentheses are numbers of samples with mutation (nsSNVs). (TCGA somatic mutation (SNPs and small INDELs) data, version 2016-04-25) |
 |
| - nsSNVs sorted by frequency. |
| AAchange | Cancer type | # samples |
| p.G196R | STAD | 1 |
| p.K277T | COAD | 1 |
| p.A146T | KICH | 1 |
| p.A324V | UCEC | 1 |
| p.Q183* | SARC | 1 |
| p.E155G | LUAD | 1 |
| p.H205Q | BLCA | 1 |
| p.T305A | SKCM | 1 |
| p.I293T | LIHC | 1 |
| p.A295T | BLCA | 1 |
| p.E253K | HNSC | 1 |
| p.V193L | LUAD | 1 |
| p.G29S | HNSC | 1 |
| p.K273N | LGG | 1 |
| p.R259C | UCEC | 1 |
| p.S322L | BLCA | 1 |
| p.E278K | SKCM | 1 |
| p.R302C | STAD | 1 |
| p.Q303H | HNSC | 1 |
| p.A169T | SKCM | 1 |
| p.A23V | GBM | 1 |
| p.R311W | STAD | 1 |
| p.R264C | COAD | 1 |
| p.R259H | ESCA | 1 |
| p.R264C | STAD | 1 |
| p.P154L | CESC | 1 |
| p.P161S | PAAD | 1 |
| p.R261C | HNSC | 1 |
| p.S256R | LUAD | 1 |
| p.R259S | OV | 1 |
| p.E288D | READ | 1 |
| p.S322L | SKCM | 1 |
| p.E155K | LUAD | 1 |
| p.T286S | LUAD | 1 |
| p.S282G | LUAD | 1 |
| p.R292G | LUAD | 1 |
| p.W223C | UCS | 1 |
| p.R291Q | BLCA | 1 |
| p.P201A | KIRC | 1 |
| p.D206G | DLBC | 1 |
| p.L327F | DLBC | 1 |
| Top |
| TissGeneCNV for HOXC13 |
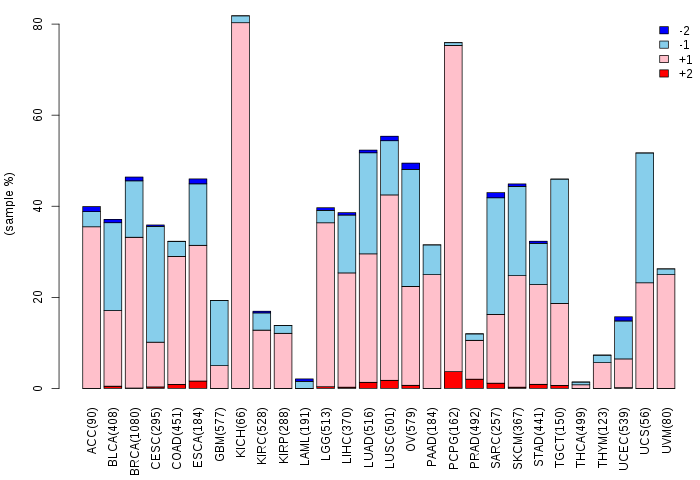
| Copy number variations of TissGene across 28 cancer types (X-axis: cancer type and Y-axis: % of CNV samples) (TCGA Gistic2_CopyNumber_Gistic2_all_data_by_genes, Gistic2 copy number data, version 2016-08-16) |
 |
| Top |
| TissGeneFusions for HOXC13 |
| Fusion genes including TissGene (ChimerDB 3.0, 2016-12-01 and TCGA fusion Portal 2015-12-01) |
| Database | Src | Cancer type | Sample | Fusion gene | ORF | 5'-gene BP | 3'-gene BP |
| Chimerdb3.0 | ChiTaRs | acute myeloid leukemia | AJ438986 | NUP98-HOXC13 | chr11:3756553 | chr12:54338780 |
| Top |
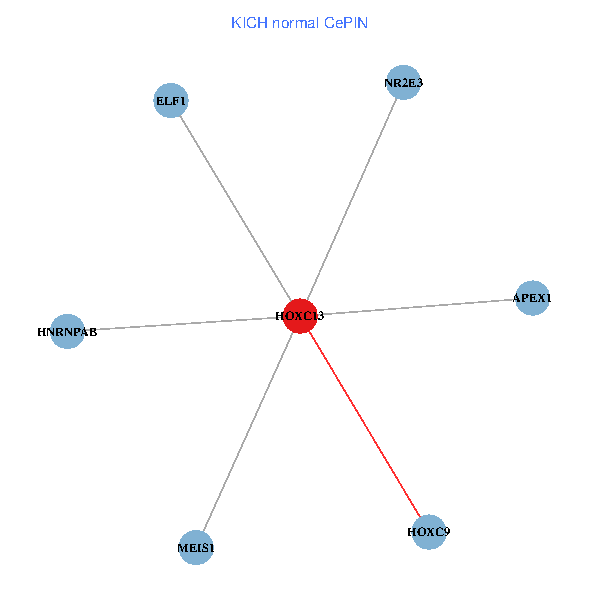
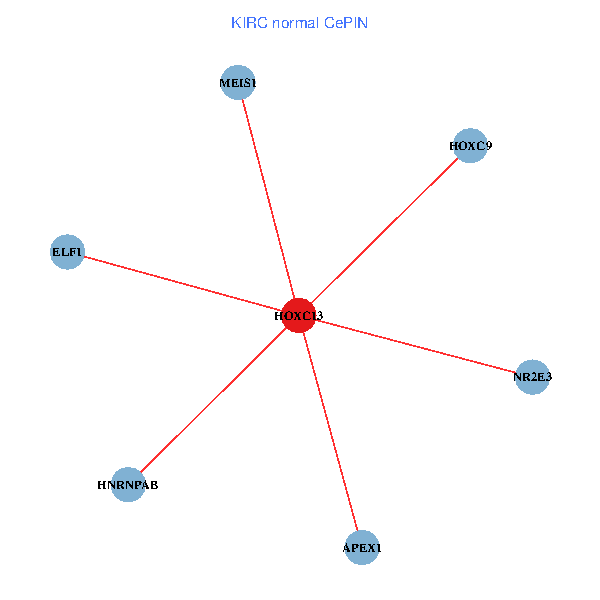
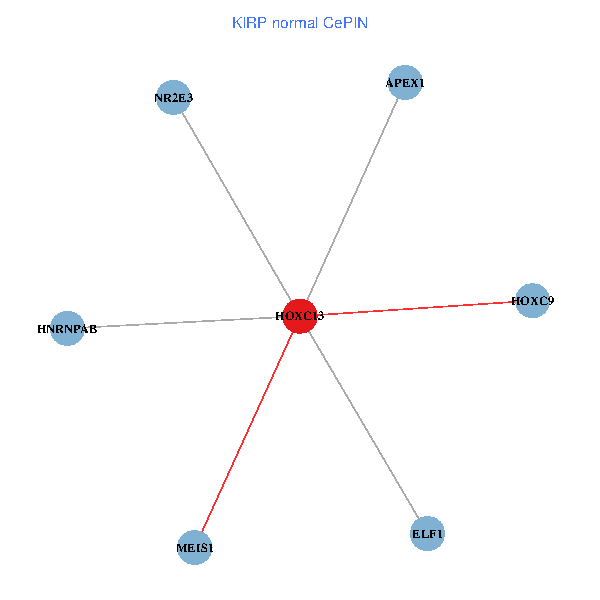
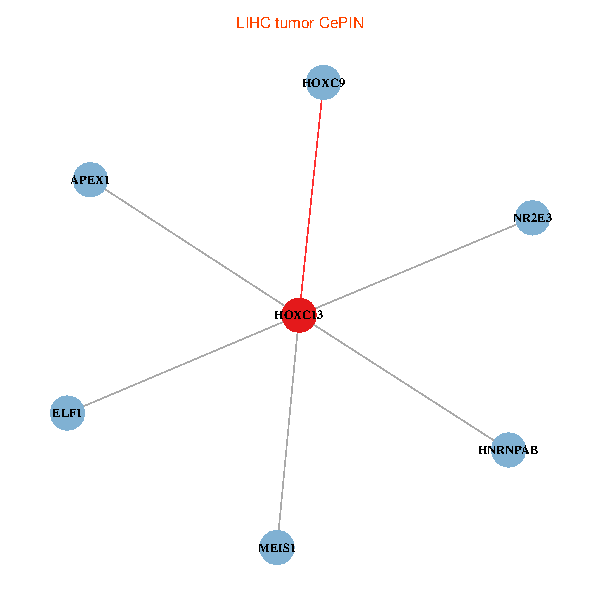
| TissGeneNet for HOXC13 |
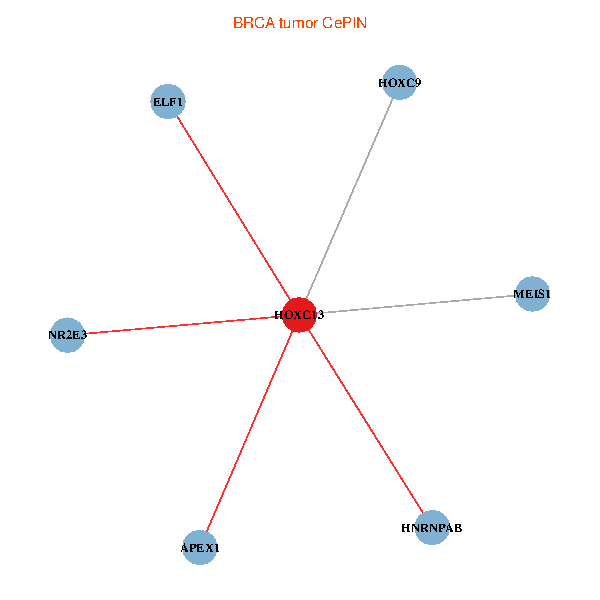
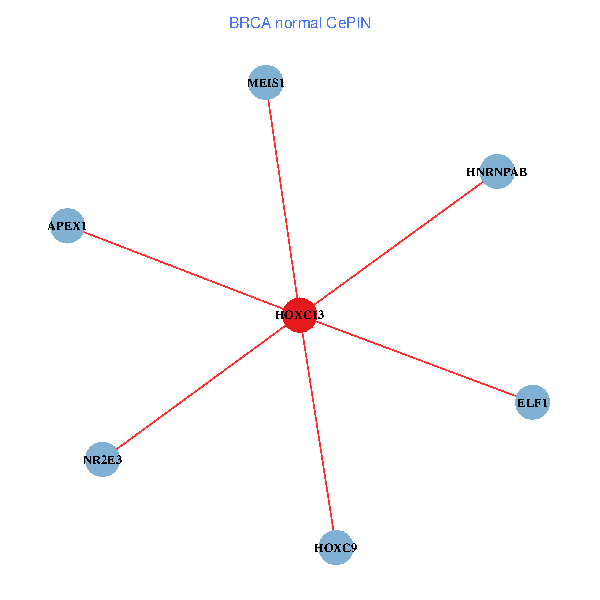
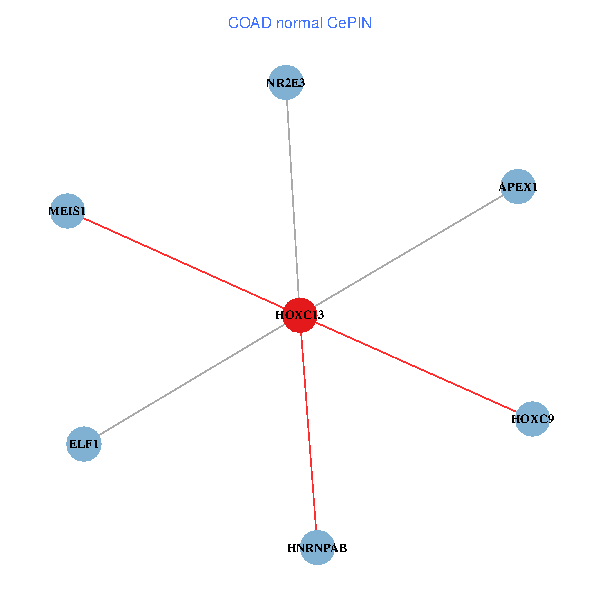
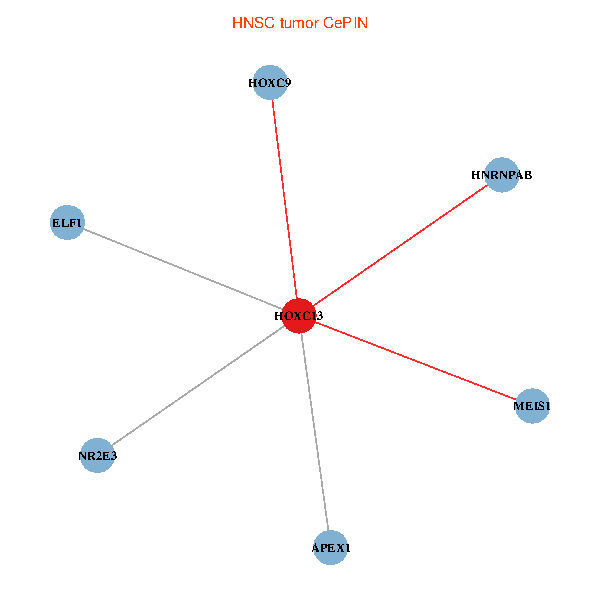
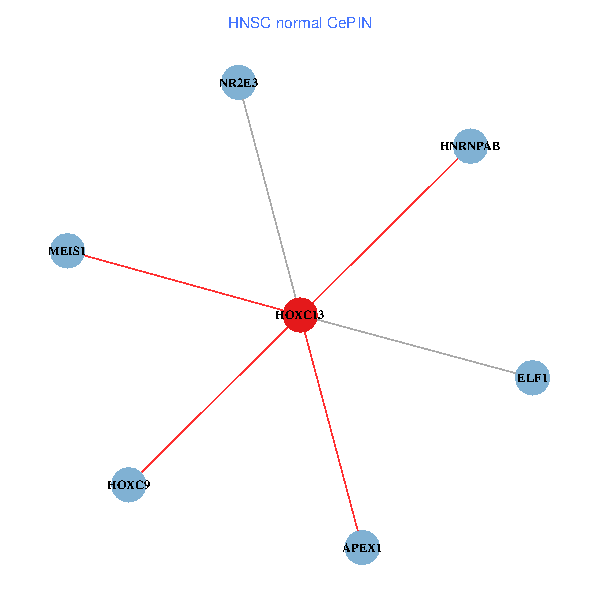
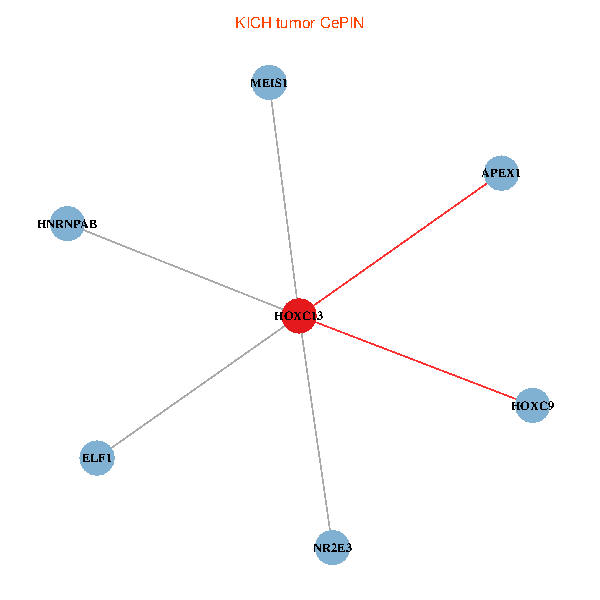
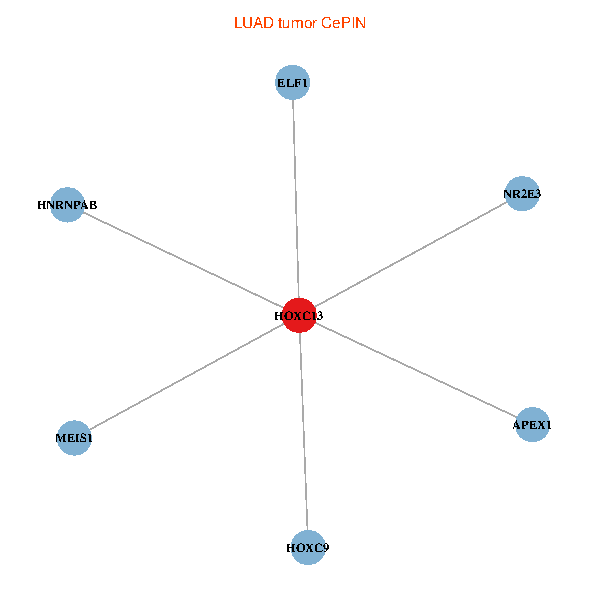
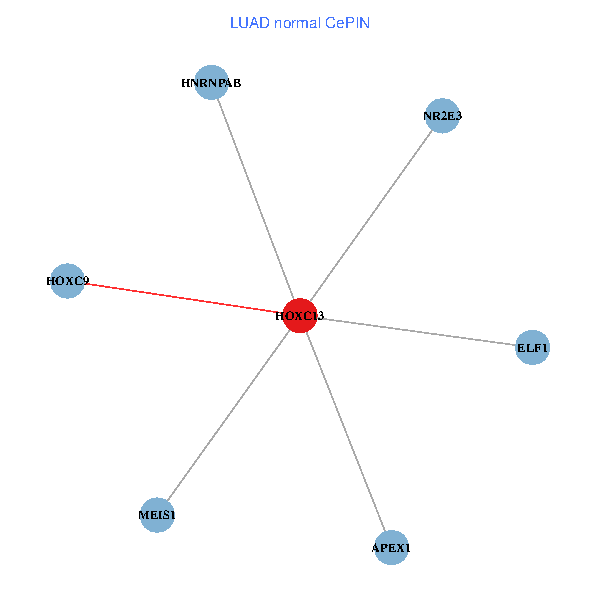
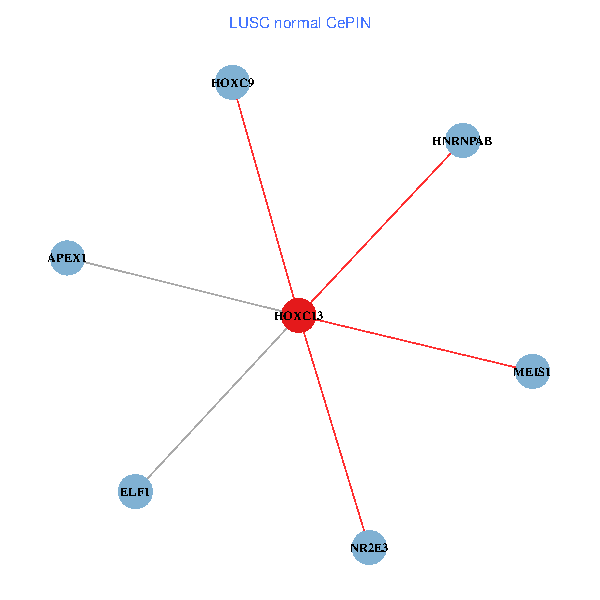
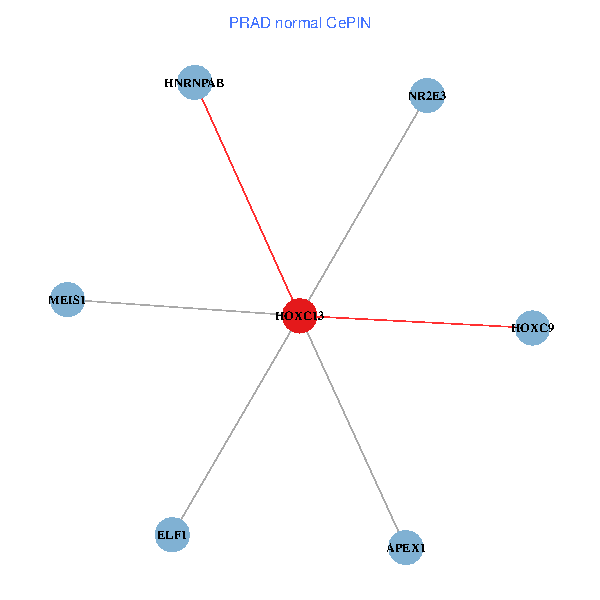
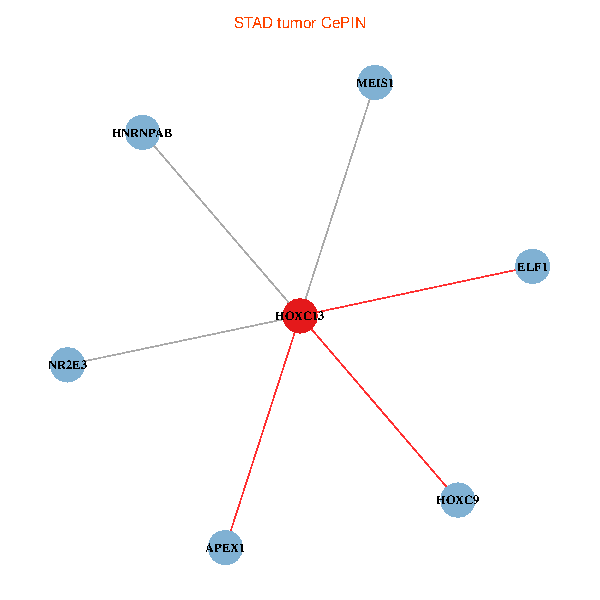
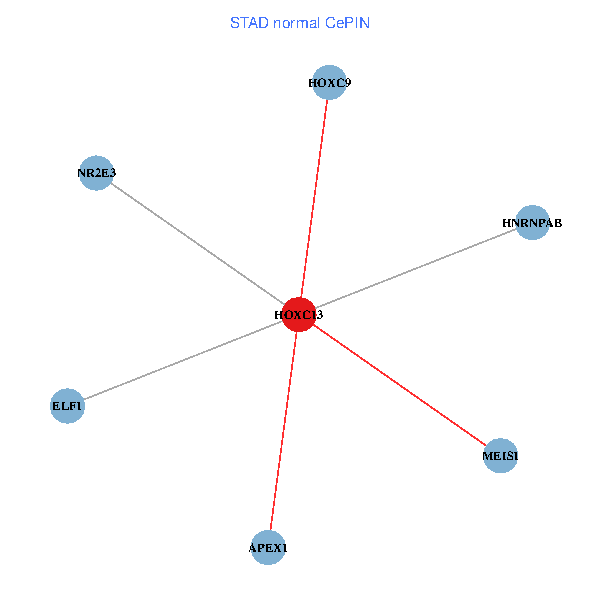
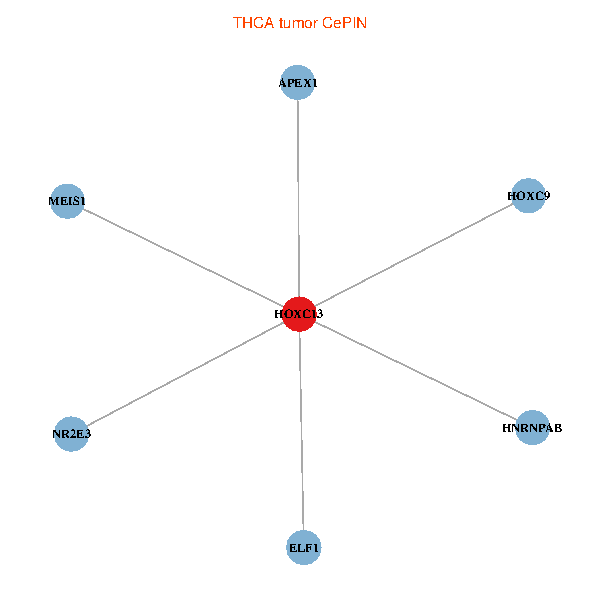
| Co-expressed gene networks based on protein-protein interaction data (CePIN) (TCGA IlluminaHiSeq_RNASeqV2, pan-cancer normalized log2(norm_counts+1) data, version 2016-08-16) (PINA2 ppi data) |
| BRCA (tumor) | BRCA (normal) |
| HOXC13, HNRNPAB, APEX1, ELF1, NR2E3, MEIS1, HOXC9 (tumor) | HOXC13, HNRNPAB, APEX1, ELF1, NR2E3, MEIS1, HOXC9 (normal) |
 |  |
| COAD (tumor) | COAD (normal) |
| HOXC13, HNRNPAB, APEX1, ELF1, NR2E3, MEIS1, HOXC9 (tumor) | HOXC13, HNRNPAB, APEX1, ELF1, NR2E3, MEIS1, HOXC9 (normal) |
 |  |
| HNSC (tumor) | HNSC (normal) |
| HOXC13, HNRNPAB, APEX1, ELF1, NR2E3, MEIS1, HOXC9 (tumor) | HOXC13, HNRNPAB, APEX1, ELF1, NR2E3, MEIS1, HOXC9 (normal) |
 |  |
| KICH (tumor) | KICH (normal) |
| HOXC13, HNRNPAB, APEX1, ELF1, NR2E3, MEIS1, HOXC9 (tumor) | HOXC13, HNRNPAB, APEX1, ELF1, NR2E3, MEIS1, HOXC9 (normal) |
 |  |
| KIRC (tumor) | KIRC (normal) |
| HOXC13, HNRNPAB, APEX1, ELF1, NR2E3, MEIS1, HOXC9 (tumor) | HOXC13, HNRNPAB, APEX1, ELF1, NR2E3, MEIS1, HOXC9 (normal) |
 |  |
| KIRP (tumor) | KIRP (normal) |
| HOXC13, HNRNPAB, APEX1, ELF1, NR2E3, MEIS1, HOXC9 (tumor) | HOXC13, HNRNPAB, APEX1, ELF1, NR2E3, MEIS1, HOXC9 (normal) |
 |  |
| LIHC (tumor) | LIHC (normal) |
| HOXC13, HNRNPAB, APEX1, ELF1, NR2E3, MEIS1, HOXC9 (tumor) | HOXC13, HNRNPAB, APEX1, ELF1, NR2E3, MEIS1, HOXC9 (normal) |
 |  |
| LUAD (tumor) | LUAD (normal) |
| HOXC13, HNRNPAB, APEX1, ELF1, NR2E3, MEIS1, HOXC9 (tumor) | HOXC13, HNRNPAB, APEX1, ELF1, NR2E3, MEIS1, HOXC9 (normal) |
 |  |
| LUSC (tumor) | LUSC (normal) |
| HOXC13, HNRNPAB, APEX1, ELF1, NR2E3, MEIS1, HOXC9 (tumor) | HOXC13, HNRNPAB, APEX1, ELF1, NR2E3, MEIS1, HOXC9 (normal) |
 |  |
| PRAD (tumor) | PRAD (normal) |
| HOXC13, HNRNPAB, APEX1, ELF1, NR2E3, MEIS1, HOXC9 (tumor) | HOXC13, HNRNPAB, APEX1, ELF1, NR2E3, MEIS1, HOXC9 (normal) |
 |  |
| STAD (tumor) | STAD (normal) |
| HOXC13, HNRNPAB, APEX1, ELF1, NR2E3, MEIS1, HOXC9 (tumor) | HOXC13, HNRNPAB, APEX1, ELF1, NR2E3, MEIS1, HOXC9 (normal) |
 |  |
| THCA (tumor) | THCA (normal) |
| HOXC13, HNRNPAB, APEX1, ELF1, NR2E3, MEIS1, HOXC9 (tumor) | HOXC13, HNRNPAB, APEX1, ELF1, NR2E3, MEIS1, HOXC9 (normal) |
 |  |
| Top |
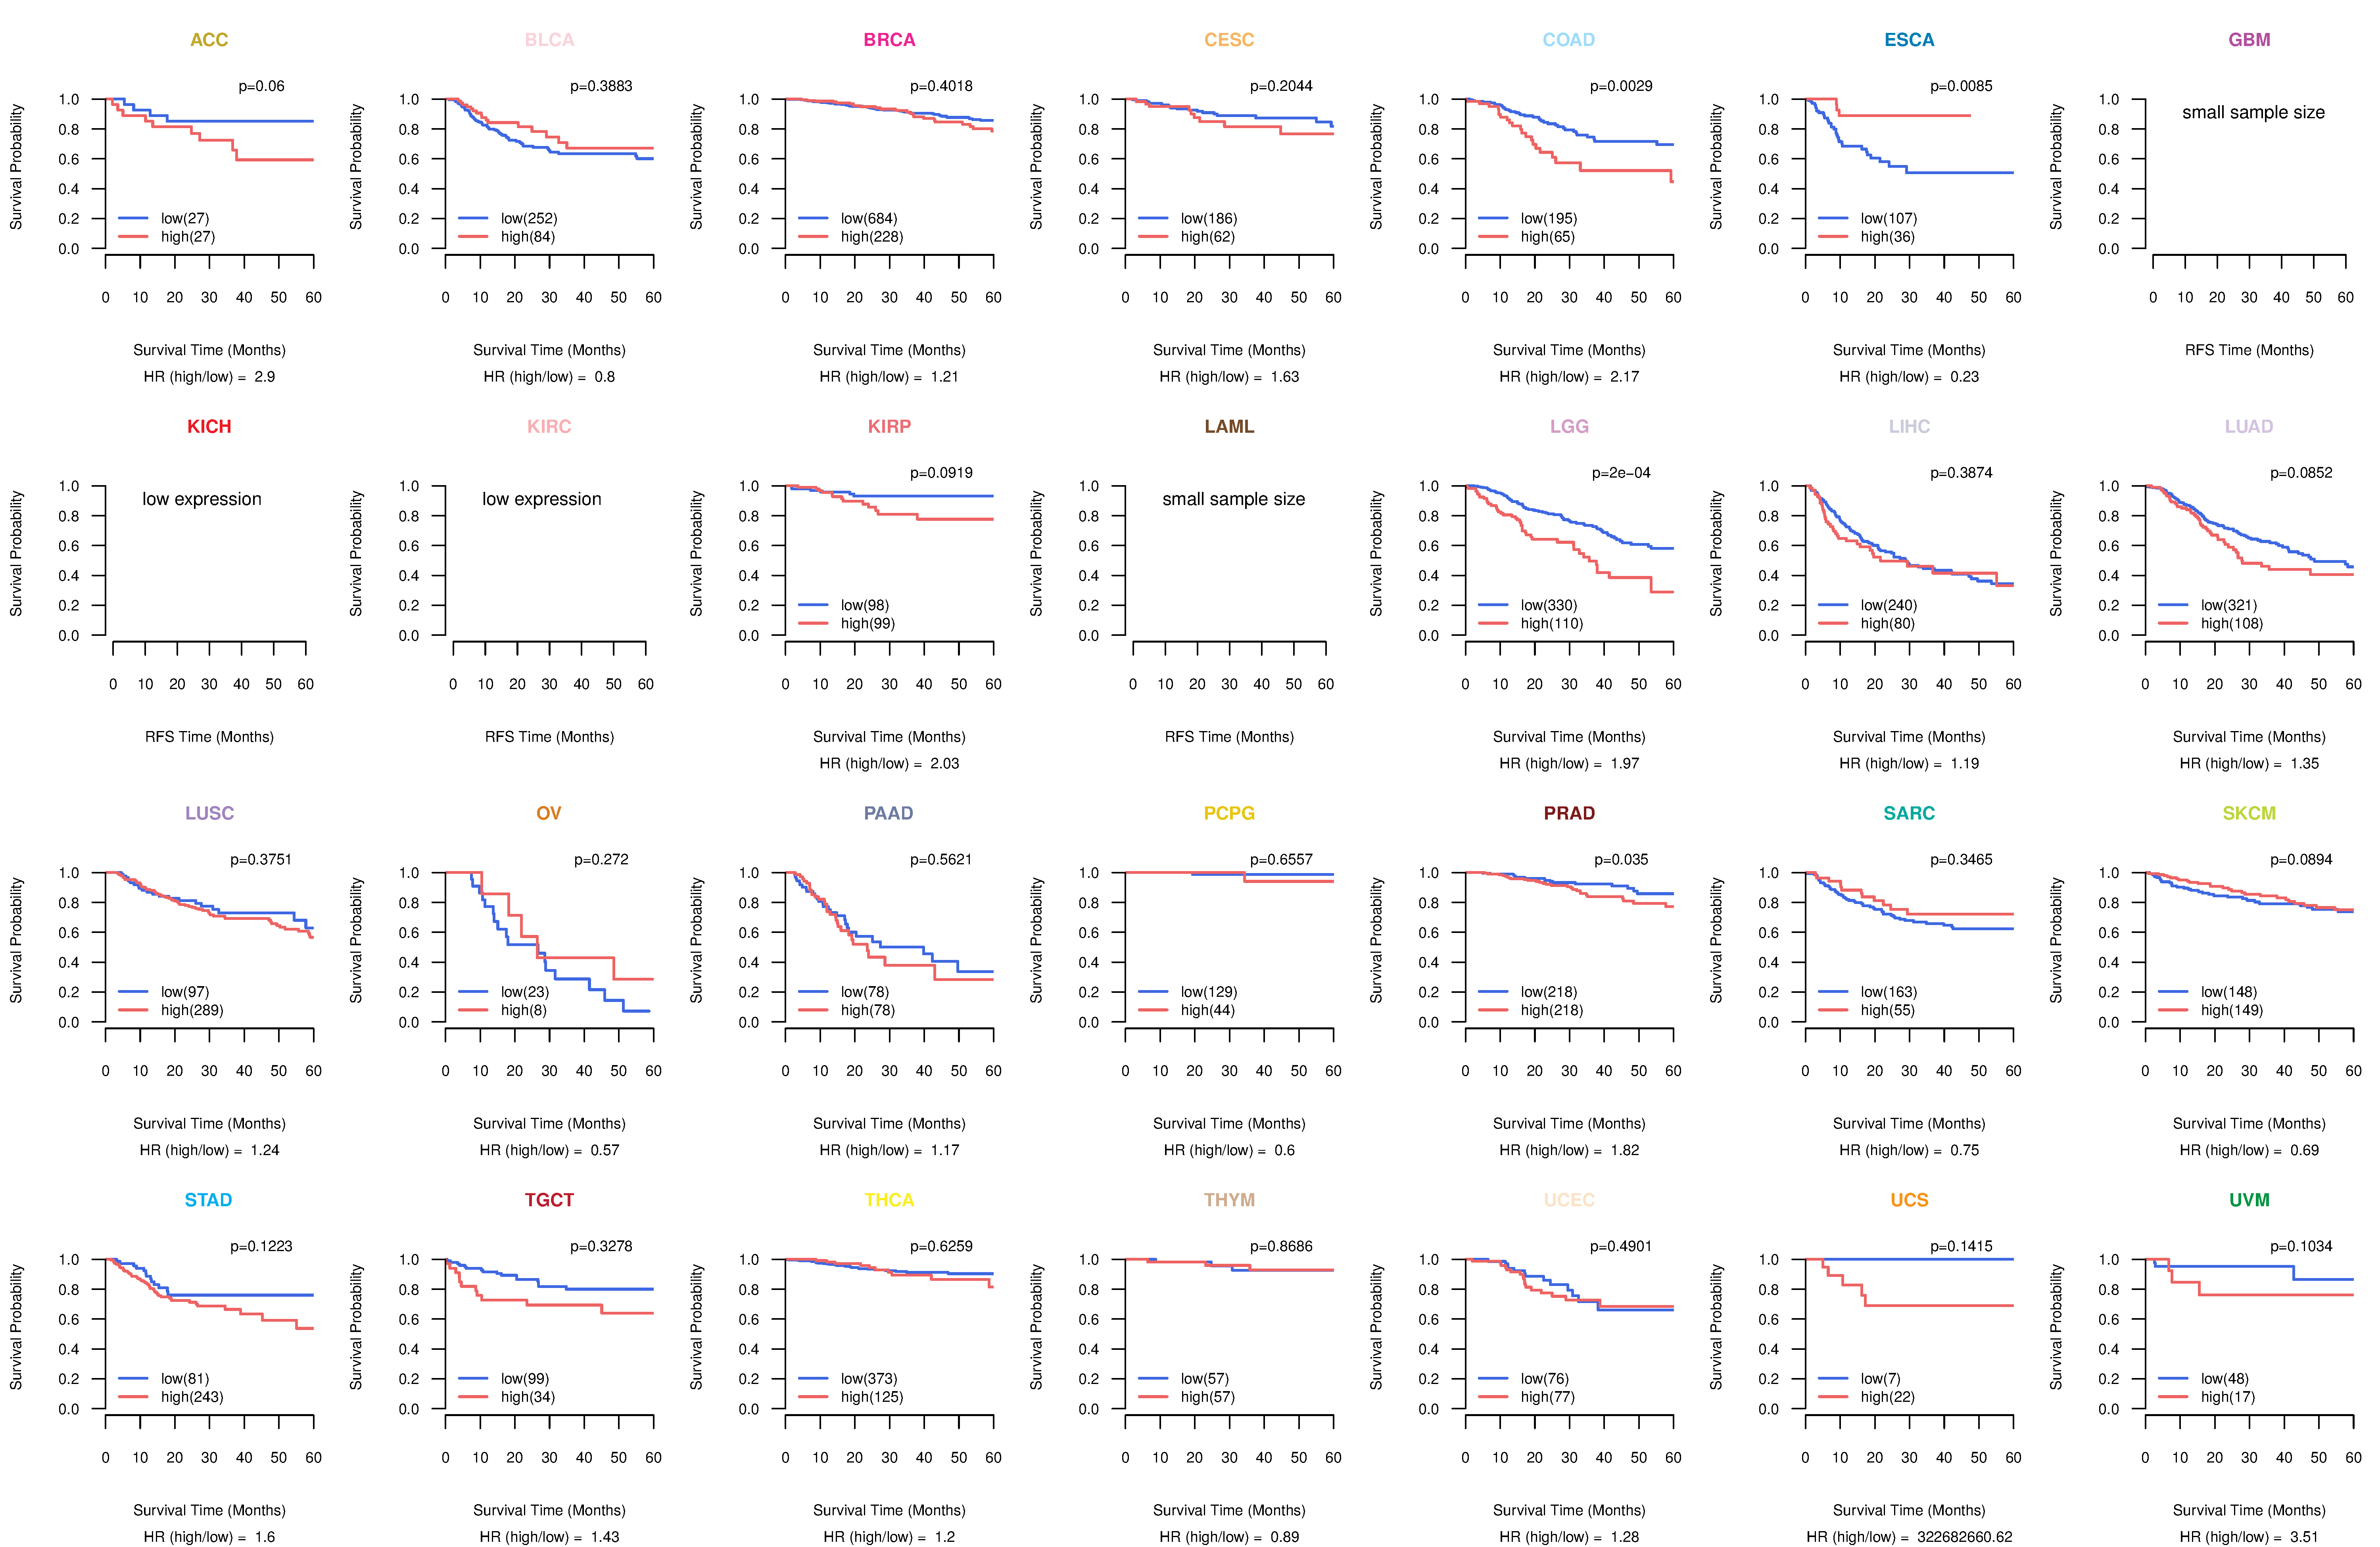
| TissGeneProg for HOXC13 |
| Kaplan-Meier plots with logrank tests of overall survival (OS) using 28 cancer types (TCGA IlluminaHiSeq_RNASeqV2, pan-cancer normalized log2(norm_counts+1) data, version 2016-08-16) (TCGA clinicalMatrix, phenotype data, version 2016-04-27) * Click on the image to enlarge it in a new window. |
 |
| Kaplan-Meier plots with logrank test of relapse free survival (RFS) using 28 cancer types (TCGA IlluminaHiSeq_RNASeqV2, pan-cancer normalized log2(norm_counts+1) data, version 2016-08-16) (TCGA clinicalMatrix, phenotype data, version 2016-04-27) * Click on the image enlarge it in a new window. |
 |
| Forest plot of Cox proportional hazard ratio (HR) and 95% CI of overall survival (OS) using 28 cancer types (TCGA IlluminaHiSeq_RNASeqV2, pan-cancer normalized log2(norm_counts+1) data, version 2016-08-16) (TCGA clinicalMatrix, phenotype data, version 2016-04-27) * Click on the image enlarge it in a new window. |
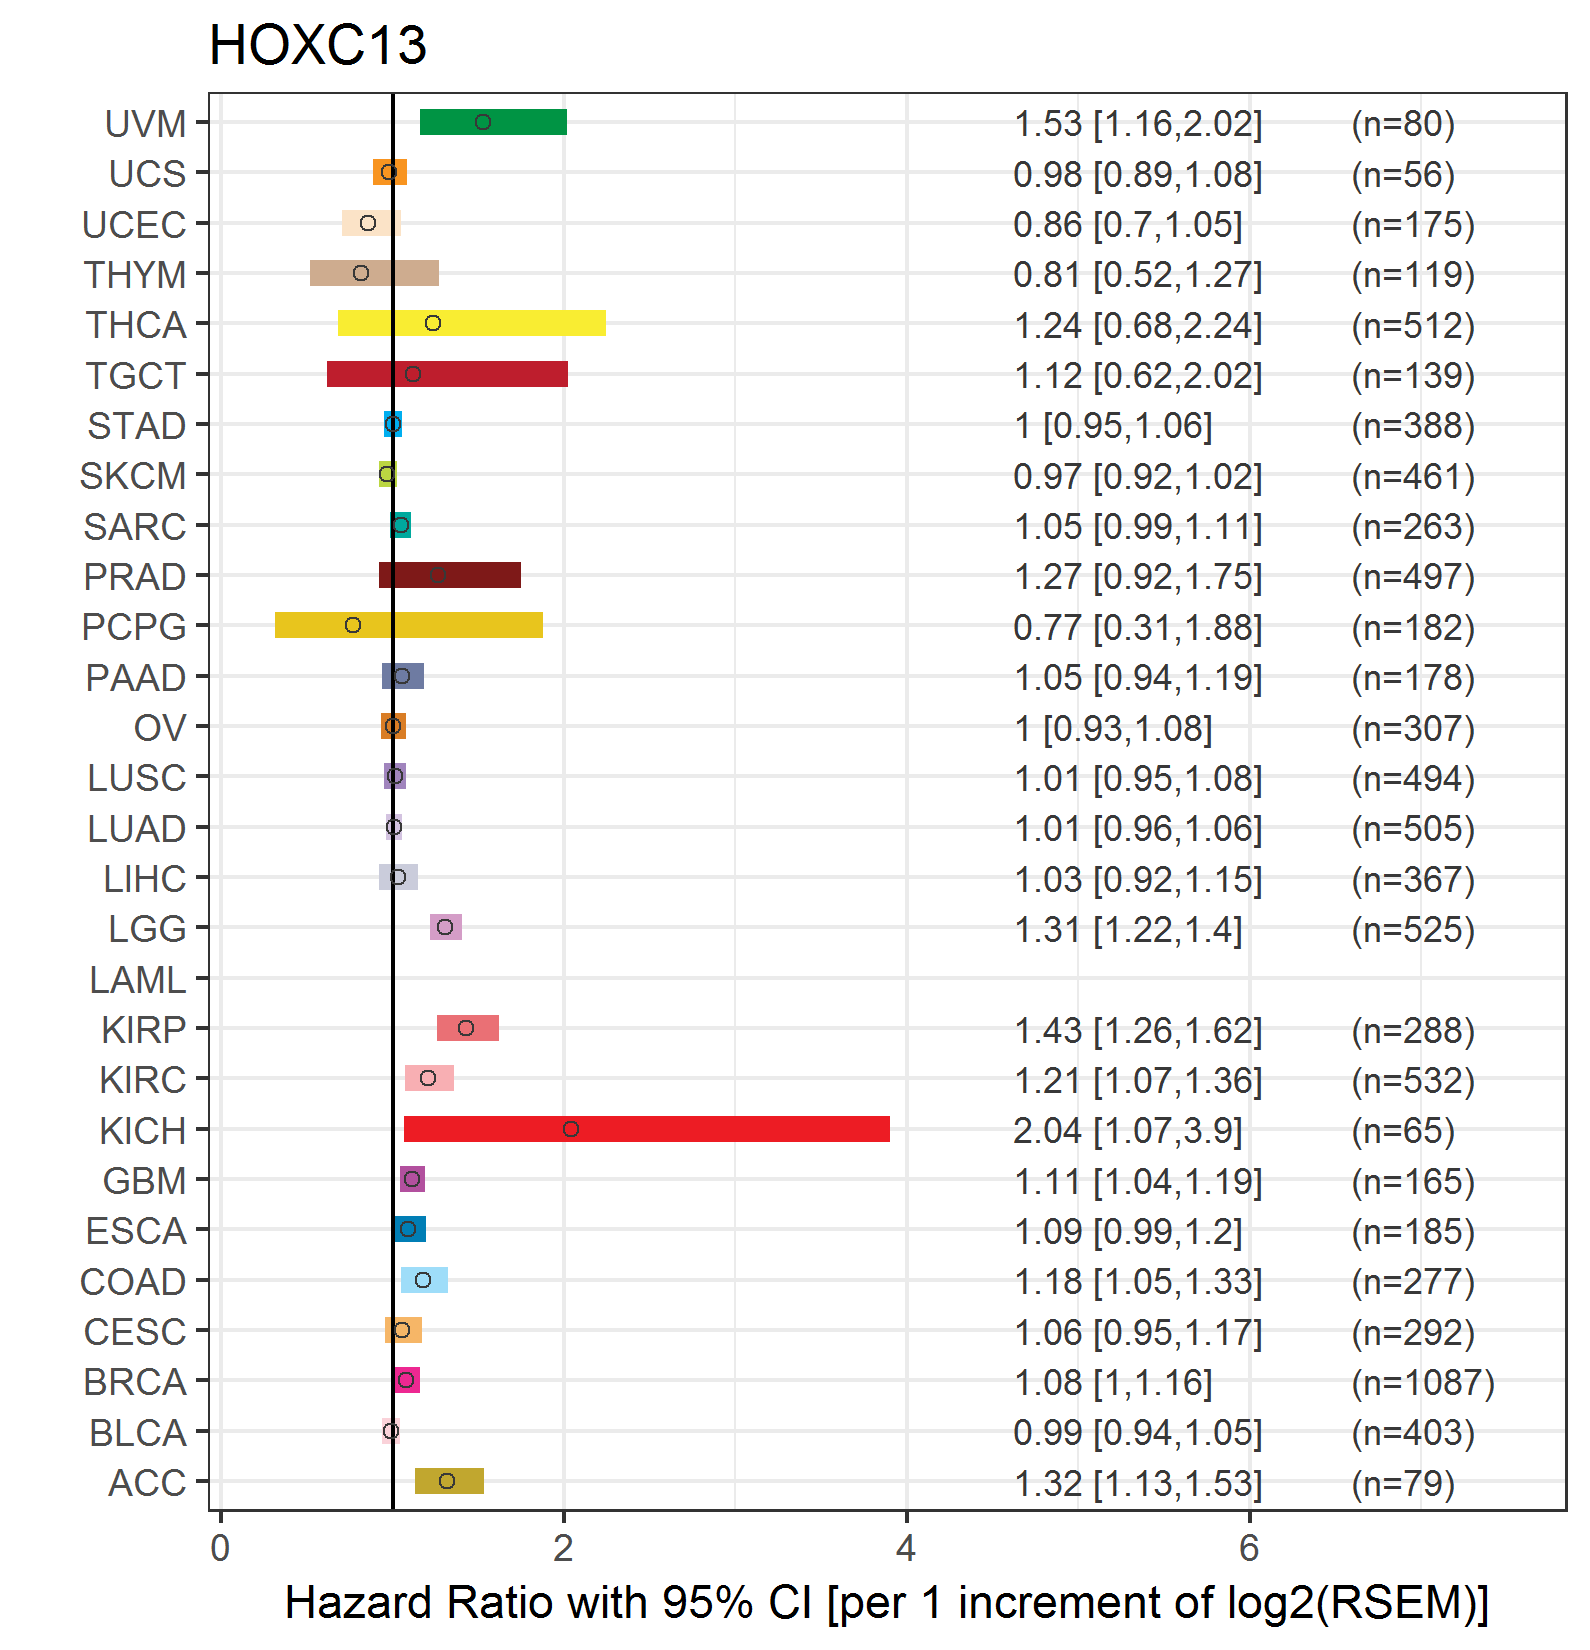 |
| Forest plot of Cox proportional hazard ratio (HR) and 95% CI of relapse free survival (RFS) using 28 cancer types (TCGA IlluminaHiSeq_RNASeqV2, pan-cancer normalized log2(norm_counts+1) data, version 2016-08-16) (TCGA clinicalMatrix, phenotype data, version 2016-04-27) * Click on the image enlarge it in a new window. |
 |
| Top |
| TissGeneClin for HOXC13 |
| TissGeneDrug for HOXC13 |
| Drug information targeting TissGene (DrugBank Version 5.0.6, 2017-04-01) |
| DrugBank ID | Drug name | Drug activity | Drug type | Drug status |
| Top |
| TissGeneDisease for HOXC13 |
| Disease information associated with TissGene (DisGeNet, 2016-06-01) |
| Disease ID | Disease name | # pubmeds | Source |
| umls:C0023467 | Leukemia, Myelocytic, Acute | 3 | BeFree |
| umls:C0013575 | Ectodermal Dysplasia | 2 | BeFree |
| umls:C0009081 | Congenital clubfoot | 1 | BeFree |
| umls:C0020217 | Hydatidiform Mole | 1 | BeFree |
| umls:C0220615 | Adult Acute Myeloblastic Leukemia | 1 | BeFree |
| umls:C1865951 | Ectodermal Dysplasia, Pure Hair-Nail Type | 1 | CTD_human |
|
Copyright 2016-Present - The University of Texas Health Science Center at Houston (UTHealth) Web File Viewing | How to Report, Fraud, Waste and Abuse | State of Texas | Statewide Search | Texas Homeland Security | Site Policies |