 |
| |
| |
| |
| |
| |
| |
|

| TissGeneSummary for HOXD1 |
 Gene summary Gene summary |
| Basic gene information | Gene symbol | HOXD1 |
| Gene name | homeobox D1 | |
| Synonyms | HOX4|HOX4G|Hox-4.7 | |
| Cytomap | UCSC genome browser: 2q31.1 | |
| Type of gene | protein-coding | |
| RefGenes | NM_024501.2, | |
| Description | homeo box 4Ghomeo box D1homeobox protein Hox-D1homeobox protein Hox-GG | |
| Modification date | 20141207 | |
| dbXrefs | MIM : 142987 | |
| HGNC : HGNC | ||
| Ensembl : ENSG00000128645 | ||
| HPRD : 00870 | ||
| Vega : OTTHUMG00000132512 | ||
| Protein | UniProt: go to UniProt's Cross Reference DB Table | |
| Expression | CleanEX: HS_HOXD1 | |
| BioGPS: 3231 | ||
| Pathway | NCI Pathway Interaction Database: HOXD1 | |
| KEGG: HOXD1 | ||
| REACTOME: HOXD1 | ||
| Pathway Commons: HOXD1 | ||
| Context | iHOP: HOXD1 | |
| ligand binding site mutation search in PubMed: HOXD1 | ||
| UCL Cancer Institute: HOXD1 | ||
| Assigned class in TissGDB* | C | |
| Included tissue-specific gene expression resources | TiGER,GTExTiGER,GTEx | |
| Specific-tissues in normal samples (assigned by TissGDB using HPA, TiGER, and GTEx) | Kidney | |
| Cancer types related to the specific-tissues in cancer samples (assigned by TissGDB using TCGA) | KIRC,KIRP,KICH | |
| Reference showing the relevant tissue of HOXD1 | ||
| Description by TissGene annotations | Protective TissGene in OS | |
| * Class A consists of genes with literature evidence and is part of the cTissGenes. Class B consists of only cTissGenes without additional evidence. The remaining genes belong to Class C. |
| Gene ontology having evidence of Inferred from Direct Assay (IDA) from Entrez |
| GO ID | GO term | PubMed ID |
| Top |
| TissGeneExp for HOXD1 |
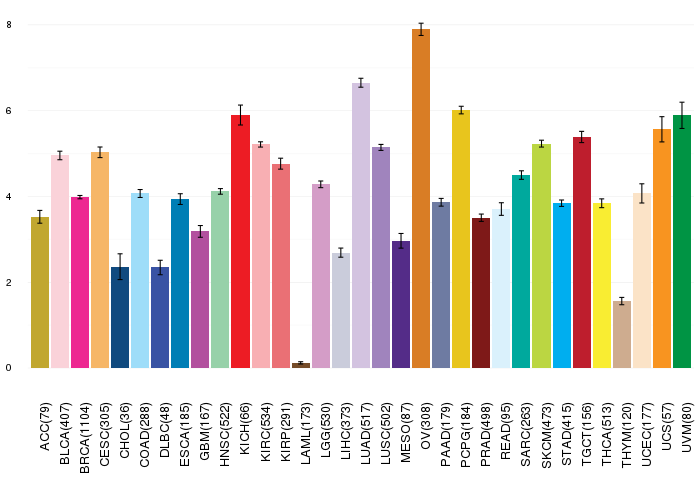
| Gene expressions across 28 cancer types (X-axis: cancer type and Y-axis: log2(norm_counts+1)) (TCGA IlluminaHiSeq_RNASeqV2, pan-cancer normalized log2(norm_counts+1) data, version 2016-08-16) |
 |
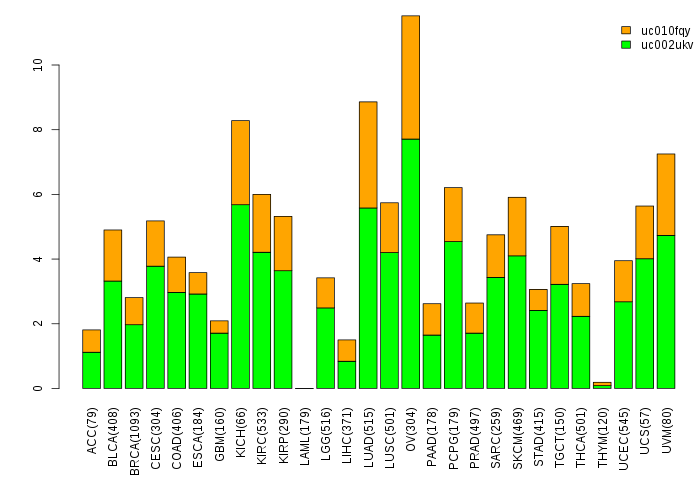
| Gene isoform expressions across 28 cancer types (X-axis: cancer type and Y-axis: log2(norm_counts+1)) (TCGA pan-cancer tcga_rsem_isoform_tpm, version 2016-09-01) |
 |
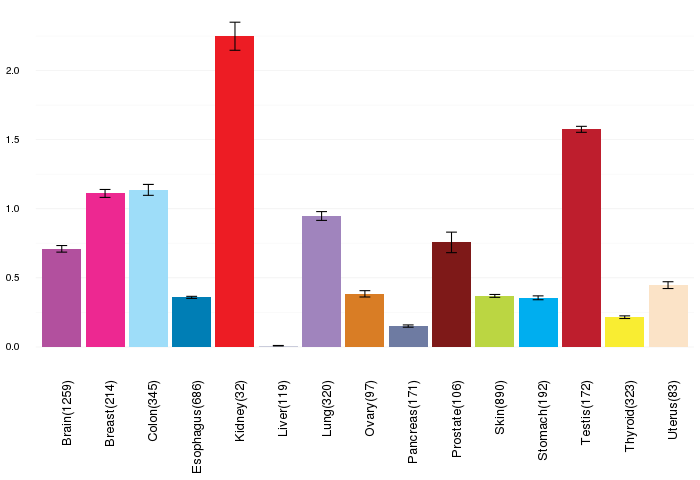
| Gene expressions across normal tissues of GTEx data (GTEx GTEx_Analysis_v6_RNA-seq_RNA-SeQCv1.1.8_gene_rpkm.gct) - Here, we shows the matched tissue types only among our 28 cancer types. |
 |
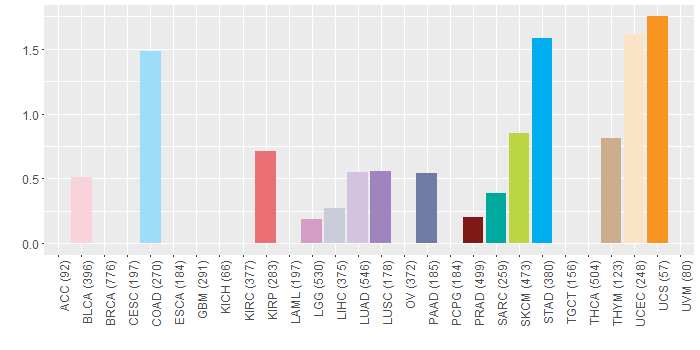
| Different expressions across 14 cancer types with more than 10 samples between matched tumors and normals (X-axis: cancer type and Y-axis: log2(norm_counts+1)) (TCGA IlluminaHiSeq_RNASeqV2, pan-cancer normalized log2(norm_counts+1) data, version 2016-08-16) |
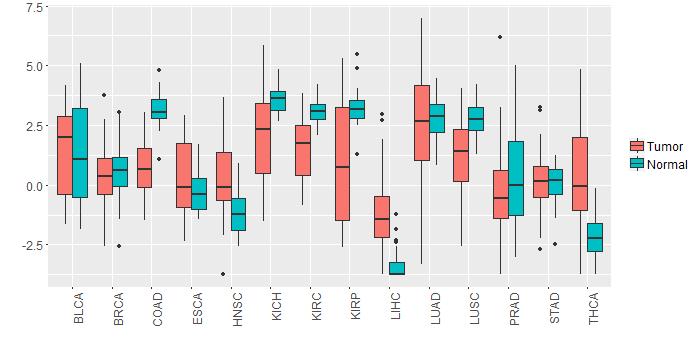 |
| - Significantly differentially expressed cancer types and information. (|Fold change|>1 and FDR<0.05) |
| Cancer type | Mean(exp) in tumor | Mean(exp) in matched normal | Log2FC | P-val. | FDR |
| LUSC | 1.190455908 | 2.745942183 | -1.555486275 | 8.14E-09 | 2.60E-08 |
| COAD | 0.633215712 | 3.156092635 | -2.522876923 | 1.09E-11 | 2.11E-10 |
| HNSC | 0.243521526 | -1.12870173 | 1.372223256 | 2.80E-06 | 1.88E-05 |
| THCA | 0.209470797 | -2.155288525 | 2.364759322 | 1.77E-11 | 1.30E-10 |
| KIRC | 1.546676823 | 3.094265712 | -1.547588889 | 2.09E-15 | 1.08E-14 |
| LIHC | -1.281280288 | -3.440620288 | 2.15934 | 4.64E-13 | 1.02E-11 |
| KICH | 1.973573712 | 3.642249712 | -1.668676 | 0.000201 | 0.000497757 |
| KIRP | 1.068915712 | 3.196575087 | -2.127659375 | 4.66E-05 | 0.000172405 |
| Top |
| TissGene-miRNA for HOXD1 |
| Significantly anti-correlated miRNAs of TissGene across 28 cancer types (Gene-miRNA relations from TargetScanHuman Relsease 7.1, Conserved_Site_Context_Scores.txt.zip, 06.01.2016) (TCGA IlluminaHiSeq_miRNASeq, log2(RPM+1) data, version 2016-11-21) (TCGA IlluminaHiSeq_RNASeqV2, log2(normalized_count+1) data, version 2016-08-16) (Spearman’s Rank Correlation (p-value<0.05 and coefficient<-0.25)) |
| Cancer type | miRNA id | miRNA accession | P-val. | Coeff. | # samples |
| LUAD | hsa-let-7g-5p | MIMAT0000414 | 0.038 | -0.27 | 60 |
| Top |
| TissGeneMut for HOXD1 |
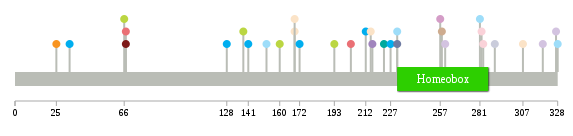
| TissGeneSNV for HOXD1 |
| nsSNV counts per each loci. Different colors of circles represent different cancer types. Circle size denotes number of samples. (TCGA somatic mutation (SNPs and small INDELs) data, version 2016-04-25) * Click on the image to enlarge it in a new window. |
 |
 |
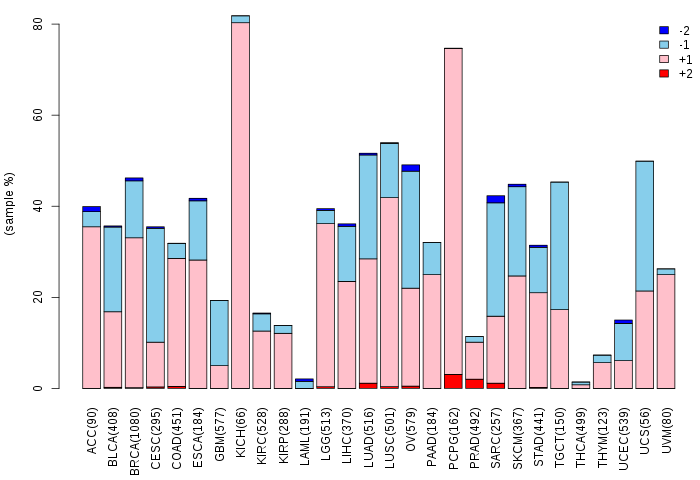
| Somatic nucleotide variants of TissGene across 28 cancer types (X-axis: cancer type and Y-axis: % of mutated samples) The numbers in parentheses are numbers of samples with mutation (nsSNVs). (TCGA somatic mutation (SNPs and small INDELs) data, version 2016-04-25) |
 |
| - nsSNVs sorted by frequency. |
| AAchange | Cancer type | # samples |
| p.A169V | UCEC | 1 |
| p.K216N | LUSC | 1 |
| p.I260M | LUAD | 1 |
| p.A257V | LGG | 1 |
| p.A67P | KIRP | 1 |
| p.P66R | SKCM | 1 |
| p.R212M | STAD | 1 |
| p.P77L | DLBC | 1 |
| p.A231V | PAAD | 1 |
| p.E290G | LIHC | 1 |
| p.S307F | UCEC | 1 |
| p.T271M | READ | 1 |
| p.K283R | BLCA | 1 |
| p.P25R | UCS | 1 |
| p.G128S | STAD | 1 |
| p.M282I | BLCA | 1 |
| p.P327R | LUAD | 1 |
| p.S227N | STAD | 1 |
| p.S193F | SKCM | 1 |
| p.Y223C | SARC | 1 |
| p.S141L | STAD | 1 |
| p.R33W | STAD | 1 |
| p.V152M | COAD | 1 |
| p.S328L | COAD | 1 |
| p.P160S | SKCM | 1 |
| p.R169Q | UCEC | 1 |
| p.R258W | THYM | 1 |
| p.D172N | STAD | 1 |
| p.A138V | SKCM | 1 |
| p.S203I | KIRP | 1 |
| p.E247X | READ | 1 |
| p.A67P | PRAD | 1 |
| p.A231V | COAD | 1 |
| p.S215F | UCEC | 1 |
| p.R281M | COAD | 1 |
| p.G319C | LUAD | 1 |
| Top |
| TissGeneCNV for HOXD1 |
| Copy number variations of TissGene across 28 cancer types (X-axis: cancer type and Y-axis: % of CNV samples) (TCGA Gistic2_CopyNumber_Gistic2_all_data_by_genes, Gistic2 copy number data, version 2016-08-16) |
 |
| Top |
| TissGeneFusions for HOXD1 |
| Fusion genes including TissGene (ChimerDB 3.0, 2016-12-01 and TCGA fusion Portal 2015-12-01) |
| Database | Src | Cancer type | Sample | Fusion gene | ORF | 5'-gene BP | 3'-gene BP |
| Chimerdb3.0 | ChiTaRs | NA | AW089983 | HOXD1-SENP6 | chr2:177055635 | chr6:76425286 |
| Top |
| TissGeneNet for HOXD1 |
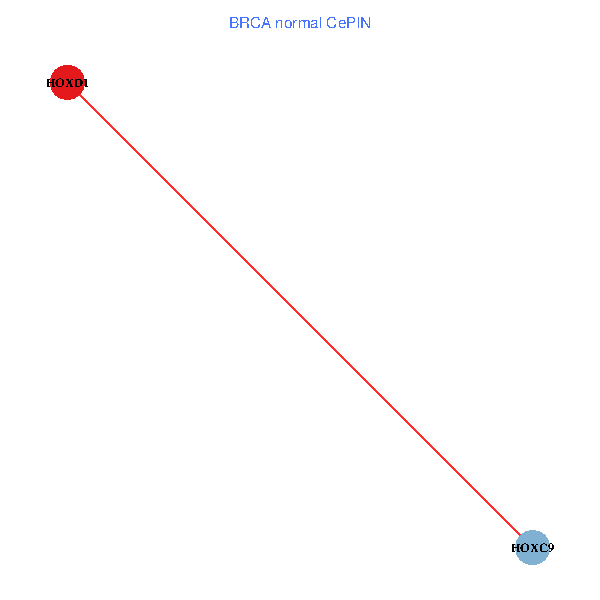
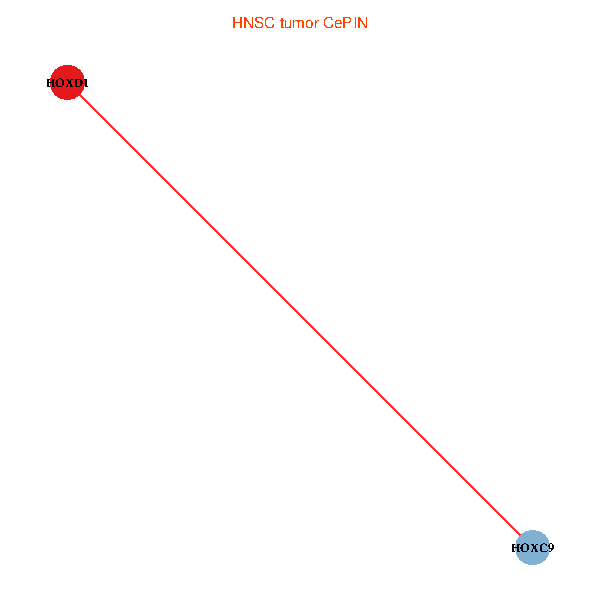
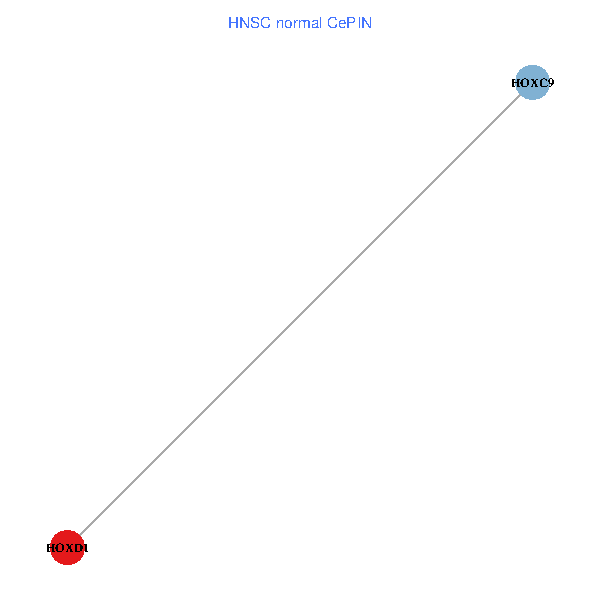
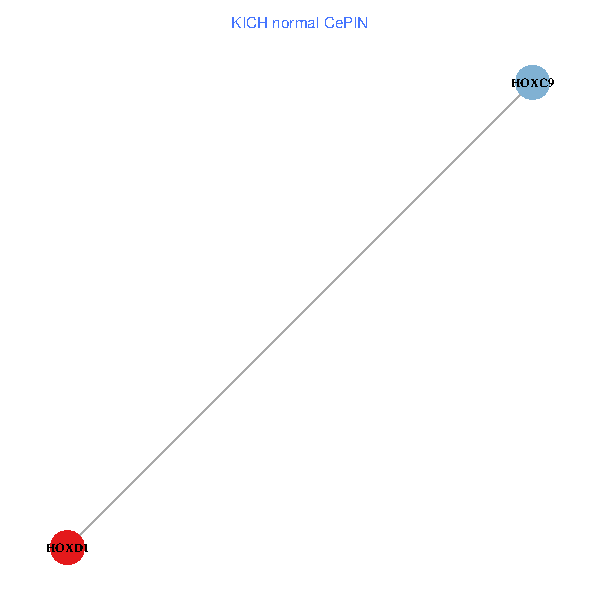
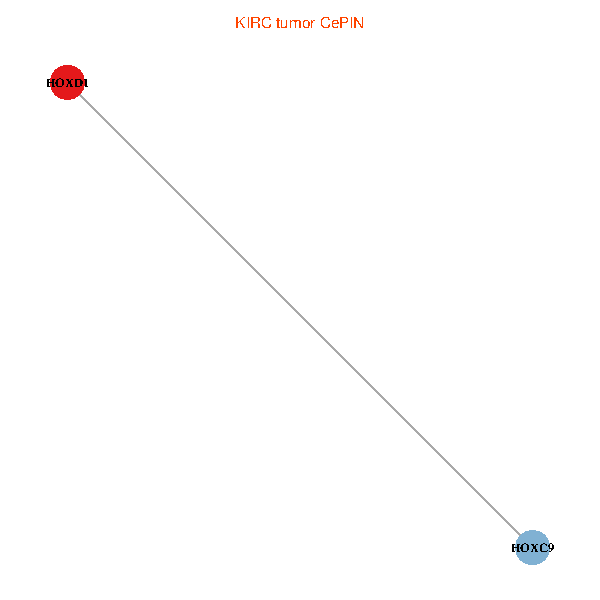
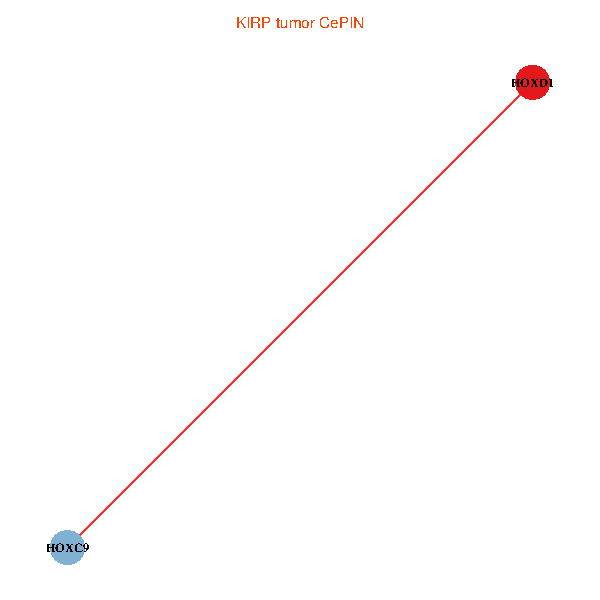
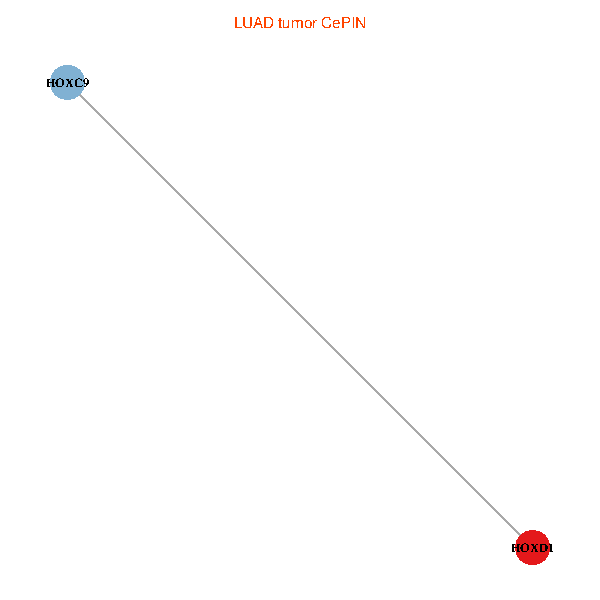
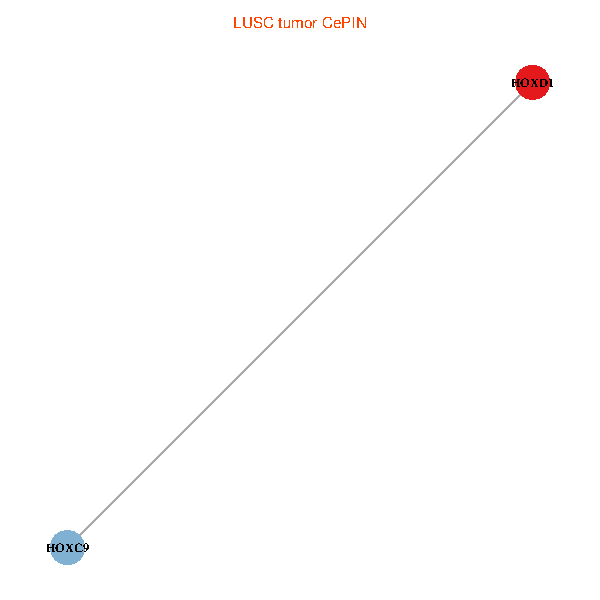
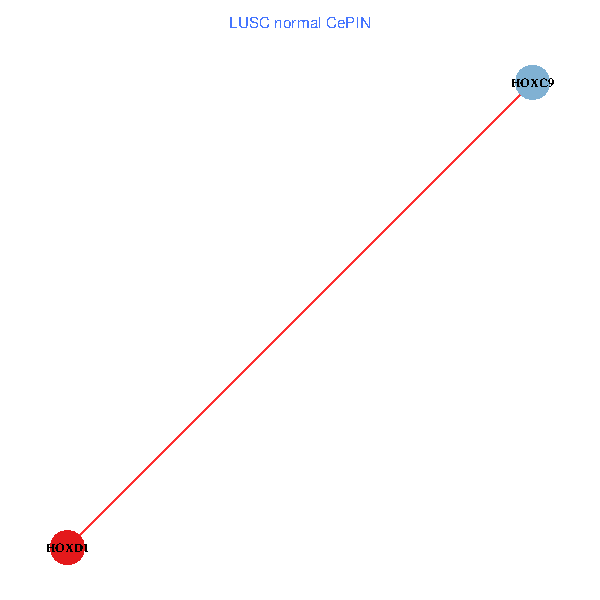
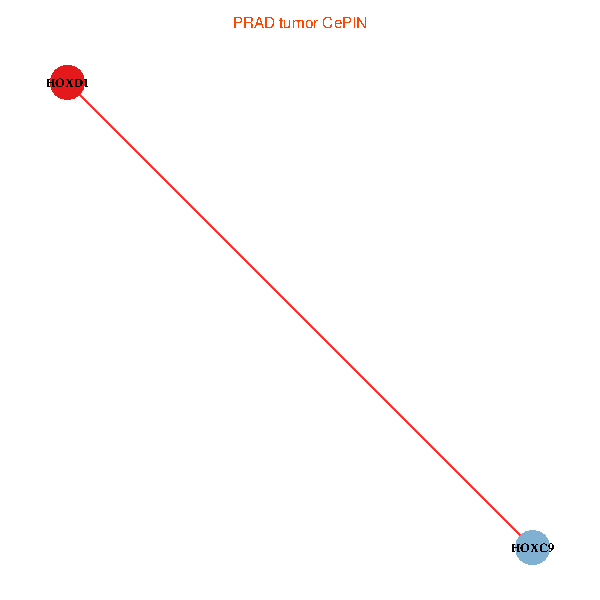
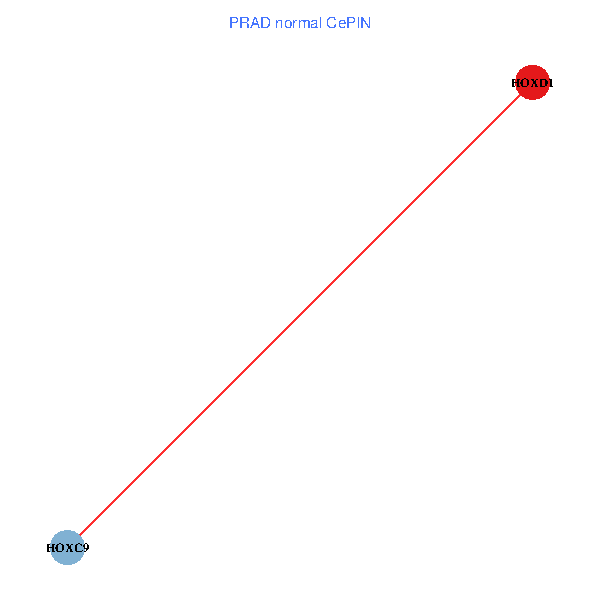
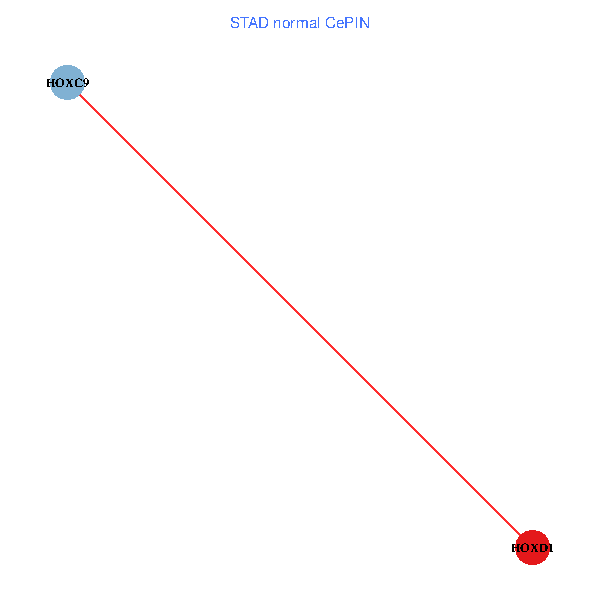
| Co-expressed gene networks based on protein-protein interaction data (CePIN) (TCGA IlluminaHiSeq_RNASeqV2, pan-cancer normalized log2(norm_counts+1) data, version 2016-08-16) (PINA2 ppi data) |
| BRCA (tumor) | BRCA (normal) |
| HOXD1, HOXC9 (tumor) | HOXD1, HOXC9 (normal) |
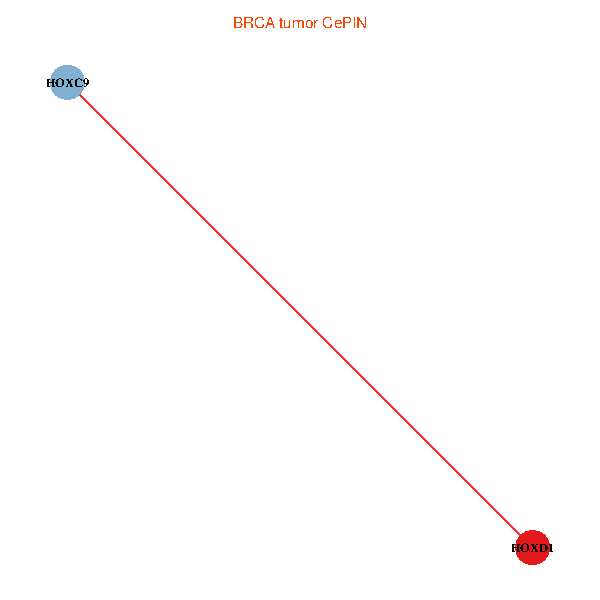 |  |
| COAD (tumor) | COAD (normal) |
| HOXD1, HOXC9 (tumor) | HOXD1, HOXC9 (normal) |
 |  |
| HNSC (tumor) | HNSC (normal) |
| HOXD1, HOXC9 (tumor) | HOXD1, HOXC9 (normal) |
 |  |
| KICH (tumor) | KICH (normal) |
| HOXD1, HOXC9 (tumor) | HOXD1, HOXC9 (normal) |
 |  |
| KIRC (tumor) | KIRC (normal) |
| HOXD1, HOXC9 (tumor) | HOXD1, HOXC9 (normal) |
 |  |
| KIRP (tumor) | KIRP (normal) |
| HOXD1, HOXC9 (tumor) | HOXD1, HOXC9 (normal) |
 |  |
| LIHC (tumor) | LIHC (normal) |
| HOXD1, HOXC9 (tumor) | HOXD1, HOXC9 (normal) |
 |  |
| LUAD (tumor) | LUAD (normal) |
| HOXD1, HOXC9 (tumor) | HOXD1, HOXC9 (normal) |
 |  |
| LUSC (tumor) | LUSC (normal) |
| HOXD1, HOXC9 (tumor) | HOXD1, HOXC9 (normal) |
 |  |
| PRAD (tumor) | PRAD (normal) |
| HOXD1, HOXC9 (tumor) | HOXD1, HOXC9 (normal) |
 |  |
| STAD (tumor) | STAD (normal) |
| HOXD1, HOXC9 (tumor) | HOXD1, HOXC9 (normal) |
 |  |
| THCA (tumor) | THCA (normal) |
| HOXD1, HOXC9 (tumor) | HOXD1, HOXC9 (normal) |
 |  |
| Top |
| TissGeneProg for HOXD1 |
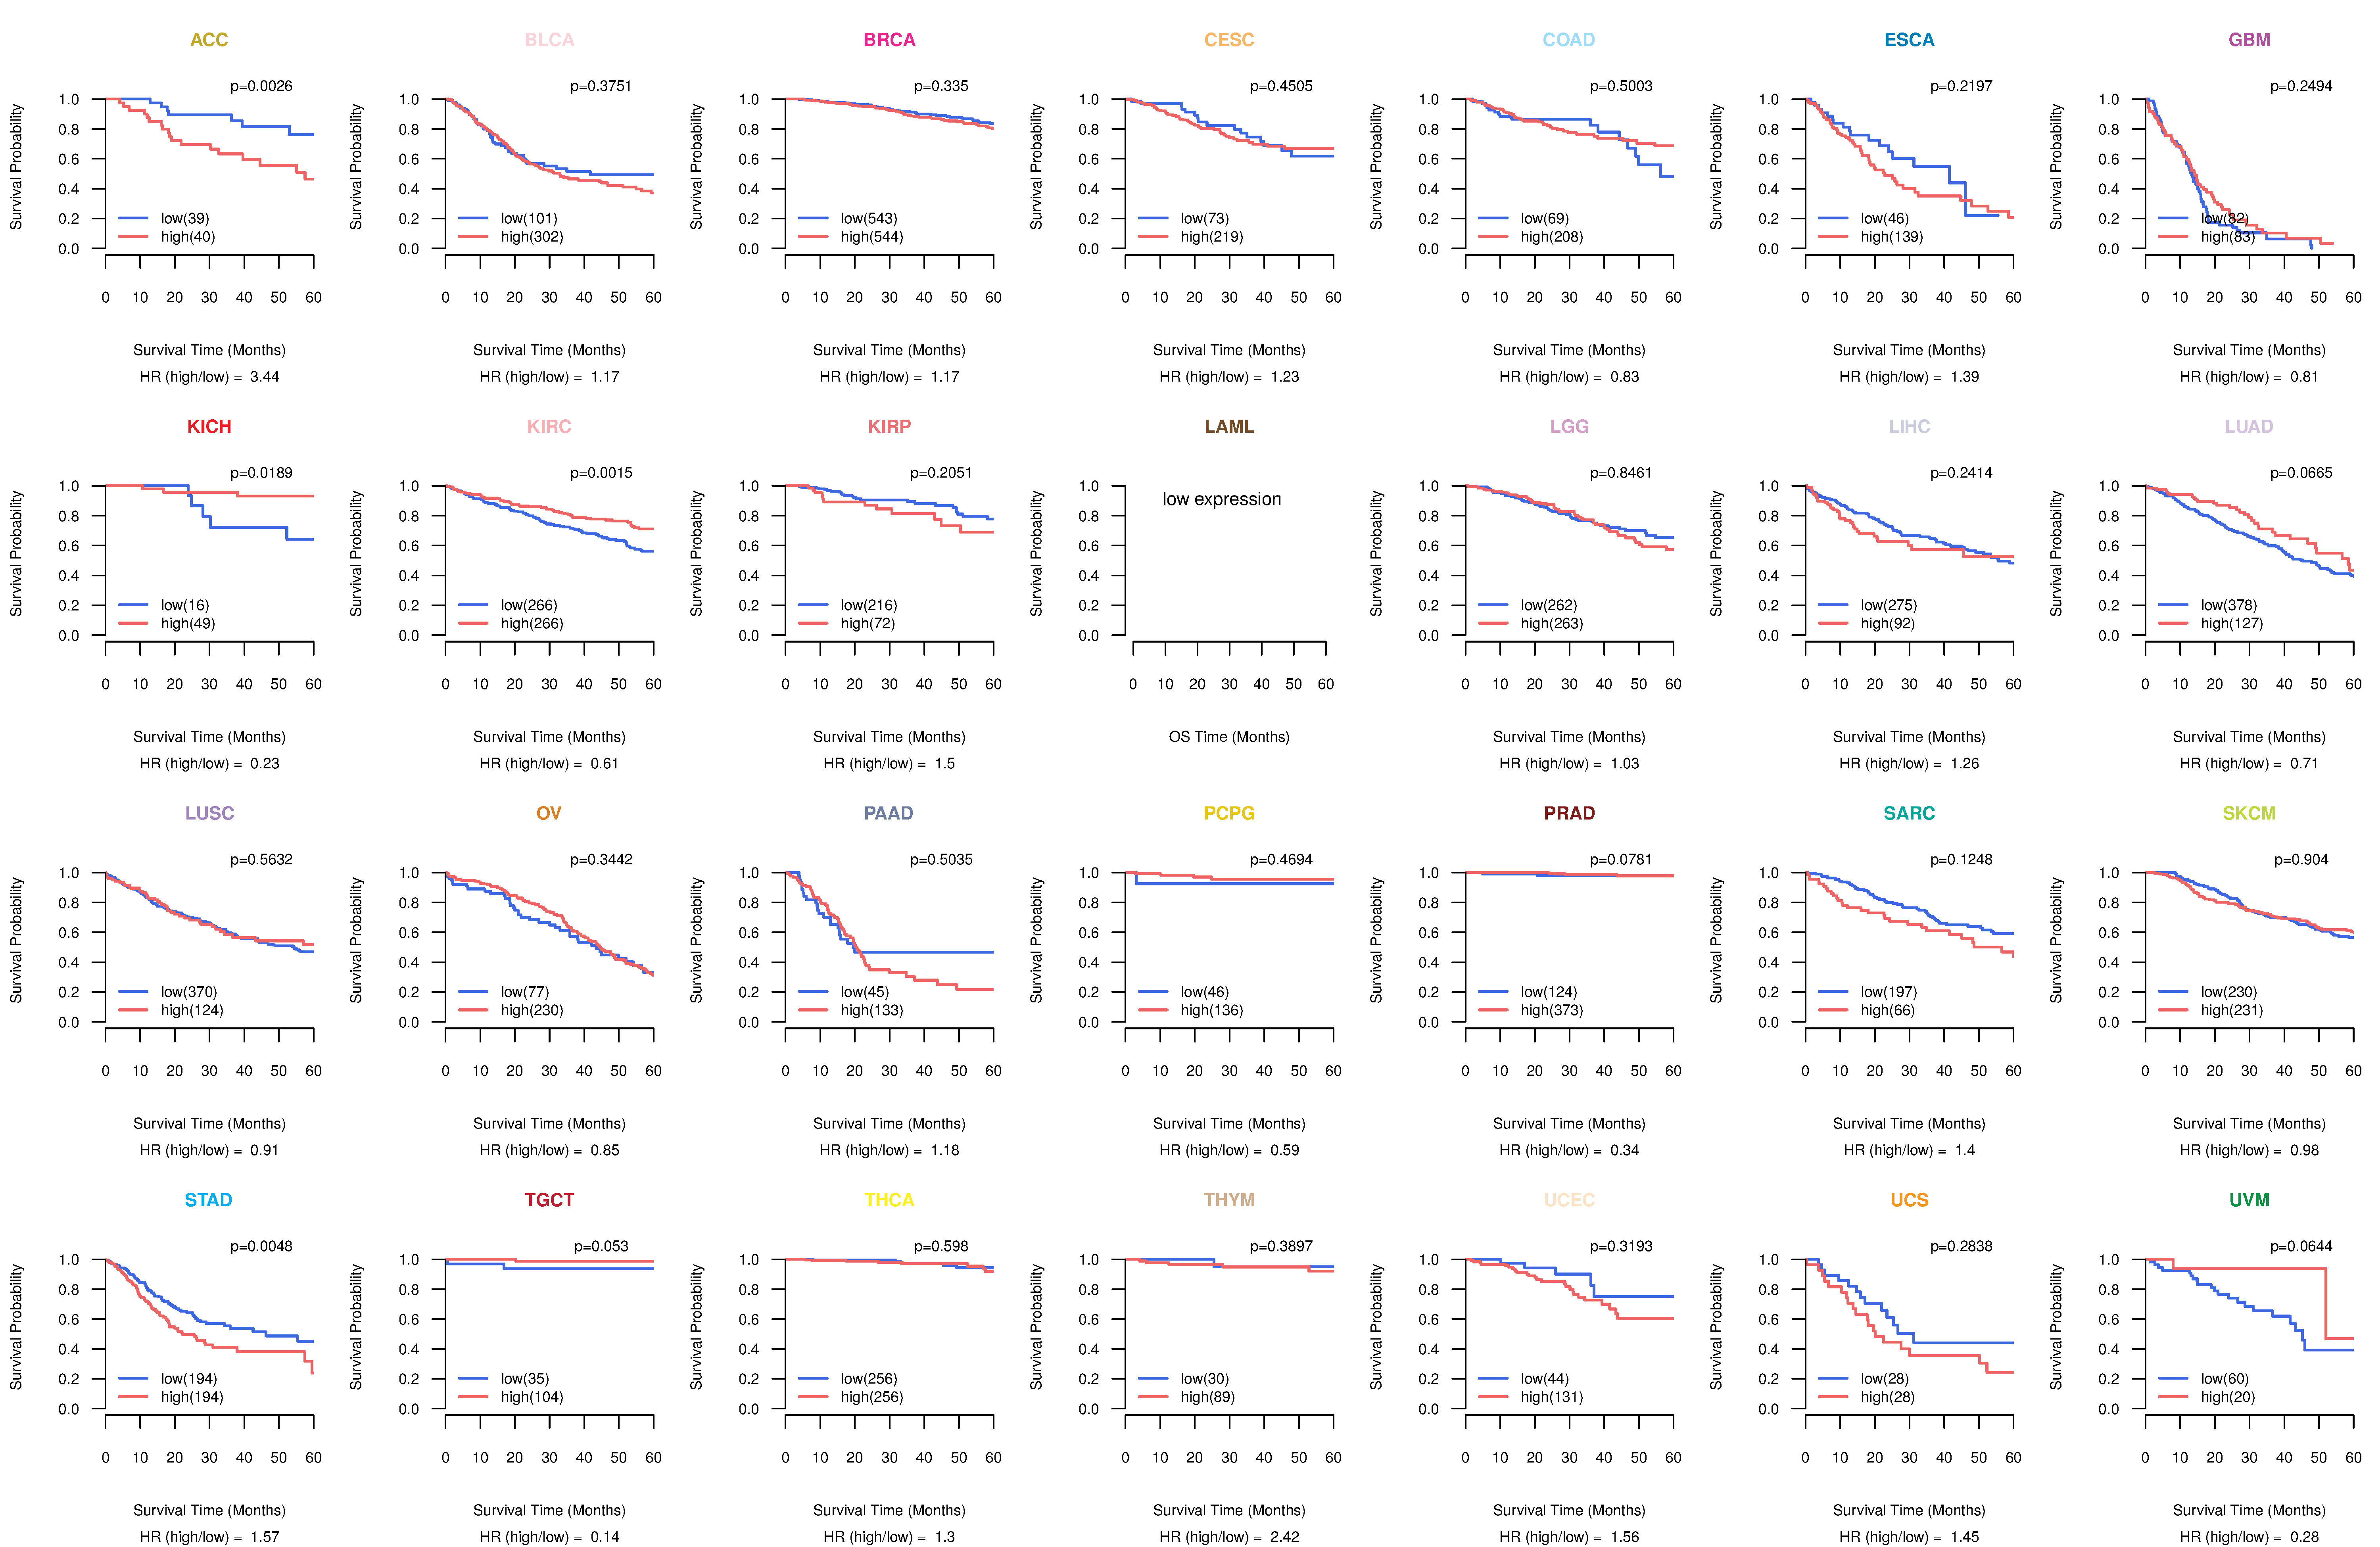
| Kaplan-Meier plots with logrank tests of overall survival (OS) using 28 cancer types (TCGA IlluminaHiSeq_RNASeqV2, pan-cancer normalized log2(norm_counts+1) data, version 2016-08-16) (TCGA clinicalMatrix, phenotype data, version 2016-04-27) * Click on the image to enlarge it in a new window. |
 |
| Kaplan-Meier plots with logrank test of relapse free survival (RFS) using 28 cancer types (TCGA IlluminaHiSeq_RNASeqV2, pan-cancer normalized log2(norm_counts+1) data, version 2016-08-16) (TCGA clinicalMatrix, phenotype data, version 2016-04-27) * Click on the image enlarge it in a new window. |
 |
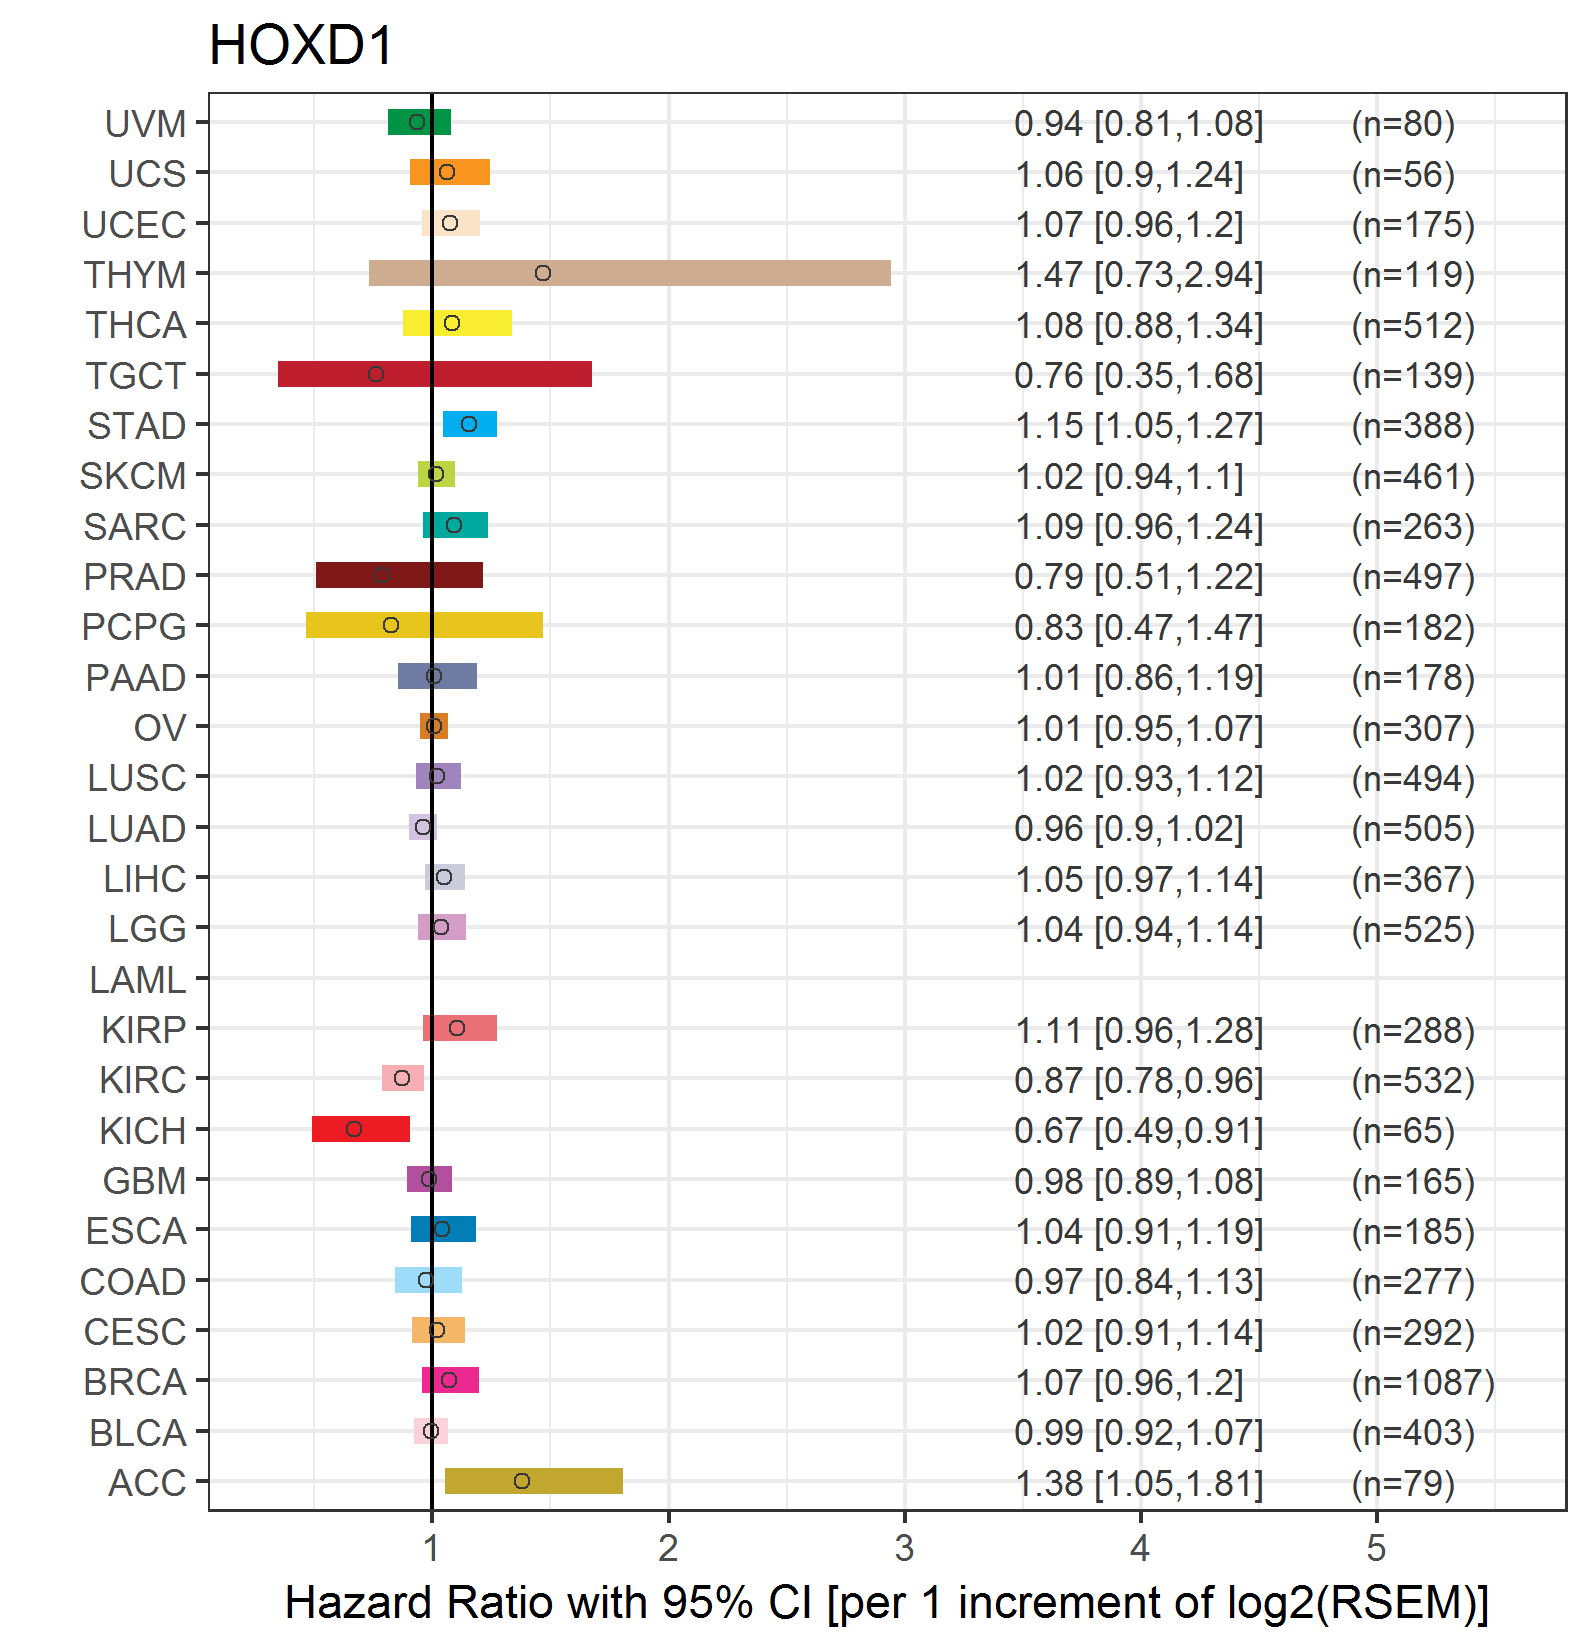
| Forest plot of Cox proportional hazard ratio (HR) and 95% CI of overall survival (OS) using 28 cancer types (TCGA IlluminaHiSeq_RNASeqV2, pan-cancer normalized log2(norm_counts+1) data, version 2016-08-16) (TCGA clinicalMatrix, phenotype data, version 2016-04-27) * Click on the image enlarge it in a new window. |
 |
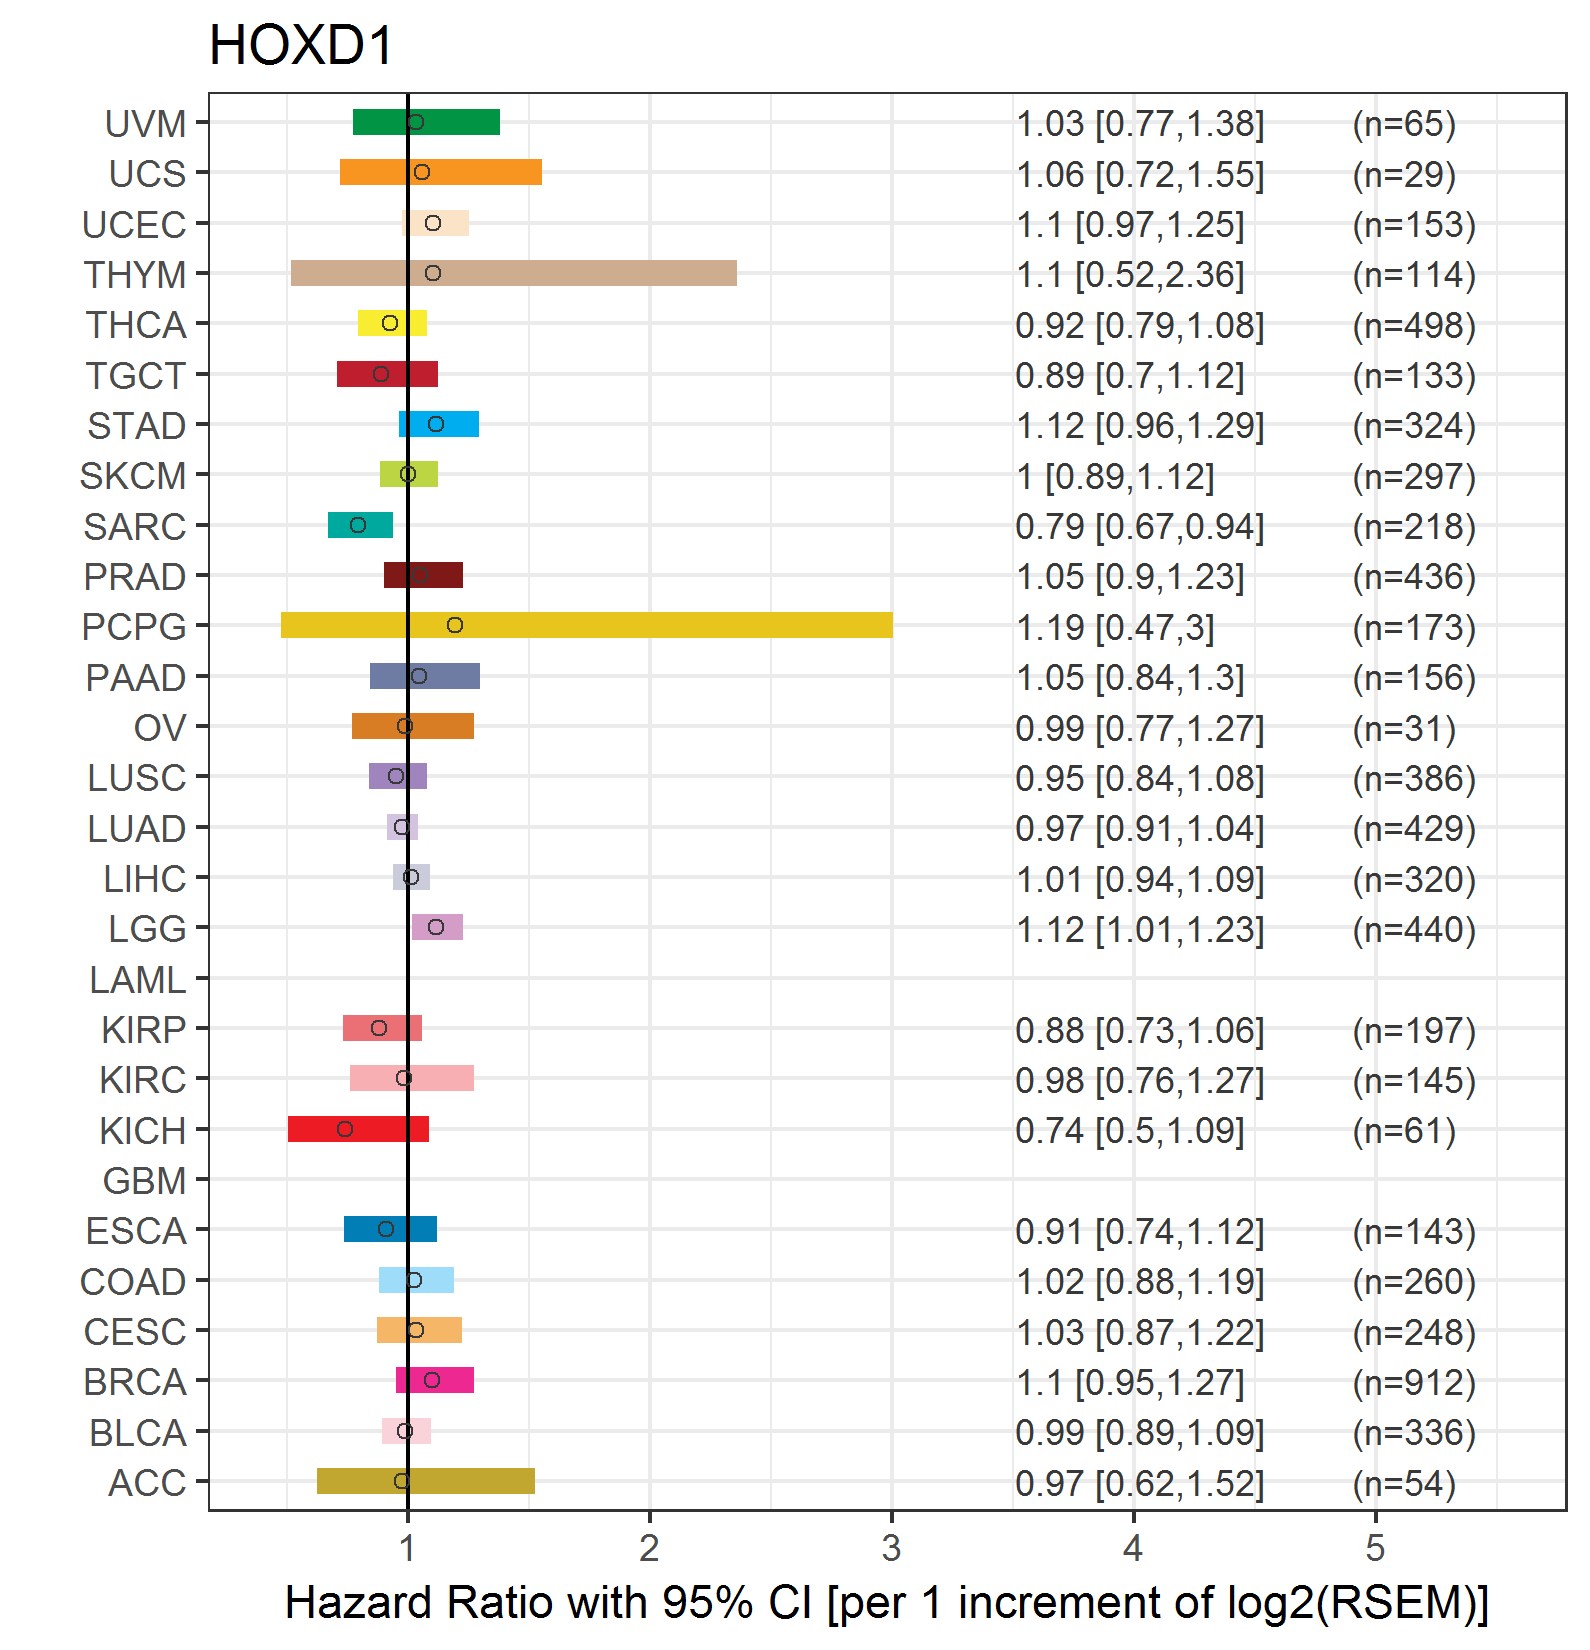
| Forest plot of Cox proportional hazard ratio (HR) and 95% CI of relapse free survival (RFS) using 28 cancer types (TCGA IlluminaHiSeq_RNASeqV2, pan-cancer normalized log2(norm_counts+1) data, version 2016-08-16) (TCGA clinicalMatrix, phenotype data, version 2016-04-27) * Click on the image enlarge it in a new window. |
 |
| Top |
| TissGeneClin for HOXD1 |
| TissGeneDrug for HOXD1 |
| Drug information targeting TissGene (DrugBank Version 5.0.6, 2017-04-01) |
| DrugBank ID | Drug name | Drug activity | Drug type | Drug status |
| Top |
| TissGeneDisease for HOXD1 |
| Disease information associated with TissGene (DisGeNet, 2016-06-01) |
| Disease ID | Disease name | # pubmeds | Source |
| umls:C0009081 | Congenital clubfoot | 1 | GAD |
| umls:C0009404 | Colorectal Neoplasms | 1 | CTD_human |
| umls:C0020429 | Hyperalgesia | 1 | CTD_human |
| umls:C0030193 | Pain | 1 | CTD_human |
| umls:C0596263 | Carcinogenesis | 1 | BeFree |
| umls:C0919267 | ovarian neoplasm | 1 | CTD_human |
| umls:C1140680 | Malignant neoplasm of ovary | 1 | GAD |
|
Copyright 2016-Present - The University of Texas Health Science Center at Houston (UTHealth) Web File Viewing | How to Report, Fraud, Waste and Abuse | State of Texas | Statewide Search | Texas Homeland Security | Site Policies |