 |
| |
| |
| |
| |
| |
| |
|

| TissGeneSummary for HOXD10 |
 Gene summary Gene summary |
| Basic gene information | Gene symbol | HOXD10 |
| Gene name | homeobox D10 | |
| Synonyms | HOX4|HOX4D|HOX4E|Hox-4.4 | |
| Cytomap | UCSC genome browser: 2q31.1 | |
| Type of gene | protein-coding | |
| RefGenes | NM_002148.3, | |
| Description | homeo box 4Dhomeo box D10homeobox protein Hox-4Dhomeobox protein Hox-4Ehomeobox protein Hox-D10 | |
| Modification date | 20141207 | |
| dbXrefs | MIM : 142984 | |
| HGNC : HGNC | ||
| Ensembl : ENSG00000128710 | ||
| HPRD : 00867 | ||
| Vega : OTTHUMG00000132511 | ||
| Protein | UniProt: go to UniProt's Cross Reference DB Table | |
| Expression | CleanEX: HS_HOXD10 | |
| BioGPS: 3236 | ||
| Pathway | NCI Pathway Interaction Database: HOXD10 | |
| KEGG: HOXD10 | ||
| REACTOME: HOXD10 | ||
| Pathway Commons: HOXD10 | ||
| Context | iHOP: HOXD10 | |
| ligand binding site mutation search in PubMed: HOXD10 | ||
| UCL Cancer Institute: HOXD10 | ||
| Assigned class in TissGDB* | C | |
| Included tissue-specific gene expression resources | ||
| Specific-tissues in normal samples (assigned by TissGDB using HPA, TiGER, and GTEx) | KidneyUterus | |
| Cancer types related to the specific-tissues in cancer samples (assigned by TissGDB using TCGA) | KIRC,KIRP,KICHUCEC,UCS | |
| Reference showing the relevant tissue of HOXD10 | ||
| Description by TissGene annotations | Risk TissGene in RFS Have significant anti-correlated miRNA | |
| * Class A consists of genes with literature evidence and is part of the cTissGenes. Class B consists of only cTissGenes without additional evidence. The remaining genes belong to Class C. |
| Gene ontology having evidence of Inferred from Direct Assay (IDA) from Entrez |
| GO ID | GO term | PubMed ID |
| Top |
| TissGeneExp for HOXD10 |
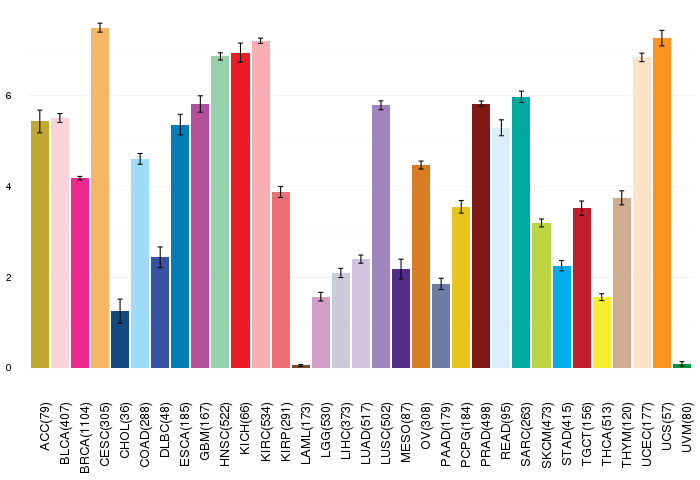
| Gene expressions across 28 cancer types (X-axis: cancer type and Y-axis: log2(norm_counts+1)) (TCGA IlluminaHiSeq_RNASeqV2, pan-cancer normalized log2(norm_counts+1) data, version 2016-08-16) |
 |
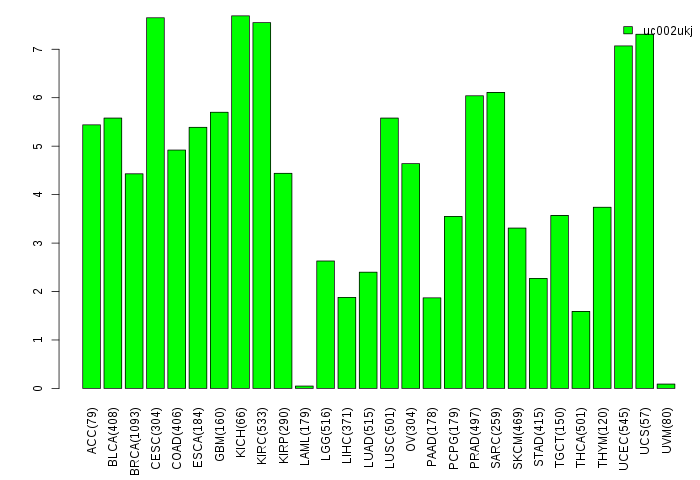
| Gene isoform expressions across 28 cancer types (X-axis: cancer type and Y-axis: log2(norm_counts+1)) (TCGA pan-cancer tcga_rsem_isoform_tpm, version 2016-09-01) |
 |
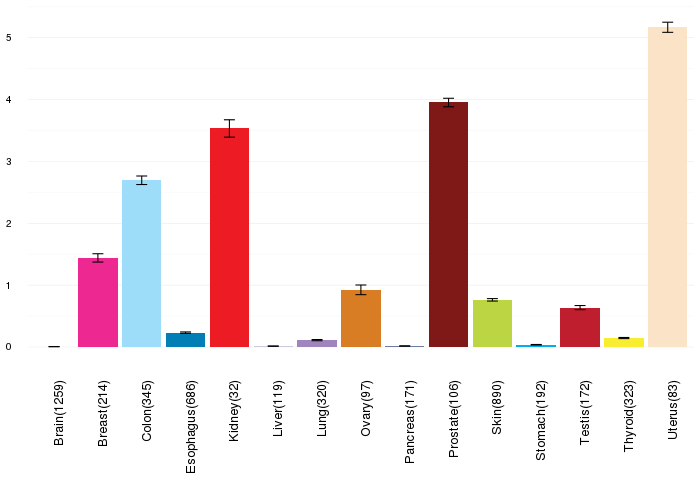
| Gene expressions across normal tissues of GTEx data (GTEx GTEx_Analysis_v6_RNA-seq_RNA-SeQCv1.1.8_gene_rpkm.gct) - Here, we shows the matched tissue types only among our 28 cancer types. |
 |
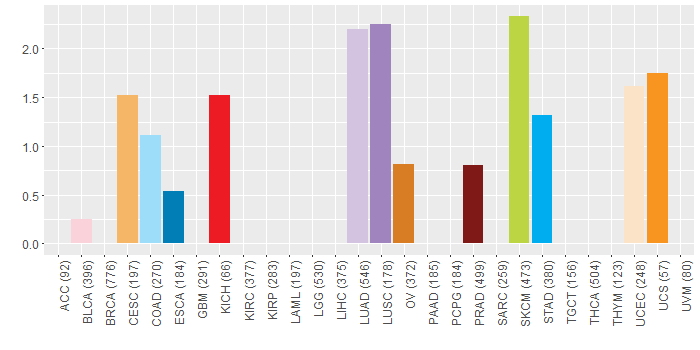
| Different expressions across 14 cancer types with more than 10 samples between matched tumors and normals (X-axis: cancer type and Y-axis: log2(norm_counts+1)) (TCGA IlluminaHiSeq_RNASeqV2, pan-cancer normalized log2(norm_counts+1) data, version 2016-08-16) |
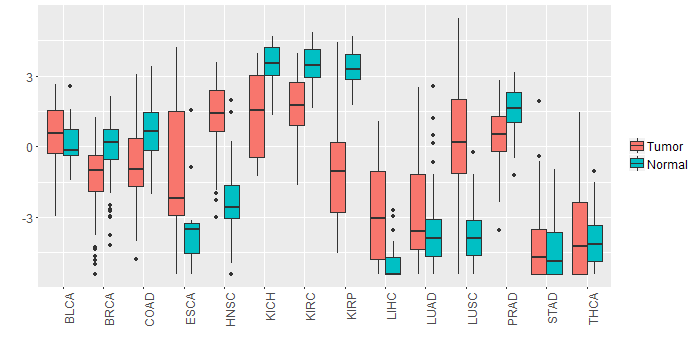 |
| - Significantly differentially expressed cancer types and information. (|Fold change|>1 and FDR<0.05) |
| Cancer type | Mean(exp) in tumor | Mean(exp) in matched normal | Log2FC | P-val. | FDR |
| LIHC | -2.816174836 | -5.057188836 | 2.241014 | 6.36E-10 | 7.17E-09 |
| KIRC | 1.713377331 | 3.465248164 | -1.751870833 | 1.08E-16 | 6.19E-16 |
| KICH | 1.344393164 | 3.539489164 | -2.195096 | 1.56E-06 | 5.71E-06 |
| PRAD | 0.478663549 | 1.522794318 | -1.044130769 | 1.02E-05 | 5.66E-05 |
| KIRP | -0.832864336 | 3.363770039 | -4.196634375 | 2.03E-11 | 2.65E-10 |
| BRCA | -1.188589116 | -0.042243502 | -1.146345614 | 6.06E-11 | 2.43E-10 |
| LUSC | 0.195579047 | -3.675968012 | 3.871547059 | 3.82E-15 | 2.42E-14 |
| HNSC | 1.205549908 | -2.266552417 | 3.472102326 | 1.59E-15 | 1.70E-13 |
| COAD | -0.696969143 | 0.679000087 | -1.375969231 | 0.0028 | 0.007192028 |
| Top |
| TissGene-miRNA for HOXD10 |
| Significantly anti-correlated miRNAs of TissGene across 28 cancer types (Gene-miRNA relations from TargetScanHuman Relsease 7.1, Conserved_Site_Context_Scores.txt.zip, 06.01.2016) (TCGA IlluminaHiSeq_miRNASeq, log2(RPM+1) data, version 2016-11-21) (TCGA IlluminaHiSeq_RNASeqV2, log2(normalized_count+1) data, version 2016-08-16) (Spearman’s Rank Correlation (p-value<0.05 and coefficient<-0.25)) |
| Cancer type | miRNA id | miRNA accession | P-val. | Coeff. | # samples |
| UCS | hsa-miR-218-5p | MIMAT0000275 | 0.03 | -0.29 | 56 |
| LUAD | hsa-miR-10a-5p | MIMAT0000253 | 0.012 | -0.33 | 60 |
| Top |
| TissGeneMut for HOXD10 |
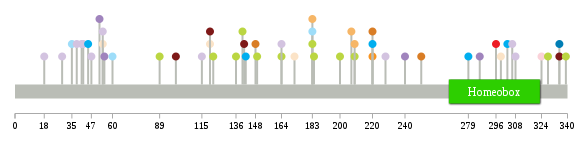
| TissGeneSNV for HOXD10 |
| nsSNV counts per each loci. Different colors of circles represent different cancer types. Circle size denotes number of samples. (TCGA somatic mutation (SNPs and small INDELs) data, version 2016-04-25) * Click on the image to enlarge it in a new window. |
 |
 |
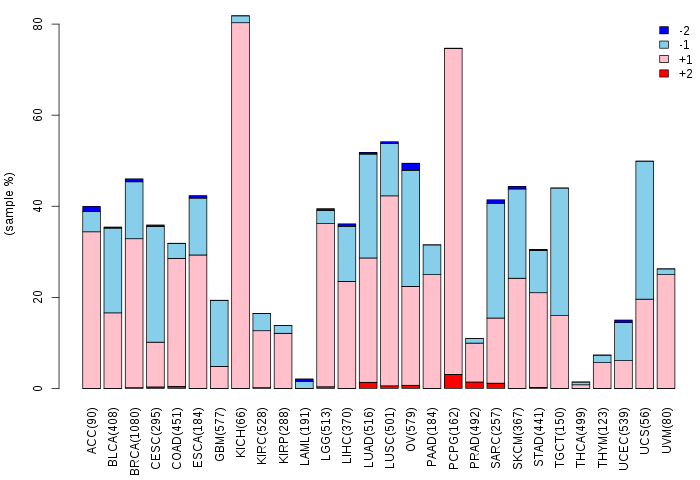
| Somatic nucleotide variants of TissGene across 28 cancer types (X-axis: cancer type and Y-axis: % of mutated samples) The numbers in parentheses are numbers of samples with mutation (nsSNVs). (TCGA somatic mutation (SNPs and small INDELs) data, version 2016-04-25) |
 |
| - nsSNVs sorted by frequency. |
| AAchange | Cancer type | # samples |
| p.R296L | KICH | 1 |
| p.P240H | LUSC | 1 |
| p.Q156H | HNSC | 1 |
| p.A41S | LUAD | 1 |
| p.A335T | PRAD | 1 |
| p.K200N | SKCM | 1 |
| p.E220Q | OV | 1 |
| p.Q164K | SKCM | 1 |
| p.I299T | UCEC | 1 |
| p.L286M | LUSC | 1 |
| p.Y151C | HNSC | 1 |
| p.E220K | UCS | 1 |
| p.E142K | STAD | 1 |
| p.P55T | LUSC | 1 |
| p.G52* | LUSC | 1 |
| p.E209D | CESC | 1 |
| p.G172C | UCEC | 1 |
| p.S29Y | LUAD | 1 |
| p.E209K | SKCM | 1 |
| p.V141I | PRAD | 1 |
| p.R183C | SKCM | 1 |
| p.L18F | LUAD | 1 |
| p.P149S | SKCM | 1 |
| p.R89Q | READ | 1 |
| p.M115L | LUAD | 1 |
| p.R120C | UCEC | 1 |
| p.P99L | PRAD | 1 |
| p.T306I | LUAD | 1 |
| p.Y35C | COAD | 1 |
| p.R89G | HNSC | 1 |
| p.P140L | SKCM | 1 |
| p.G207C | CESC | 1 |
| p.F339L | SKCM | 1 |
| p.P38S | LUAD | 1 |
| p.V303I | STAD | 1 |
| p.R89Q | SKCM | 1 |
| p.M324I | BLCA | 1 |
| p.E228Q | LUAD | 1 |
| p.T45A | STAD | 1 |
| p.D83H | HNSC | 1 |
| p.A335S | ESCA | 1 |
| p.N328S | SKCM | 1 |
| p.Q132L | READ | 1 |
| p.V148I | OV | 1 |
| p.G184S | SKCM | 1 |
| p.R183H | CESC | 1 |
| p.R120C | PRAD | 1 |
| p.L54I | UCEC | 1 |
| p.R183C | COAD | 1 |
| p.D42Y | LUAD | 1 |
| p.R60I | COAD | 1 |
| p.L54H | LUAD | 1 |
| p.K122N | SKCM | 1 |
| p.E250K | OV | 1 |
| p.E220K | STAD | 1 |
| p.R308K | LUAD | 1 |
| p.G47* | LUAD | 1 |
| p.Q164P | LUAD | 1 |
| p.L279P | STAD | 1 |
| p.R326P | HNSC | 1 |
| p.P136S | SKCM | 1 |
| Top |
| TissGeneCNV for HOXD10 |
| Copy number variations of TissGene across 28 cancer types (X-axis: cancer type and Y-axis: % of CNV samples) (TCGA Gistic2_CopyNumber_Gistic2_all_data_by_genes, Gistic2 copy number data, version 2016-08-16) |
 |
| Top |
| TissGeneFusions for HOXD10 |
| Fusion genes including TissGene (ChimerDB 3.0, 2016-12-01 and TCGA fusion Portal 2015-12-01) |
| Database | Src | Cancer type | Sample | Fusion gene | ORF | 5'-gene BP | 3'-gene BP |
| Top |
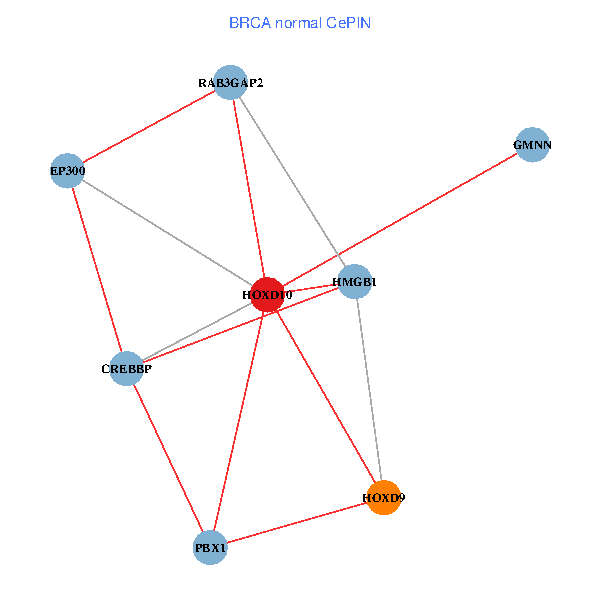
| TissGeneNet for HOXD10 |
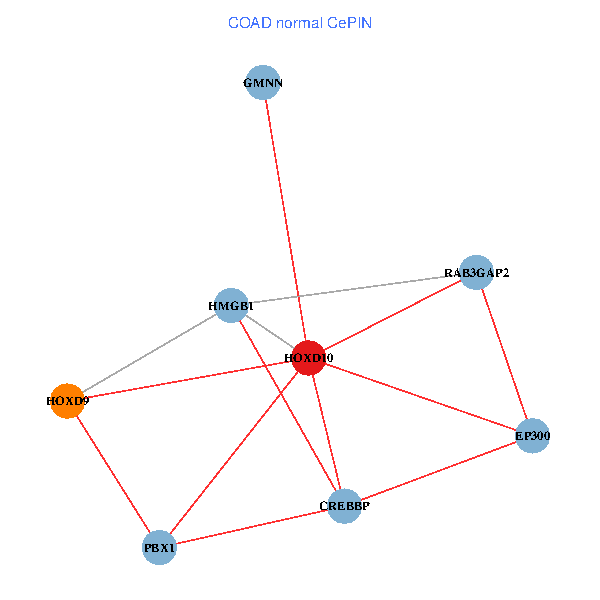
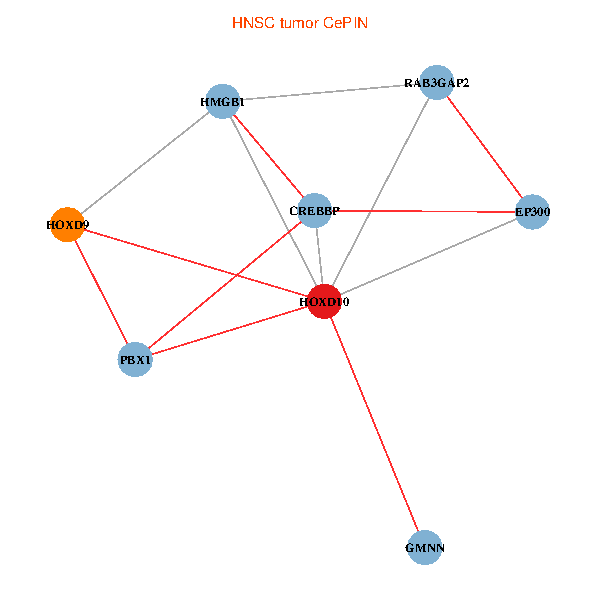
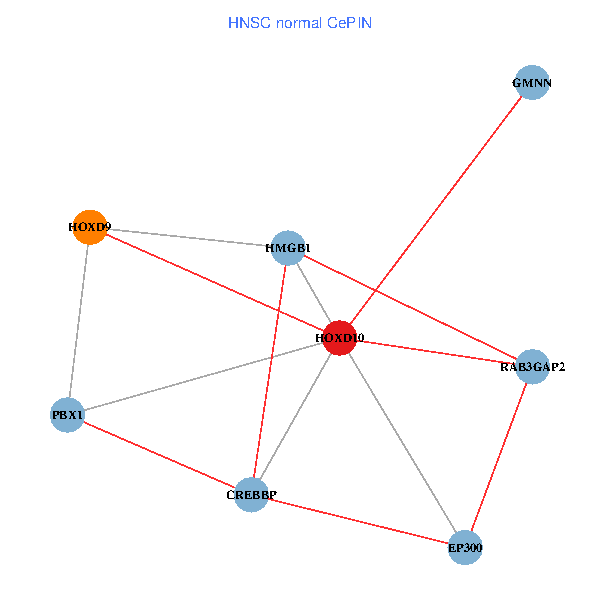
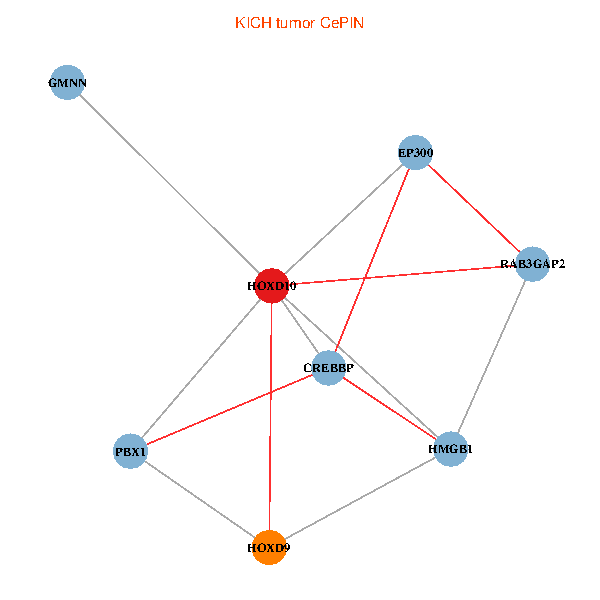
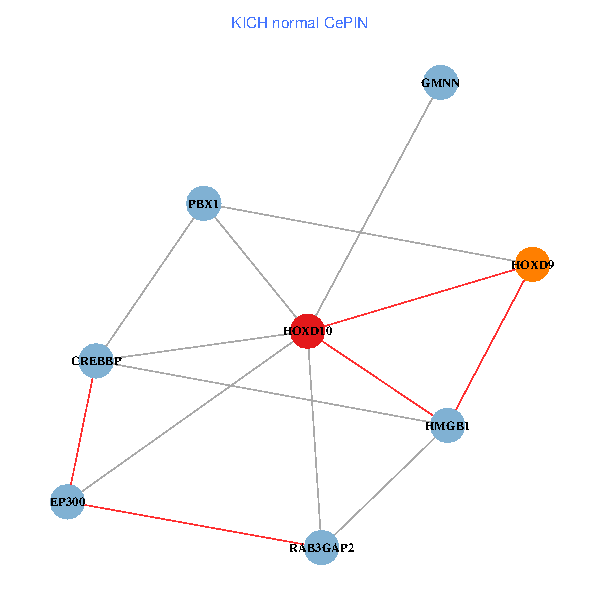
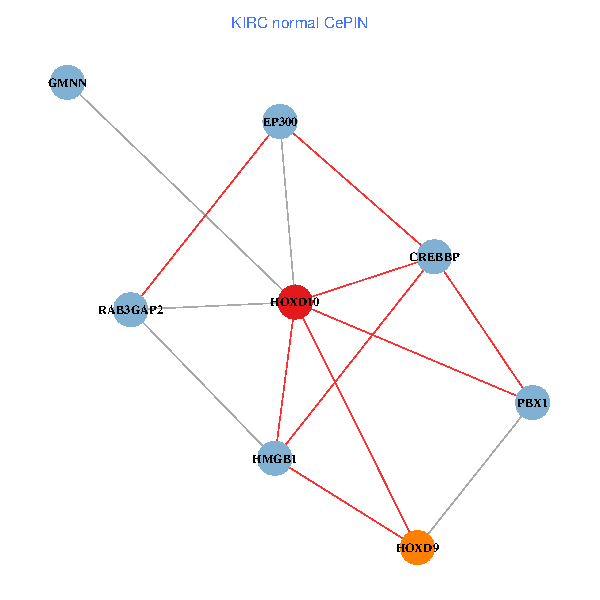
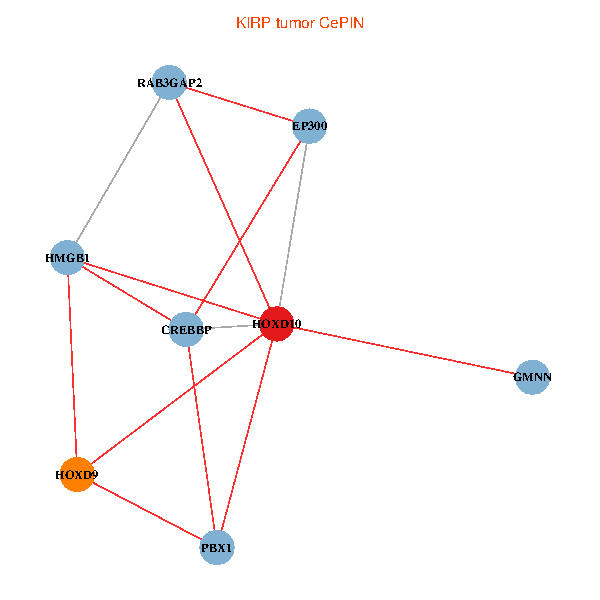
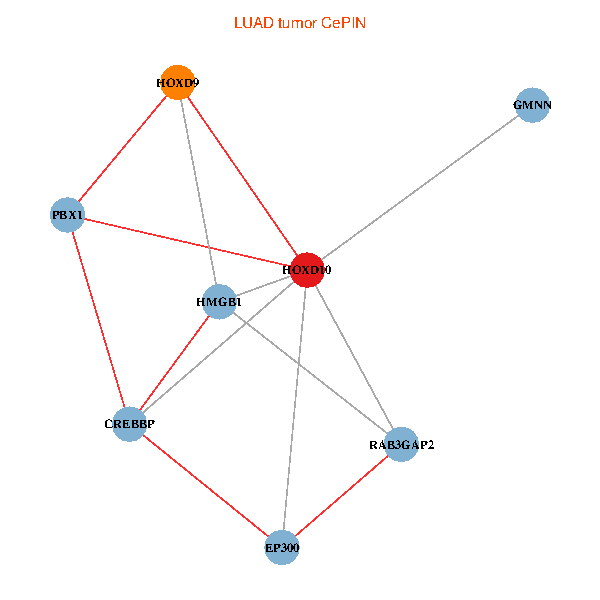
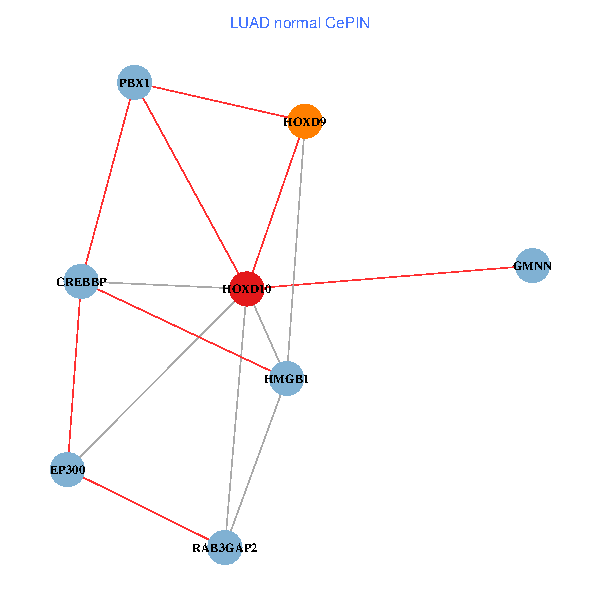
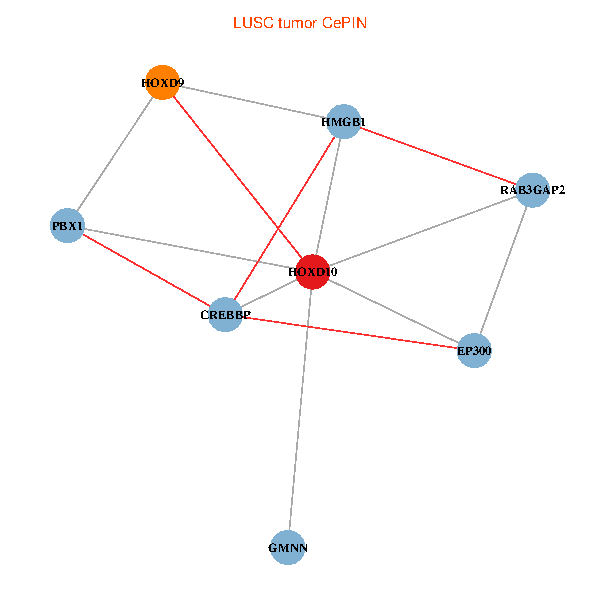
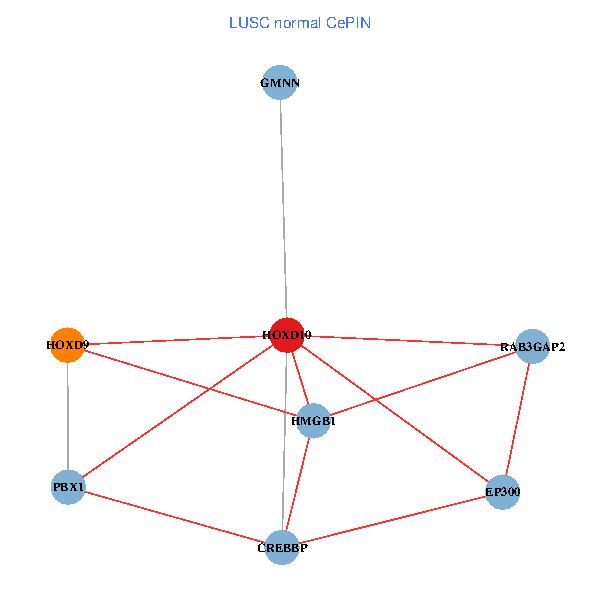
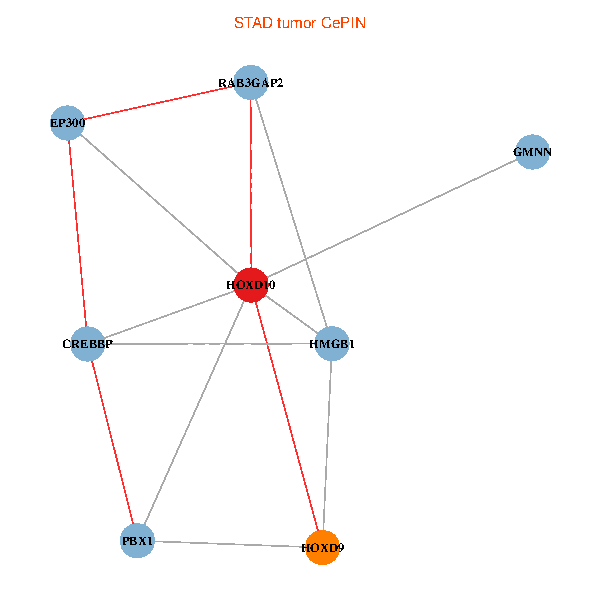
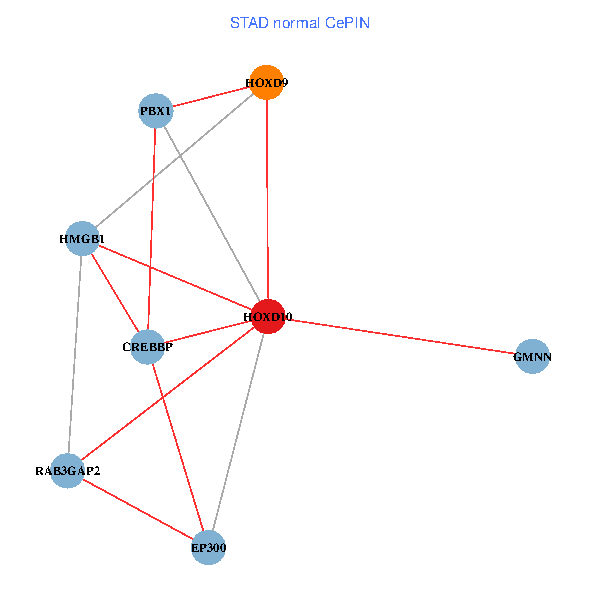
| Co-expressed gene networks based on protein-protein interaction data (CePIN) (TCGA IlluminaHiSeq_RNASeqV2, pan-cancer normalized log2(norm_counts+1) data, version 2016-08-16) (PINA2 ppi data) |
| BRCA (tumor) | BRCA (normal) |
| HOXD10, HMGB1, CREBBP, HOXD9, GMNN, EP300, RAB3GAP2, PBX1 (tumor) | HOXD10, HMGB1, CREBBP, HOXD9, GMNN, EP300, RAB3GAP2, PBX1 (normal) |
 |  |
| COAD (tumor) | COAD (normal) |
| HOXD10, HMGB1, CREBBP, HOXD9, GMNN, EP300, RAB3GAP2, PBX1 (tumor) | HOXD10, HMGB1, CREBBP, HOXD9, GMNN, EP300, RAB3GAP2, PBX1 (normal) |
 |  |
| HNSC (tumor) | HNSC (normal) |
| HOXD10, HMGB1, CREBBP, HOXD9, GMNN, EP300, RAB3GAP2, PBX1 (tumor) | HOXD10, HMGB1, CREBBP, HOXD9, GMNN, EP300, RAB3GAP2, PBX1 (normal) |
 |  |
| KICH (tumor) | KICH (normal) |
| HOXD10, HMGB1, CREBBP, HOXD9, GMNN, EP300, RAB3GAP2, PBX1 (tumor) | HOXD10, HMGB1, CREBBP, HOXD9, GMNN, EP300, RAB3GAP2, PBX1 (normal) |
 |  |
| KIRC (tumor) | KIRC (normal) |
| HOXD10, HMGB1, CREBBP, HOXD9, GMNN, EP300, RAB3GAP2, PBX1 (tumor) | HOXD10, HMGB1, CREBBP, HOXD9, GMNN, EP300, RAB3GAP2, PBX1 (normal) |
 |  |
| KIRP (tumor) | KIRP (normal) |
| HOXD10, HMGB1, CREBBP, HOXD9, GMNN, EP300, RAB3GAP2, PBX1 (tumor) | HOXD10, HMGB1, CREBBP, HOXD9, GMNN, EP300, RAB3GAP2, PBX1 (normal) |
 |  |
| LIHC (tumor) | LIHC (normal) |
| HOXD10, HMGB1, CREBBP, HOXD9, GMNN, EP300, RAB3GAP2, PBX1 (tumor) | HOXD10, HMGB1, CREBBP, HOXD9, GMNN, EP300, RAB3GAP2, PBX1 (normal) |
 |  |
| LUAD (tumor) | LUAD (normal) |
| HOXD10, HMGB1, CREBBP, HOXD9, GMNN, EP300, RAB3GAP2, PBX1 (tumor) | HOXD10, HMGB1, CREBBP, HOXD9, GMNN, EP300, RAB3GAP2, PBX1 (normal) |
 |  |
| LUSC (tumor) | LUSC (normal) |
| HOXD10, HMGB1, CREBBP, HOXD9, GMNN, EP300, RAB3GAP2, PBX1 (tumor) | HOXD10, HMGB1, CREBBP, HOXD9, GMNN, EP300, RAB3GAP2, PBX1 (normal) |
 |  |
| PRAD (tumor) | PRAD (normal) |
| HOXD10, HMGB1, CREBBP, HOXD9, GMNN, EP300, RAB3GAP2, PBX1 (tumor) | HOXD10, HMGB1, CREBBP, HOXD9, GMNN, EP300, RAB3GAP2, PBX1 (normal) |
 |  |
| STAD (tumor) | STAD (normal) |
| HOXD10, HMGB1, CREBBP, HOXD9, GMNN, EP300, RAB3GAP2, PBX1 (tumor) | HOXD10, HMGB1, CREBBP, HOXD9, GMNN, EP300, RAB3GAP2, PBX1 (normal) |
 |  |
| THCA (tumor) | THCA (normal) |
| HOXD10, HMGB1, CREBBP, HOXD9, GMNN, EP300, RAB3GAP2, PBX1 (tumor) | HOXD10, HMGB1, CREBBP, HOXD9, GMNN, EP300, RAB3GAP2, PBX1 (normal) |
 |  |
| Top |
| TissGeneProg for HOXD10 |
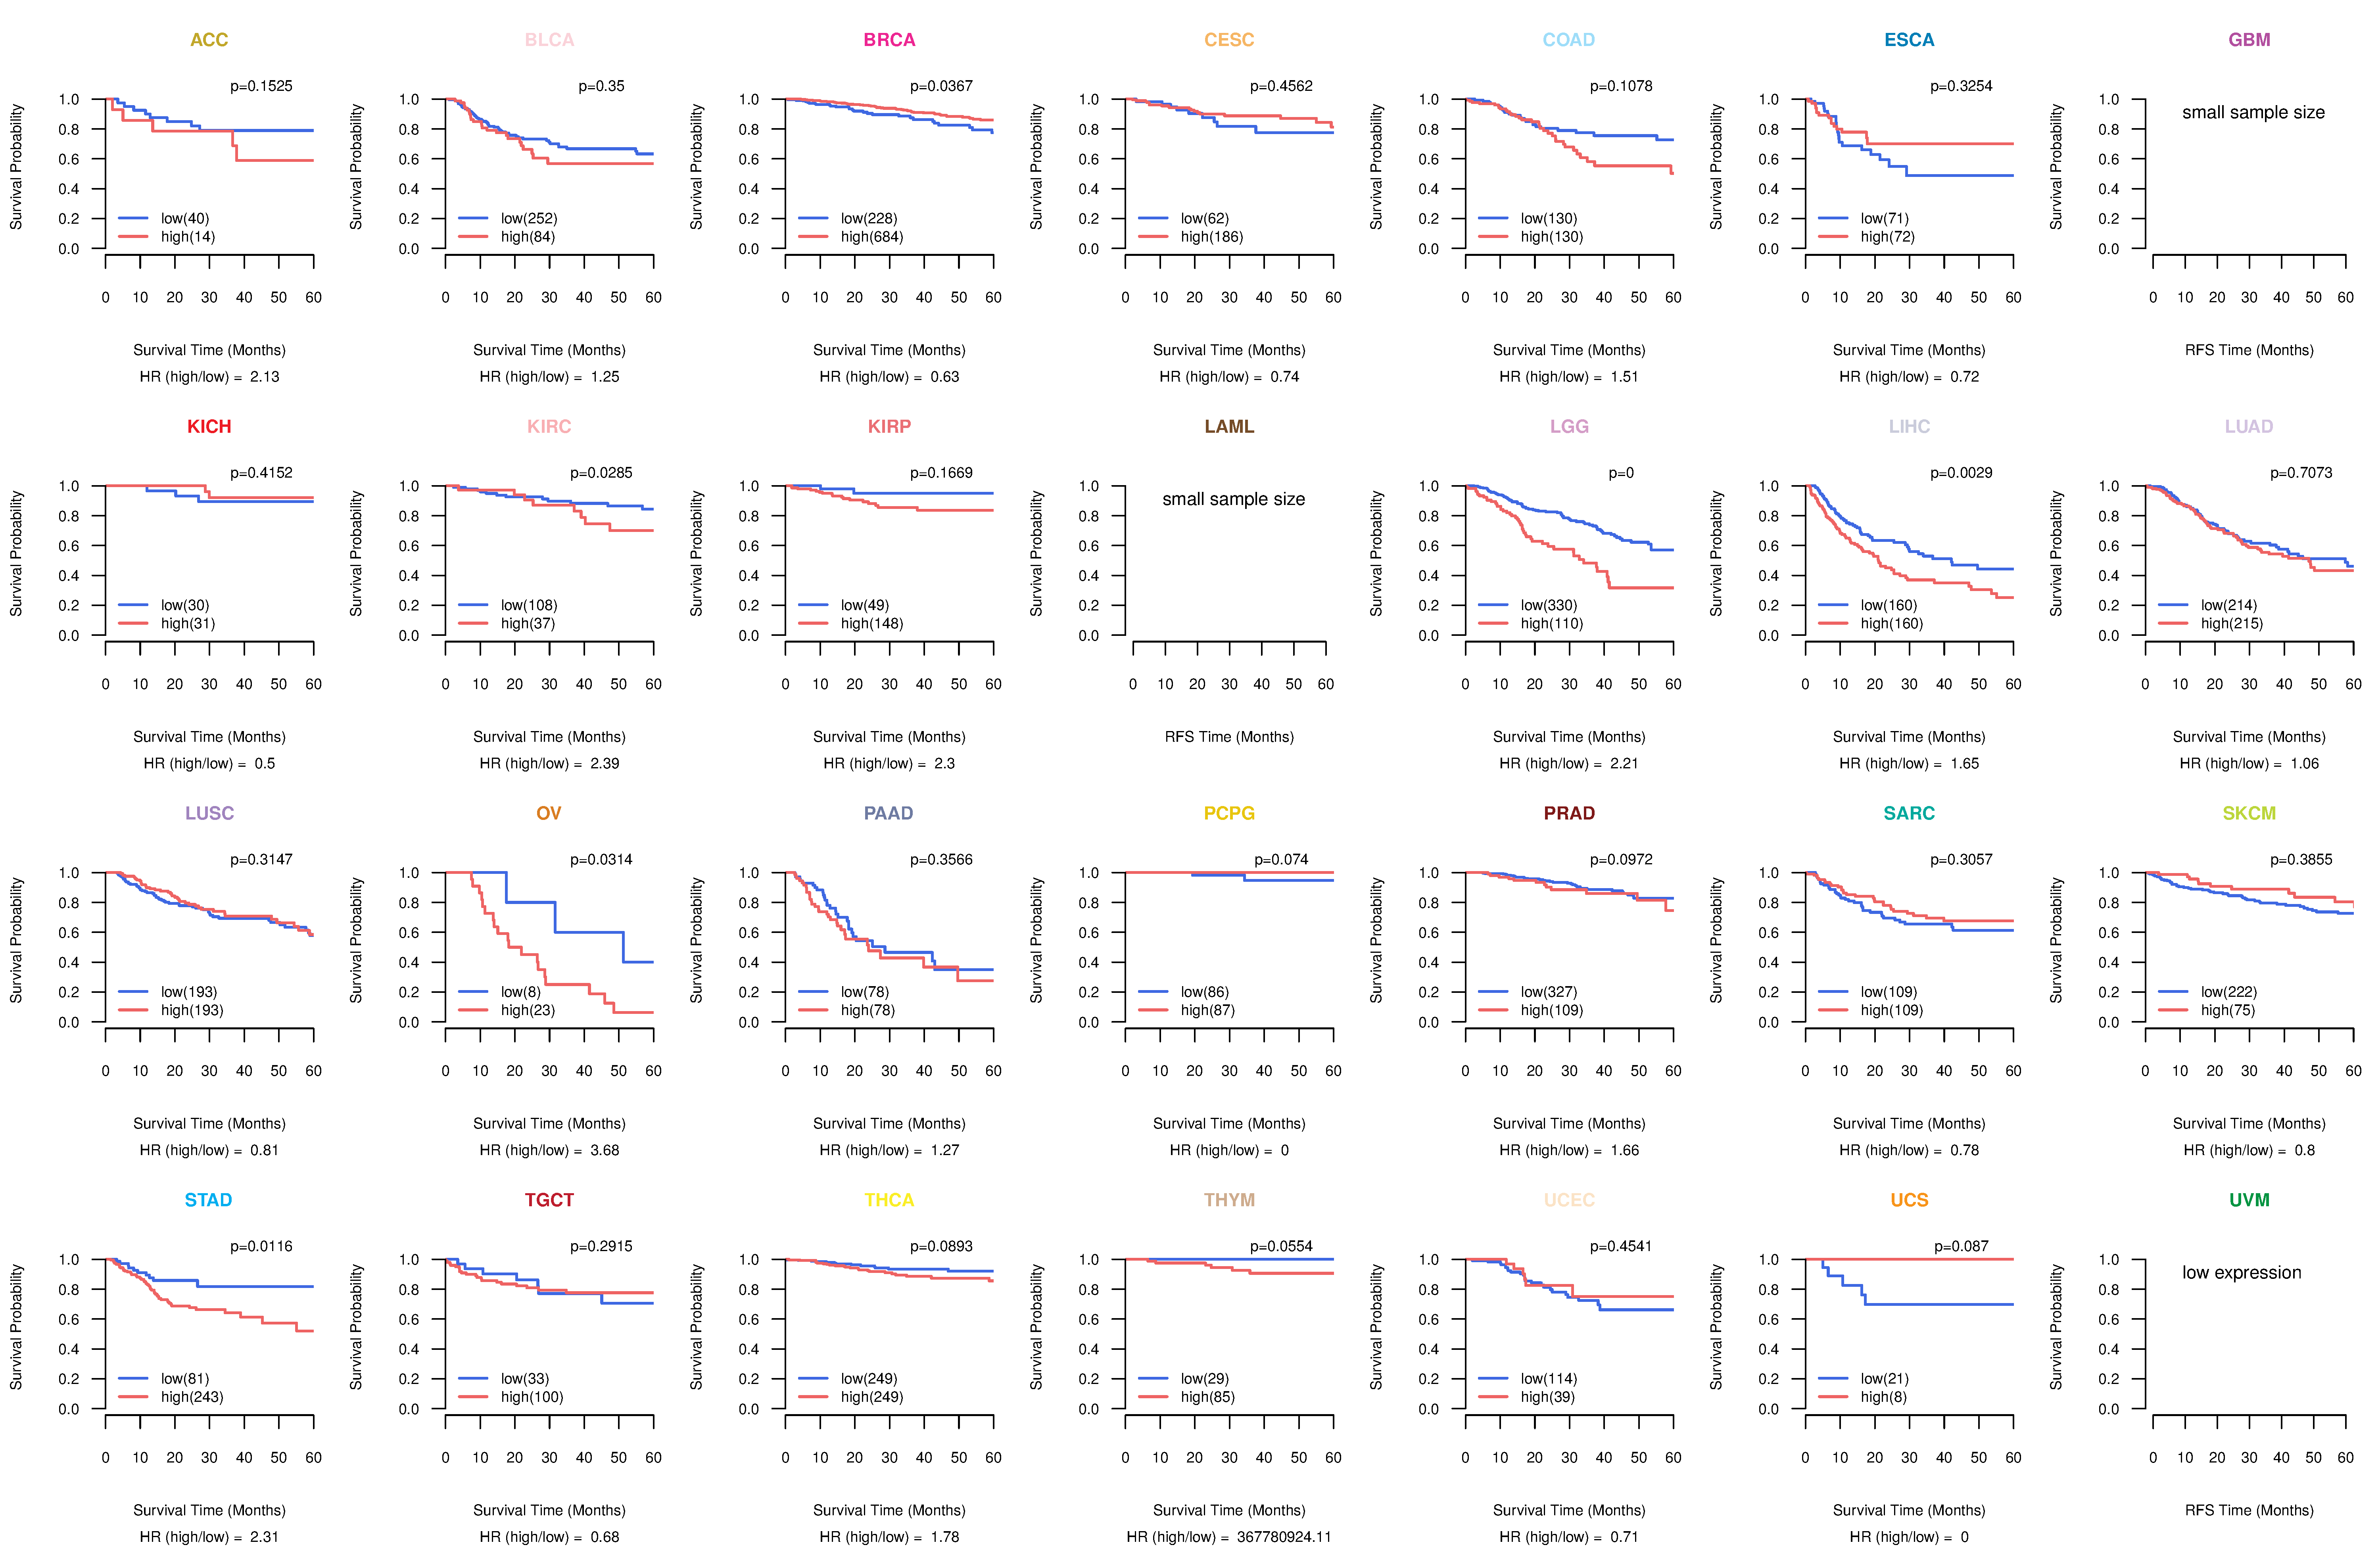
| Kaplan-Meier plots with logrank tests of overall survival (OS) using 28 cancer types (TCGA IlluminaHiSeq_RNASeqV2, pan-cancer normalized log2(norm_counts+1) data, version 2016-08-16) (TCGA clinicalMatrix, phenotype data, version 2016-04-27) * Click on the image to enlarge it in a new window. |
 |
| Kaplan-Meier plots with logrank test of relapse free survival (RFS) using 28 cancer types (TCGA IlluminaHiSeq_RNASeqV2, pan-cancer normalized log2(norm_counts+1) data, version 2016-08-16) (TCGA clinicalMatrix, phenotype data, version 2016-04-27) * Click on the image enlarge it in a new window. |
 |
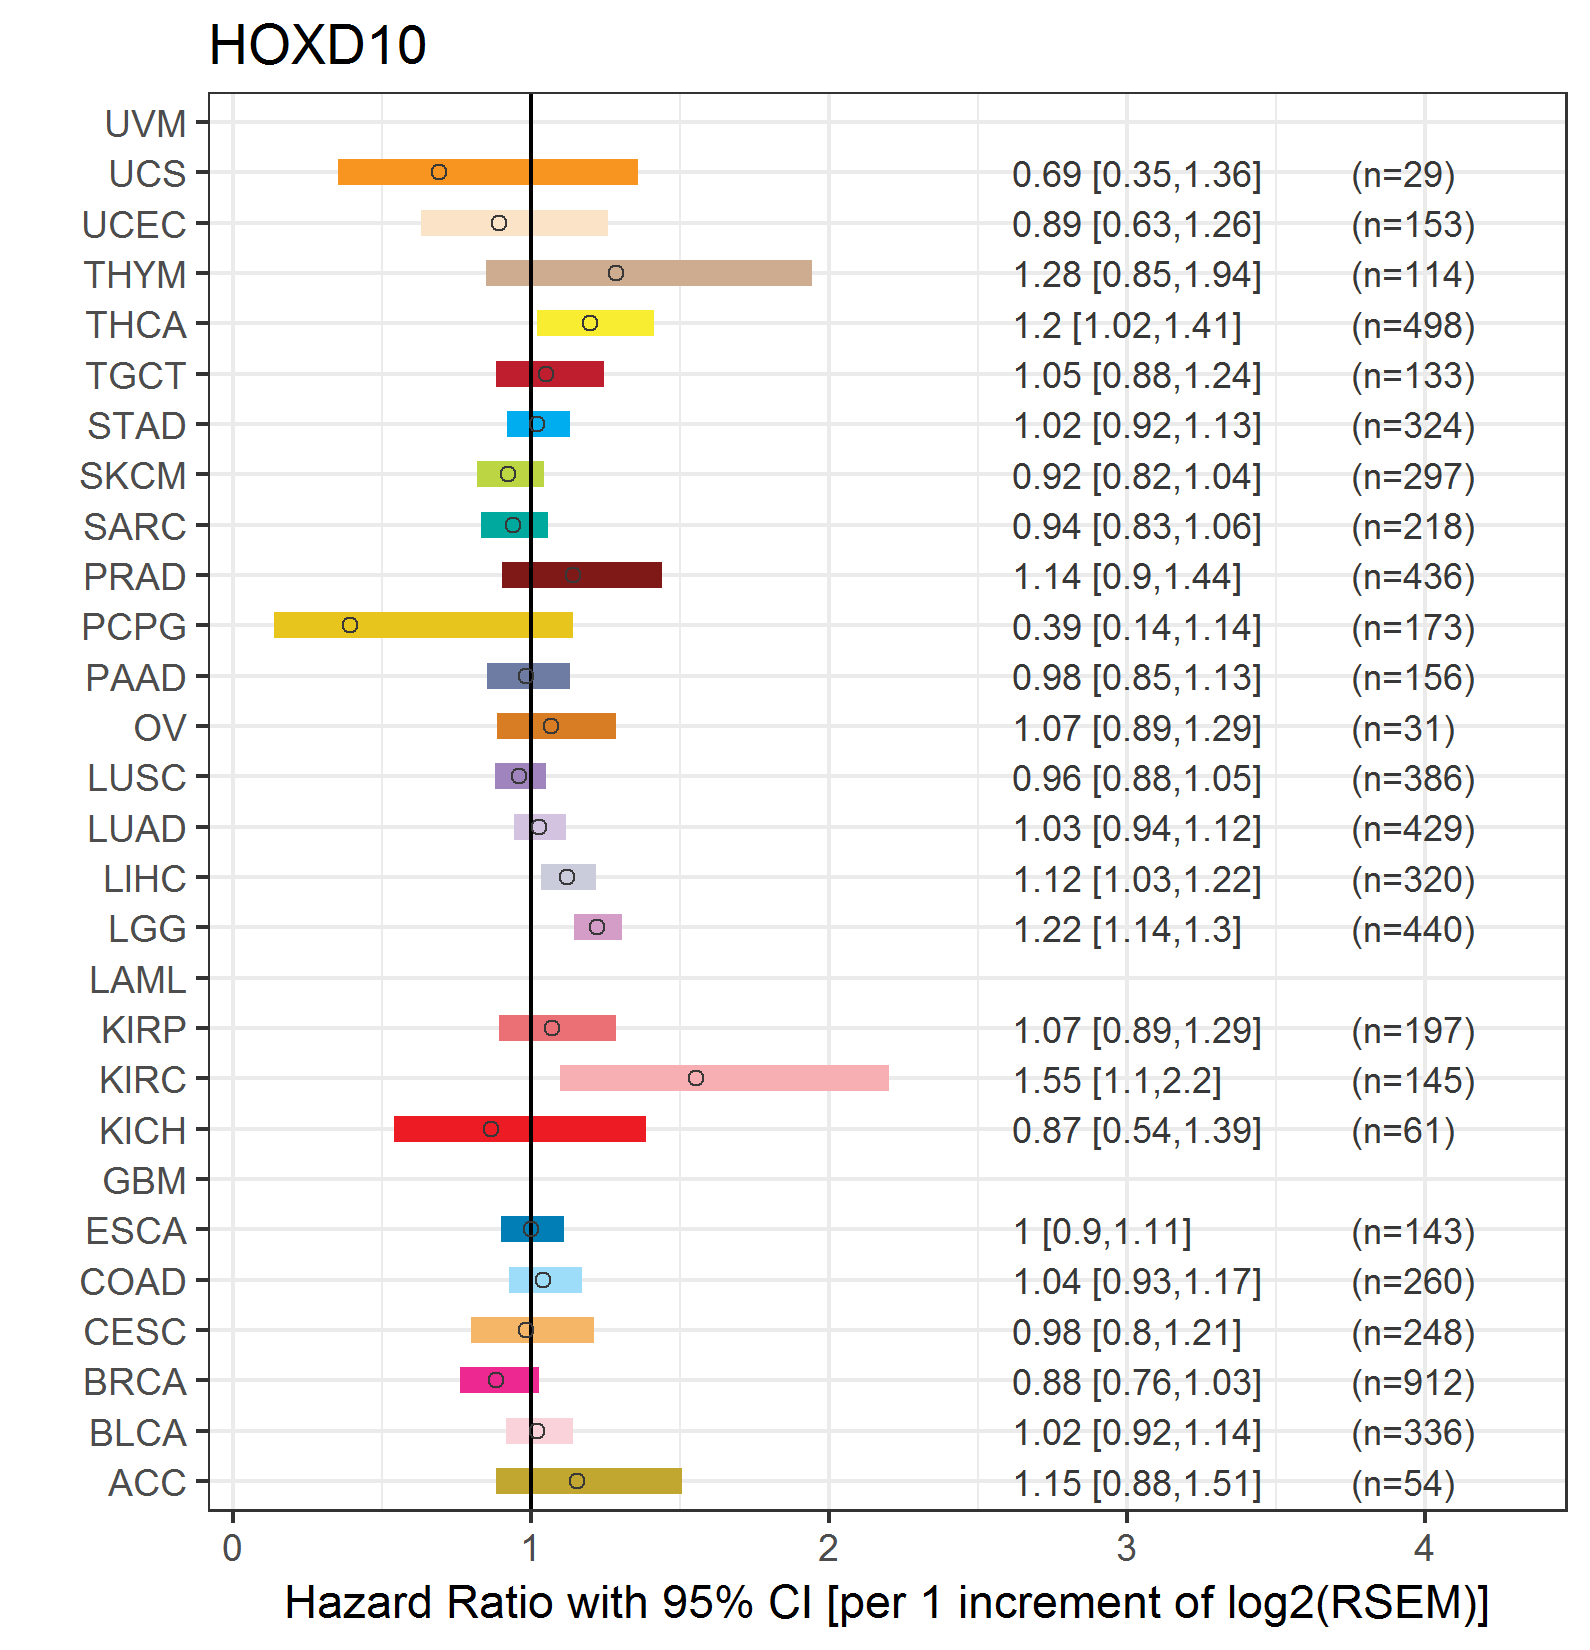
| Forest plot of Cox proportional hazard ratio (HR) and 95% CI of overall survival (OS) using 28 cancer types (TCGA IlluminaHiSeq_RNASeqV2, pan-cancer normalized log2(norm_counts+1) data, version 2016-08-16) (TCGA clinicalMatrix, phenotype data, version 2016-04-27) * Click on the image enlarge it in a new window. |
 |
| Forest plot of Cox proportional hazard ratio (HR) and 95% CI of relapse free survival (RFS) using 28 cancer types (TCGA IlluminaHiSeq_RNASeqV2, pan-cancer normalized log2(norm_counts+1) data, version 2016-08-16) (TCGA clinicalMatrix, phenotype data, version 2016-04-27) * Click on the image enlarge it in a new window. |
 |
| Top |
| TissGeneClin for HOXD10 |
| TissGeneDrug for HOXD10 |
| Drug information targeting TissGene (DrugBank Version 5.0.6, 2017-04-01) |
| DrugBank ID | Drug name | Drug activity | Drug type | Drug status |
| Top |
| TissGeneDisease for HOXD10 |
| Disease information associated with TissGene (DisGeNet, 2016-06-01) |
| Disease ID | Disease name | # pubmeds | Source |
| umls:C0240912 | Vertical talus, congenital | 5 | BeFree,CLINVAR,CTD_human,UNIPROT |
| umls:C0006142 | Malignant neoplasm of breast | 4 | BeFree |
| umls:C0027627 | Neoplasm Metastasis | 4 | BeFree |
| umls:C0024623 | Malignant neoplasm of stomach | 3 | BeFree |
| umls:C0678222 | Breast Carcinoma | 3 | BeFree |
| umls:C0699791 | Stomach Carcinoma | 3 | BeFree |
| umls:C1168401 | Squamous cell carcinoma of the head and neck | 3 | BeFree,CTD_human |
| umls:C0005684 | Malignant neoplasm of urinary bladder | 2 | BeFree |
| umls:C0007959 | Charcot-Marie-Tooth Disease | 2 | BeFree,CTD_human,LHGDN |
| umls:C0009081 | Congenital clubfoot | 2 | BeFree,GAD |
| umls:C0686619 | Secondary malignant neoplasm of lymph node | 2 | BeFree |
| umls:C1458155 | Mammary Neoplasms | 2 | BeFree |
| umls:C0002736 | Amyotrophic Lateral Sclerosis | 1 | GWASCAT |
| umls:C0003873 | Rheumatoid Arthritis | 1 | CTD_human |
| umls:C0017638 | Glioma | 1 | BeFree |
| umls:C0018418 | Gynecomastia | 1 | BeFree |
| umls:C0024299 | Lymphoma | 1 | BeFree |
| umls:C0026640 | Mouth Neoplasms | 1 | CTD_human |
| umls:C0029925 | Ovarian Carcinoma | 1 | BeFree |
| umls:C0038356 | Stomach Neoplasms | 1 | BeFree |
| umls:C0039075 | Syndactyly | 1 | BeFree |
| umls:C0040427 | Tooth Abnormalities | 1 | BeFree |
| umls:C0158266 | Intervertebral Disc Degeneration | 1 | BeFree |
| umls:C0178874 | Tumor Progression | 1 | BeFree |
| umls:C0238033 | Carcinoma of Male Breast | 1 | BeFree |
| umls:C0278996 | Cancer of Head and Neck | 1 | BeFree |
| umls:C0431943 | Lower Extremity Deformities, Congenital | 1 | CTD_human |
| umls:C0596263 | Carcinogenesis | 1 | BeFree |
| umls:C0853879 | Invasive breast carcinoma | 1 | BeFree |
| umls:C1134719 | Invasive Ductal Breast Carcinoma | 1 | BeFree |
| umls:C1140680 | Malignant neoplasm of ovary | 1 | BeFree |
| umls:C1520166 | Xenograft Model | 1 | BeFree |
| umls:C2239176 | Liver carcinoma | 1 | BeFree |
|
Copyright 2016-Present - The University of Texas Health Science Center at Houston (UTHealth) Web File Viewing | How to Report, Fraud, Waste and Abuse | State of Texas | Statewide Search | Texas Homeland Security | Site Policies |