 |
| |
| |
| |
| |
| |
| |
|

| TissGeneSummary for HPN |
 Gene summary Gene summary |
| Basic gene information | Gene symbol | HPN |
| Gene name | hepsin | |
| Synonyms | TMPRSS1 | |
| Cytomap | UCSC genome browser: 19q13.12 | |
| Type of gene | protein-coding | |
| RefGenes | NM_002151.2, NM_182983.2, | |
| Description | serine protease hepsintransmembrane protease serine 1 | |
| Modification date | 20141207 | |
| dbXrefs | MIM : 142440 | |
| HGNC : HGNC | ||
| Ensembl : ENSG00000105707 | ||
| HPRD : 00801 | ||
| Vega : OTTHUMG00000182474 | ||
| Protein | UniProt: go to UniProt's Cross Reference DB Table | |
| Expression | CleanEX: HS_HPN | |
| BioGPS: 3249 | ||
| Pathway | NCI Pathway Interaction Database: HPN | |
| KEGG: HPN | ||
| REACTOME: HPN | ||
| Pathway Commons: HPN | ||
| Context | iHOP: HPN | |
| ligand binding site mutation search in PubMed: HPN | ||
| UCL Cancer Institute: HPN | ||
| Assigned class in TissGDB* | C | |
| Included tissue-specific gene expression resources | TiGER,GTEx | |
| Specific-tissues in normal samples (assigned by TissGDB using HPA, TiGER, and GTEx) | Liver | |
| Cancer types related to the specific-tissues in cancer samples (assigned by TissGDB using TCGA) | LIHC | |
| Reference showing the relevant tissue of HPN | ||
| Description by TissGene annotations | Fused withTSGene | |
| * Class A consists of genes with literature evidence and is part of the cTissGenes. Class B consists of only cTissGenes without additional evidence. The remaining genes belong to Class C. |
| Gene ontology having evidence of Inferred from Direct Assay (IDA) from Entrez |
| GO ID | GO term | PubMed ID | GO:0006508 | proteolysis | 16908524 | GO:0010719 | negative regulation of epithelial to mesenchymal transition | 19843851 | GO:0010756 | positive regulation of plasminogen activation | 16908524 | GO:0034769 | basement membrane disassembly | 16908524 | GO:0043066 | negative regulation of apoptotic process | 15614436 | GO:0043923 | positive regulation by host of viral transcription | 15614436 | GO:0050680 | negative regulation of epithelial cell proliferation | 19843851 | GO:2000347 | positive regulation of hepatocyte proliferation | 15614436 | GO:0006508 | proteolysis | 16908524 | GO:0010719 | negative regulation of epithelial to mesenchymal transition | 19843851 | GO:0010756 | positive regulation of plasminogen activation | 16908524 | GO:0034769 | basement membrane disassembly | 16908524 | GO:0043066 | negative regulation of apoptotic process | 15614436 | GO:0043923 | positive regulation by host of viral transcription | 15614436 | GO:0050680 | negative regulation of epithelial cell proliferation | 19843851 | GO:2000347 | positive regulation of hepatocyte proliferation | 15614436 |
| Top |
| TissGeneExp for HPN |
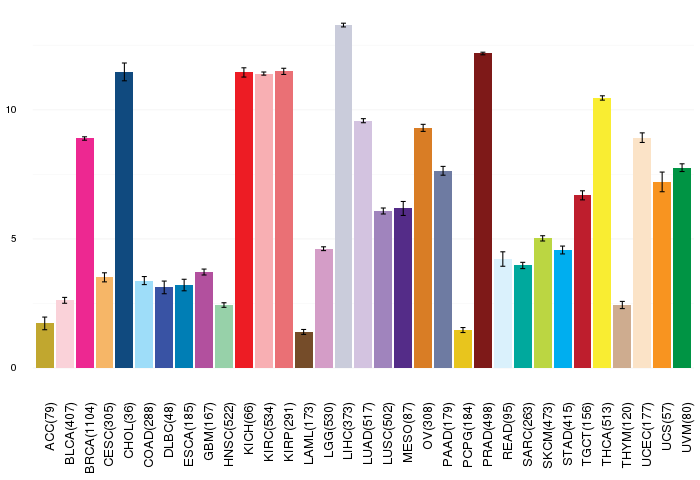
| Gene expressions across 28 cancer types (X-axis: cancer type and Y-axis: log2(norm_counts+1)) (TCGA IlluminaHiSeq_RNASeqV2, pan-cancer normalized log2(norm_counts+1) data, version 2016-08-16) |
 |
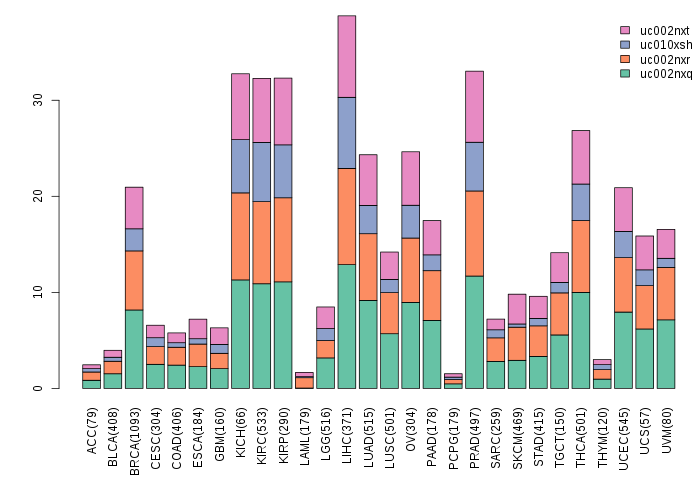
| Gene isoform expressions across 28 cancer types (X-axis: cancer type and Y-axis: log2(norm_counts+1)) (TCGA pan-cancer tcga_rsem_isoform_tpm, version 2016-09-01) |
 |
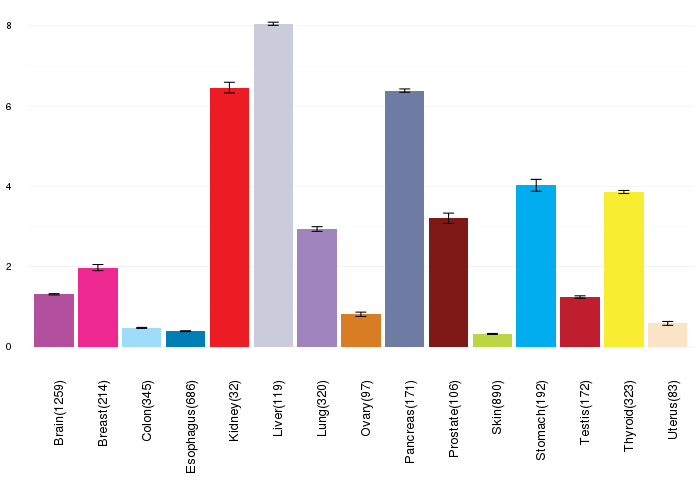
| Gene expressions across normal tissues of GTEx data (GTEx GTEx_Analysis_v6_RNA-seq_RNA-SeQCv1.1.8_gene_rpkm.gct) - Here, we shows the matched tissue types only among our 28 cancer types. |
 |
| Different expressions across 14 cancer types with more than 10 samples between matched tumors and normals (X-axis: cancer type and Y-axis: log2(norm_counts+1)) (TCGA IlluminaHiSeq_RNASeqV2, pan-cancer normalized log2(norm_counts+1) data, version 2016-08-16) |
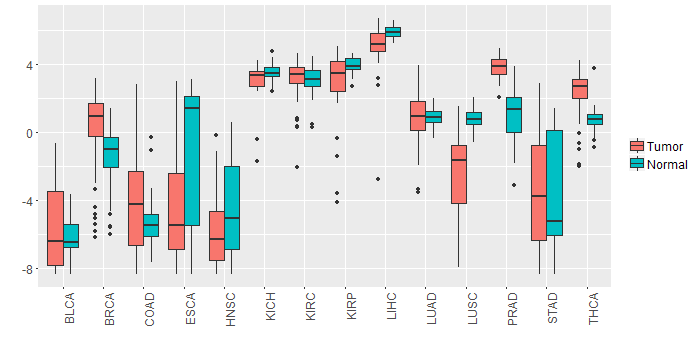 |
| - Significantly differentially expressed cancer types and information. (|Fold change|>1 and FDR<0.05) |
| Cancer type | Mean(exp) in tumor | Mean(exp) in matched normal | Log2FC | P-val. | FDR |
| THCA | 2.345872827 | 0.733257573 | 1.612615254 | 5.83E-13 | 5.54E-12 |
| PRAD | 3.804949881 | 1.056061419 | 2.748888462 | 1.13E-18 | 4.89E-16 |
| BRCA | 0.458678626 | -1.333750322 | 1.792428947 | 7.92E-13 | 3.59E-12 |
| LUSC | -2.455436544 | 0.793645808 | -3.249082353 | 4.93E-12 | 2.14E-11 |
| KIRP | 2.791420073 | 3.915245073 | -1.123825 | 0.00919 | 0.020339566 |
| Top |
| TissGene-miRNA for HPN |
| Significantly anti-correlated miRNAs of TissGene across 28 cancer types (Gene-miRNA relations from TargetScanHuman Relsease 7.1, Conserved_Site_Context_Scores.txt.zip, 06.01.2016) (TCGA IlluminaHiSeq_miRNASeq, log2(RPM+1) data, version 2016-11-21) (TCGA IlluminaHiSeq_RNASeqV2, log2(normalized_count+1) data, version 2016-08-16) (Spearman’s Rank Correlation (p-value<0.05 and coefficient<-0.25)) |
| Cancer type | miRNA id | miRNA accession | P-val. | Coeff. | # samples |
| Top |
| TissGeneMut for HPN |
| TissGeneSNV for HPN |
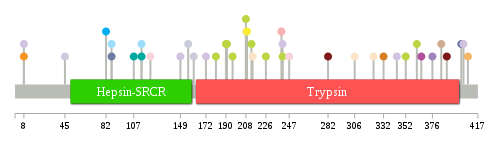
| nsSNV counts per each loci. Different colors of circles represent different cancer types. Circle size denotes number of samples. (TCGA somatic mutation (SNPs and small INDELs) data, version 2016-04-25) * Click on the image to enlarge it in a new window. |
 |
 |
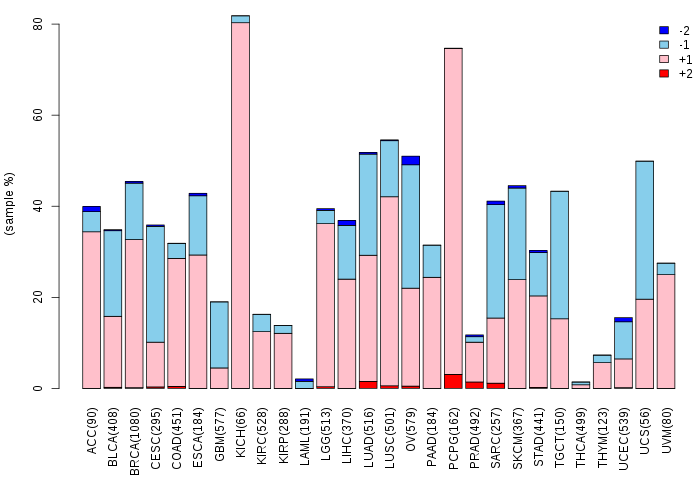
| Somatic nucleotide variants of TissGene across 28 cancer types (X-axis: cancer type and Y-axis: % of mutated samples) The numbers in parentheses are numbers of samples with mutation (nsSNVs). (TCGA somatic mutation (SNPs and small INDELs) data, version 2016-04-25) |
 |
| - nsSNVs sorted by frequency. |
| AAchange | Cancer type | # samples |
| p.Q402E | PAAD | 1 |
| p.S362G | SKCM | 1 |
| p.E122K | BLCA | 1 |
| p.I404V | LUAD | 1 |
| p.S226F | SKCM | 1 |
| p.R8Q | UCS | 1 |
| p.G172D | LUAD | 1 |
| p.R247P | BLCA | 1 |
| p.R313G | HNSC | 1 |
| p.R208Q | SKCM | 1 |
| p.V389I | PRAD | 1 |
| p.R162H | HNSC | 1 |
| p.R214G | UCEC | 1 |
| p.T114M | COAD | 1 |
| p.T114M | SARC | 1 |
| p.D196N | SKCM | 1 |
| p.H240D | KIRC | 1 |
| p.R8W | LUAD | 1 |
| p.G87X | PAAD | 1 |
| p.I149M | LUAD | 1 |
| p.G190R | SKCM | 1 |
| p.S408F | CESC | 1 |
| p.G344D | LUAD | 1 |
| p.R214L | HNSC | 1 |
| p.D161Y | LIHC | 1 |
| p.G282S | PRAD | 1 |
| p.A306V | UCEC | 1 |
| p.R208Q | UCEC | 1 |
| p.G241E | SKCM | 1 |
| p.S213F | SKCM | 1 |
| p.R181C | SKCM | 1 |
| p.I332M | OV | 1 |
| p.N209S | THCA | 1 |
| p.R45W | LIHC | 1 |
| p.D352N | SKCM | 1 |
| p.A384T | THYM | 1 |
| p.G87R | COAD | 1 |
| p.N82S | STAD | 1 |
| p.R156W | LIHC | 1 |
| p.S376I | LUSC | 1 |
| p.N323D | UCEC | 1 |
| p.S191F | SKCM | 1 |
| p.T366M | GBM | 1 |
| p.G241W | LUAD | 1 |
| p.R107Q | SARC | 1 |
| Top |
| TissGeneCNV for HPN |
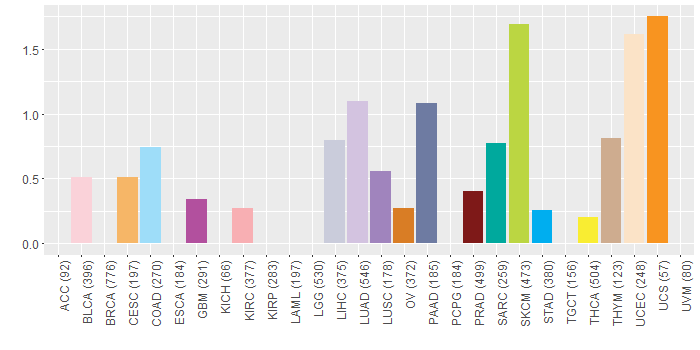
| Copy number variations of TissGene across 28 cancer types (X-axis: cancer type and Y-axis: % of CNV samples) (TCGA Gistic2_CopyNumber_Gistic2_all_data_by_genes, Gistic2 copy number data, version 2016-08-16) |
 |
| Top |
| TissGeneFusions for HPN |
| Fusion genes including TissGene (ChimerDB 3.0, 2016-12-01 and TCGA fusion Portal 2015-12-01) |
| Database | Src | Cancer type | Sample | Fusion gene | ORF | 5'-gene BP | 3'-gene BP |
| Chimerdb3.0 | TopHat-Fusion | LUAD | TCGA-55-A48Z-01A | HPN-FBL | In-Frame | chr19:35544022 | chr19:40328350 |
| Chimerdb3.0 | TopHat-Fusion | LUAD | TCGA-55-A48Z-01A | HPN-FBL | Out-of-Frame | chr19:35540419 | chr19:40328234 |
| TCGAfusionPortal | PRADA | BRCA | TCGA-B6-A0RT-01A | HPN-PPP2R5C | Out-of-frame | Chr19:35533426 | Chr14:102302506 |
| Top |
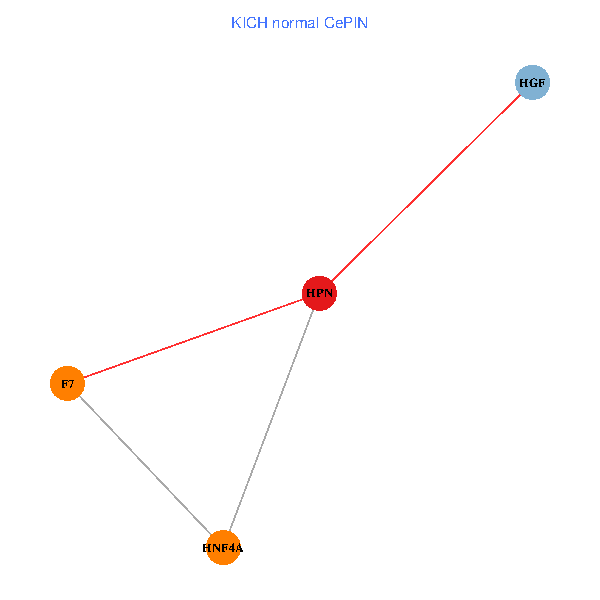
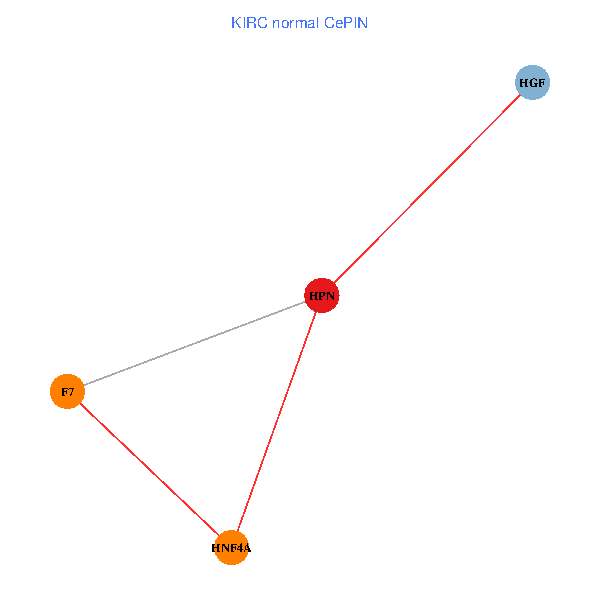
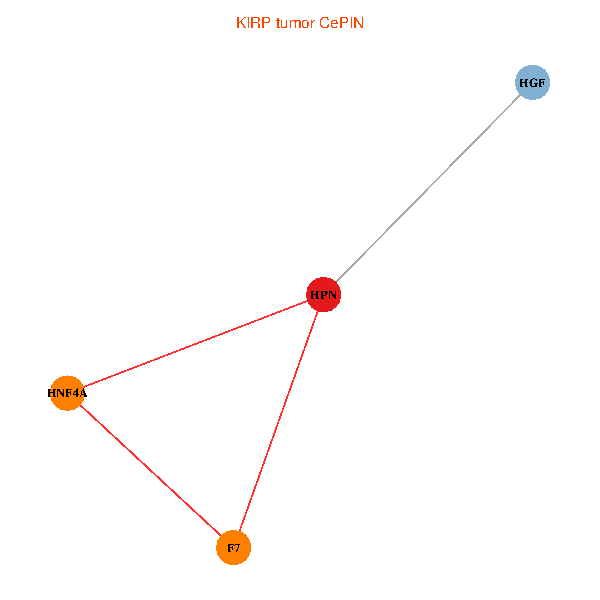
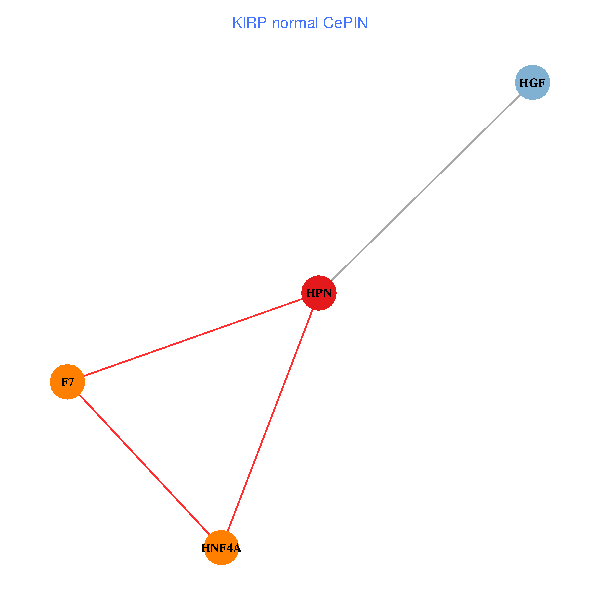
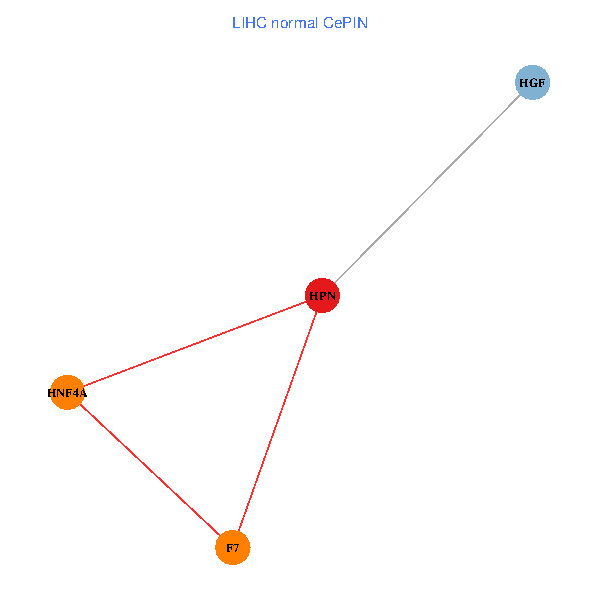
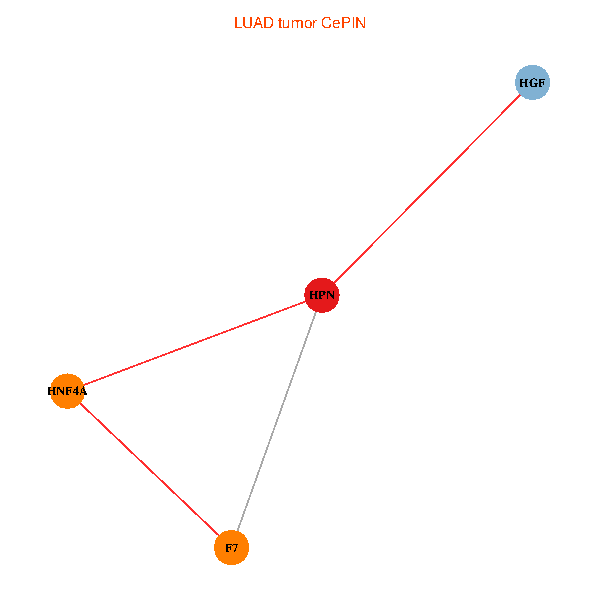
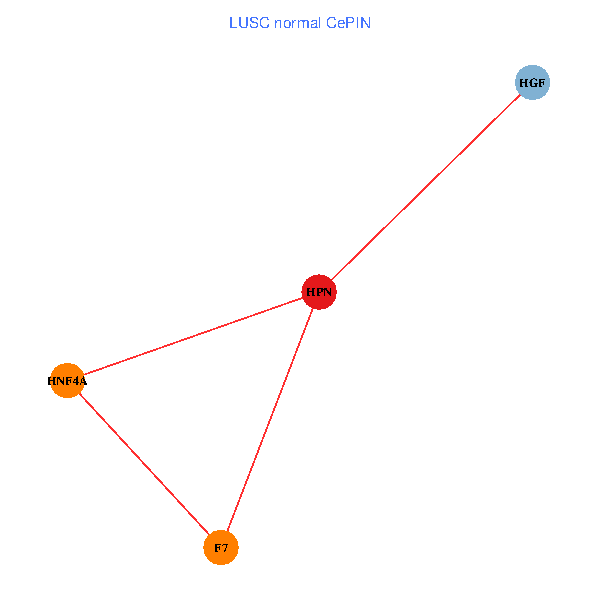
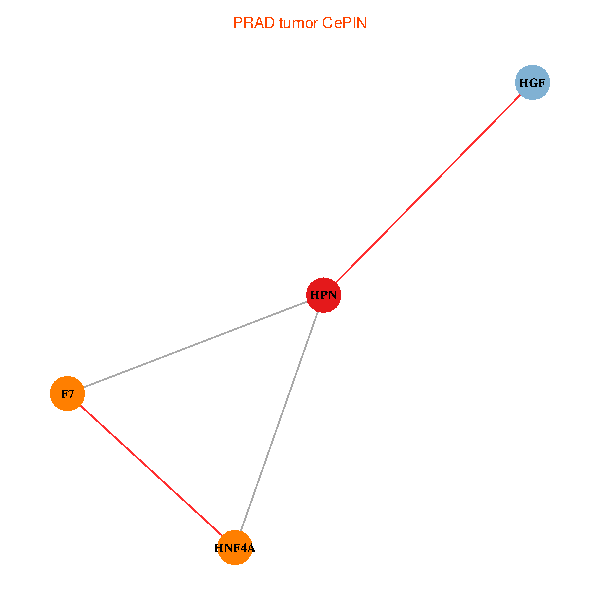
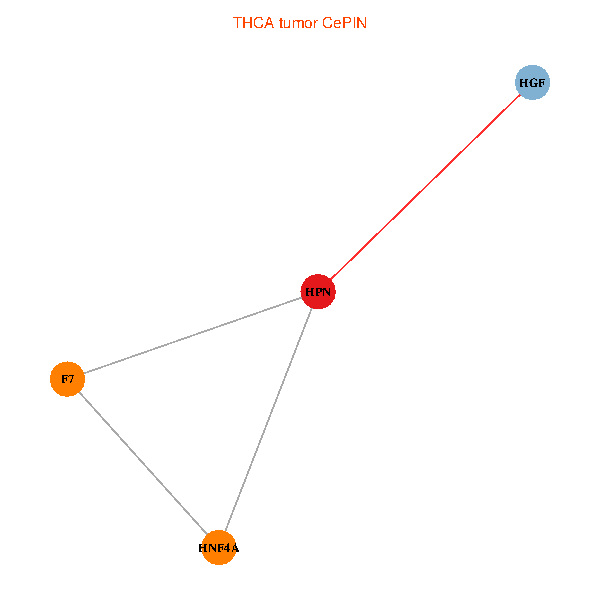
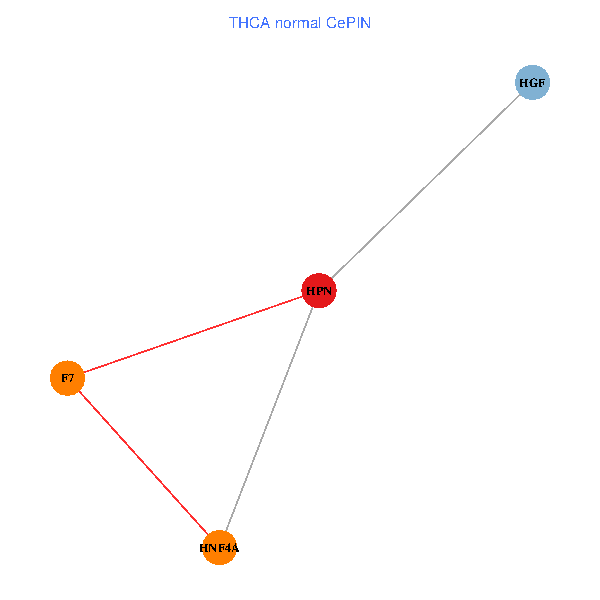
| TissGeneNet for HPN |
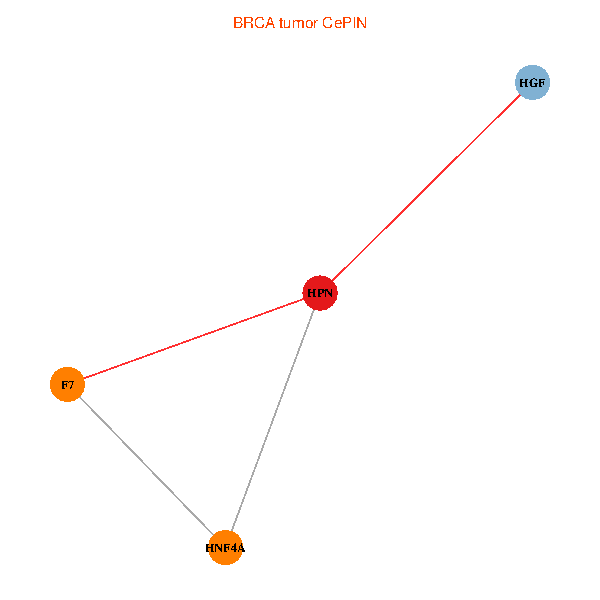
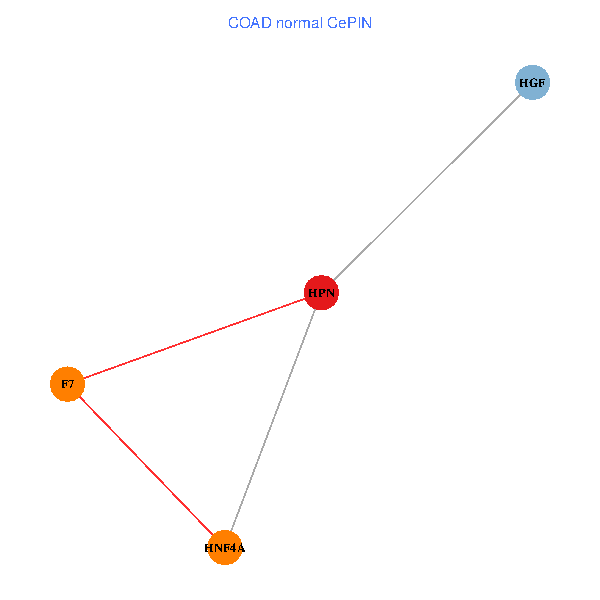
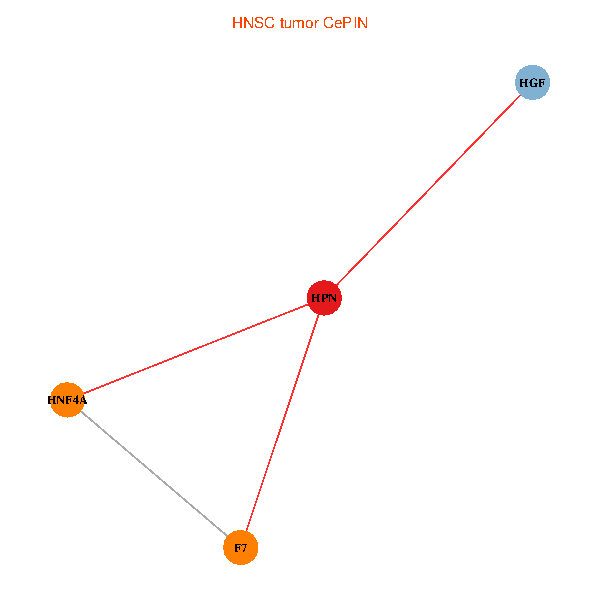
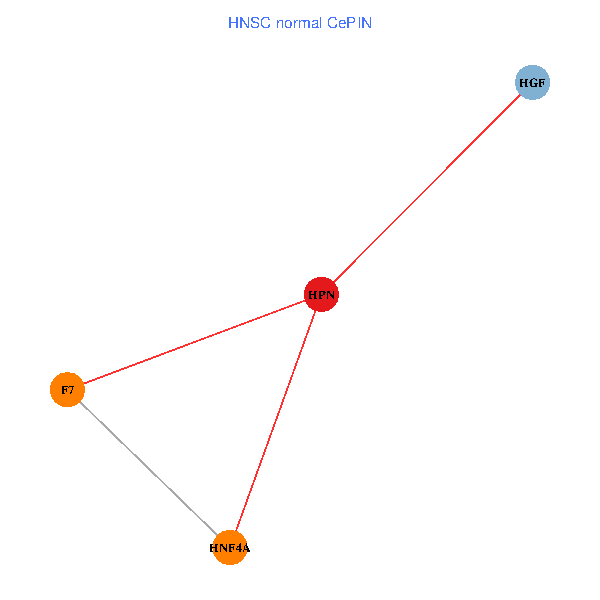
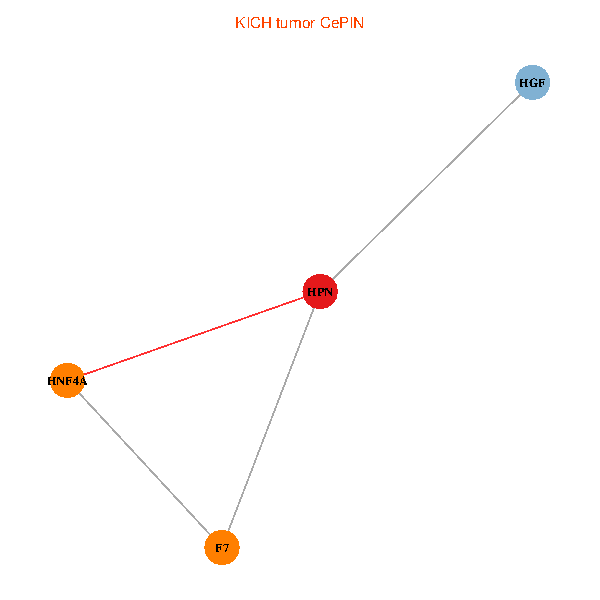
| Co-expressed gene networks based on protein-protein interaction data (CePIN) (TCGA IlluminaHiSeq_RNASeqV2, pan-cancer normalized log2(norm_counts+1) data, version 2016-08-16) (PINA2 ppi data) |
| BRCA (tumor) | BRCA (normal) |
| HPN, HNF4A, HGF, F7 (tumor) | HPN, HNF4A, HGF, F7 (normal) |
 |  |
| COAD (tumor) | COAD (normal) |
| HPN, HNF4A, HGF, F7 (tumor) | HPN, HNF4A, HGF, F7 (normal) |
 |  |
| HNSC (tumor) | HNSC (normal) |
| HPN, HNF4A, HGF, F7 (tumor) | HPN, HNF4A, HGF, F7 (normal) |
 |  |
| KICH (tumor) | KICH (normal) |
| HPN, HNF4A, HGF, F7 (tumor) | HPN, HNF4A, HGF, F7 (normal) |
 |  |
| KIRC (tumor) | KIRC (normal) |
| HPN, HNF4A, HGF, F7 (tumor) | HPN, HNF4A, HGF, F7 (normal) |
 |  |
| KIRP (tumor) | KIRP (normal) |
| HPN, HNF4A, HGF, F7 (tumor) | HPN, HNF4A, HGF, F7 (normal) |
 |  |
| LIHC (tumor) | LIHC (normal) |
| HPN, HNF4A, HGF, F7 (tumor) | HPN, HNF4A, HGF, F7 (normal) |
 |  |
| LUAD (tumor) | LUAD (normal) |
| HPN, HNF4A, HGF, F7 (tumor) | HPN, HNF4A, HGF, F7 (normal) |
 |  |
| LUSC (tumor) | LUSC (normal) |
| HPN, HNF4A, HGF, F7 (tumor) | HPN, HNF4A, HGF, F7 (normal) |
 |  |
| PRAD (tumor) | PRAD (normal) |
| HPN, HNF4A, HGF, F7 (tumor) | HPN, HNF4A, HGF, F7 (normal) |
 |  |
| STAD (tumor) | STAD (normal) |
| HPN, HNF4A, HGF, F7 (tumor) | HPN, HNF4A, HGF, F7 (normal) |
 |  |
| THCA (tumor) | THCA (normal) |
| HPN, HNF4A, HGF, F7 (tumor) | HPN, HNF4A, HGF, F7 (normal) |
 |  |
| Top |
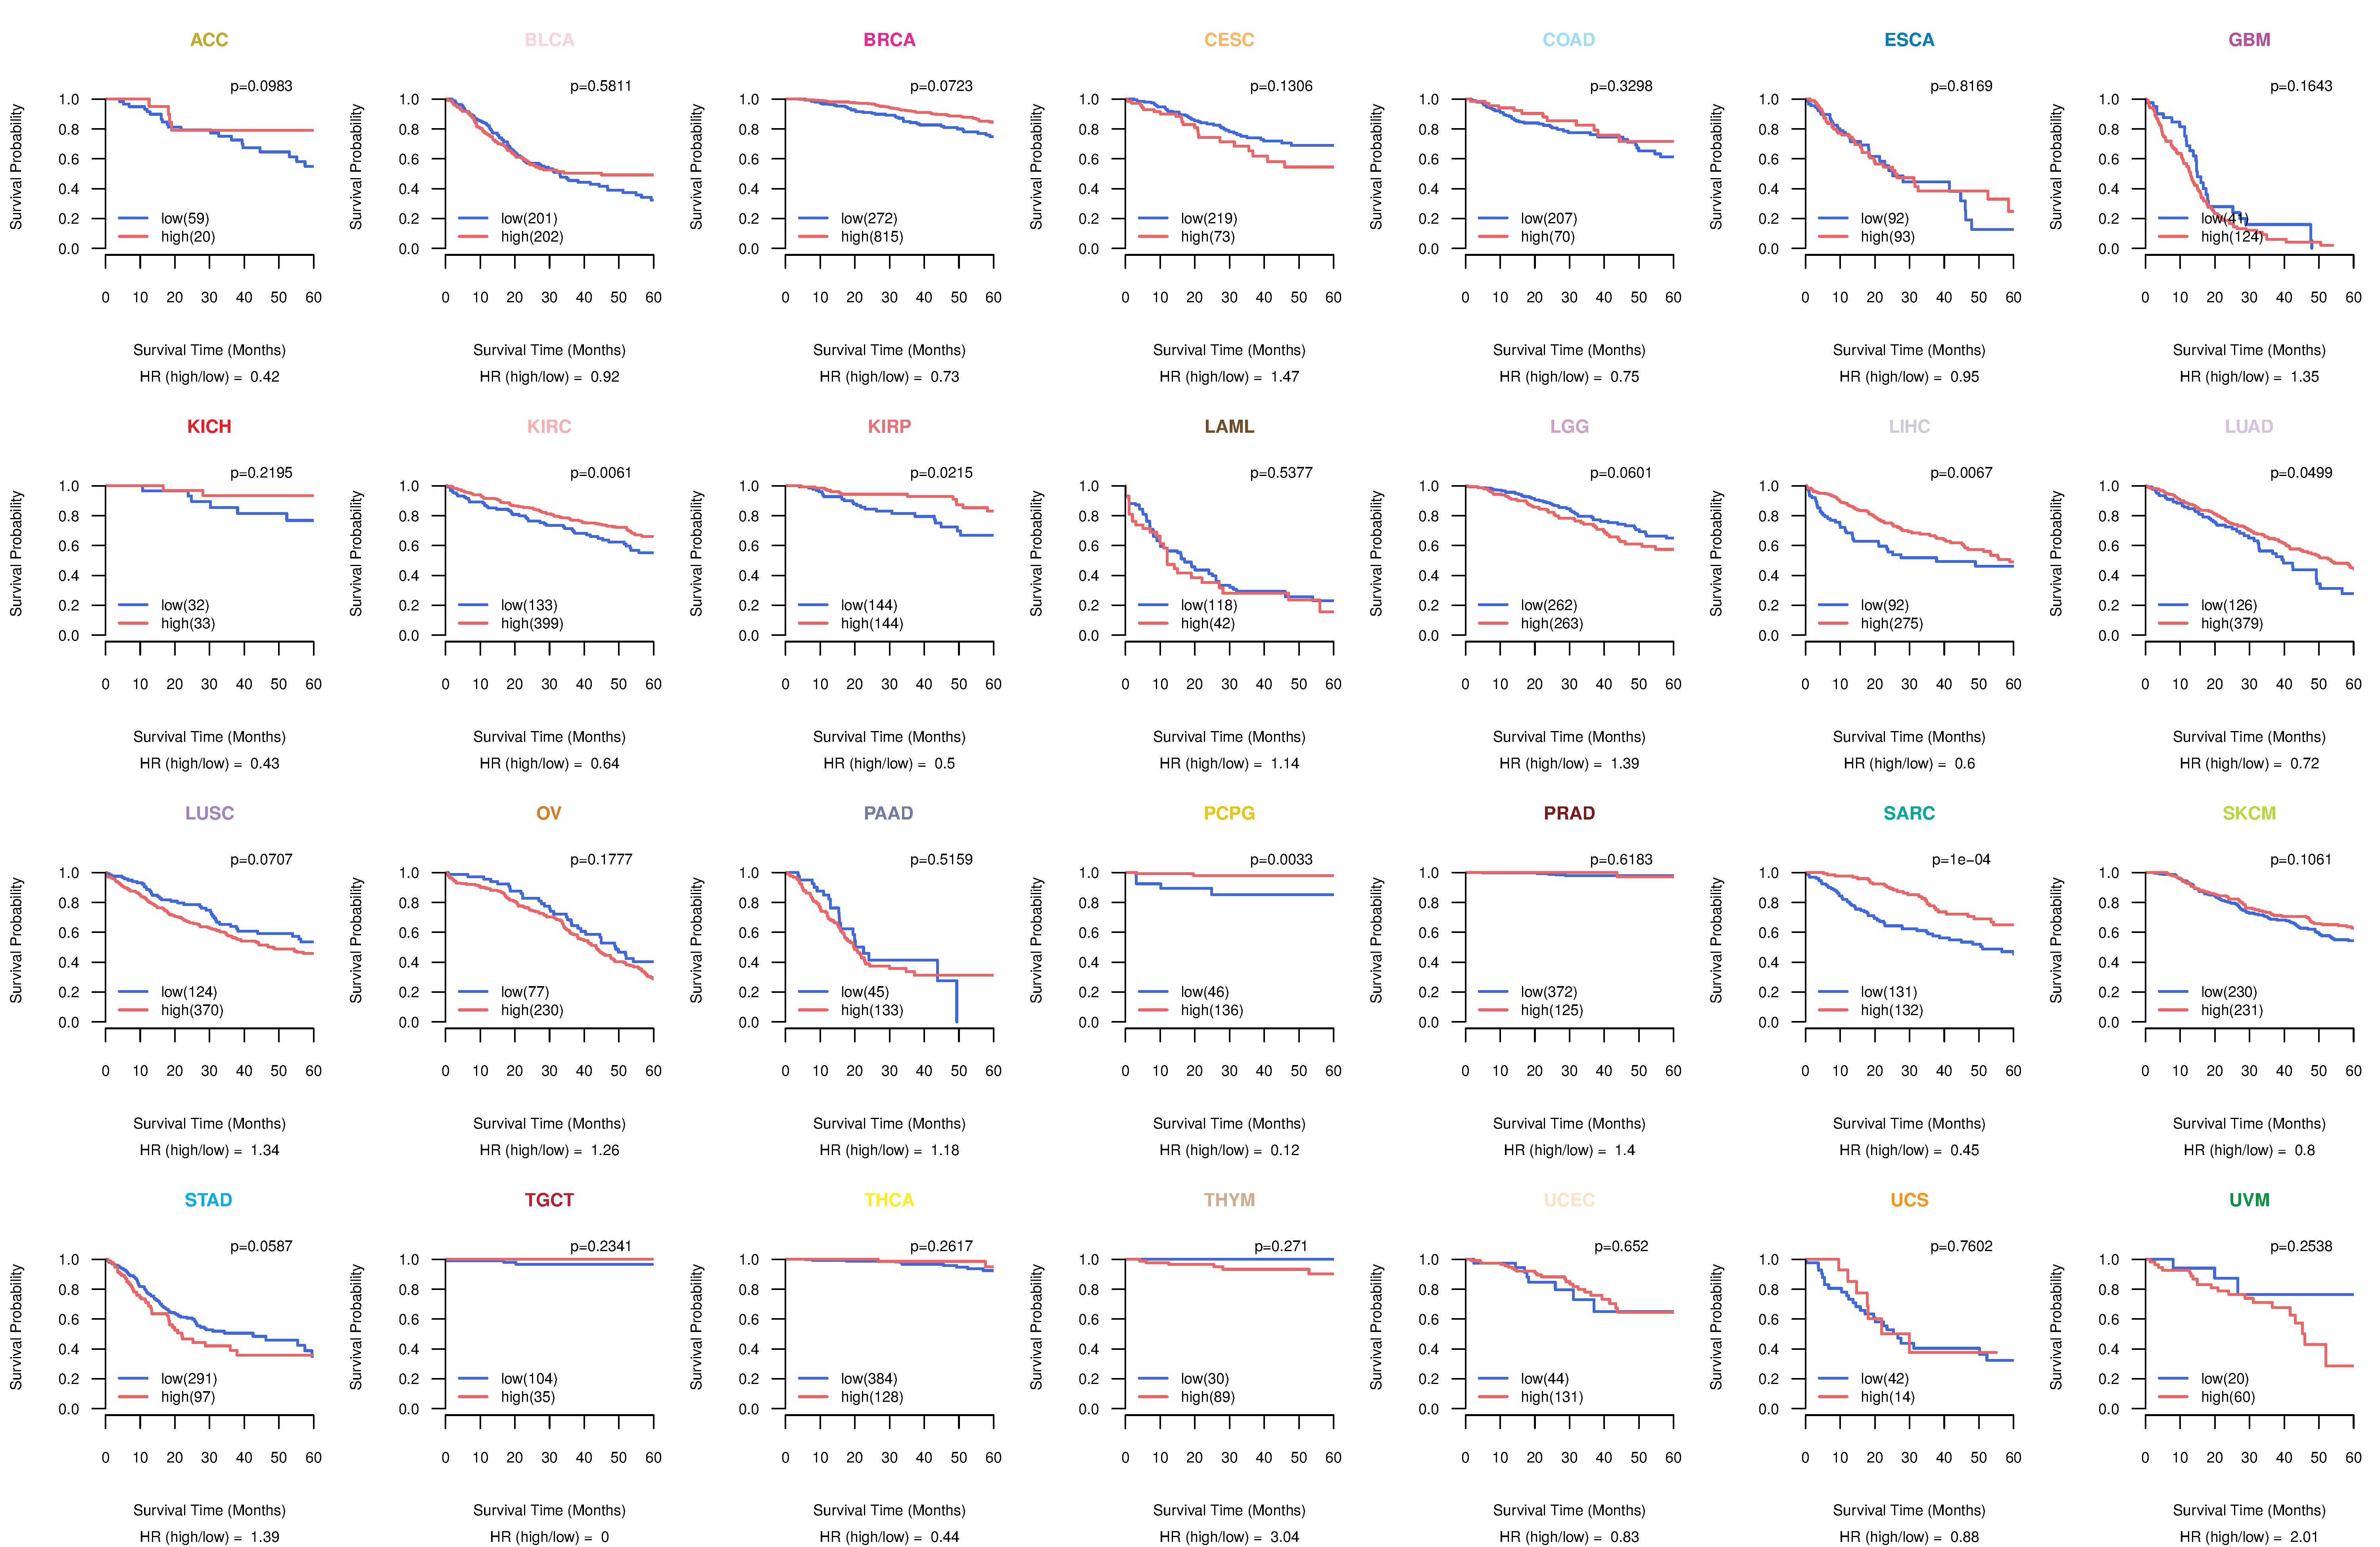
| TissGeneProg for HPN |
| Kaplan-Meier plots with logrank tests of overall survival (OS) using 28 cancer types (TCGA IlluminaHiSeq_RNASeqV2, pan-cancer normalized log2(norm_counts+1) data, version 2016-08-16) (TCGA clinicalMatrix, phenotype data, version 2016-04-27) * Click on the image to enlarge it in a new window. |
 |
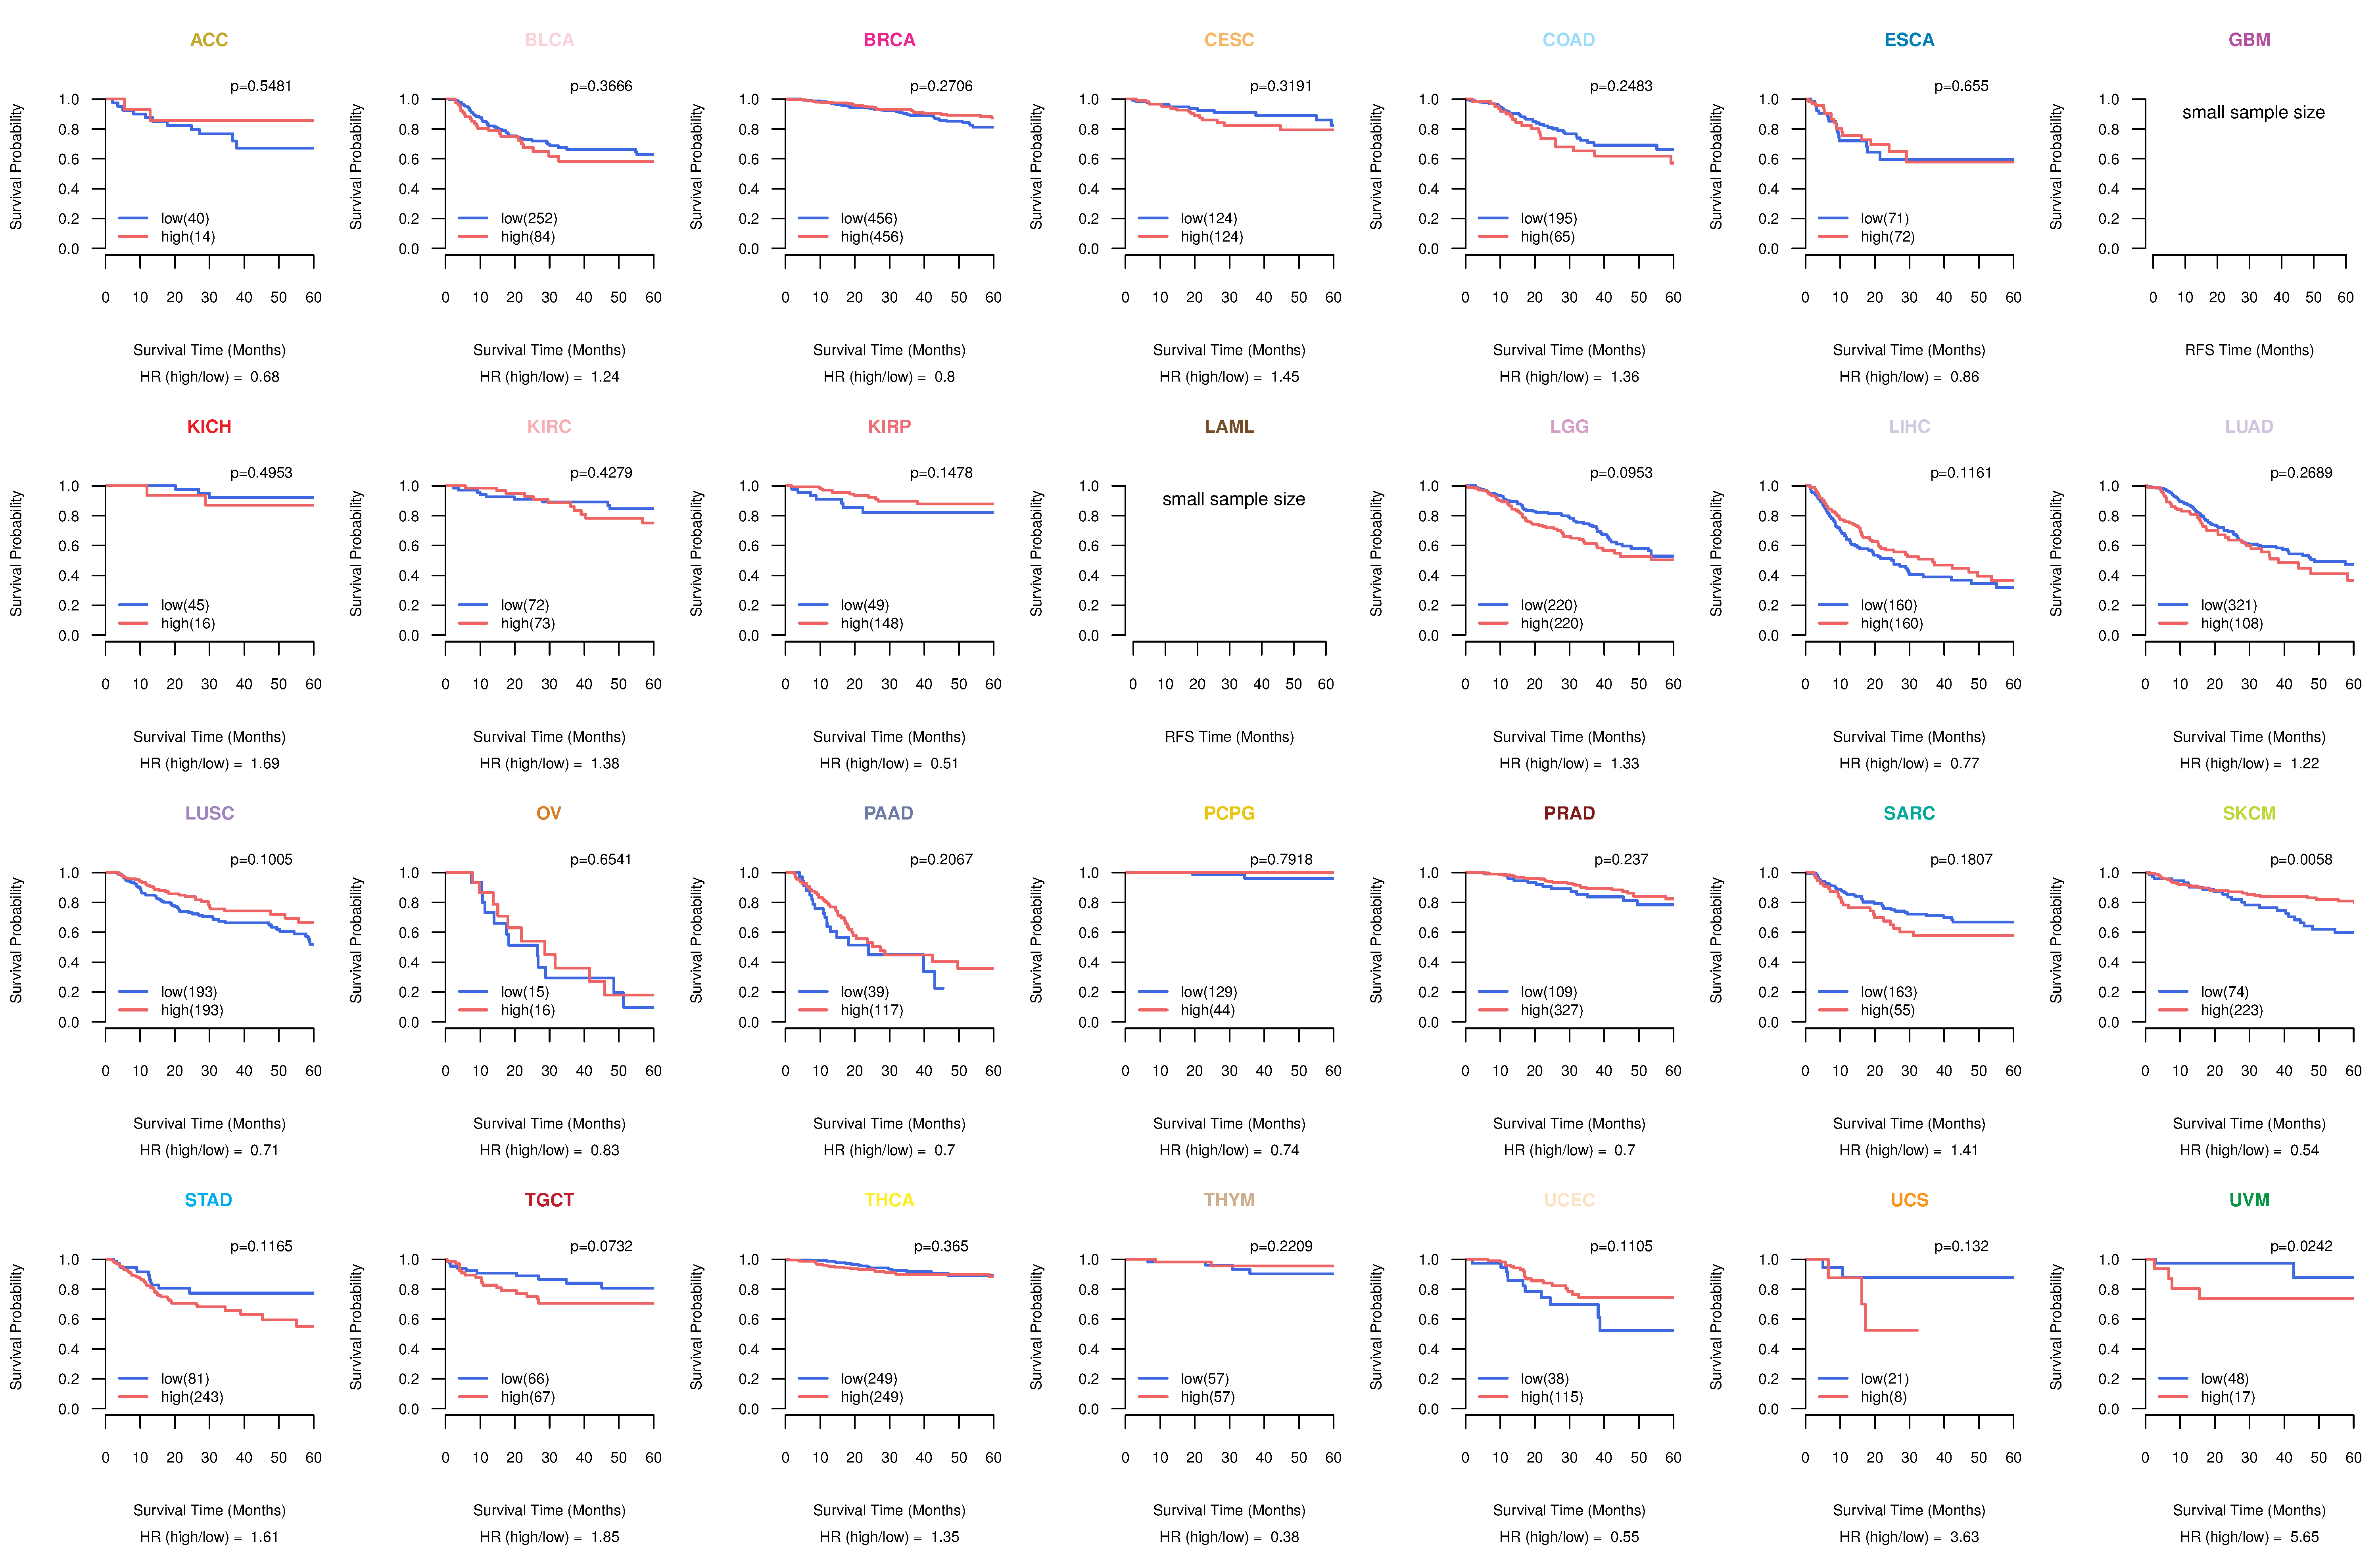
| Kaplan-Meier plots with logrank test of relapse free survival (RFS) using 28 cancer types (TCGA IlluminaHiSeq_RNASeqV2, pan-cancer normalized log2(norm_counts+1) data, version 2016-08-16) (TCGA clinicalMatrix, phenotype data, version 2016-04-27) * Click on the image enlarge it in a new window. |
 |
| Forest plot of Cox proportional hazard ratio (HR) and 95% CI of overall survival (OS) using 28 cancer types (TCGA IlluminaHiSeq_RNASeqV2, pan-cancer normalized log2(norm_counts+1) data, version 2016-08-16) (TCGA clinicalMatrix, phenotype data, version 2016-04-27) * Click on the image enlarge it in a new window. |
 |
| Forest plot of Cox proportional hazard ratio (HR) and 95% CI of relapse free survival (RFS) using 28 cancer types (TCGA IlluminaHiSeq_RNASeqV2, pan-cancer normalized log2(norm_counts+1) data, version 2016-08-16) (TCGA clinicalMatrix, phenotype data, version 2016-04-27) * Click on the image enlarge it in a new window. |
 |
| Top |
| TissGeneClin for HPN |
| TissGeneDrug for HPN |
| Drug information targeting TissGene (DrugBank Version 5.0.6, 2017-04-01) |
| DrugBank ID | Drug name | Drug activity | Drug type | Drug status |
| Top |
| TissGeneDisease for HPN |
| Disease information associated with TissGene (DisGeNet, 2016-06-01) |
| Disease ID | Disease name | # pubmeds | Source |
| umls:C0376358 | Malignant neoplasm of prostate | 21 | BeFree,GAD |
| umls:C0600139 | Prostate carcinoma | 20 | BeFree |
| umls:C0027627 | Neoplasm Metastasis | 9 | BeFree |
| umls:C0033578 | Prostatic Neoplasms | 9 | BeFree,CTD_human,LHGDN |
| umls:C0178874 | Tumor Progression | 5 | BeFree |
| umls:C0029925 | Ovarian Carcinoma | 3 | BeFree |
| umls:C1140680 | Malignant neoplasm of ovary | 3 | BeFree |
| umls:C2239176 | Liver carcinoma | 3 | BeFree |
| umls:C0023794 | Lipoidosis | 2 | CTD_human |
| umls:C0023903 | Liver neoplasms | 2 | BeFree |
| umls:C0596263 | Carcinogenesis | 2 | BeFree |
| umls:C0919267 | ovarian neoplasm | 2 | BeFree |
| umls:C1704272 | Benign Prostatic Hyperplasia | 2 | BeFree |
| umls:C0006142 | Malignant neoplasm of breast | 1 | BeFree |
| umls:C0007112 | Adenocarcinoma of prostate | 1 | BeFree |
| umls:C0007134 | Renal Cell Carcinoma | 1 | BeFree |
| umls:C0019163 | Hepatitis B | 1 | BeFree |
| umls:C0021053 | Immune System Diseases | 1 | BeFree |
| umls:C0155552 | Hearing Loss, Mixed Conductive-Sensorineural | 1 | BeFree |
| umls:C0346156 | Benign neoplasm of breast | 1 | BeFree |
| umls:C0494165 | Secondary malignant neoplasm of liver | 1 | BeFree |
| umls:C0521158 | Recurrent tumor | 1 | BeFree |
| umls:C0678222 | Breast Carcinoma | 1 | BeFree |
| umls:C0936223 | Metastatic Prostate Carcinoma | 1 | BeFree |
| umls:C0940937 | precancerous lesions | 1 | BeFree |
| umls:C1512409 | Hepatocarcinogenesis | 1 | BeFree |
| umls:C1853195 | Prostate Cancer, Hereditary, 7 | 1 | BeFree |
|
Copyright 2016-Present - The University of Texas Health Science Center at Houston (UTHealth) Web File Viewing | How to Report, Fraud, Waste and Abuse | State of Texas | Statewide Search | Texas Homeland Security | Site Policies |