 |
| |
| |
| |
| |
| |
| |
|

| TissGeneSummary for PPM1J |
 Gene summary Gene summary |
| Basic gene information | Gene symbol | PPM1J |
| Gene name | protein phosphatase, Mg2+/Mn2+ dependent, 1J | |
| Synonyms | PP2CZ|PP2Czeta|PPP2CZ | |
| Cytomap | UCSC genome browser: 1p13.2 | |
| Type of gene | protein-coding | |
| RefGenes | NM_005167.5, | |
| Description | PP2C-zetaprotein phosphatase 1Jprotein phosphatase 1J (PP2C domain containing)protein phosphatase 2C isoform zetaprotein phosphatase 2C zetaprotein phosphatase 2a, catalytic subunit, zeta isoform | |
| Modification date | 20141207 | |
| dbXrefs | MIM : 609957 | |
| HGNC : HGNC | ||
| Ensembl : ENSG00000155367 | ||
| HPRD : 15171 | ||
| Vega : OTTHUMG00000012019 | ||
| Protein | UniProt: go to UniProt's Cross Reference DB Table | |
| Expression | CleanEX: HS_PPM1J | |
| BioGPS: 333926 | ||
| Pathway | NCI Pathway Interaction Database: PPM1J | |
| KEGG: PPM1J | ||
| REACTOME: PPM1J | ||
| Pathway Commons: PPM1J | ||
| Context | iHOP: PPM1J | |
| ligand binding site mutation search in PubMed: PPM1J | ||
| UCL Cancer Institute: PPM1J | ||
| Assigned class in TissGDB* | C | |
| Included tissue-specific gene expression resources | TiGER,GTEx | |
| Specific-tissues in normal samples (assigned by TissGDB using HPA, TiGER, and GTEx) | Testis | |
| Cancer types related to the specific-tissues in cancer samples (assigned by TissGDB using TCGA) | TGCT | |
| Reference showing the relevant tissue of PPM1J | ||
| Description by TissGene annotations | ||
| * Class A consists of genes with literature evidence and is part of the cTissGenes. Class B consists of only cTissGenes without additional evidence. The remaining genes belong to Class C. |
| Gene ontology having evidence of Inferred from Direct Assay (IDA) from Entrez |
| GO ID | GO term | PubMed ID |
| Top |
| TissGeneExp for PPM1J |
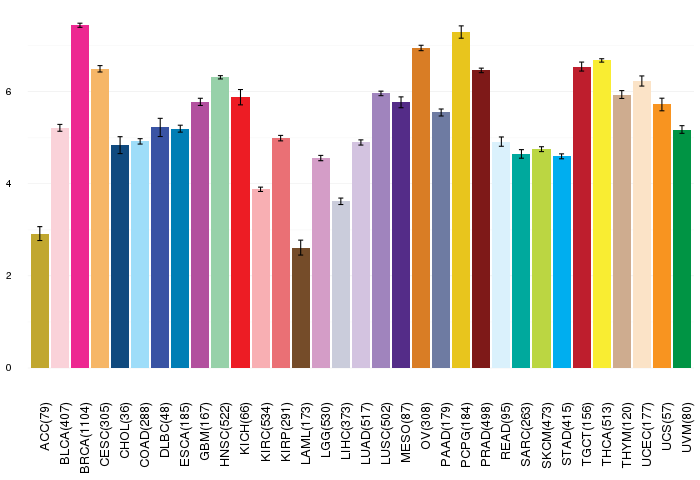
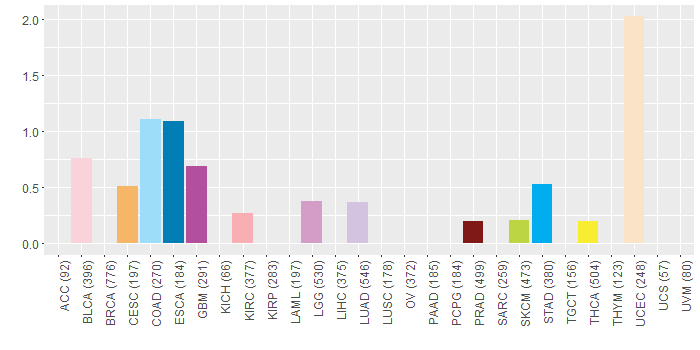
| Gene expressions across 28 cancer types (X-axis: cancer type and Y-axis: log2(norm_counts+1)) (TCGA IlluminaHiSeq_RNASeqV2, pan-cancer normalized log2(norm_counts+1) data, version 2016-08-16) |
 |
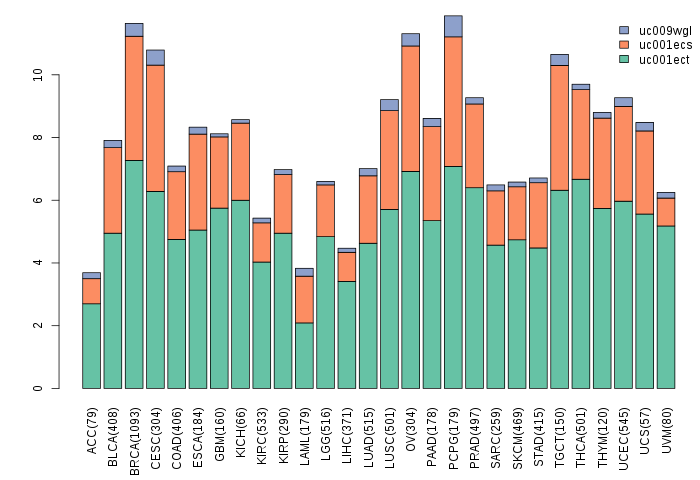
| Gene isoform expressions across 28 cancer types (X-axis: cancer type and Y-axis: log2(norm_counts+1)) (TCGA pan-cancer tcga_rsem_isoform_tpm, version 2016-09-01) |
 |
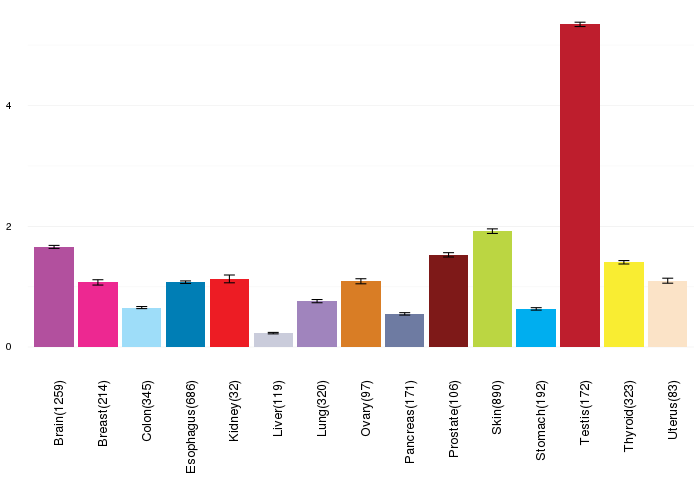
| Gene expressions across normal tissues of GTEx data (GTEx GTEx_Analysis_v6_RNA-seq_RNA-SeQCv1.1.8_gene_rpkm.gct) - Here, we shows the matched tissue types only among our 28 cancer types. |
 |
| Different expressions across 14 cancer types with more than 10 samples between matched tumors and normals (X-axis: cancer type and Y-axis: log2(norm_counts+1)) (TCGA IlluminaHiSeq_RNASeqV2, pan-cancer normalized log2(norm_counts+1) data, version 2016-08-16) |
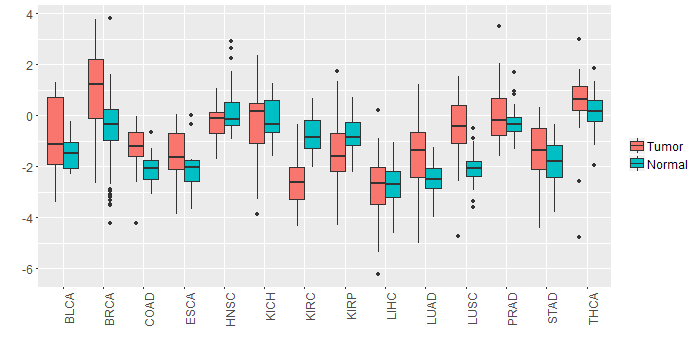 |
| - Significantly differentially expressed cancer types and information. (|Fold change|>1 and FDR<0.05) |
| Cancer type | Mean(exp) in tumor | Mean(exp) in matched normal | Log2FC | P-val. | FDR |
| BRCA | 1.0473332 | -0.546477326 | 1.593810526 | 6.84E-16 | 3.78E-15 |
| KIRC | -2.614992896 | -0.725070674 | -1.889922222 | 2.06E-26 | 2.81E-25 |
| LUSC | -0.397653435 | -2.06399069 | 1.666337255 | 4.79E-14 | 2.58E-13 |
| Top |
| TissGene-miRNA for PPM1J |
| Significantly anti-correlated miRNAs of TissGene across 28 cancer types (Gene-miRNA relations from TargetScanHuman Relsease 7.1, Conserved_Site_Context_Scores.txt.zip, 06.01.2016) (TCGA IlluminaHiSeq_miRNASeq, log2(RPM+1) data, version 2016-11-21) (TCGA IlluminaHiSeq_RNASeqV2, log2(normalized_count+1) data, version 2016-08-16) (Spearman’s Rank Correlation (p-value<0.05 and coefficient<-0.25)) |
| Cancer type | miRNA id | miRNA accession | P-val. | Coeff. | # samples |
| Top |
| TissGeneMut for PPM1J |
| TissGeneSNV for PPM1J |
| nsSNV counts per each loci. Different colors of circles represent different cancer types. Circle size denotes number of samples. (TCGA somatic mutation (SNPs and small INDELs) data, version 2016-04-25) * Click on the image to enlarge it in a new window. |
 |
 |
| Somatic nucleotide variants of TissGene across 28 cancer types (X-axis: cancer type and Y-axis: % of mutated samples) The numbers in parentheses are numbers of samples with mutation (nsSNVs). (TCGA somatic mutation (SNPs and small INDELs) data, version 2016-04-25) |
 |
| - nsSNVs sorted by frequency. |
| AAchange | Cancer type | # samples |
| p.P193R | CHOL | 1 |
| p.I496T | UCEC | 1 |
| p.D411H | BLCA | 1 |
| p.R273H | LGG | 1 |
| p.V272M | UCEC | 1 |
| p.I111M | CESC | 1 |
| p.R479H | GBM | 1 |
| p.P399R | CHOL | 1 |
| p.V139I | READ | 1 |
| p.G164R | COAD | 1 |
| p.K224T | COAD | 1 |
| p.P191L | UCEC | 1 |
| p.G146D | THCA | 1 |
| p.R286W | COAD | 1 |
| p.D238H | LUAD | 1 |
| p.D444H | LUAD | 1 |
| p.P267T | BLCA | 1 |
| p.R251Q | GBM | 1 |
| p.L324I | STAD | 1 |
| p.P497L | STAD | 1 |
| p.D73N | LGG | 1 |
| p.E90Q | BLCA | 1 |
| p.E237D | UCEC | 1 |
| p.R175H | READ | 1 |
| p.E320A | UCEC | 1 |
| p.H180Y | LUAD | 1 |
| p.S393F | ESCA | 1 |
| p.L308M | ESCA | 1 |
| p.F115I | SKCM | 1 |
| p.M243T | KIRC | 1 |
| p.G159E | PRAD | 1 |
| Top |
| TissGeneCNV for PPM1J |
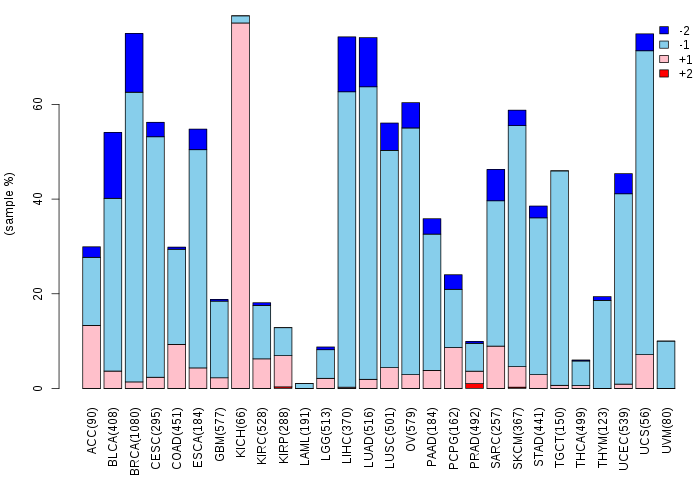
| Copy number variations of TissGene across 28 cancer types (X-axis: cancer type and Y-axis: % of CNV samples) (TCGA Gistic2_CopyNumber_Gistic2_all_data_by_genes, Gistic2 copy number data, version 2016-08-16) |
 |
| Top |
| TissGeneFusions for PPM1J |
| Fusion genes including TissGene (ChimerDB 3.0, 2016-12-01 and TCGA fusion Portal 2015-12-01) |
| Database | Src | Cancer type | Sample | Fusion gene | ORF | 5'-gene BP | 3'-gene BP |
| Top |
| TissGeneNet for PPM1J |
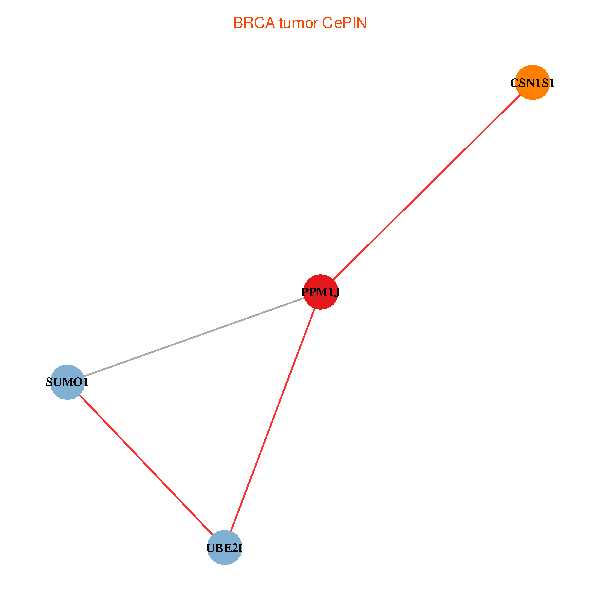
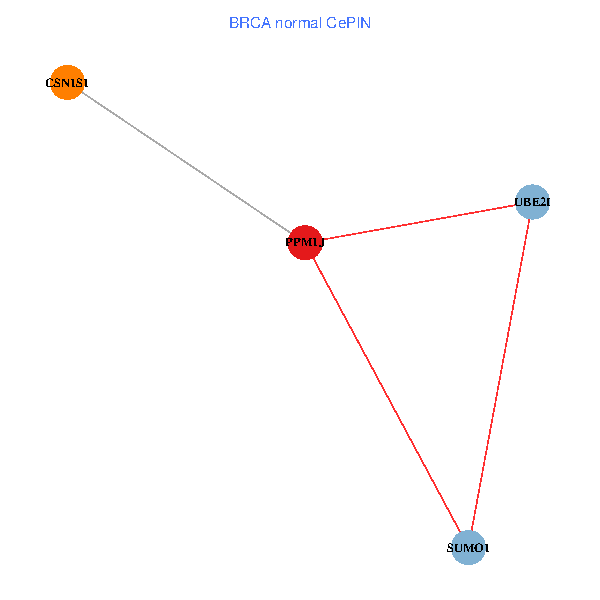
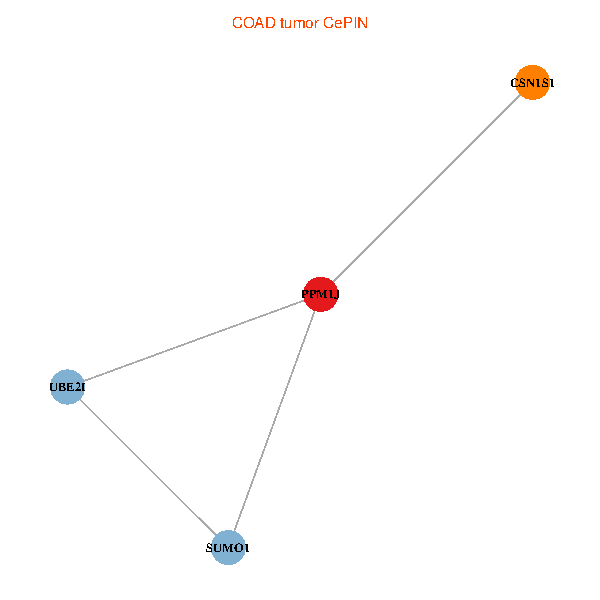
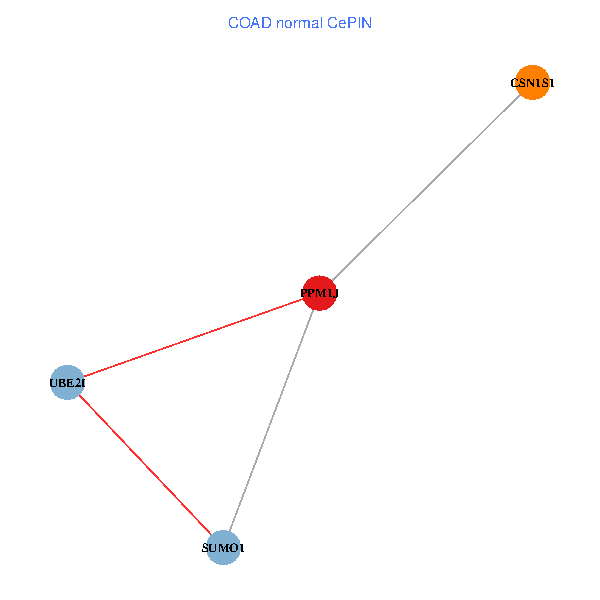
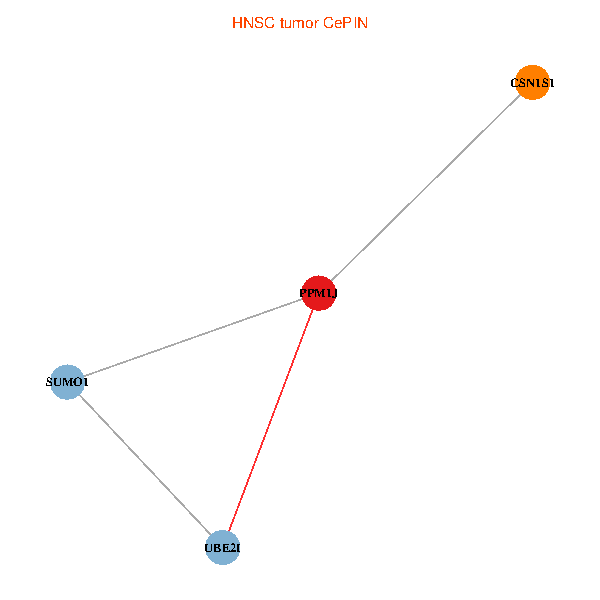
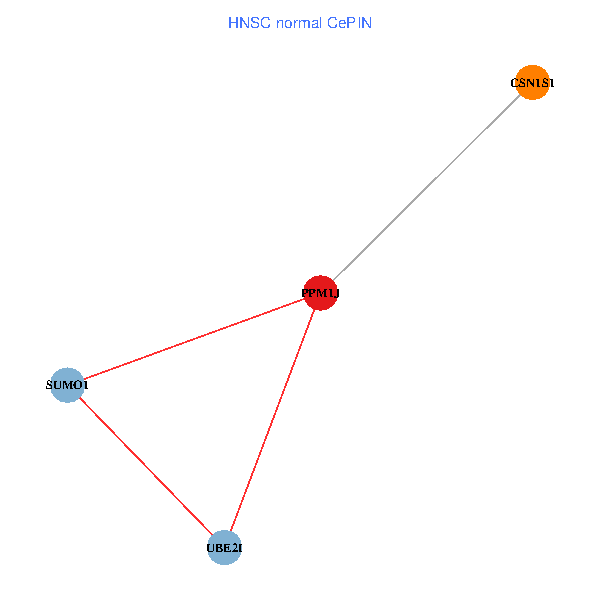
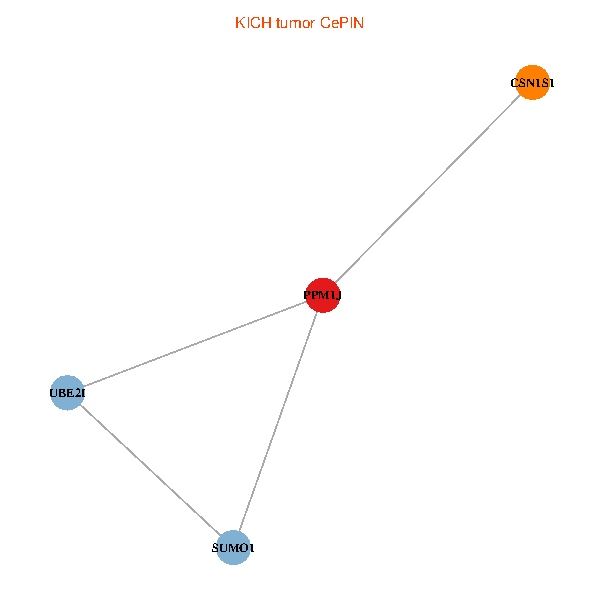
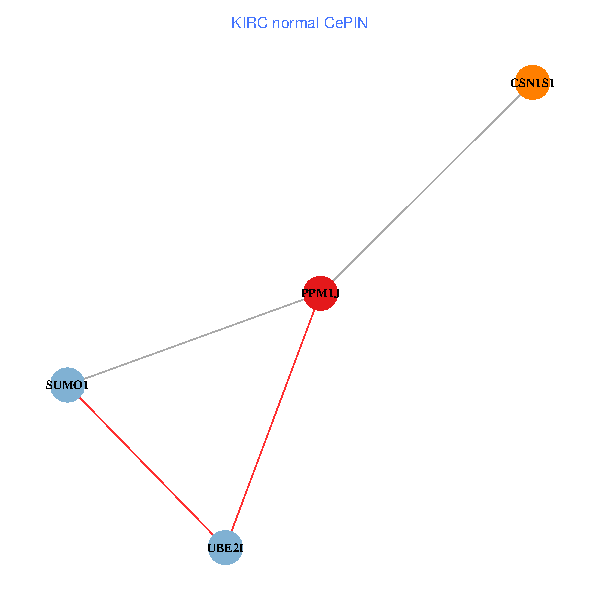
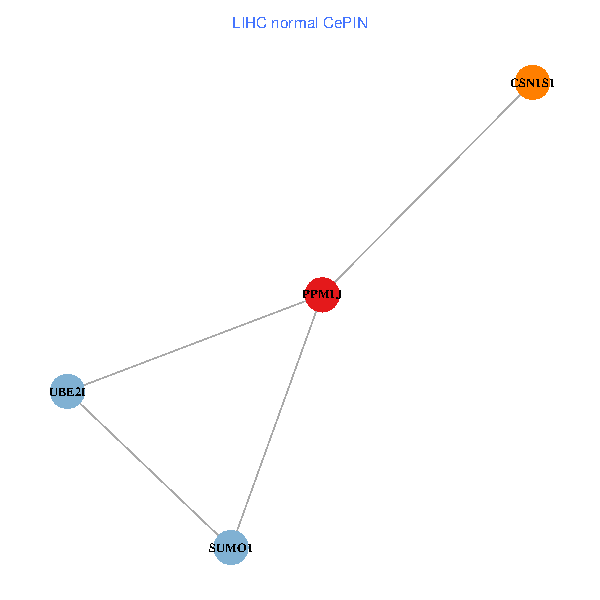
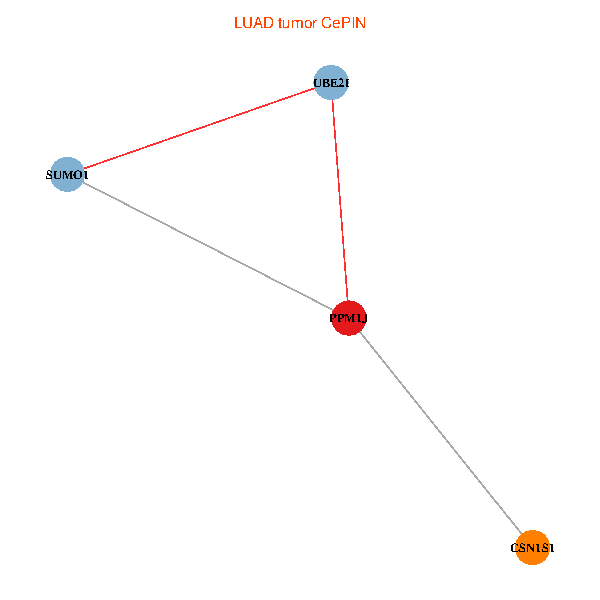
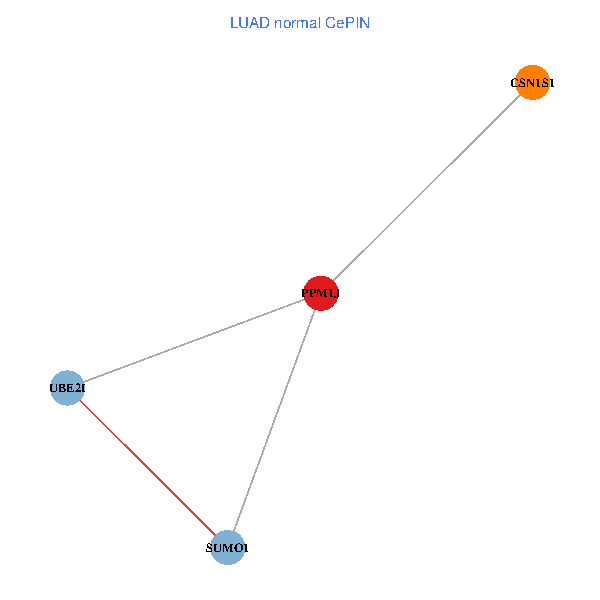
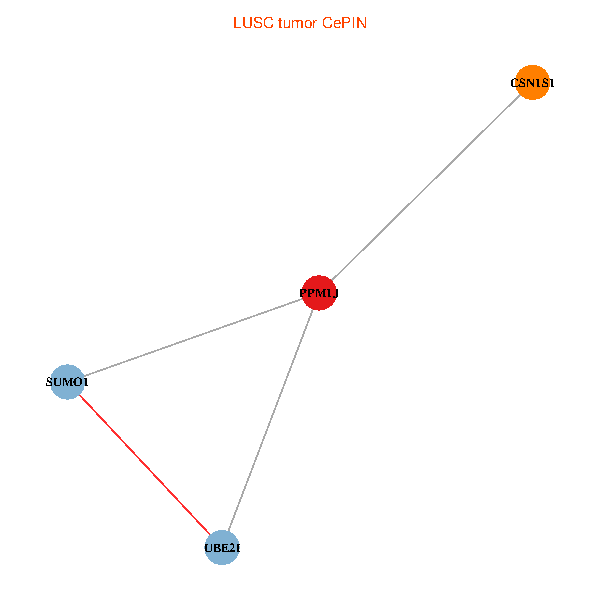
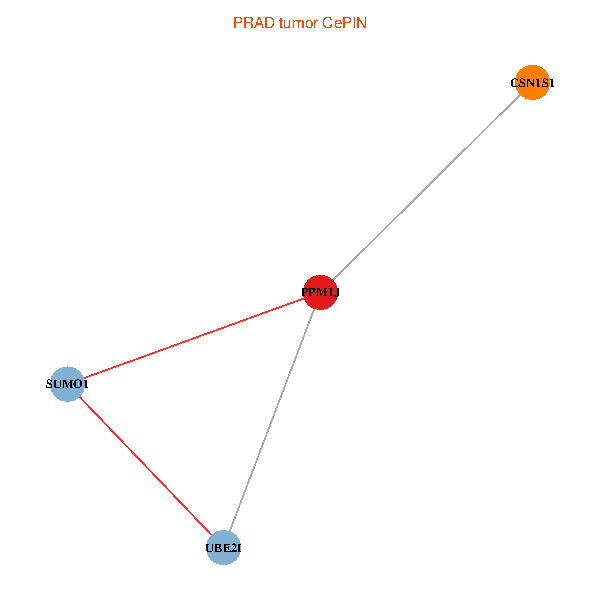
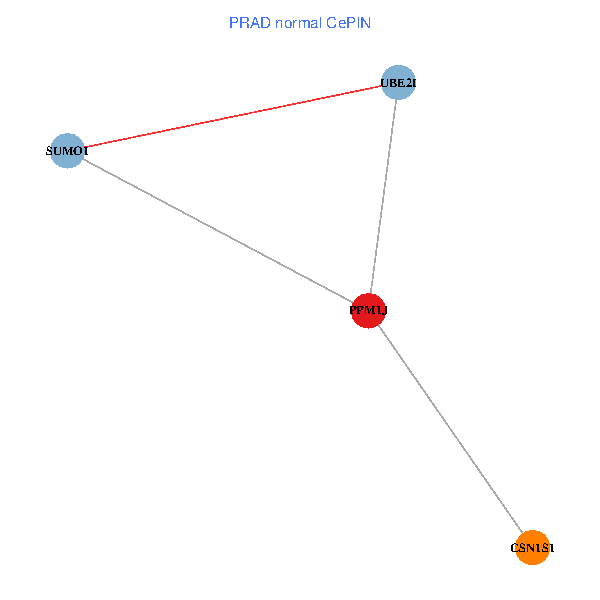
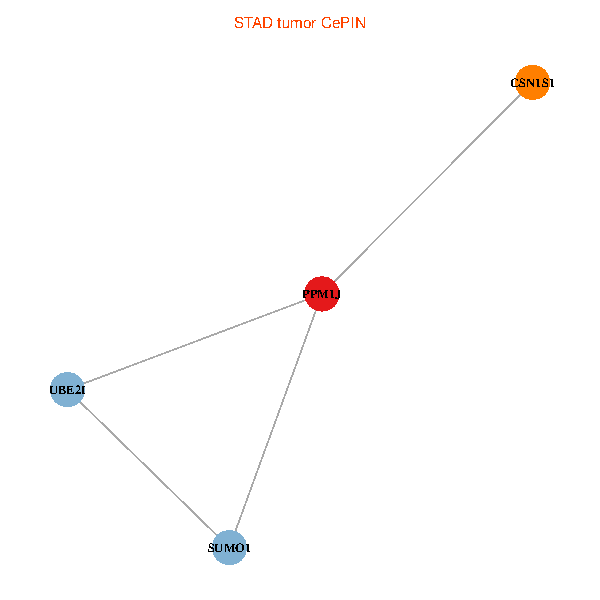
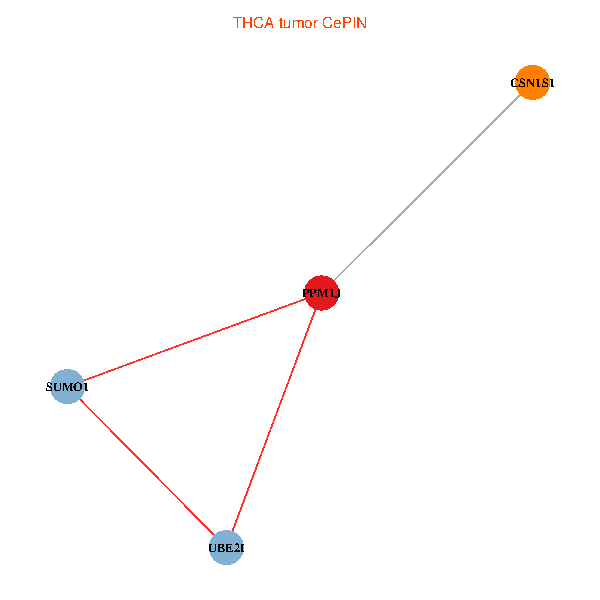
| Co-expressed gene networks based on protein-protein interaction data (CePIN) (TCGA IlluminaHiSeq_RNASeqV2, pan-cancer normalized log2(norm_counts+1) data, version 2016-08-16) (PINA2 ppi data) |
| BRCA (tumor) | BRCA (normal) |
| PPM1J, SUMO1, UBE2I, CSN1S1 (tumor) | PPM1J, SUMO1, UBE2I, CSN1S1 (normal) |
 |  |
| COAD (tumor) | COAD (normal) |
| PPM1J, SUMO1, UBE2I, CSN1S1 (tumor) | PPM1J, SUMO1, UBE2I, CSN1S1 (normal) |
 |  |
| HNSC (tumor) | HNSC (normal) |
| PPM1J, SUMO1, UBE2I, CSN1S1 (tumor) | PPM1J, SUMO1, UBE2I, CSN1S1 (normal) |
 |  |
| KICH (tumor) | KICH (normal) |
| PPM1J, SUMO1, UBE2I, CSN1S1 (tumor) | PPM1J, SUMO1, UBE2I, CSN1S1 (normal) |
 |  |
| KIRC (tumor) | KIRC (normal) |
| PPM1J, SUMO1, UBE2I, CSN1S1 (tumor) | PPM1J, SUMO1, UBE2I, CSN1S1 (normal) |
 |  |
| KIRP (tumor) | KIRP (normal) |
| PPM1J, SUMO1, UBE2I, CSN1S1 (tumor) | PPM1J, SUMO1, UBE2I, CSN1S1 (normal) |
 |  |
| LIHC (tumor) | LIHC (normal) |
| PPM1J, SUMO1, UBE2I, CSN1S1 (tumor) | PPM1J, SUMO1, UBE2I, CSN1S1 (normal) |
 |  |
| LUAD (tumor) | LUAD (normal) |
| PPM1J, SUMO1, UBE2I, CSN1S1 (tumor) | PPM1J, SUMO1, UBE2I, CSN1S1 (normal) |
 |  |
| LUSC (tumor) | LUSC (normal) |
| PPM1J, SUMO1, UBE2I, CSN1S1 (tumor) | PPM1J, SUMO1, UBE2I, CSN1S1 (normal) |
 |  |
| PRAD (tumor) | PRAD (normal) |
| PPM1J, SUMO1, UBE2I, CSN1S1 (tumor) | PPM1J, SUMO1, UBE2I, CSN1S1 (normal) |
 |  |
| STAD (tumor) | STAD (normal) |
| PPM1J, SUMO1, UBE2I, CSN1S1 (tumor) | PPM1J, SUMO1, UBE2I, CSN1S1 (normal) |
 |  |
| THCA (tumor) | THCA (normal) |
| PPM1J, SUMO1, UBE2I, CSN1S1 (tumor) | PPM1J, SUMO1, UBE2I, CSN1S1 (normal) |
 |  |
| Top |
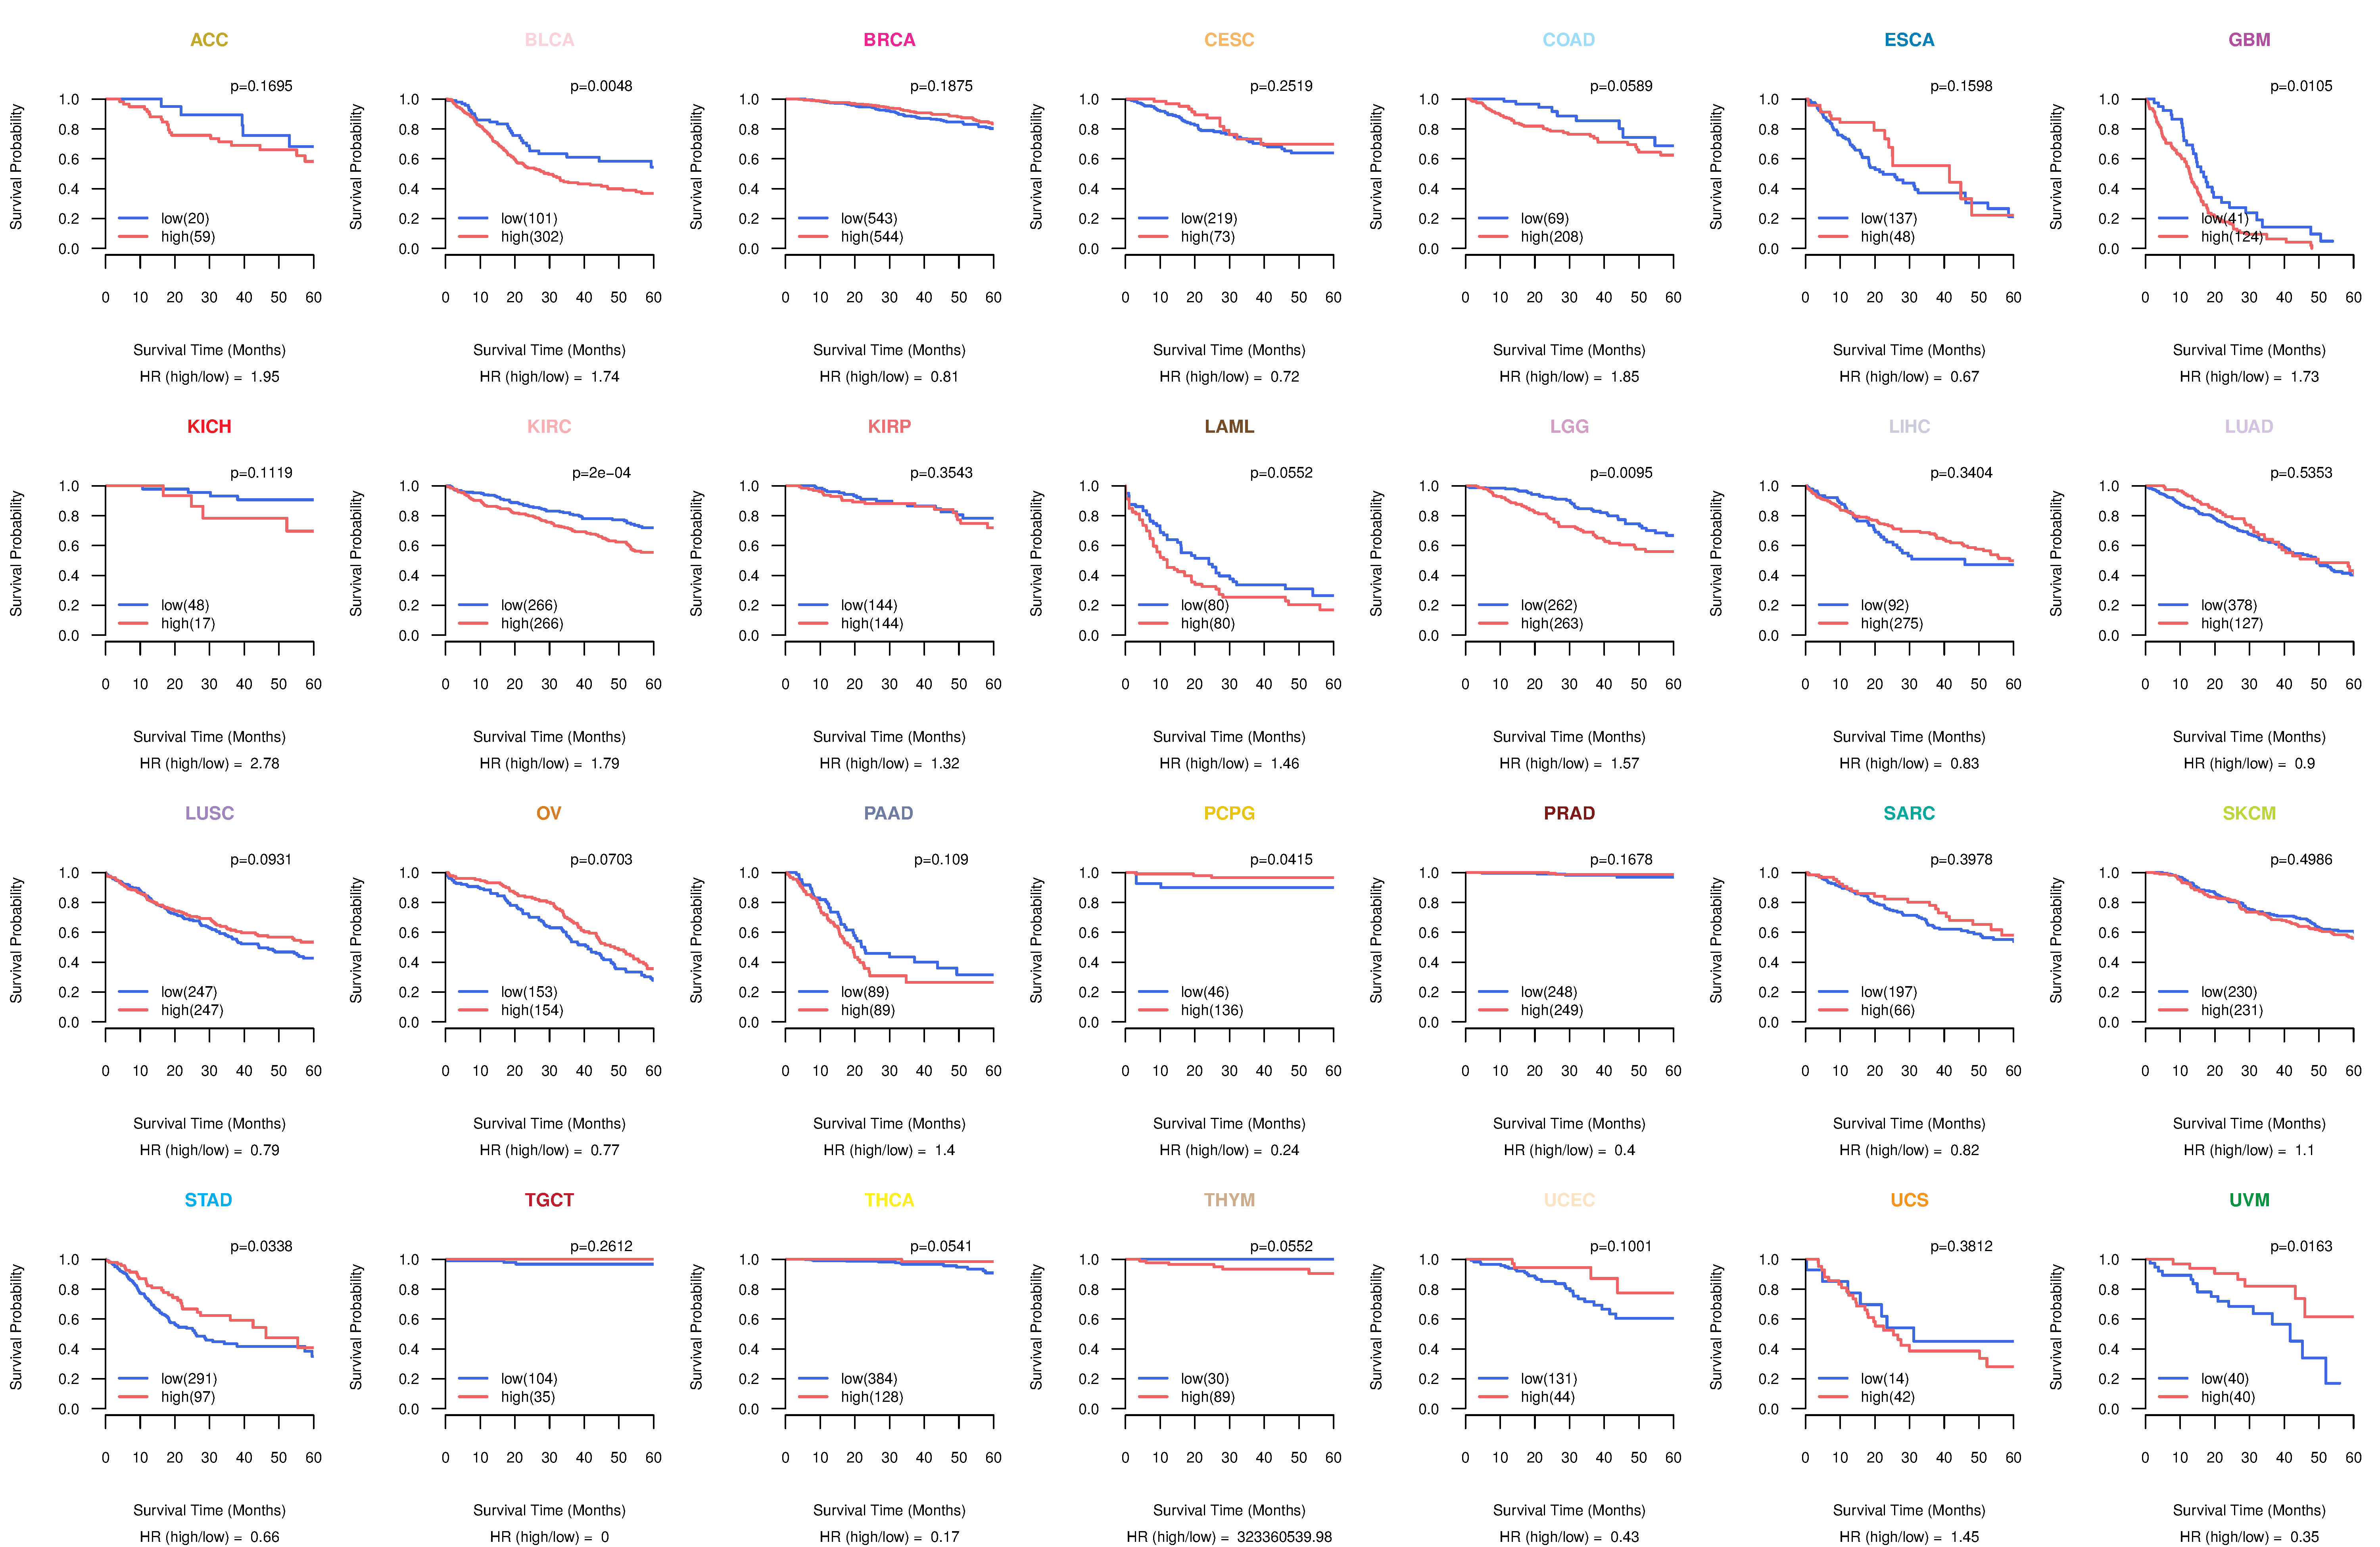
| TissGeneProg for PPM1J |
| Kaplan-Meier plots with logrank tests of overall survival (OS) using 28 cancer types (TCGA IlluminaHiSeq_RNASeqV2, pan-cancer normalized log2(norm_counts+1) data, version 2016-08-16) (TCGA clinicalMatrix, phenotype data, version 2016-04-27) * Click on the image to enlarge it in a new window. |
 |
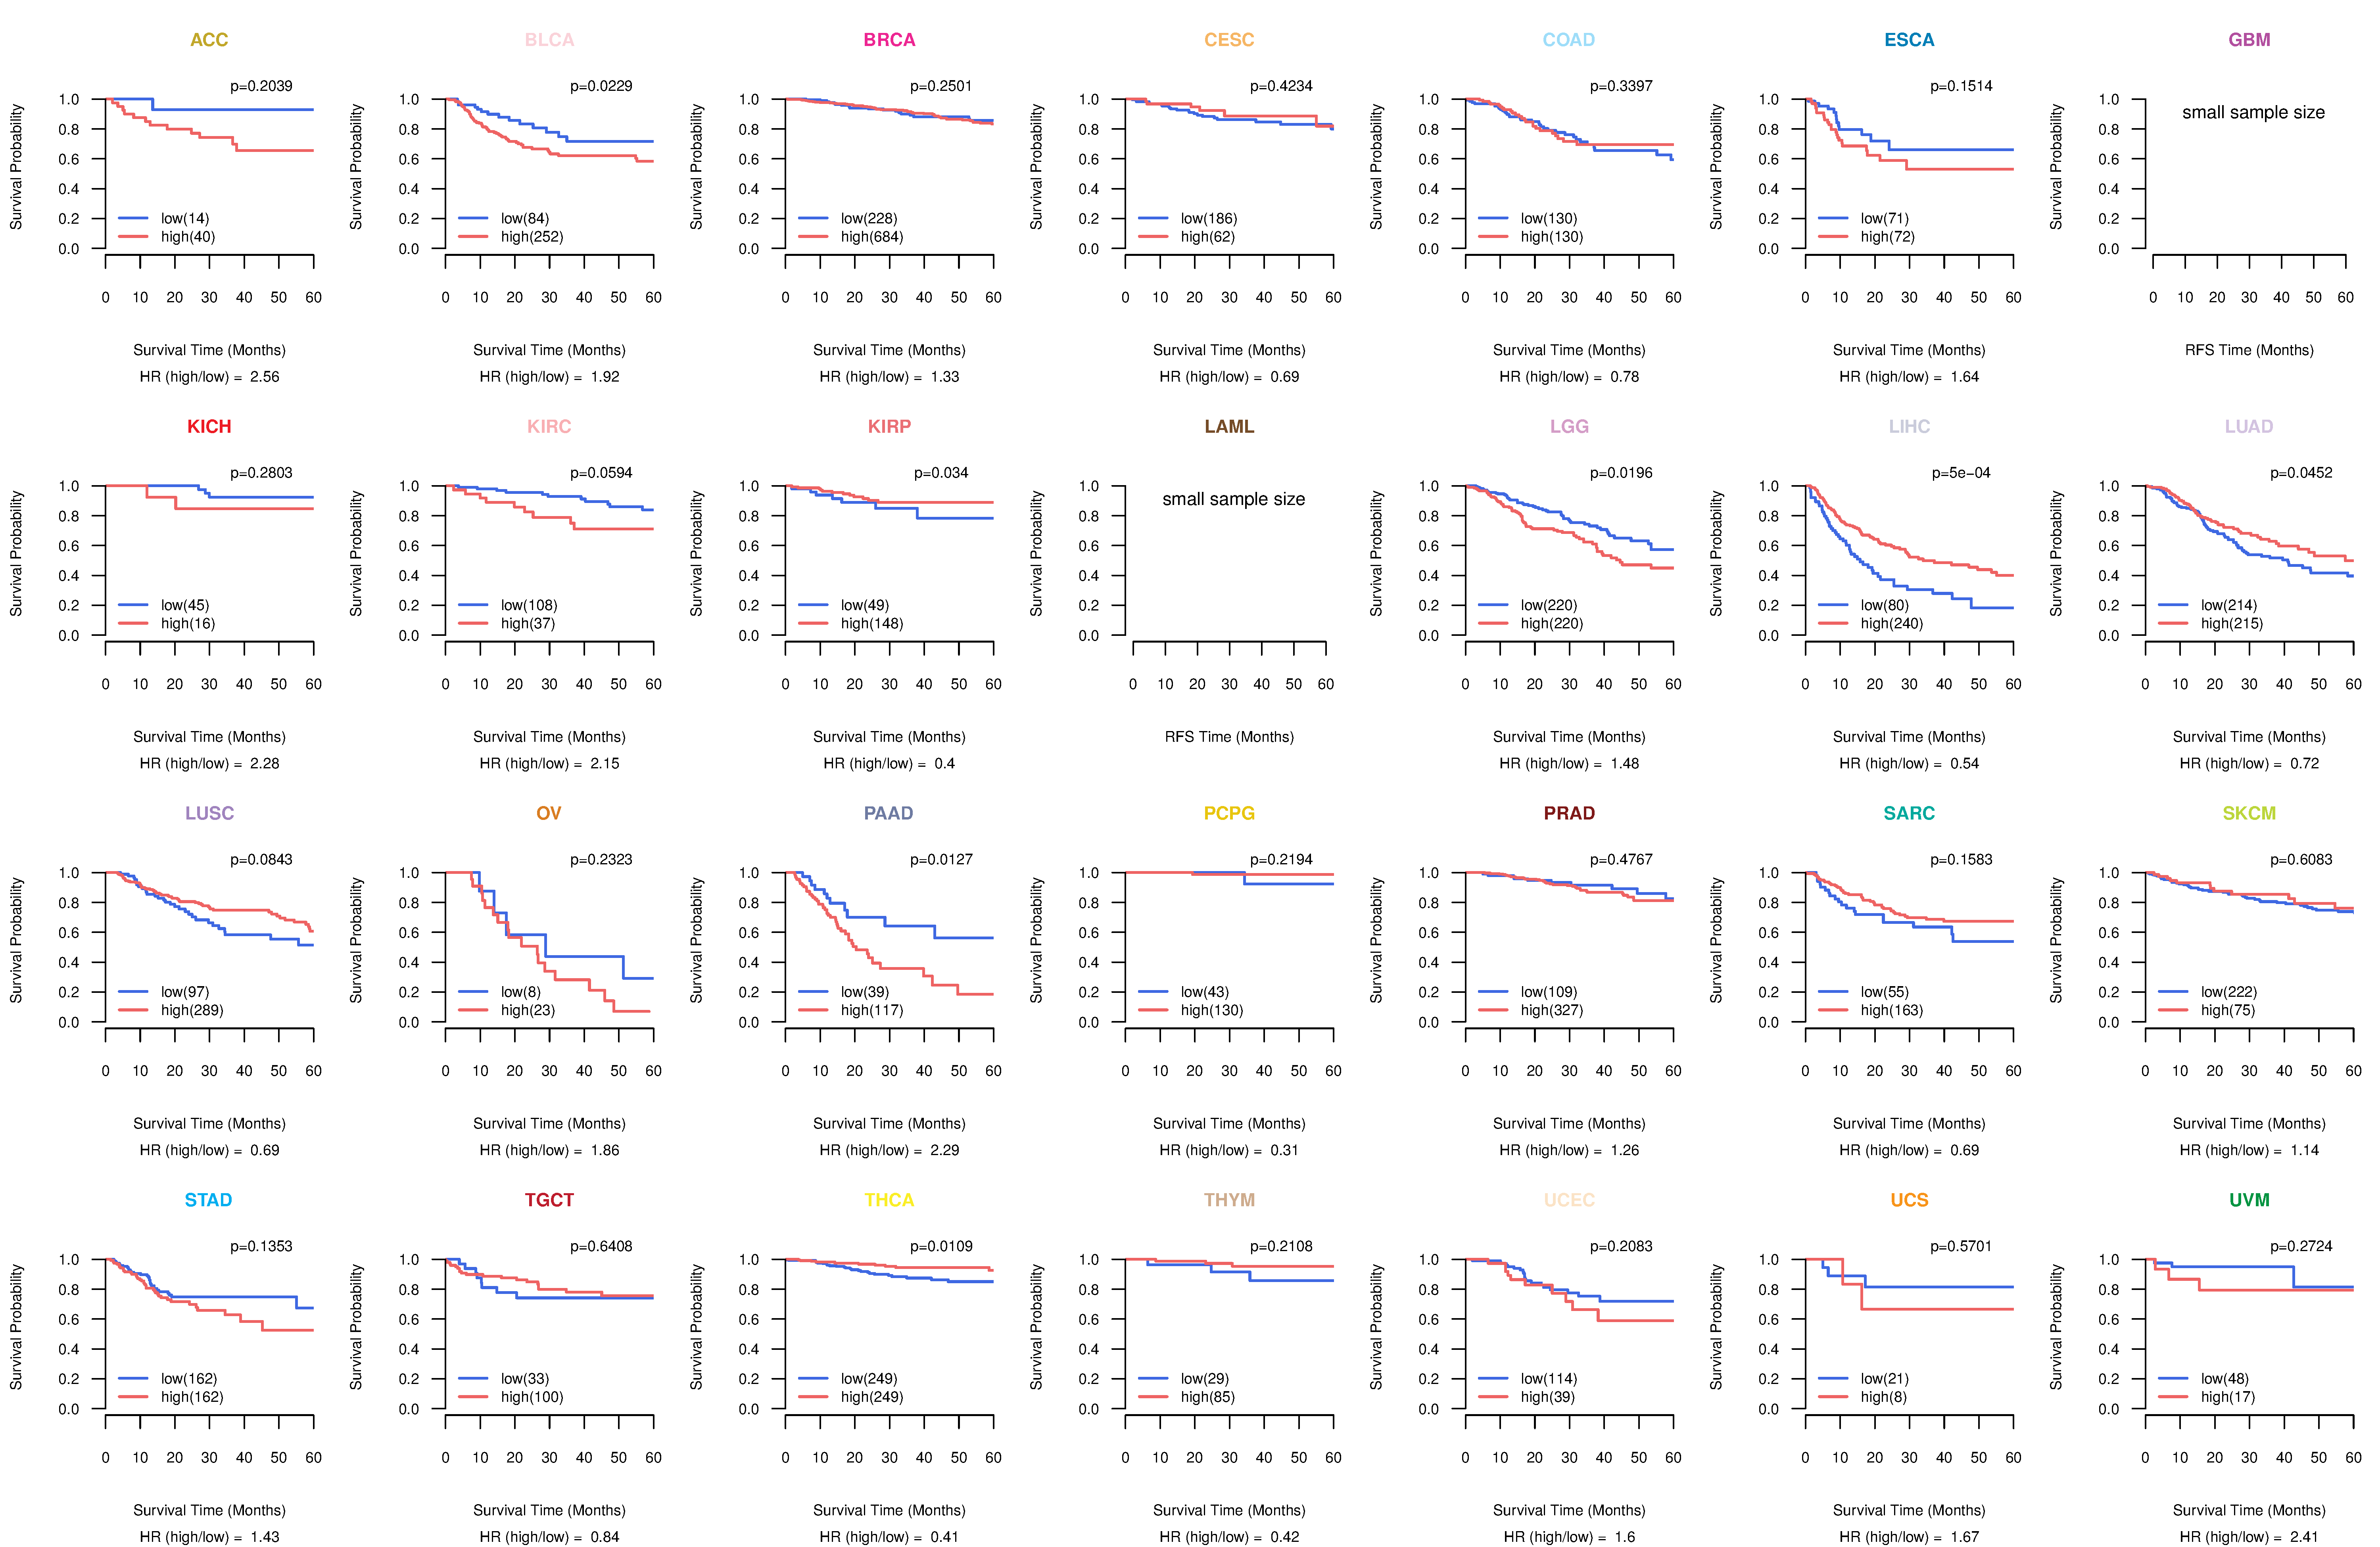
| Kaplan-Meier plots with logrank test of relapse free survival (RFS) using 28 cancer types (TCGA IlluminaHiSeq_RNASeqV2, pan-cancer normalized log2(norm_counts+1) data, version 2016-08-16) (TCGA clinicalMatrix, phenotype data, version 2016-04-27) * Click on the image enlarge it in a new window. |
 |
| Forest plot of Cox proportional hazard ratio (HR) and 95% CI of overall survival (OS) using 28 cancer types (TCGA IlluminaHiSeq_RNASeqV2, pan-cancer normalized log2(norm_counts+1) data, version 2016-08-16) (TCGA clinicalMatrix, phenotype data, version 2016-04-27) * Click on the image enlarge it in a new window. |
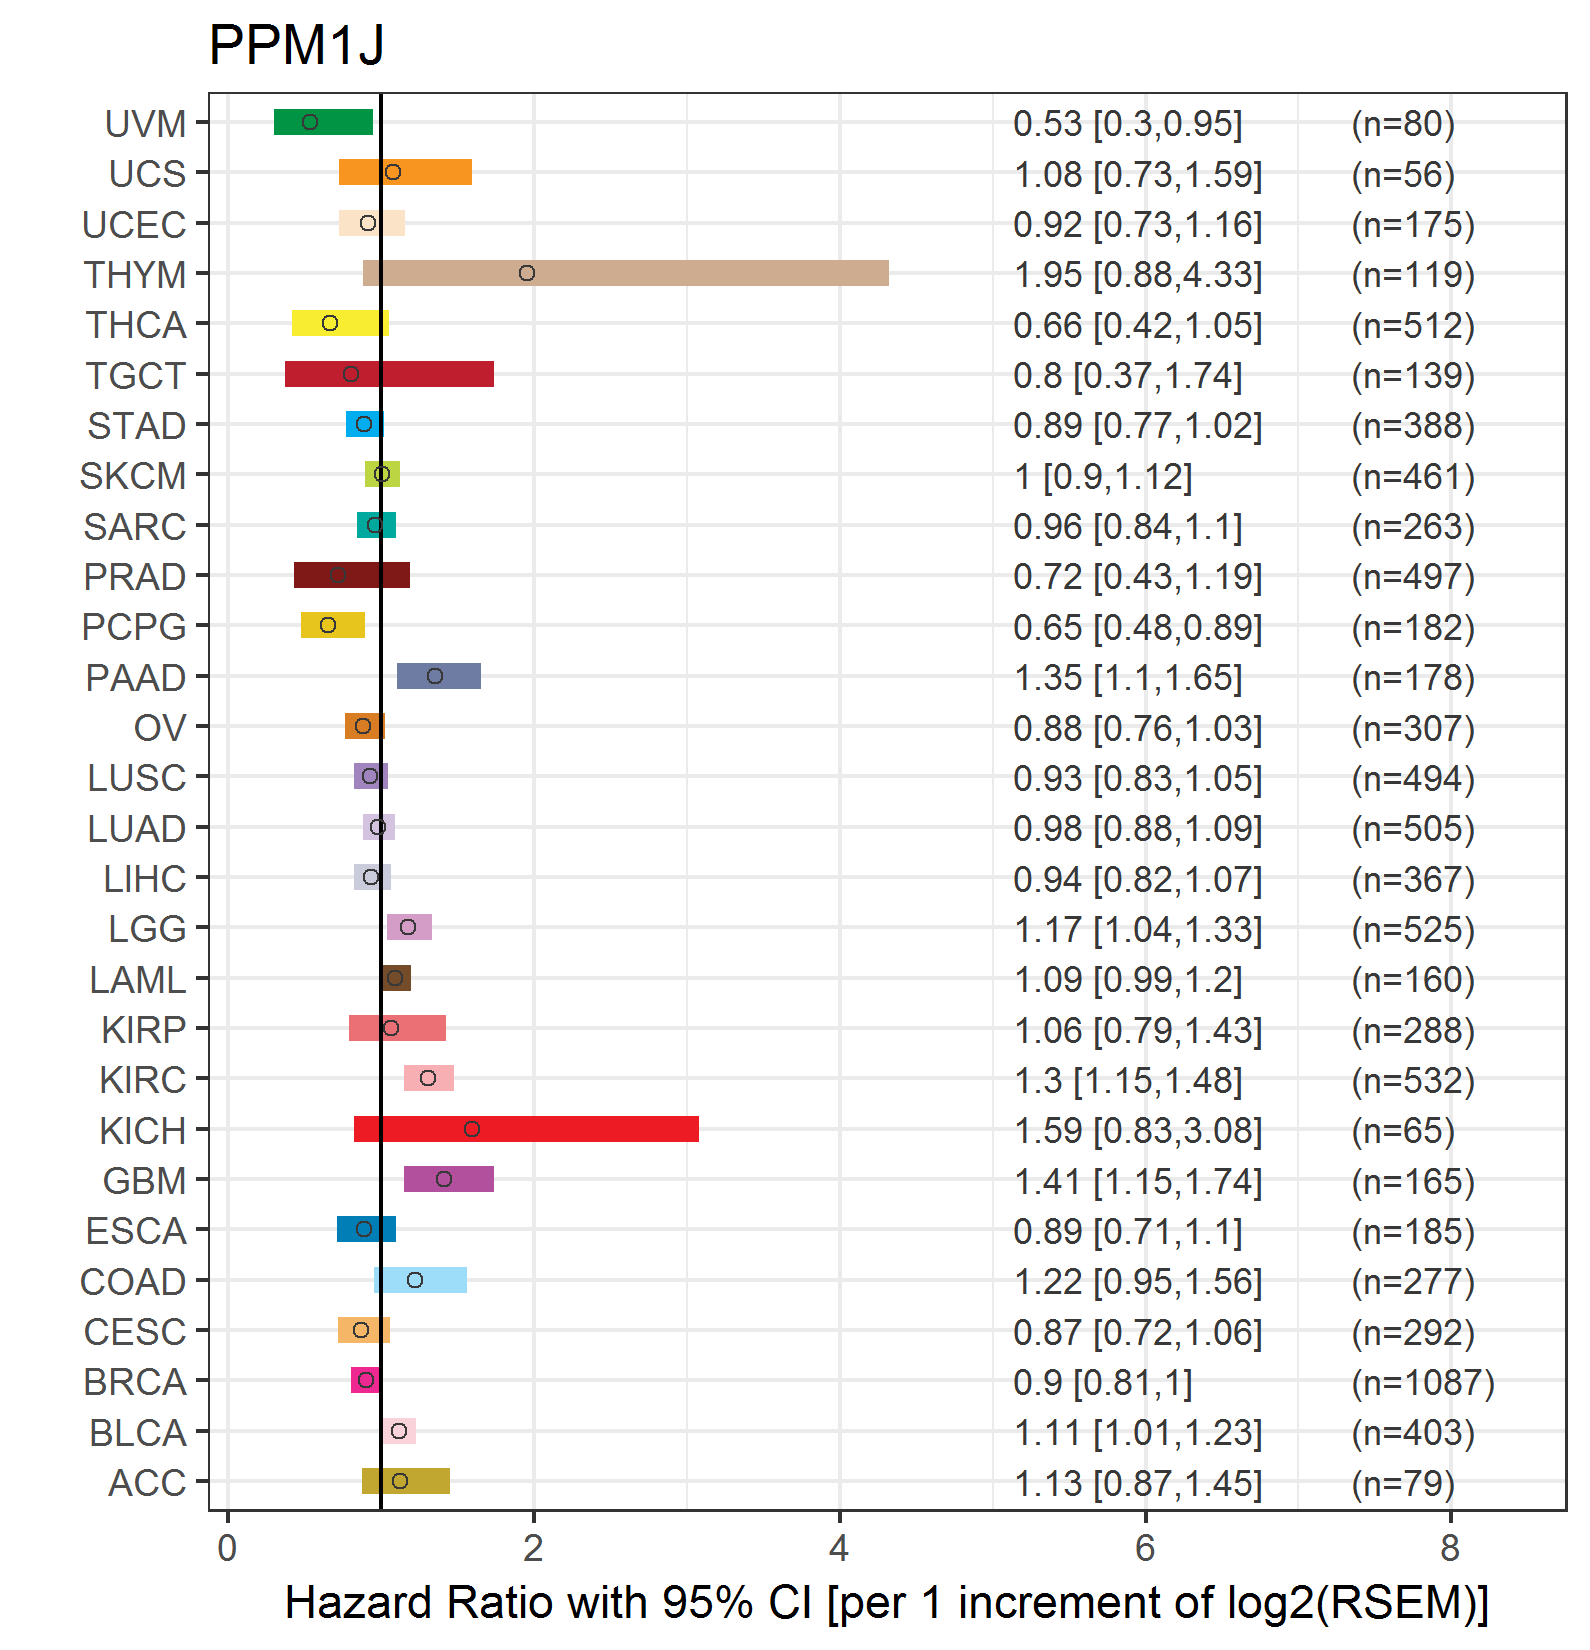 |
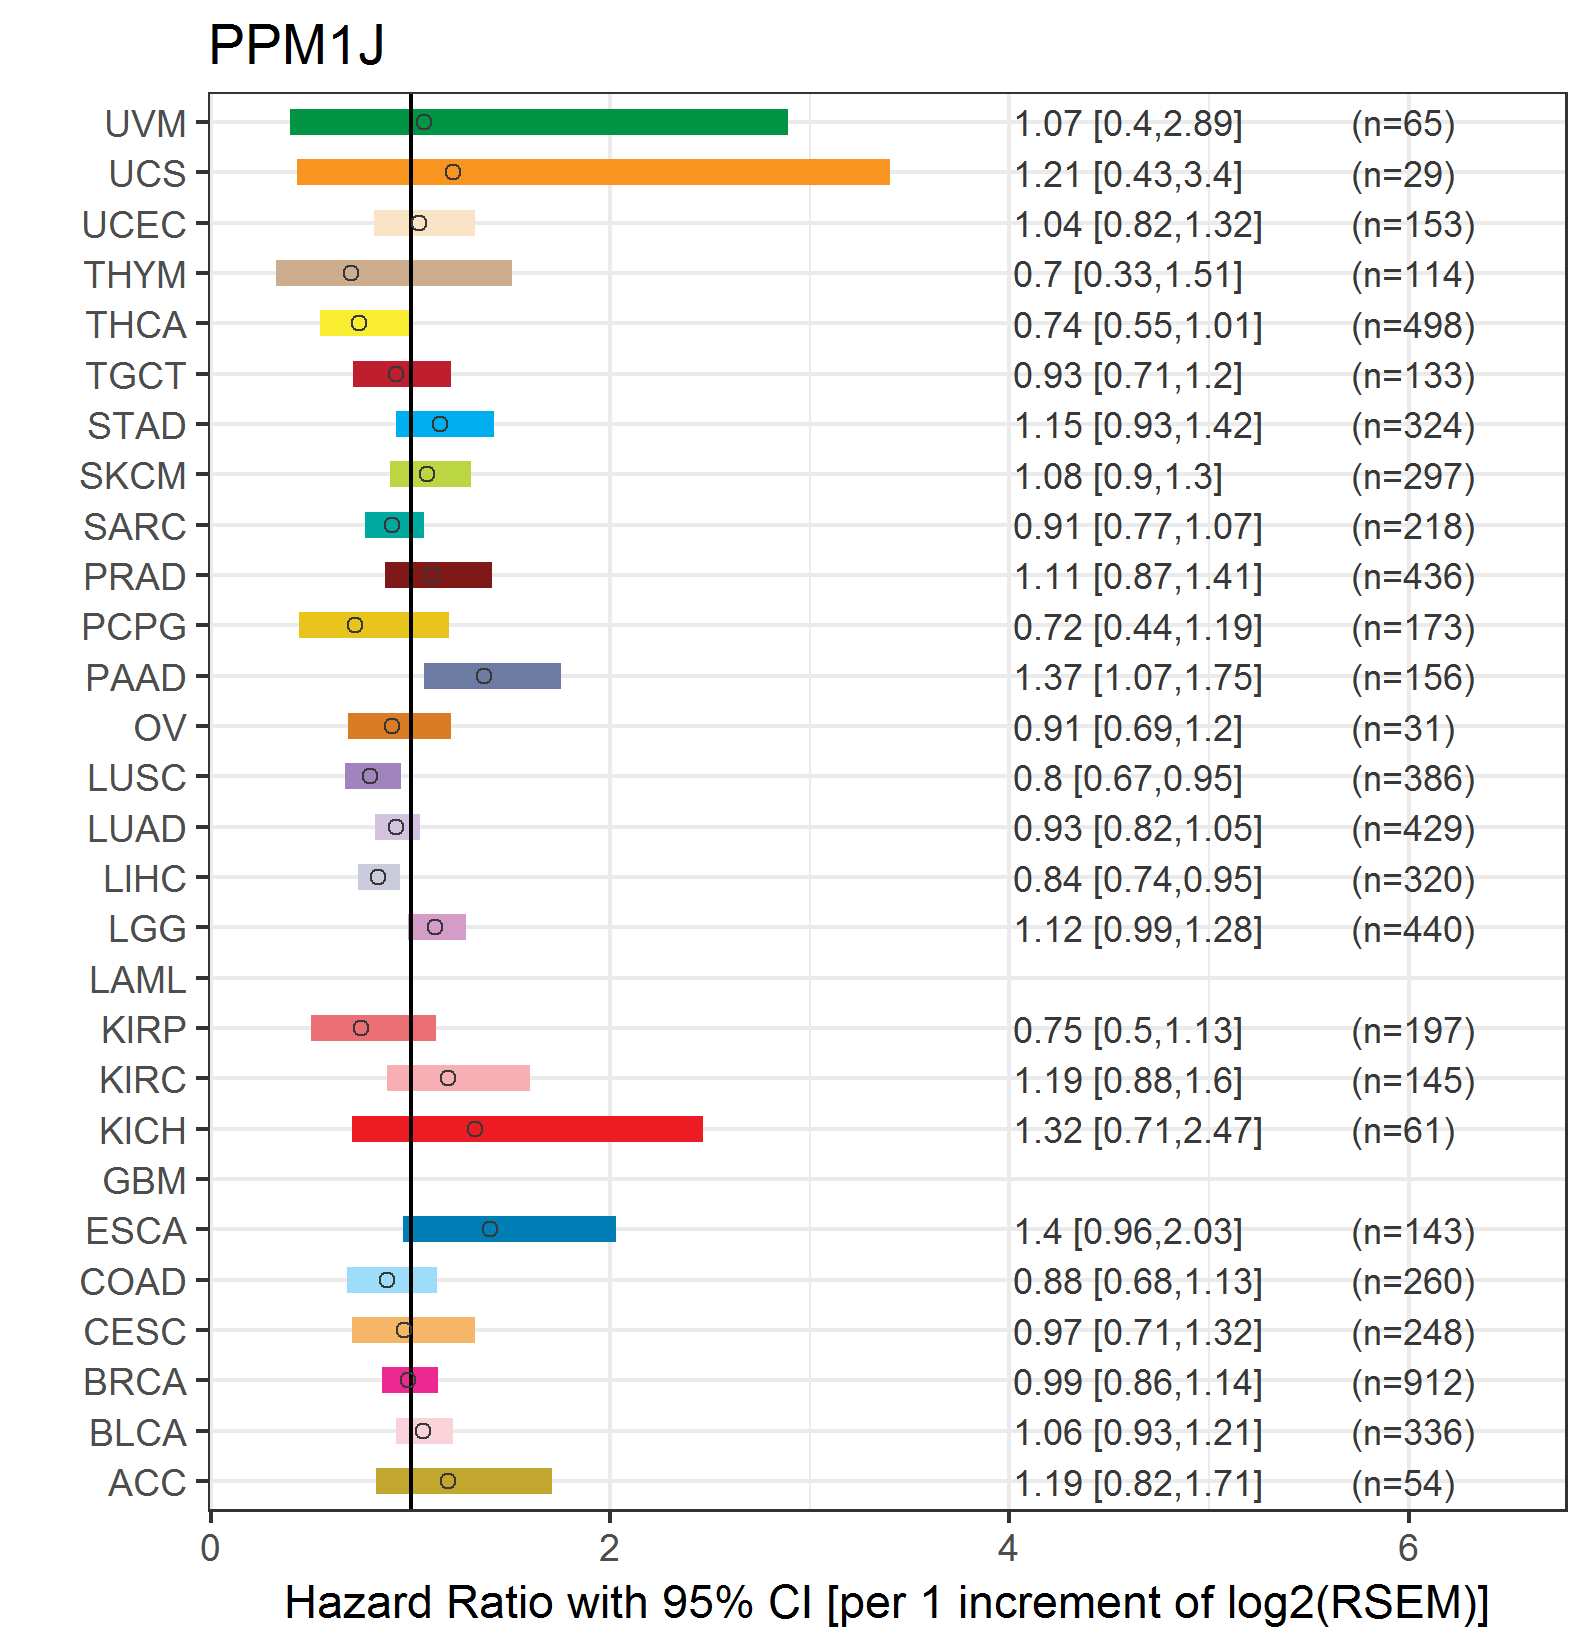
| Forest plot of Cox proportional hazard ratio (HR) and 95% CI of relapse free survival (RFS) using 28 cancer types (TCGA IlluminaHiSeq_RNASeqV2, pan-cancer normalized log2(norm_counts+1) data, version 2016-08-16) (TCGA clinicalMatrix, phenotype data, version 2016-04-27) * Click on the image enlarge it in a new window. |
 |
| Top |
| TissGeneClin for PPM1J |
| TissGeneDrug for PPM1J |
| Drug information targeting TissGene (DrugBank Version 5.0.6, 2017-04-01) |
| DrugBank ID | Drug name | Drug activity | Drug type | Drug status |
| Top |
| TissGeneDisease for PPM1J |
| Disease information associated with TissGene (DisGeNet, 2016-06-01) |
| Disease ID | Disease name | # pubmeds | Source |
| umls:C0040336 | Tobacco Use Disorder | 1 | GAD |
|
Copyright 2016-Present - The University of Texas Health Science Center at Houston (UTHealth) Web File Viewing | How to Report, Fraud, Waste and Abuse | State of Texas | Statewide Search | Texas Homeland Security | Site Policies |