 |
| |
| |
| |
| |
| |
| |
|

| TissGeneSummary for GPIHBP1 |
 Gene summary Gene summary |
| Basic gene information | Gene symbol | GPIHBP1 |
| Gene name | glycosylphosphatidylinositol anchored high density lipoprotein binding protein 1 | |
| Synonyms | GPI-HBP1|HYPL1D | |
| Cytomap | UCSC genome browser: 8q24.3 | |
| Type of gene | protein-coding | |
| RefGenes | NM_001301772.1, NM_178172.5, | |
| Description | GPI anchored high density lipoprotein binding protein 1GPI-anchored HDL-binding protein 1endothelial cell LPL transporterglycosylphosphatidylinositol-anchored high density lipoprotein-binding protein 1 | |
| Modification date | 20141222 | |
| dbXrefs | MIM : 612757 | |
| HGNC : HGNC | ||
| Ensembl : ENSG00000277494 | ||
| HPRD : 17347 | ||
| Vega : OTTHUMG00000164950 | ||
| Protein | UniProt: go to UniProt's Cross Reference DB Table | |
| Expression | CleanEX: HS_GPIHBP1 | |
| BioGPS: 338328 | ||
| Pathway | NCI Pathway Interaction Database: GPIHBP1 | |
| KEGG: GPIHBP1 | ||
| REACTOME: GPIHBP1 | ||
| Pathway Commons: GPIHBP1 | ||
| Context | iHOP: GPIHBP1 | |
| ligand binding site mutation search in PubMed: GPIHBP1 | ||
| UCL Cancer Institute: GPIHBP1 | ||
| Assigned class in TissGDB* | C | |
| Included tissue-specific gene expression resources | TiGER,GTEx | |
| Specific-tissues in normal samples (assigned by TissGDB using HPA, TiGER, and GTEx) | BreastLung | |
| Cancer types related to the specific-tissues in cancer samples (assigned by TissGDB using TCGA) | BRCALUAD,LUSC | |
| Reference showing the relevant tissue of GPIHBP1 | ||
| Description by TissGene annotations | ||
| * Class A consists of genes with literature evidence and is part of the cTissGenes. Class B consists of only cTissGenes without additional evidence. The remaining genes belong to Class C. |
| Gene ontology having evidence of Inferred from Direct Assay (IDA) from Entrez |
| GO ID | GO term | PubMed ID |
| Top |
| TissGeneExp for GPIHBP1 |
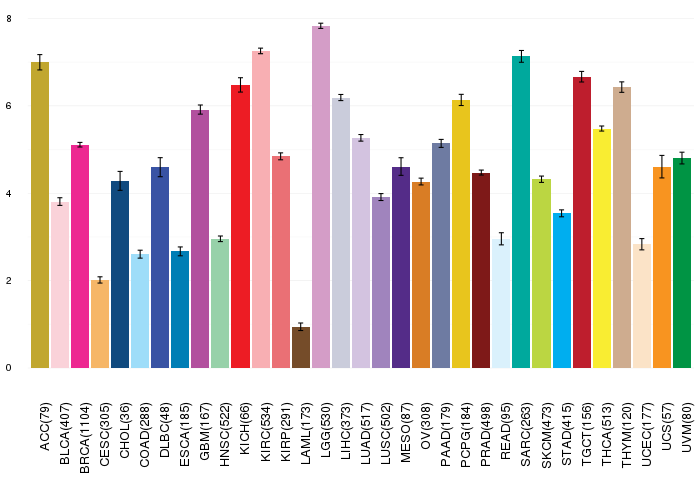
| Gene expressions across 28 cancer types (X-axis: cancer type and Y-axis: log2(norm_counts+1)) (TCGA IlluminaHiSeq_RNASeqV2, pan-cancer normalized log2(norm_counts+1) data, version 2016-08-16) |
 |
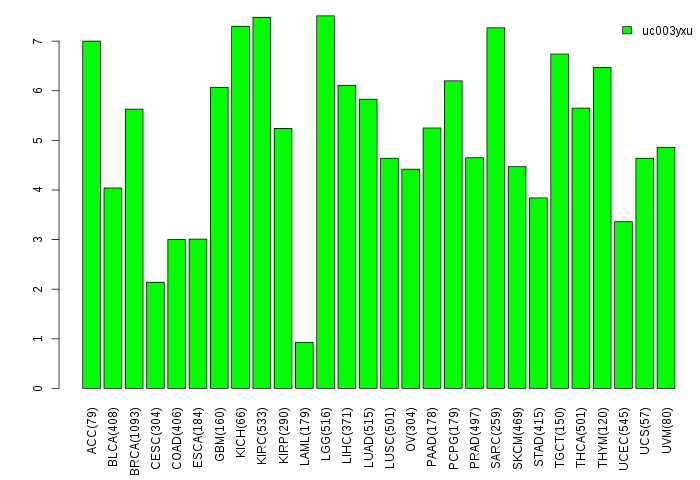
| Gene isoform expressions across 28 cancer types (X-axis: cancer type and Y-axis: log2(norm_counts+1)) (TCGA pan-cancer tcga_rsem_isoform_tpm, version 2016-09-01) |
 |
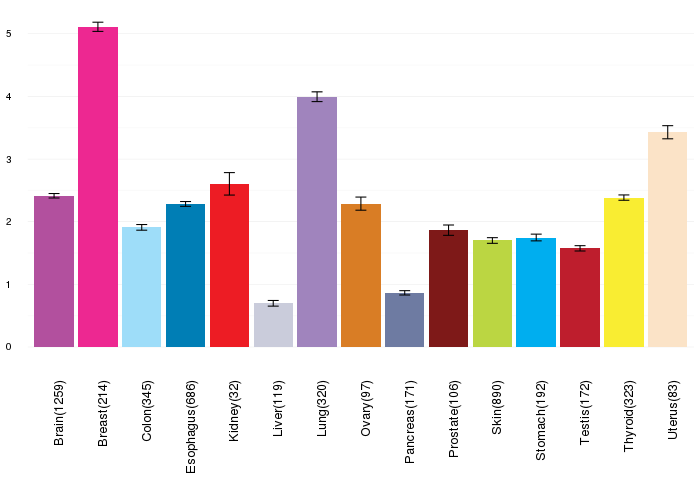
| Gene expressions across normal tissues of GTEx data (GTEx GTEx_Analysis_v6_RNA-seq_RNA-SeQCv1.1.8_gene_rpkm.gct) - Here, we shows the matched tissue types only among our 28 cancer types. |
 |
| Different expressions across 14 cancer types with more than 10 samples between matched tumors and normals (X-axis: cancer type and Y-axis: log2(norm_counts+1)) (TCGA IlluminaHiSeq_RNASeqV2, pan-cancer normalized log2(norm_counts+1) data, version 2016-08-16) |
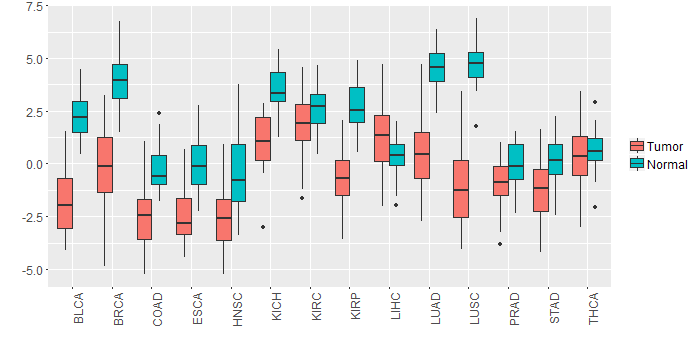 |
| - Significantly differentially expressed cancer types and information. (|Fold change|>1 and FDR<0.05) |
| Cancer type | Mean(exp) in tumor | Mean(exp) in matched normal | Log2FC | P-val. | FDR |
| BLCA | -1.767914155 | 2.226749003 | -3.994663158 | 3.95E-10 | 7.99E-08 |
| KICH | 1.040049845 | 3.546721845 | -2.506672 | 1.27E-09 | 7.75E-09 |
| LUSC | -1.077137685 | 4.770301531 | -5.847439216 | 1.07E-31 | 6.51E-30 |
| COAD | -2.441283386 | -0.258514155 | -2.182769231 | 1.15E-06 | 6.43E-06 |
| BRCA | -0.141099243 | 3.927456897 | -4.06855614 | 5.64E-51 | 4.24E-49 |
| HNSC | -2.558018806 | -0.277100202 | -2.280918605 | 2.48E-08 | 2.71E-07 |
| LUAD | 0.418765155 | 4.554263431 | -4.135498276 | 1.41E-30 | 2.11E-28 |
| KIRP | -0.663089155 | 2.73933897 | -3.402428125 | 3.10E-17 | 1.31E-15 |
| ESCA | -2.454286883 | -0.003550519 | -2.450736364 | 0.000813 | 0.012733183 |
| STAD | -1.254701655 | 0.169573345 | -1.424275 | 5.74E-05 | 0.000485311 |
| Top |
| TissGene-miRNA for GPIHBP1 |
| Significantly anti-correlated miRNAs of TissGene across 28 cancer types (Gene-miRNA relations from TargetScanHuman Relsease 7.1, Conserved_Site_Context_Scores.txt.zip, 06.01.2016) (TCGA IlluminaHiSeq_miRNASeq, log2(RPM+1) data, version 2016-11-21) (TCGA IlluminaHiSeq_RNASeqV2, log2(normalized_count+1) data, version 2016-08-16) (Spearman’s Rank Correlation (p-value<0.05 and coefficient<-0.25)) |
| Cancer type | miRNA id | miRNA accession | P-val. | Coeff. | # samples |
| Top |
| TissGeneMut for GPIHBP1 |
| TissGeneSNV for GPIHBP1 |
| nsSNV counts per each loci. Different colors of circles represent different cancer types. Circle size denotes number of samples. (TCGA somatic mutation (SNPs and small INDELs) data, version 2016-04-25) * Click on the image to enlarge it in a new window. |
 |
 |
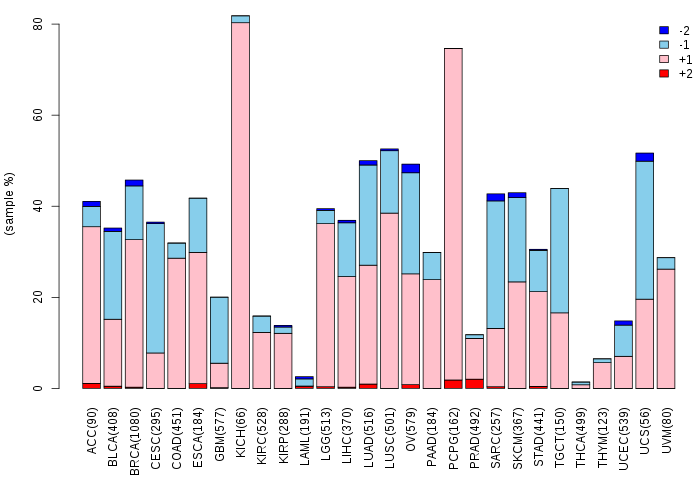
| Somatic nucleotide variants of TissGene across 28 cancer types (X-axis: cancer type and Y-axis: % of mutated samples) The numbers in parentheses are numbers of samples with mutation (nsSNVs). (TCGA somatic mutation (SNPs and small INDELs) data, version 2016-04-25) |
 |
| - nsSNVs sorted by frequency. |
| AAchange | Cancer type | # samples |
| p.G153R | SKCM | 2 |
| p.R76S | LUAD | 1 |
| p.A3V | COAD | 1 |
| p.C136Y | HNSC | 1 |
| p.E43G | UCEC | 1 |
| p.A3V | UCEC | 1 |
| p.W141C | LUAD | 1 |
| p.T98N | LUAD | 1 |
| p.T127S | LIHC | 1 |
| p.E27G | LIHC | 1 |
| p.G151S | SKCM | 1 |
| p.P157L | SKCM | 1 |
| p.T150A | ESCA | 1 |
| p.E99K | STAD | 1 |
| p.E29Q | CESC | 1 |
| p.S161F | SKCM | 1 |
| p.C65Y | STAD | 1 |
| p.D30E | STAD | 1 |
| p.R145L | LUAD | 1 |
| p.S144F | BRCA | 1 |
| p.W141L | LUAD | 1 |
| p.D36H | BLCA | 1 |
| p.G156V | THYM | 1 |
| p.R64L | LIHC | 1 |
| Top |
| TissGeneCNV for GPIHBP1 |
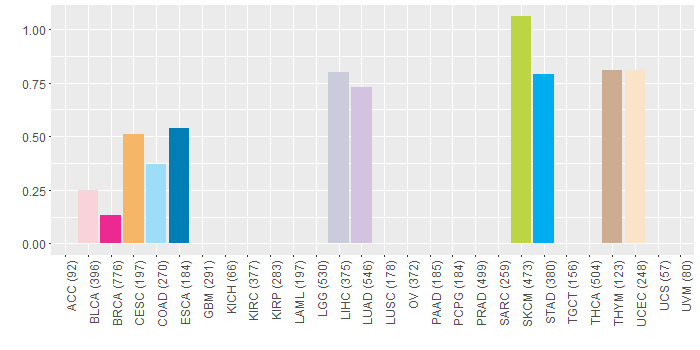
| Copy number variations of TissGene across 28 cancer types (X-axis: cancer type and Y-axis: % of CNV samples) (TCGA Gistic2_CopyNumber_Gistic2_all_data_by_genes, Gistic2 copy number data, version 2016-08-16) |
 |
| Top |
| TissGeneFusions for GPIHBP1 |
| Fusion genes including TissGene (ChimerDB 3.0, 2016-12-01 and TCGA fusion Portal 2015-12-01) |
| Database | Src | Cancer type | Sample | Fusion gene | ORF | 5'-gene BP | 3'-gene BP |
| Top |
| TissGeneNet for GPIHBP1 |
| Co-expressed gene networks based on protein-protein interaction data (CePIN) (TCGA IlluminaHiSeq_RNASeqV2, pan-cancer normalized log2(norm_counts+1) data, version 2016-08-16) (PINA2 ppi data) |
| Top |
| TissGeneProg for GPIHBP1 |
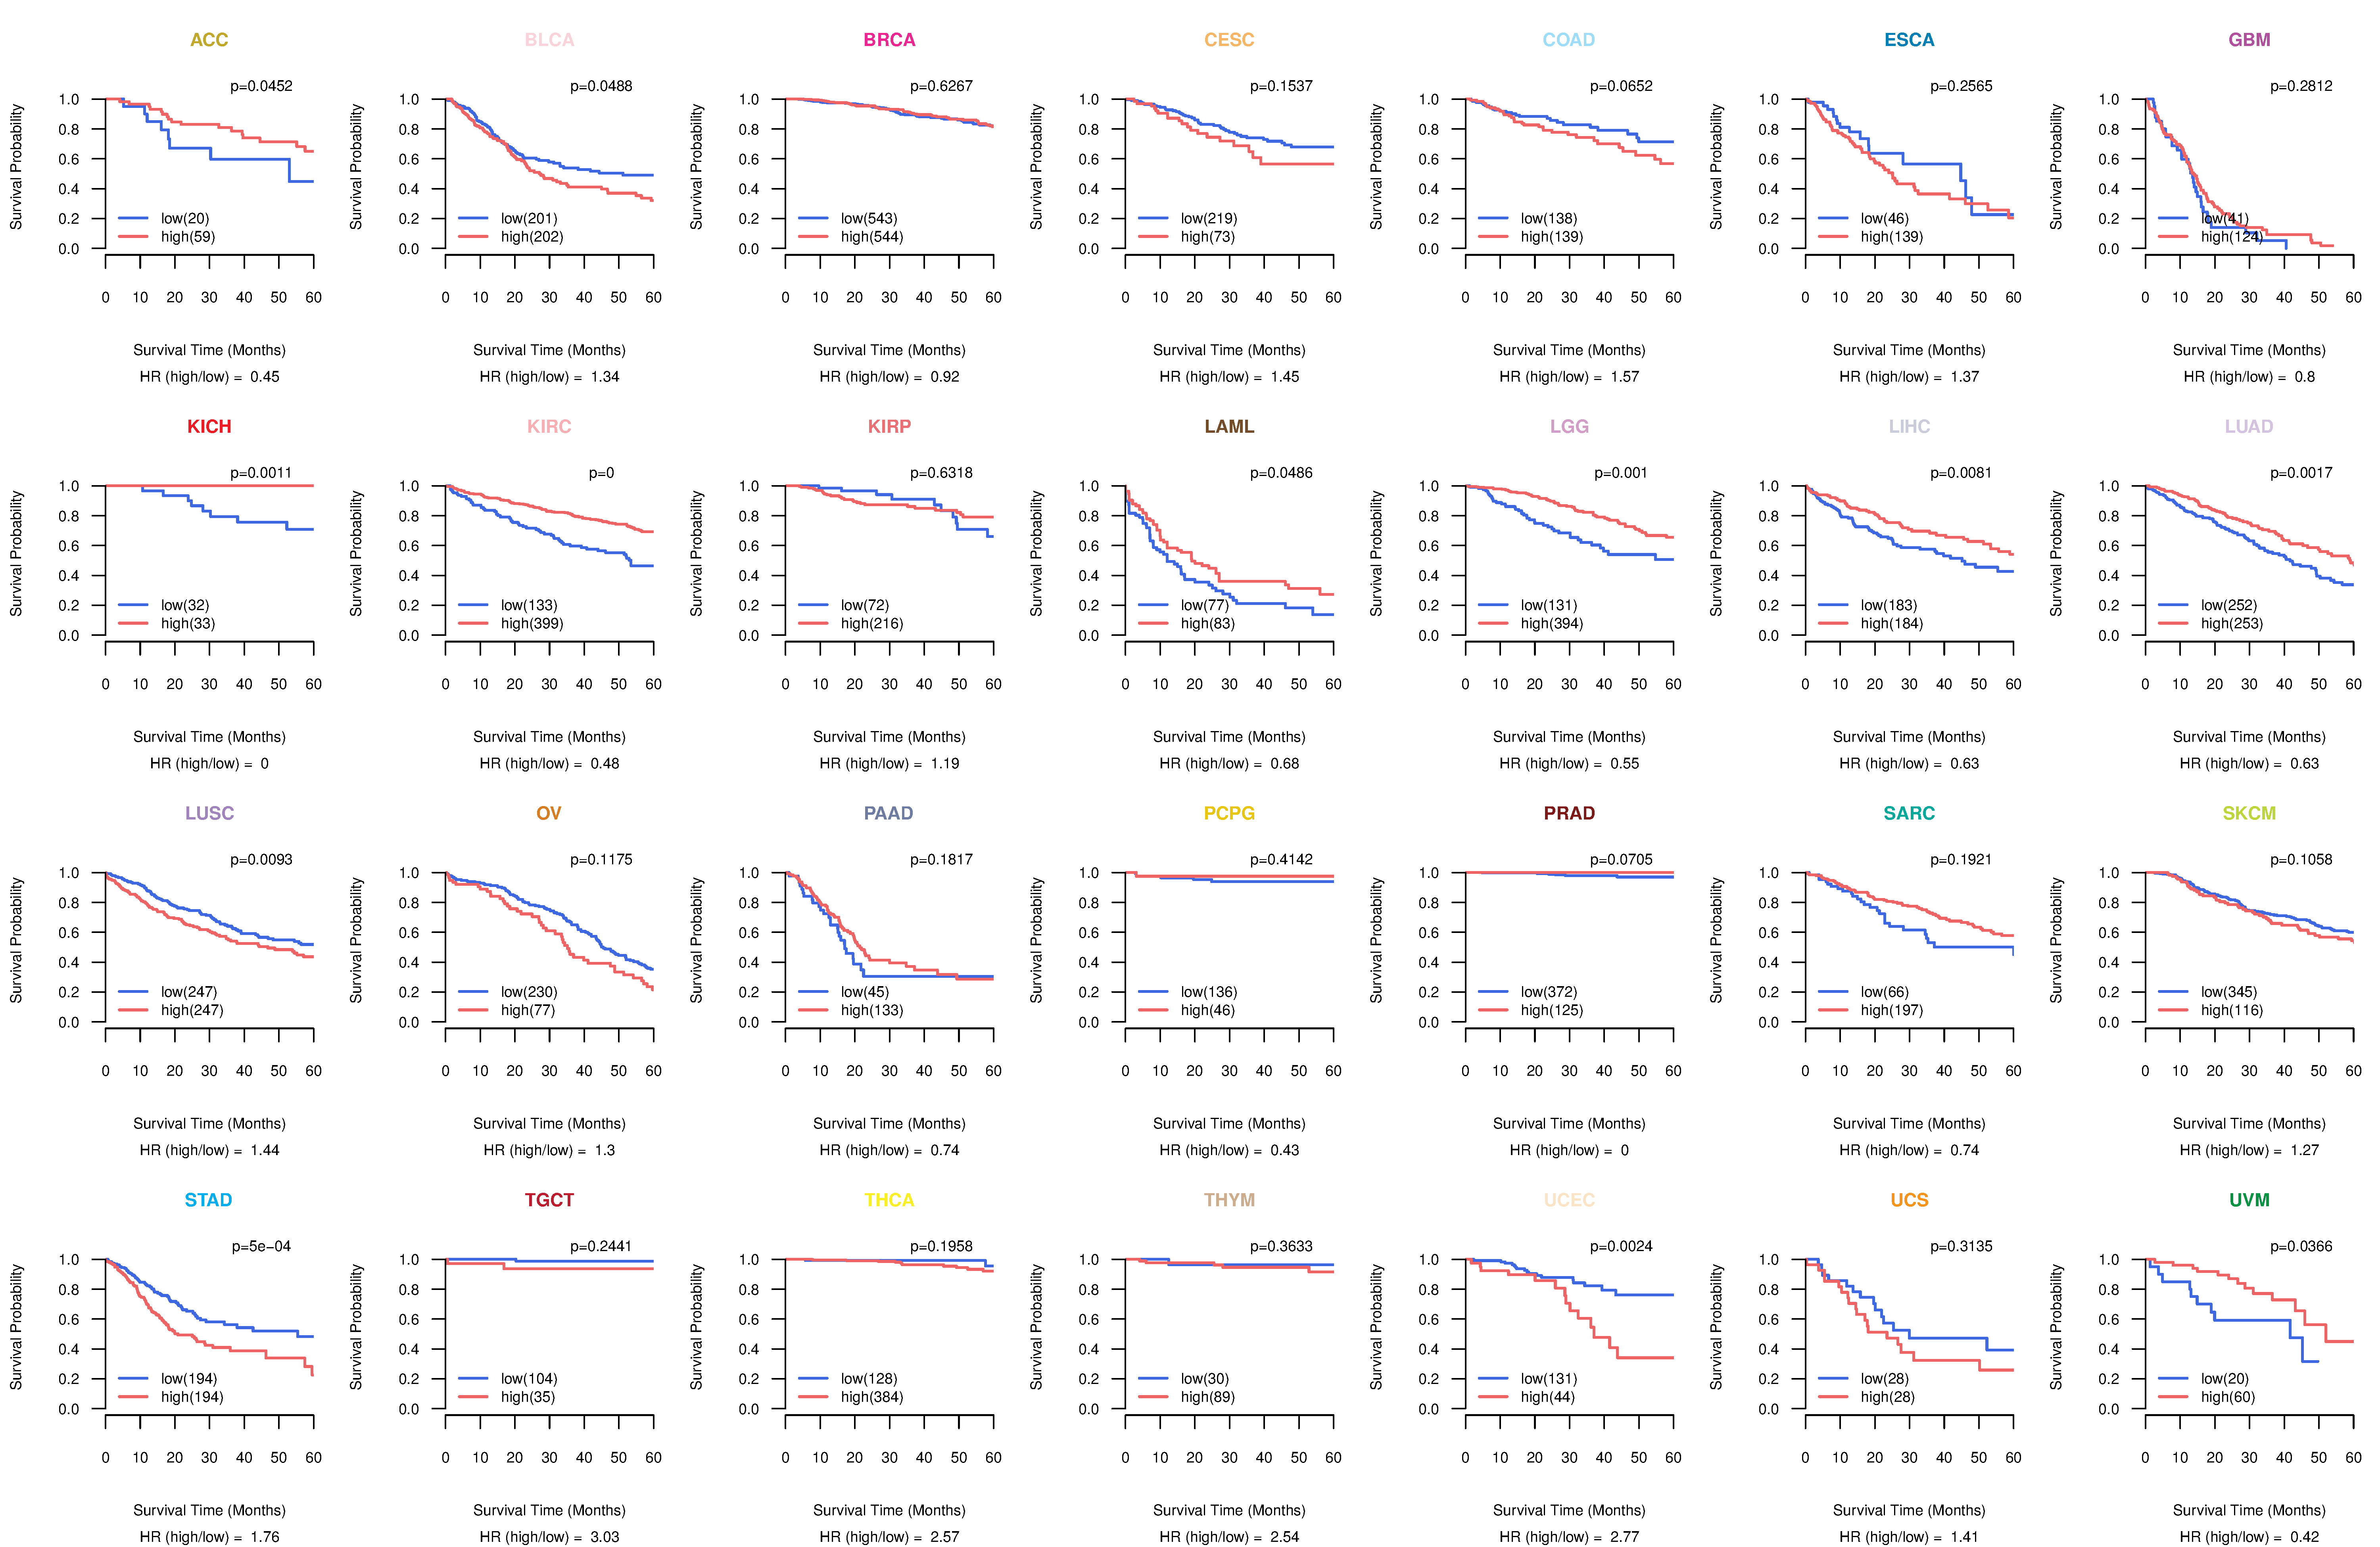
| Kaplan-Meier plots with logrank tests of overall survival (OS) using 28 cancer types (TCGA IlluminaHiSeq_RNASeqV2, pan-cancer normalized log2(norm_counts+1) data, version 2016-08-16) (TCGA clinicalMatrix, phenotype data, version 2016-04-27) * Click on the image to enlarge it in a new window. |
 |
| Kaplan-Meier plots with logrank test of relapse free survival (RFS) using 28 cancer types (TCGA IlluminaHiSeq_RNASeqV2, pan-cancer normalized log2(norm_counts+1) data, version 2016-08-16) (TCGA clinicalMatrix, phenotype data, version 2016-04-27) * Click on the image enlarge it in a new window. |
 |
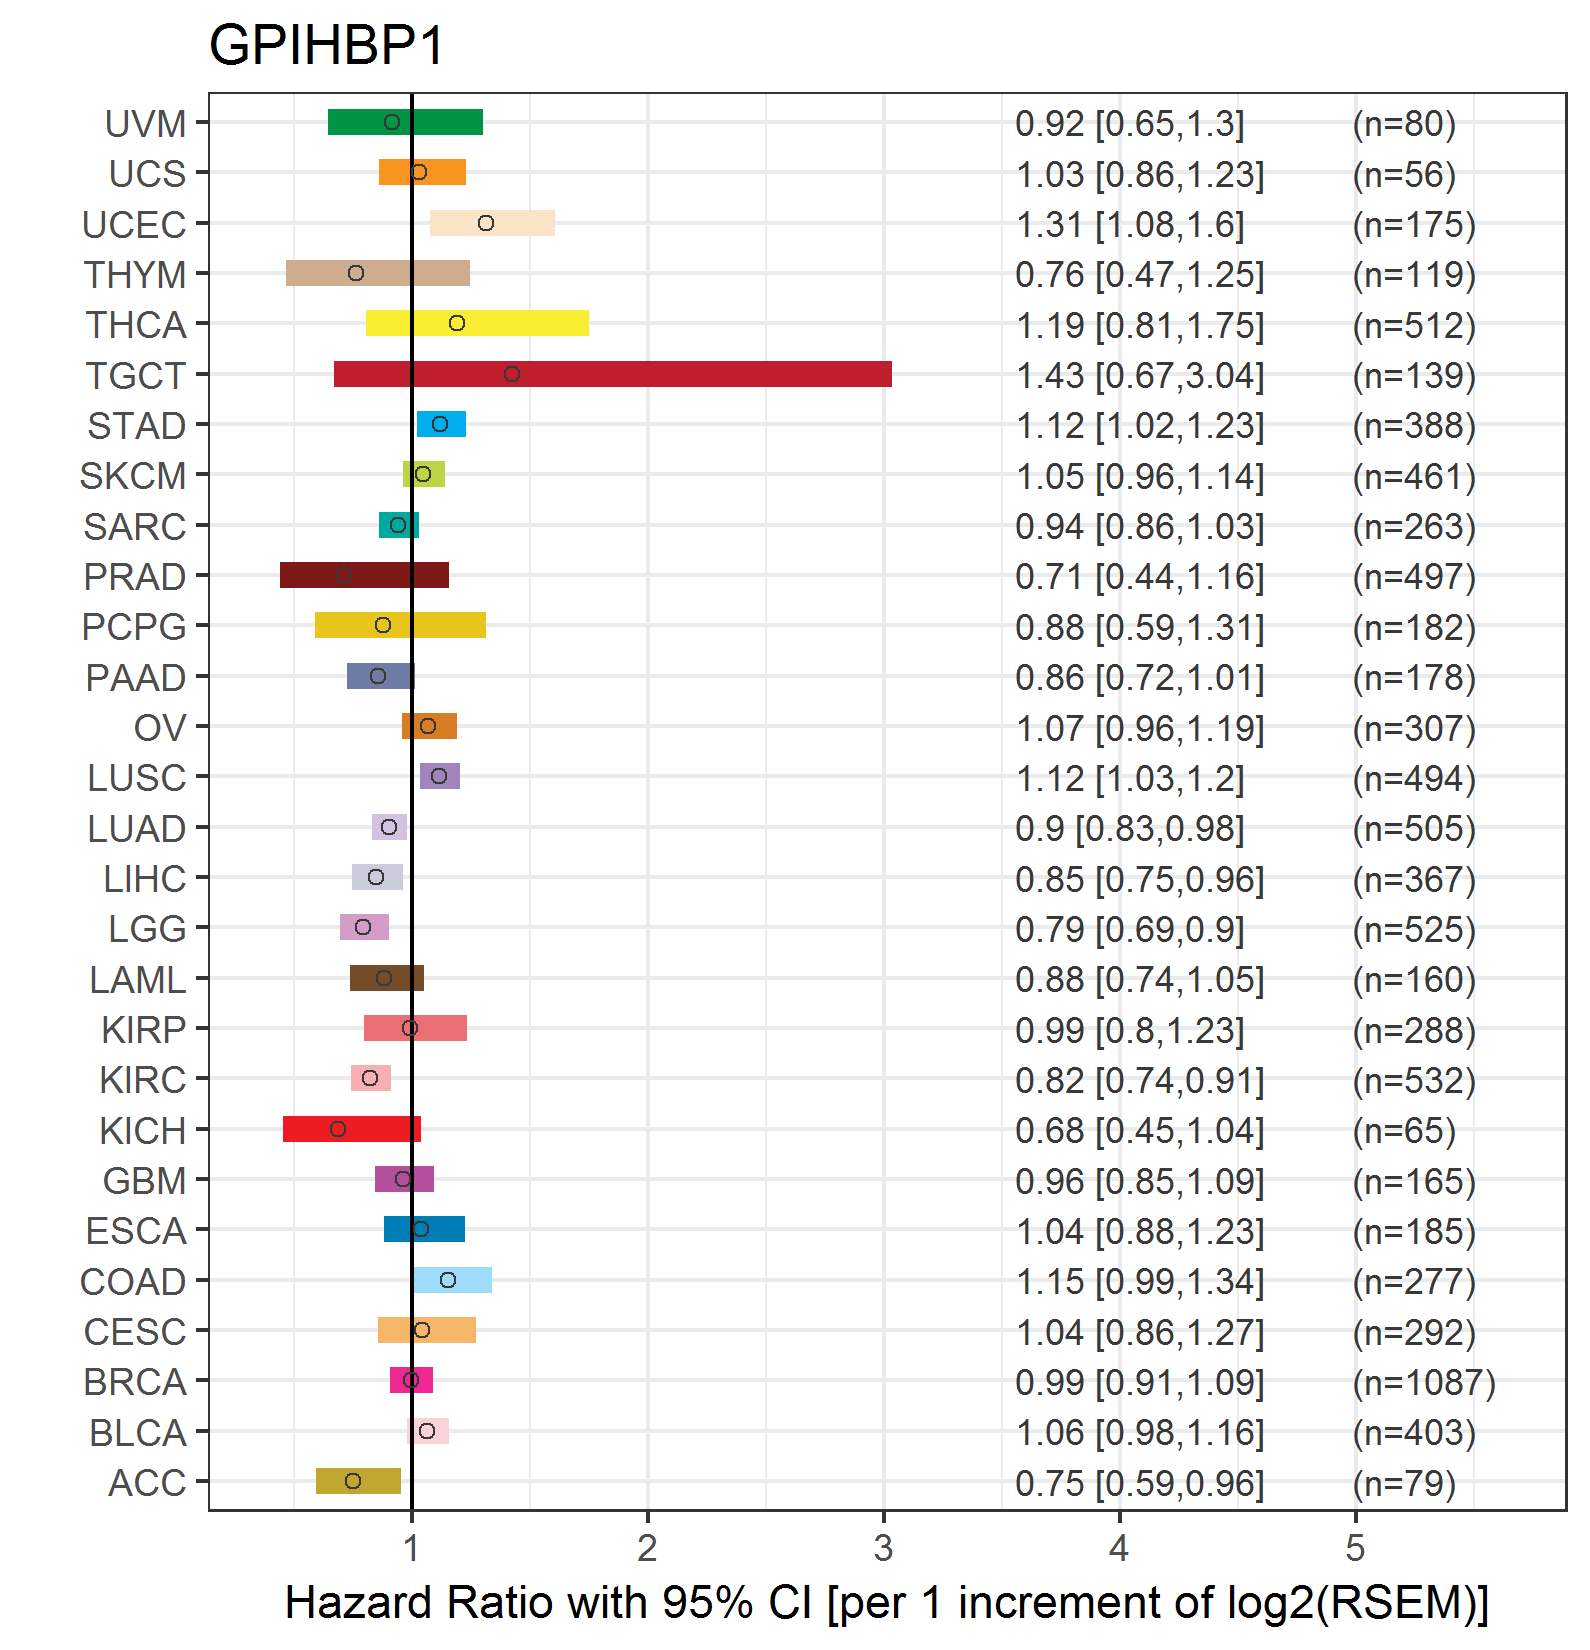
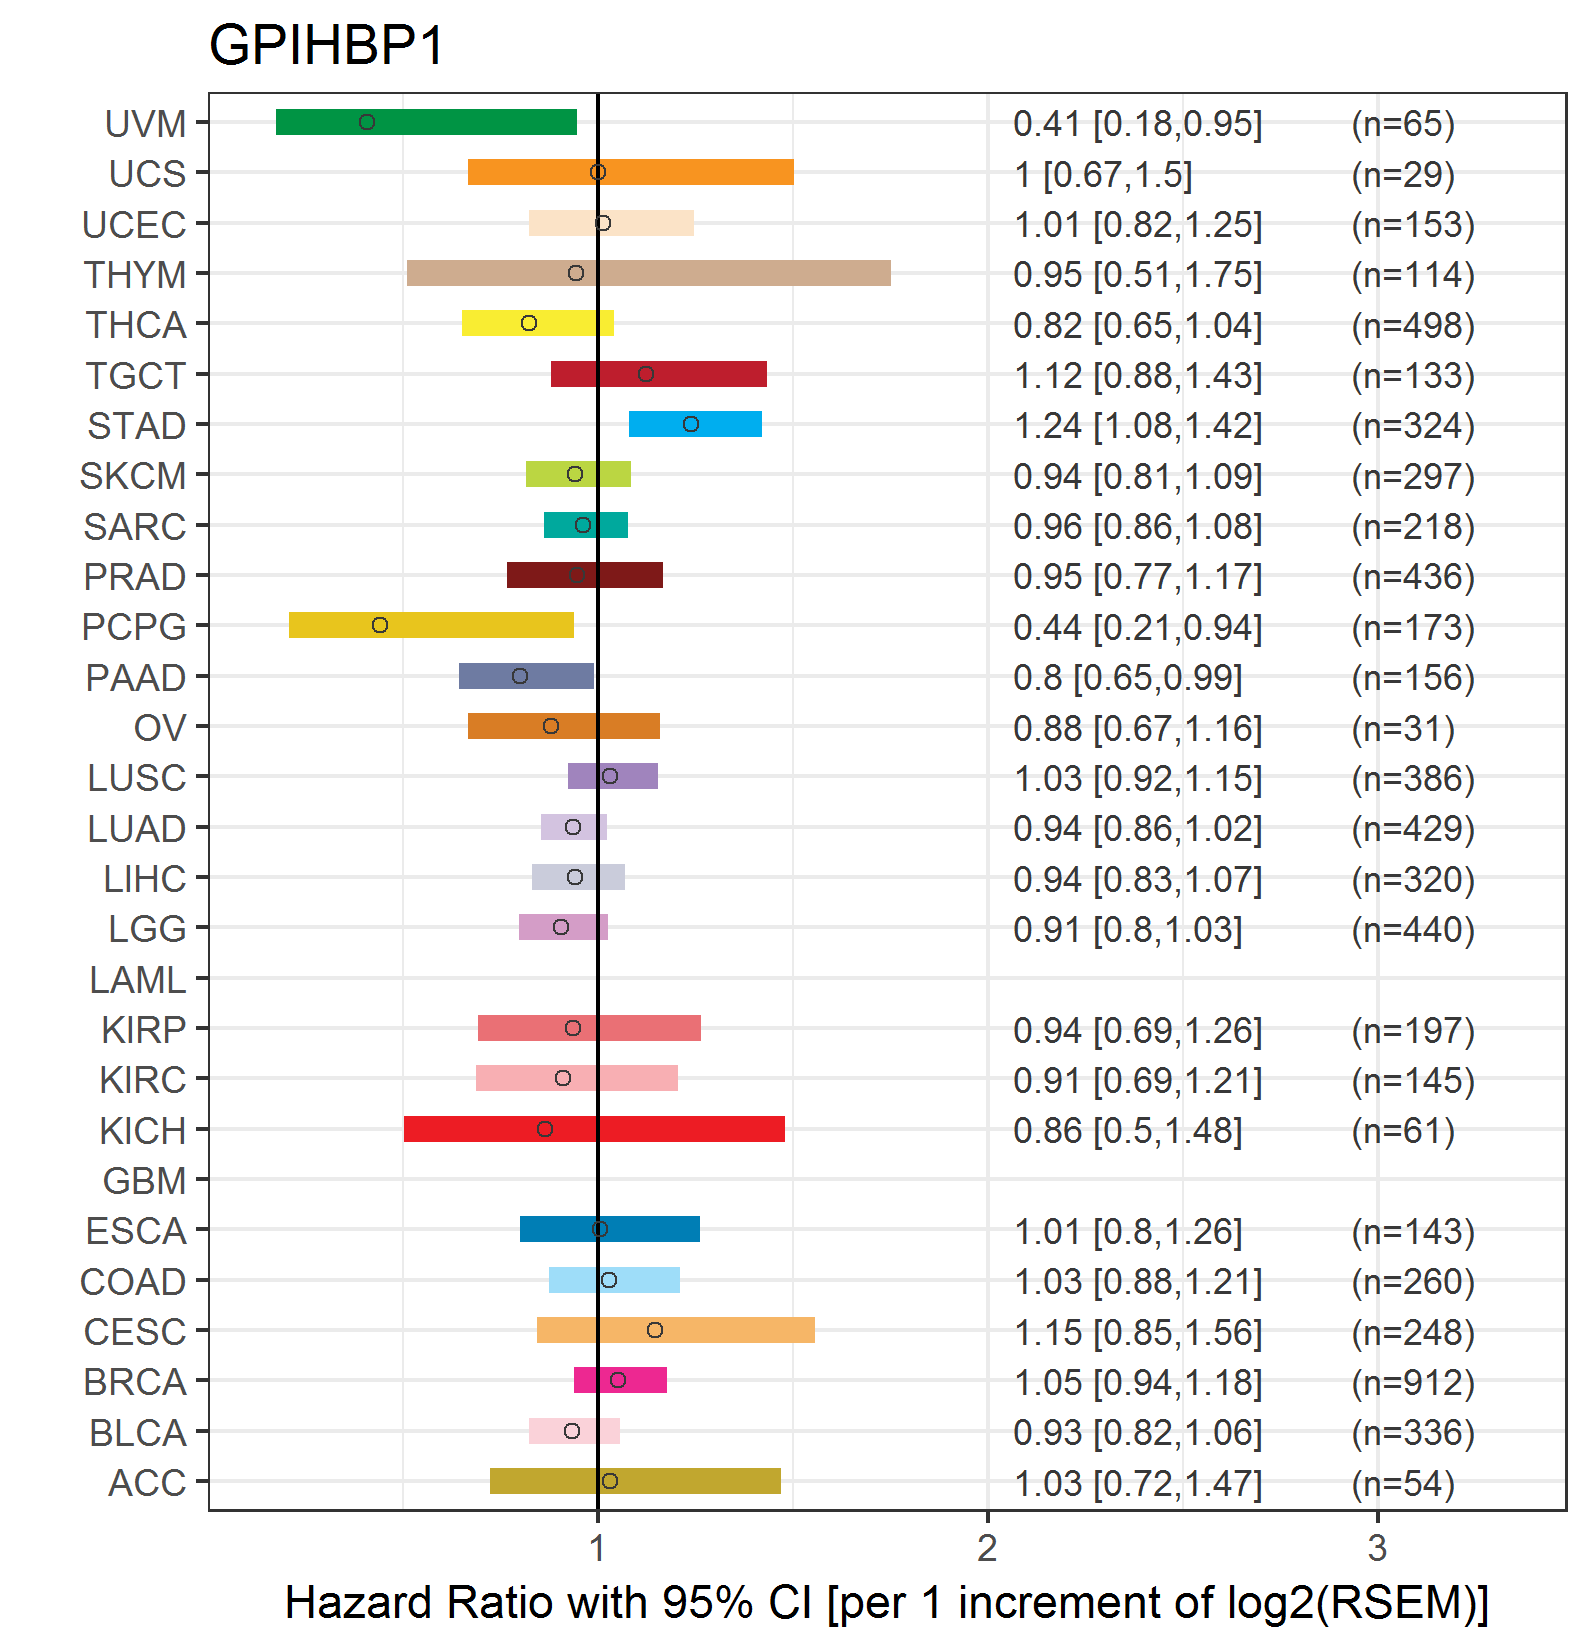
| Forest plot of Cox proportional hazard ratio (HR) and 95% CI of overall survival (OS) using 28 cancer types (TCGA IlluminaHiSeq_RNASeqV2, pan-cancer normalized log2(norm_counts+1) data, version 2016-08-16) (TCGA clinicalMatrix, phenotype data, version 2016-04-27) * Click on the image enlarge it in a new window. |
 |
| Forest plot of Cox proportional hazard ratio (HR) and 95% CI of relapse free survival (RFS) using 28 cancer types (TCGA IlluminaHiSeq_RNASeqV2, pan-cancer normalized log2(norm_counts+1) data, version 2016-08-16) (TCGA clinicalMatrix, phenotype data, version 2016-04-27) * Click on the image enlarge it in a new window. |
 |
| Top |
| TissGeneClin for GPIHBP1 |
| TissGeneDrug for GPIHBP1 |
| Drug information targeting TissGene (DrugBank Version 5.0.6, 2017-04-01) |
| DrugBank ID | Drug name | Drug activity | Drug type | Drug status |
| Top |
| TissGeneDisease for GPIHBP1 |
| Disease information associated with TissGene (DisGeNet, 2016-06-01) |
| Disease ID | Disease name | # pubmeds | Source |
| umls:C0023817 | Hyperlipoproteinemia Type I | 7 | BeFree |
| umls:C4014767 | HYPERLIPOPROTEINEMIA, TYPE ID | 3 | UNIPROT |
| umls:C0006142 | Malignant neoplasm of breast | 2 | BeFree |
| umls:C0678222 | Breast Carcinoma | 2 | BeFree |
| umls:C0003850 | Arteriosclerosis | 1 | BeFree |
| umls:C0004153 | Atherosclerosis | 1 | BeFree |
| umls:C0007131 | Non-Small Cell Lung Carcinoma | 1 | BeFree |
| umls:C0011847 | Diabetes | 1 | BeFree |
| umls:C0011849 | Diabetes Mellitus | 1 | BeFree |
| umls:C0020557 | Hypertriglyceridemia | 1 | LHGDN |
| umls:C0029408 | Degenerative polyarthritis | 1 | BeFree |
| umls:C0029463 | Osteosarcoma | 1 | BeFree |
| umls:C0033578 | Prostatic Neoplasms | 1 | BeFree |
| umls:C0376358 | Malignant neoplasm of prostate | 1 | BeFree |
| umls:C0585442 | Osteosarcoma of bone | 1 | BeFree |
| umls:C0600139 | Prostate carcinoma | 1 | BeFree |
| umls:C0853879 | Invasive breast carcinoma | 1 | BeFree |
| umls:C2931862 | Familial hyperchylomicronemia syndrome | 1 | BeFree |
| umls:C0020481 | Hyperlipoproteinemia Type V | 0 | ORPHANET |
|
Copyright 2016-Present - The University of Texas Health Science Center at Houston (UTHealth) Web File Viewing | How to Report, Fraud, Waste and Abuse | State of Texas | Statewide Search | Texas Homeland Security | Site Policies |