 |
| |
| |
| |
| |
| |
| |
|

| TissGeneSummary for VSIG1 |
 Gene summary Gene summary |
| Basic gene information | Gene symbol | VSIG1 |
| Gene name | V-set and immunoglobulin domain containing 1 | |
| Synonyms | 1700062D20Rik|GPA34|dJ889N15.1 | |
| Cytomap | UCSC genome browser: Xq22.3 | |
| Type of gene | protein-coding | |
| RefGenes | NM_001170553.1, NM_182607.4, | |
| Description | V-set and immunoglobulin domain-containing protein 1cell surface A33 antigenglycoprotein A34 | |
| Modification date | 20141207 | |
| dbXrefs | MIM : 300620 | |
| HGNC : HGNC | ||
| Ensembl : ENSG00000101842 | ||
| HPRD : 06655 | ||
| Vega : OTTHUMG00000022175 | ||
| Protein | UniProt: go to UniProt's Cross Reference DB Table | |
| Expression | CleanEX: HS_VSIG1 | |
| BioGPS: 340547 | ||
| Pathway | NCI Pathway Interaction Database: VSIG1 | |
| KEGG: VSIG1 | ||
| REACTOME: VSIG1 | ||
| Pathway Commons: VSIG1 | ||
| Context | iHOP: VSIG1 | |
| ligand binding site mutation search in PubMed: VSIG1 | ||
| UCL Cancer Institute: VSIG1 | ||
| Assigned class in TissGDB* | C | |
| Included tissue-specific gene expression resources | TiGER,GTEx | |
| Specific-tissues in normal samples (assigned by TissGDB using HPA, TiGER, and GTEx) | StomachTestis | |
| Cancer types related to the specific-tissues in cancer samples (assigned by TissGDB using TCGA) | STADTGCT | |
| Reference showing the relevant tissue of VSIG1 | ||
| Description by TissGene annotations | ||
| * Class A consists of genes with literature evidence and is part of the cTissGenes. Class B consists of only cTissGenes without additional evidence. The remaining genes belong to Class C. |
| Gene ontology having evidence of Inferred from Direct Assay (IDA) from Entrez |
| GO ID | GO term | PubMed ID |
| Top |
| TissGeneExp for VSIG1 |
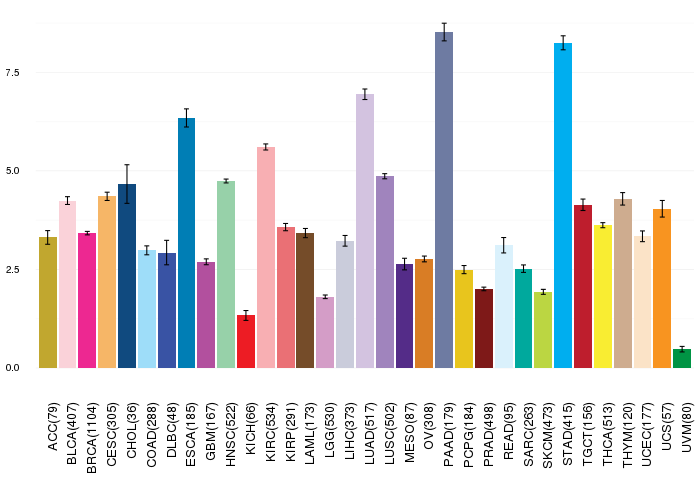
| Gene expressions across 28 cancer types (X-axis: cancer type and Y-axis: log2(norm_counts+1)) (TCGA IlluminaHiSeq_RNASeqV2, pan-cancer normalized log2(norm_counts+1) data, version 2016-08-16) |
 |
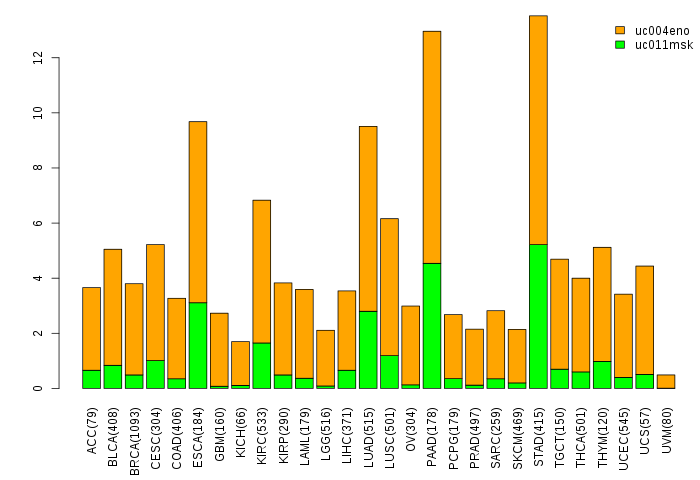
| Gene isoform expressions across 28 cancer types (X-axis: cancer type and Y-axis: log2(norm_counts+1)) (TCGA pan-cancer tcga_rsem_isoform_tpm, version 2016-09-01) |
 |
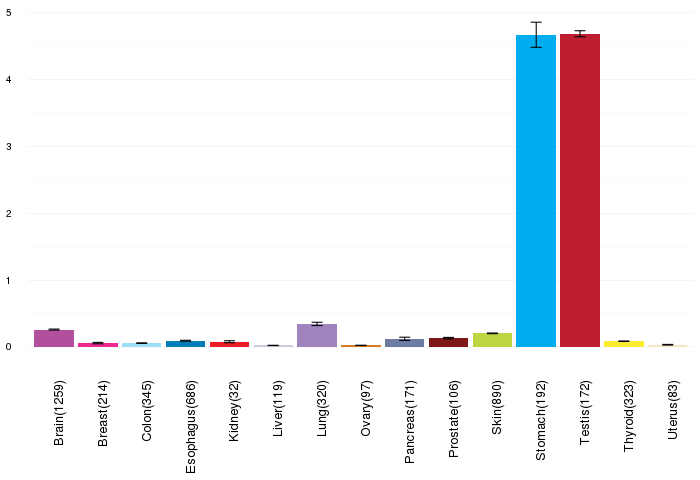
| Gene expressions across normal tissues of GTEx data (GTEx GTEx_Analysis_v6_RNA-seq_RNA-SeQCv1.1.8_gene_rpkm.gct) - Here, we shows the matched tissue types only among our 28 cancer types. |
 |
| Different expressions across 14 cancer types with more than 10 samples between matched tumors and normals (X-axis: cancer type and Y-axis: log2(norm_counts+1)) (TCGA IlluminaHiSeq_RNASeqV2, pan-cancer normalized log2(norm_counts+1) data, version 2016-08-16) |
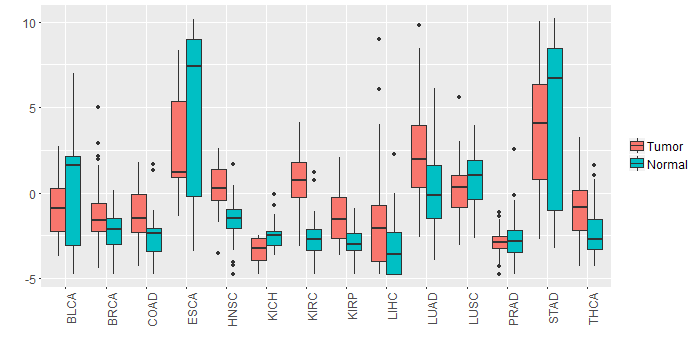 |
| - Significantly differentially expressed cancer types and information. (|Fold change|>1 and FDR<0.05) |
| Cancer type | Mean(exp) in tumor | Mean(exp) in matched normal | Log2FC | P-val. | FDR |
| LUAD | 2.259572561 | 0.177448423 | 2.082124138 | 2.51E-05 | 6.95E-05 |
| KIRP | -1.424578409 | -2.868475284 | 1.443896875 | 1.40E-05 | 5.66E-05 |
| HNSC | 0.383806402 | -1.537968016 | 1.921774419 | 2.36E-10 | 4.43E-09 |
| KIRC | 0.729346938 | -2.684397506 | 3.413744444 | 8.84E-31 | 1.82E-29 |
| THCA | -0.986103886 | -2.325341174 | 1.339237288 | 4.63E-06 | 1.58E-05 |
| COAD | -1.264233938 | -2.37954163 | 1.115307692 | 0.0151 | 0.031598949 |
| LIHC | -1.635253784 | -3.239317784 | 1.604064 | 0.002 | 0.005111623 |
| Top |
| TissGene-miRNA for VSIG1 |
| Significantly anti-correlated miRNAs of TissGene across 28 cancer types (Gene-miRNA relations from TargetScanHuman Relsease 7.1, Conserved_Site_Context_Scores.txt.zip, 06.01.2016) (TCGA IlluminaHiSeq_miRNASeq, log2(RPM+1) data, version 2016-11-21) (TCGA IlluminaHiSeq_RNASeqV2, log2(normalized_count+1) data, version 2016-08-16) (Spearman’s Rank Correlation (p-value<0.05 and coefficient<-0.25)) |
| Cancer type | miRNA id | miRNA accession | P-val. | Coeff. | # samples |
| Top |
| TissGeneMut for VSIG1 |
| TissGeneSNV for VSIG1 |
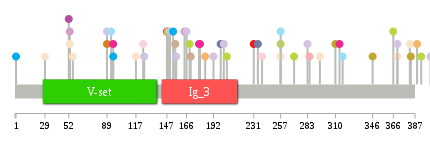
| nsSNV counts per each loci. Different colors of circles represent different cancer types. Circle size denotes number of samples. (TCGA somatic mutation (SNPs and small INDELs) data, version 2016-04-25) * Click on the image to enlarge it in a new window. |
 |
 |
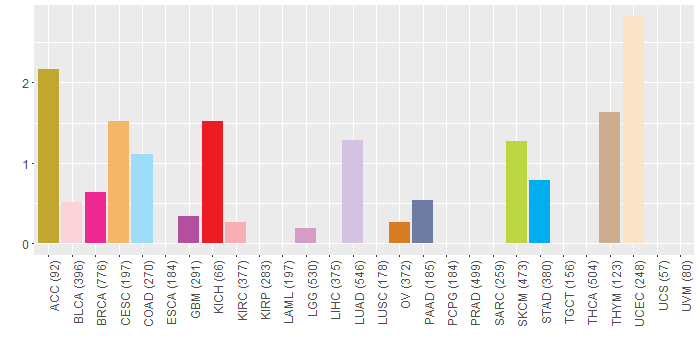
| Somatic nucleotide variants of TissGene across 28 cancer types (X-axis: cancer type and Y-axis: % of mutated samples) The numbers in parentheses are numbers of samples with mutation (nsSNVs). (TCGA somatic mutation (SNPs and small INDELs) data, version 2016-04-25) |
 |
| - nsSNVs sorted by frequency. |
| AAchange | Cancer type | # samples |
| p.M1L | STAD | 1 |
| p.D295Y | UCEC | 1 |
| p.S205F | SKCM | 1 |
| p.R89Q | LUAD | 1 |
| p.Q184H | CESC | 1 |
| p.G199E | PAAD | 1 |
| p.D124N | BLCA | 1 |
| p.N239H | BLCA | 1 |
| p.E294X | READ | 1 |
| p.I285F | KIRC | 1 |
| p.T346N | ACC | 1 |
| p.G235E | PAAD | 1 |
| p.A257T | UCEC | 1 |
| p.E383D | ACC | 1 |
| p.P370T | LUAD | 1 |
| p.E389K | CESC | 1 |
| p.E411Q | CESC | 1 |
| p.S56P | UCEC | 1 |
| p.S257F | SKCM | 1 |
| p.R125Q | LUAD | 1 |
| p.P370H | UCEC | 1 |
| p.V147I | BRCA | 1 |
| p.V170F | THYM | 1 |
| p.A274V | READ | 1 |
| p.E317X | COAD | 1 |
| p.A283T | LUAD | 1 |
| p.D95Y | BRCA | 1 |
| p.G29S | UCEC | 1 |
| p.A257T | COAD | 1 |
| p.G148E | SKCM | 1 |
| p.T314A | BRCA | 1 |
| p.G166* | LUAD | 1 |
| p.P231S | KICH | 1 |
| p.G202A | LUAD | 1 |
| p.S169F | SKCM | 1 |
| p.I382F | UCEC | 1 |
| p.D117N | UCEC | 1 |
| p.T93M | COAD | 1 |
| p.D153N | STAD | 1 |
| p.T192N | LUAD | 1 |
| p.G179R | BRCA | 1 |
| p.I42M | HNSC | 1 |
| p.N155I | THYM | 1 |
| p.D95N | STAD | 1 |
| p.T156N | LUAD | 1 |
| p.E178Q | BRCA | 1 |
| p.P370S | DLBC | 1 |
| p.E53* | LGG | 1 |
| p.T310N | ACC | 1 |
| p.P402L | LUAD | 1 |
| p.G270E | SKCM | 1 |
| p.V138M | HNSC | 1 |
| p.E53* | UCEC | 1 |
| p.Y150C | LUAD | 1 |
| p.E393K | SKCM | 1 |
| p.R52Q | GBM | 1 |
| p.P366L | SKCM | 1 |
| p.N164H | LGG | 1 |
| p.R89G | OV | 1 |
| Top |
| TissGeneCNV for VSIG1 |
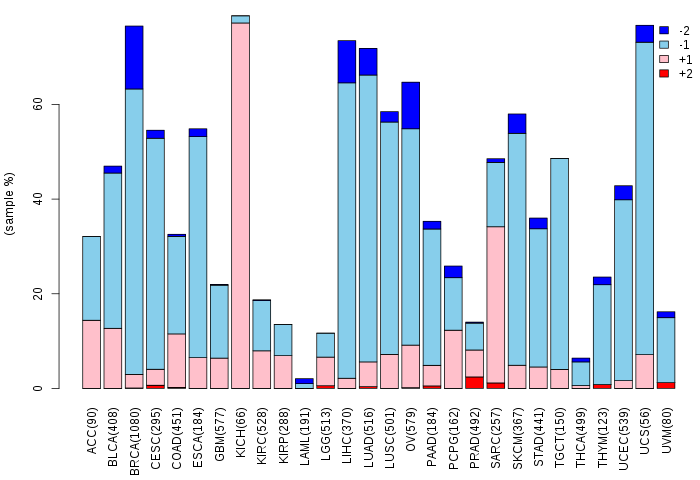
| Copy number variations of TissGene across 28 cancer types (X-axis: cancer type and Y-axis: % of CNV samples) (TCGA Gistic2_CopyNumber_Gistic2_all_data_by_genes, Gistic2 copy number data, version 2016-08-16) |
 |
| Top |
| TissGeneFusions for VSIG1 |
| Fusion genes including TissGene (ChimerDB 3.0, 2016-12-01 and TCGA fusion Portal 2015-12-01) |
| Database | Src | Cancer type | Sample | Fusion gene | ORF | 5'-gene BP | 3'-gene BP |
| Chimerdb3.0 | ChiTaRs | NA | BM823567 | VSIG1-RPS3 | chrX:107322131 | chr11:75110563 |
| Top |
| TissGeneNet for VSIG1 |
| Co-expressed gene networks based on protein-protein interaction data (CePIN) (TCGA IlluminaHiSeq_RNASeqV2, pan-cancer normalized log2(norm_counts+1) data, version 2016-08-16) (PINA2 ppi data) |
| Top |
| TissGeneProg for VSIG1 |
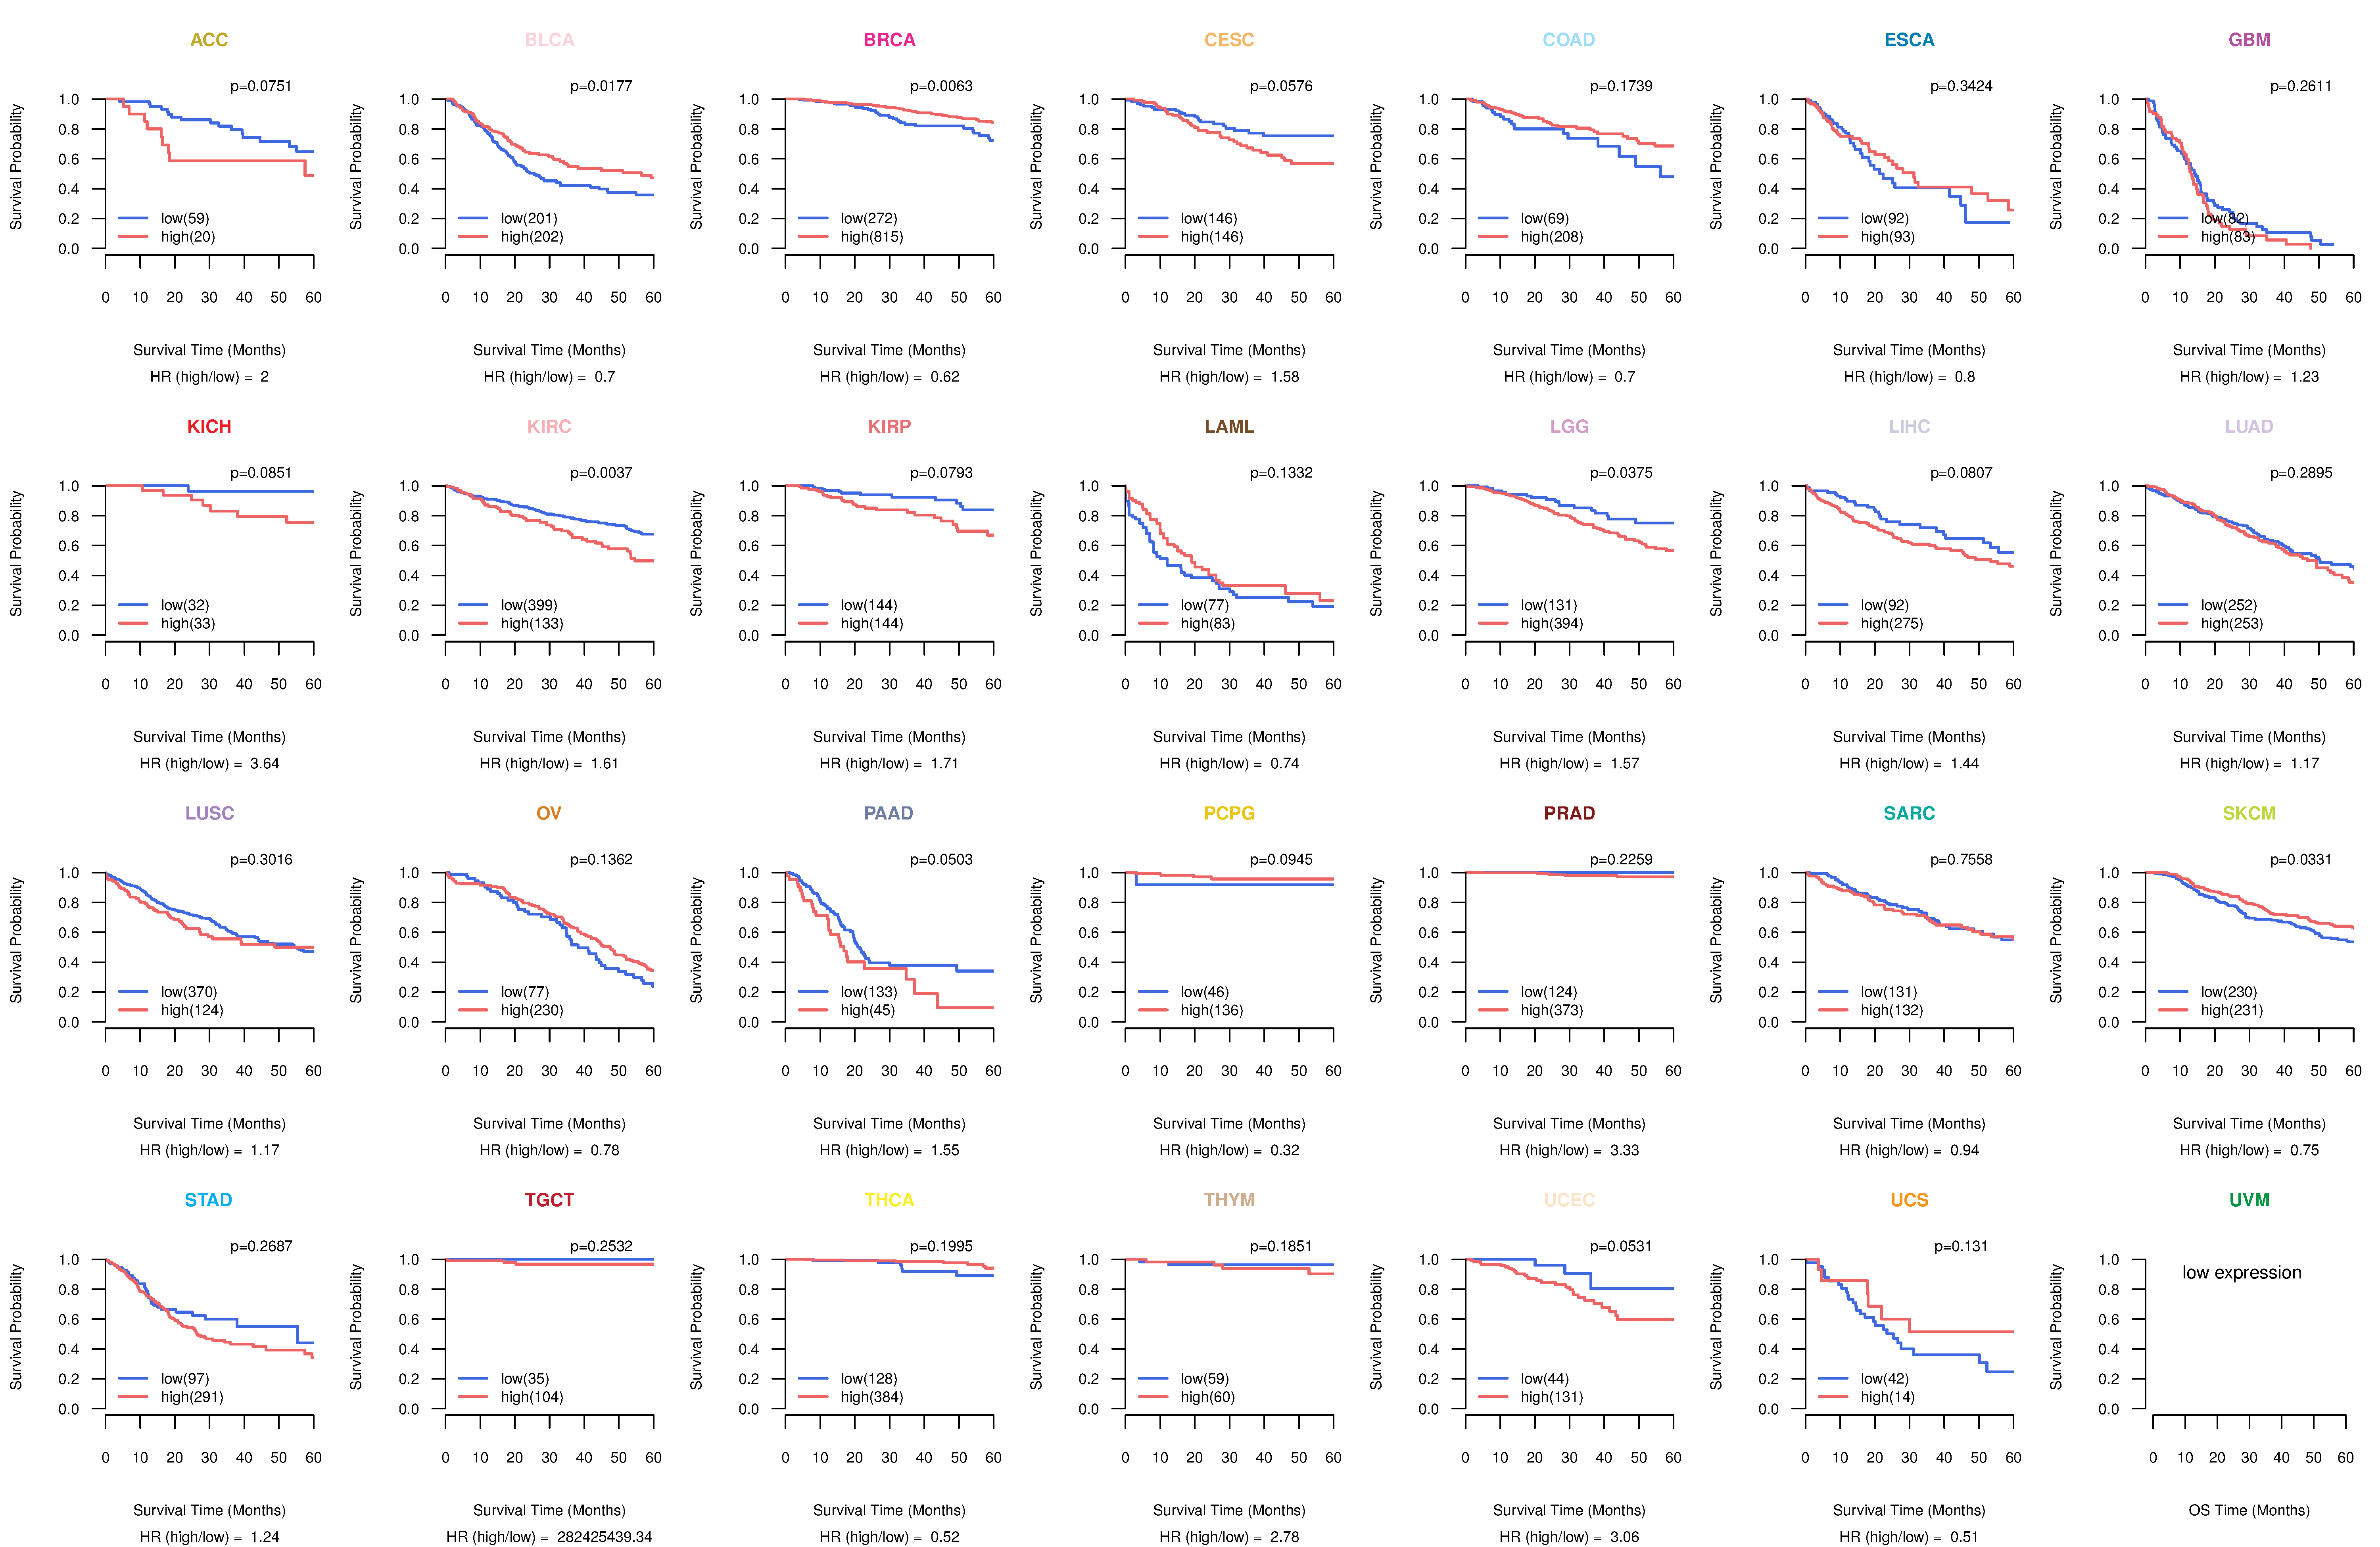
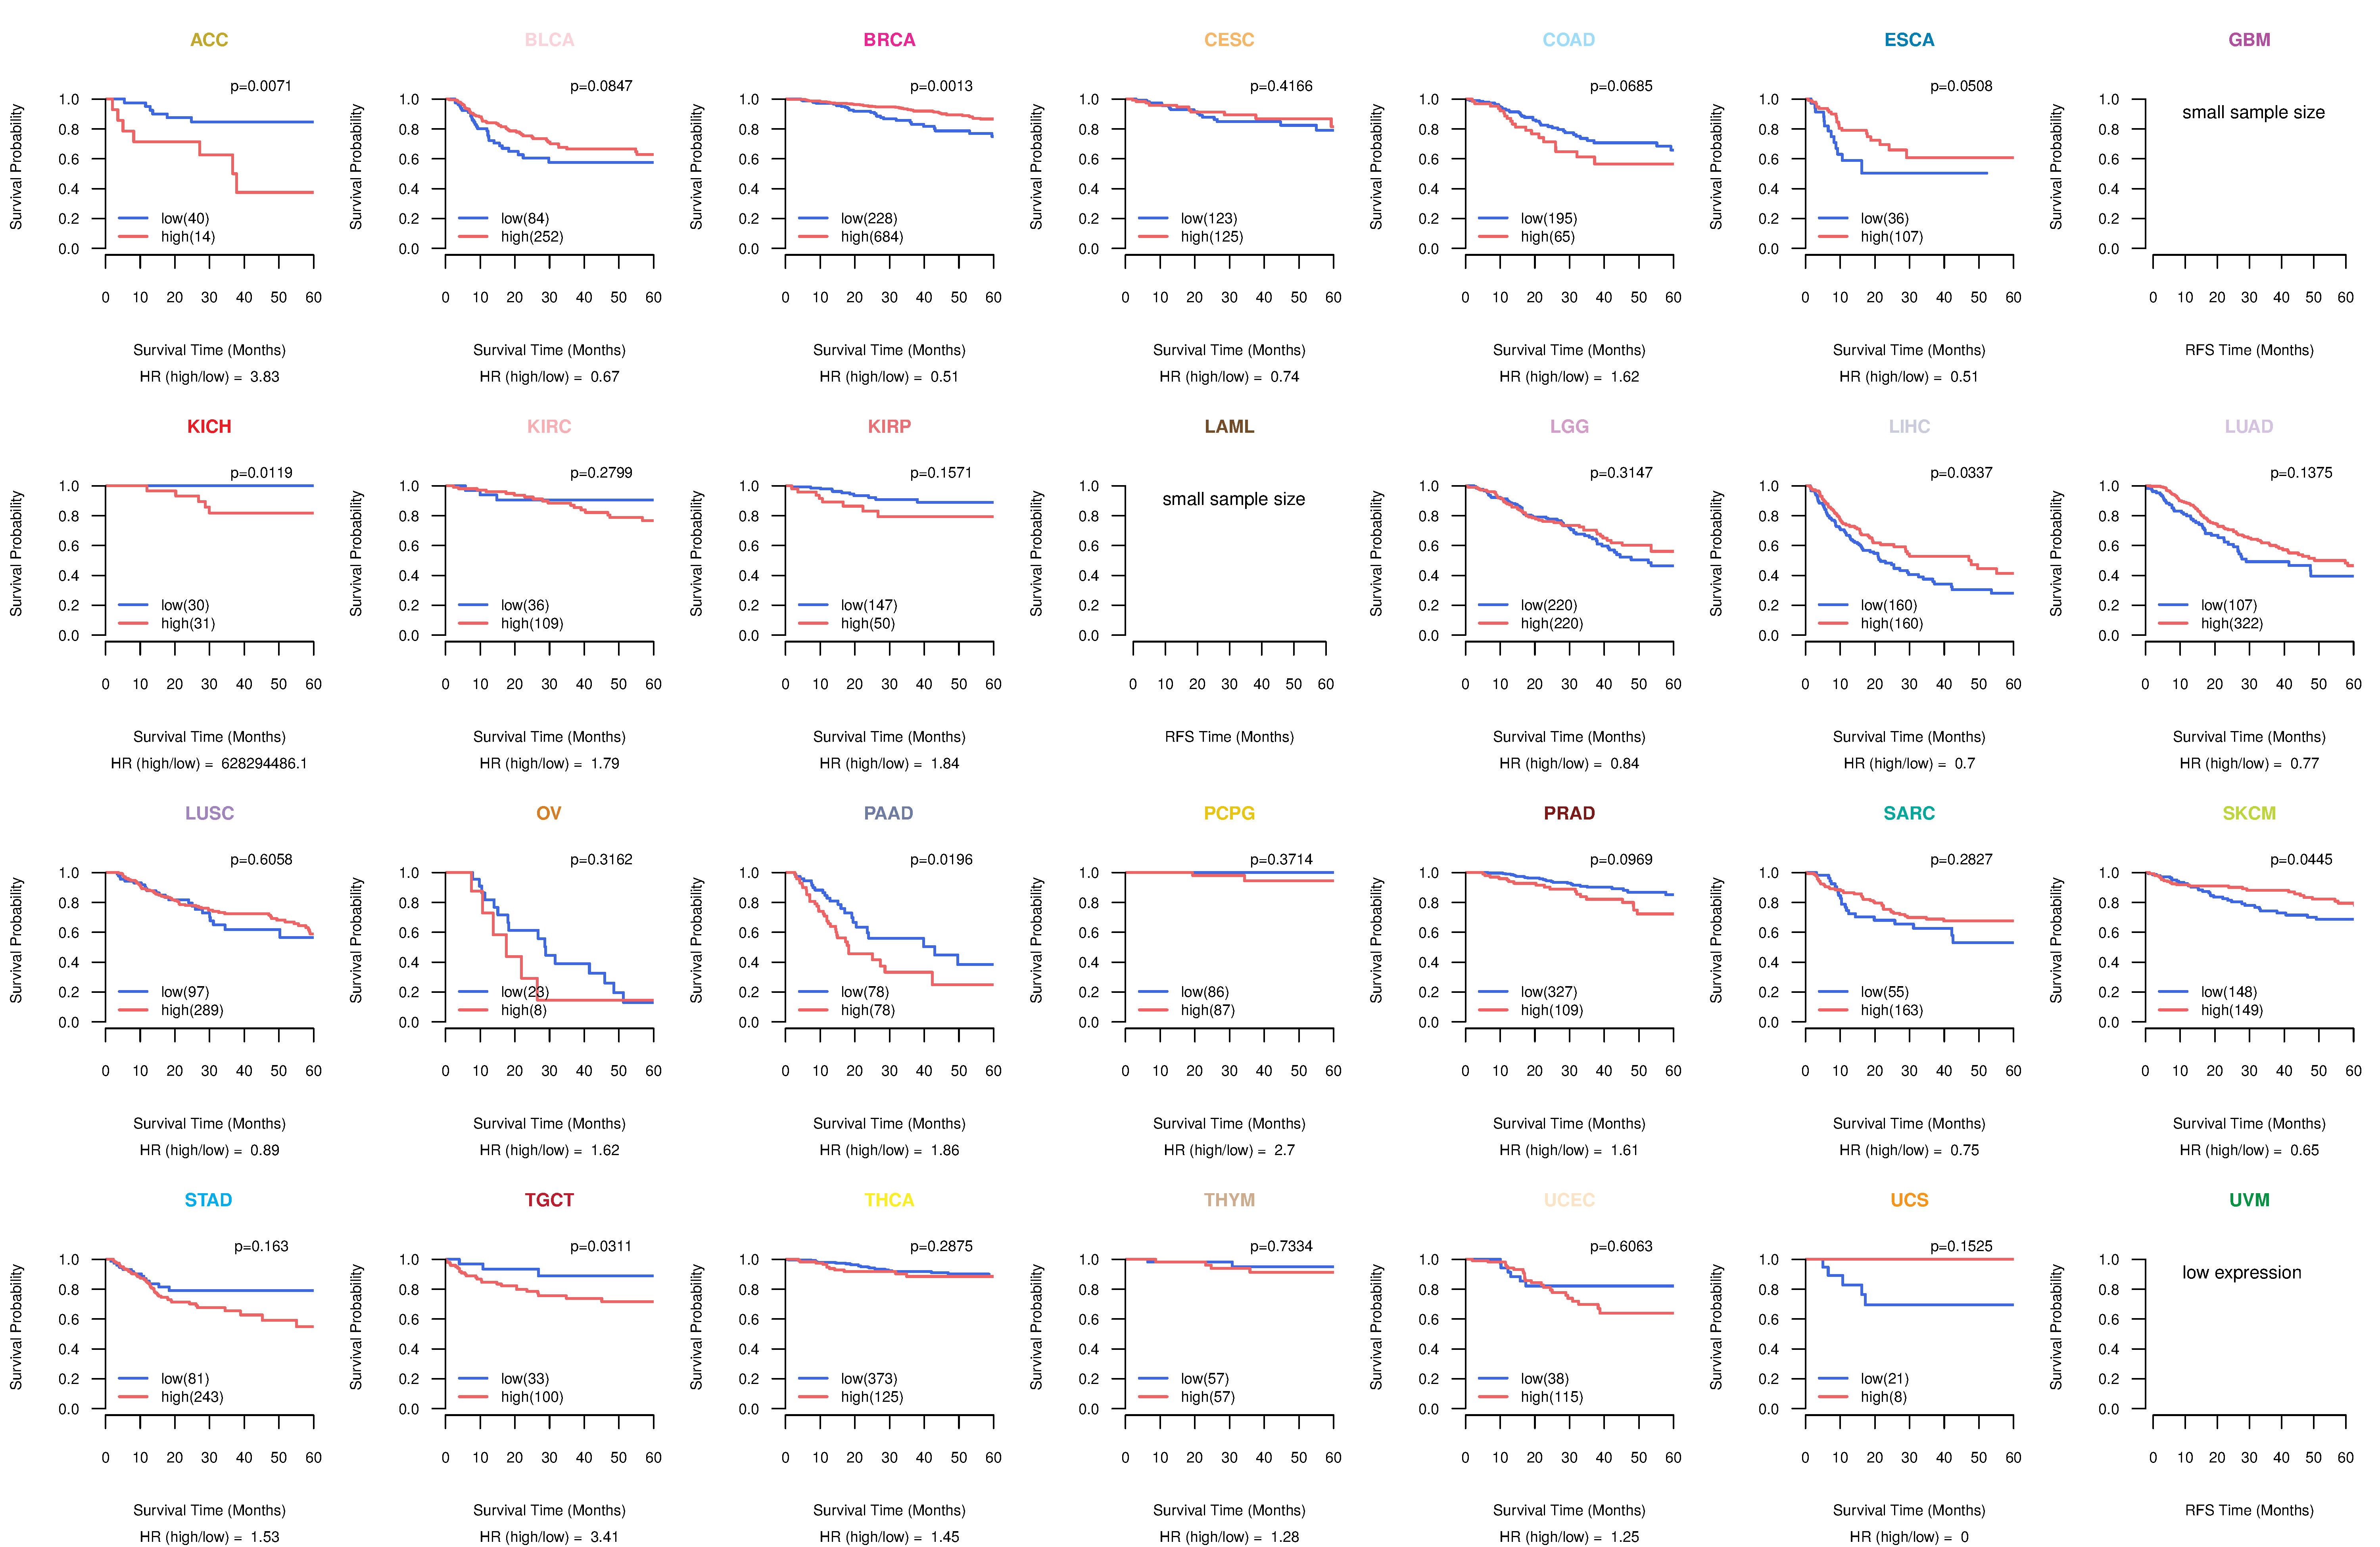
| Kaplan-Meier plots with logrank tests of overall survival (OS) using 28 cancer types (TCGA IlluminaHiSeq_RNASeqV2, pan-cancer normalized log2(norm_counts+1) data, version 2016-08-16) (TCGA clinicalMatrix, phenotype data, version 2016-04-27) * Click on the image to enlarge it in a new window. |
 |
| Kaplan-Meier plots with logrank test of relapse free survival (RFS) using 28 cancer types (TCGA IlluminaHiSeq_RNASeqV2, pan-cancer normalized log2(norm_counts+1) data, version 2016-08-16) (TCGA clinicalMatrix, phenotype data, version 2016-04-27) * Click on the image enlarge it in a new window. |
 |
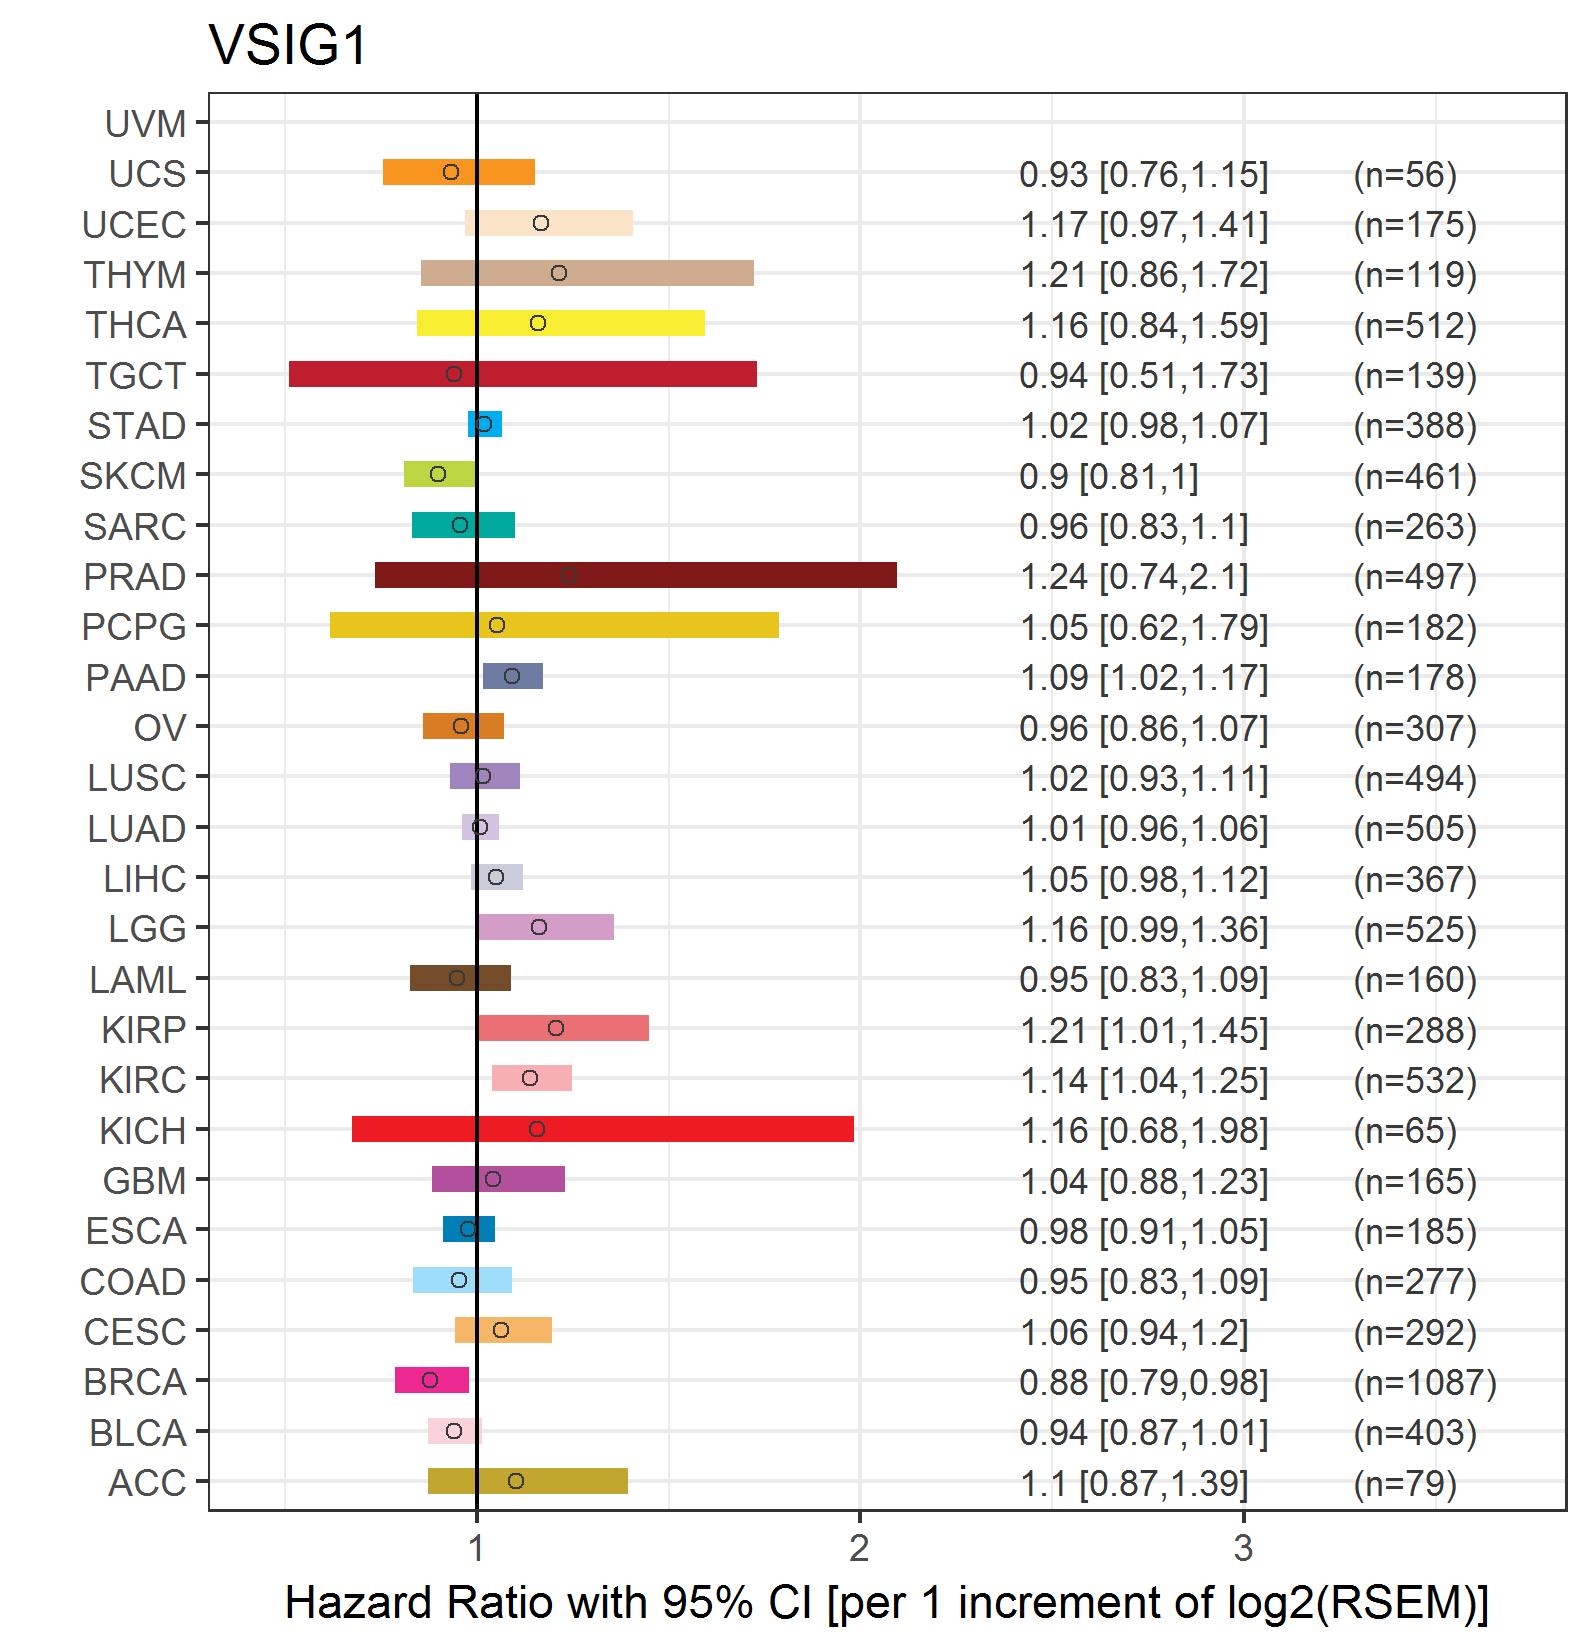
| Forest plot of Cox proportional hazard ratio (HR) and 95% CI of overall survival (OS) using 28 cancer types (TCGA IlluminaHiSeq_RNASeqV2, pan-cancer normalized log2(norm_counts+1) data, version 2016-08-16) (TCGA clinicalMatrix, phenotype data, version 2016-04-27) * Click on the image enlarge it in a new window. |
 |
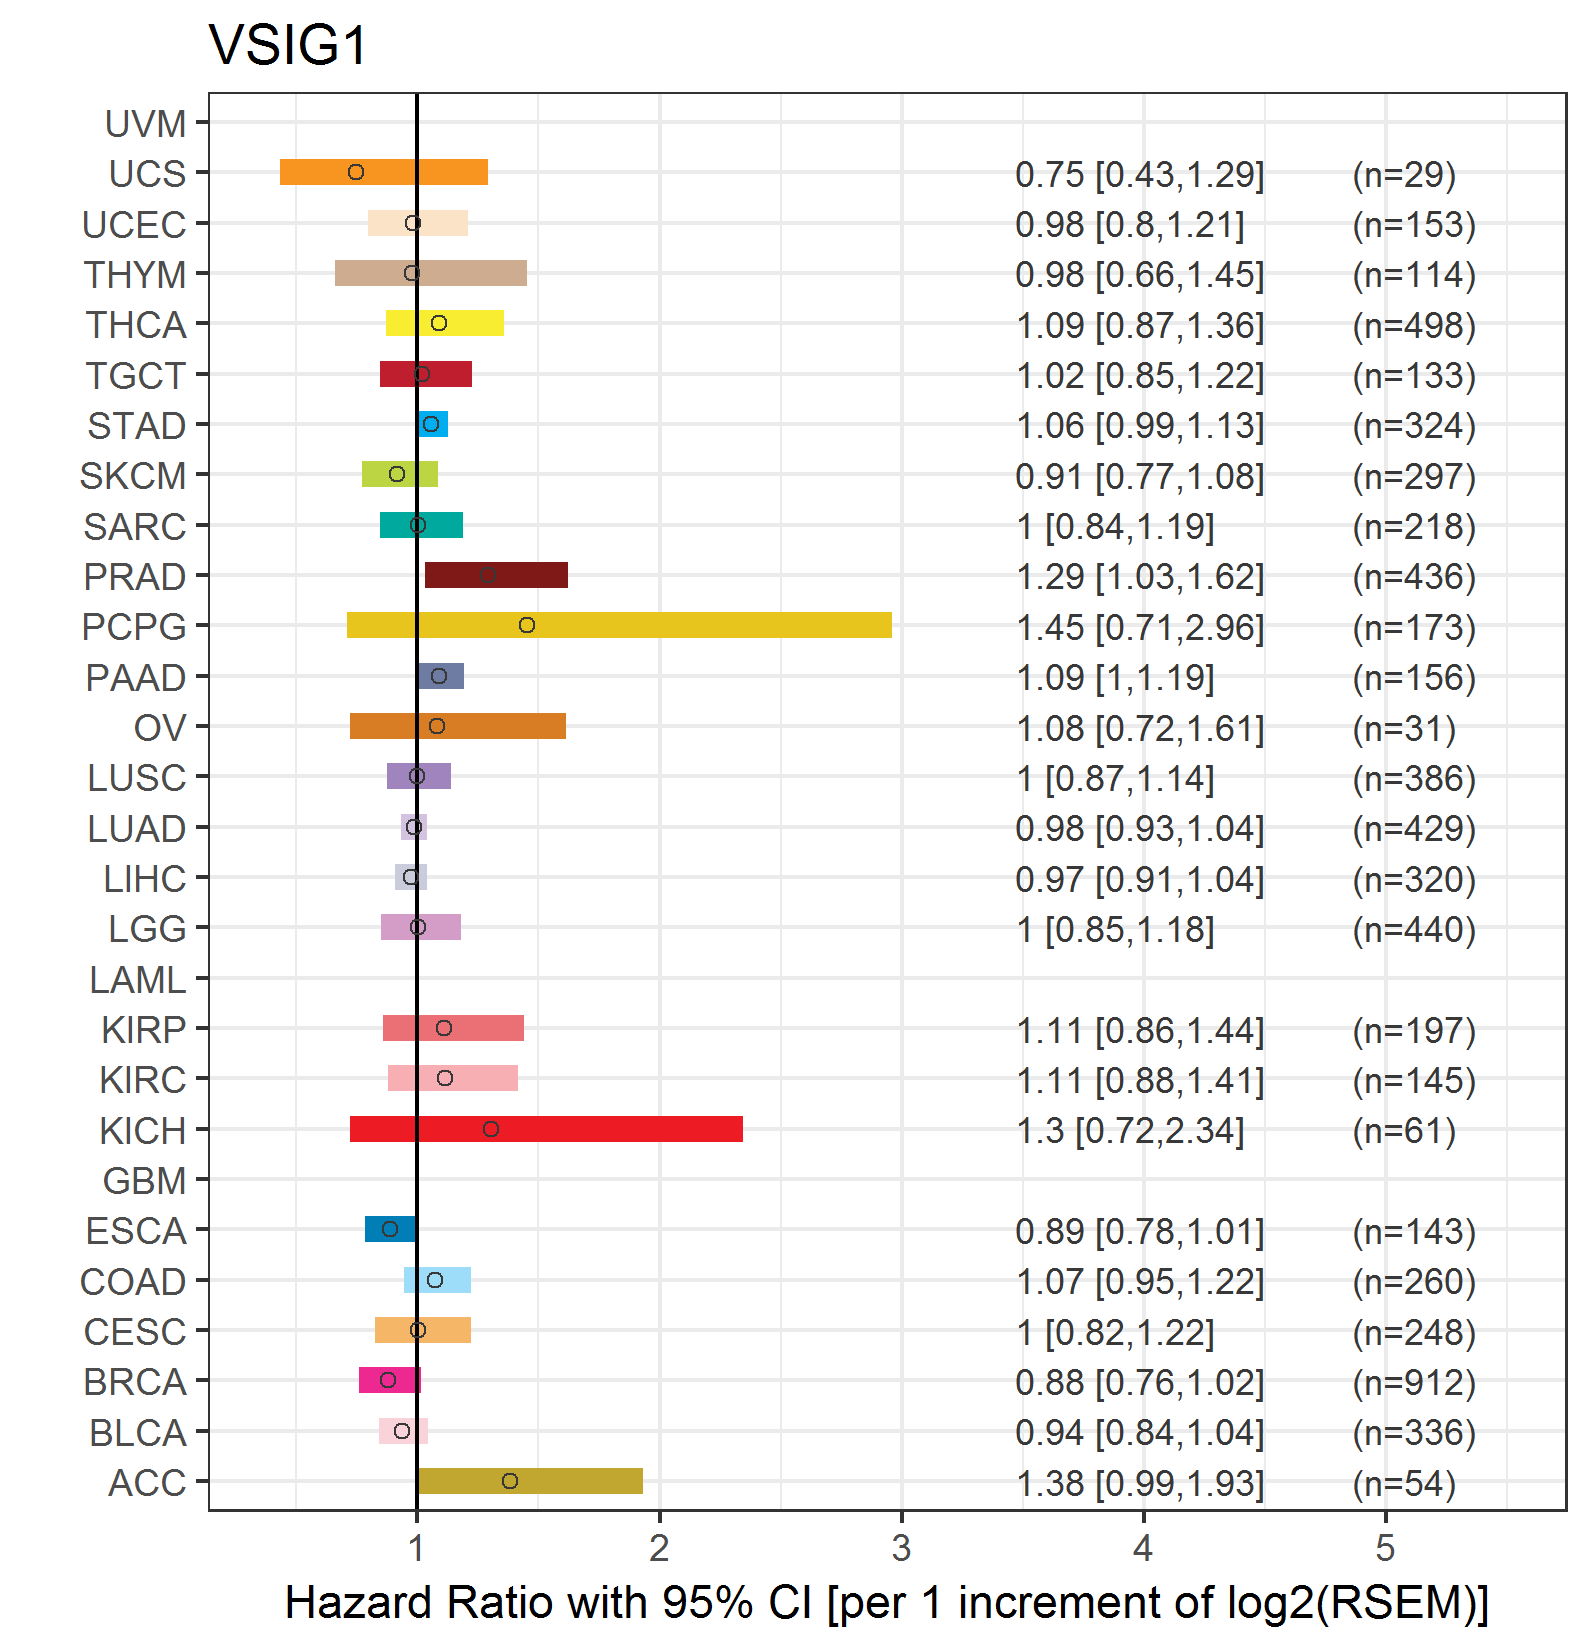
| Forest plot of Cox proportional hazard ratio (HR) and 95% CI of relapse free survival (RFS) using 28 cancer types (TCGA IlluminaHiSeq_RNASeqV2, pan-cancer normalized log2(norm_counts+1) data, version 2016-08-16) (TCGA clinicalMatrix, phenotype data, version 2016-04-27) * Click on the image enlarge it in a new window. |
 |
| Top |
| TissGeneClin for VSIG1 |
| TissGeneDrug for VSIG1 |
| Drug information targeting TissGene (DrugBank Version 5.0.6, 2017-04-01) |
| DrugBank ID | Drug name | Drug activity | Drug type | Drug status |
| Top |
| TissGeneDisease for VSIG1 |
| Disease information associated with TissGene (DisGeNet, 2016-06-01) |
| Disease ID | Disease name | # pubmeds | Source |
| umls:C0024623 | Malignant neoplasm of stomach | 1 | BeFree |
| umls:C0032584 | polyps | 1 | BeFree |
| umls:C0596263 | Carcinogenesis | 1 | BeFree |
| umls:C0699791 | Stomach Carcinoma | 1 | BeFree |
| umls:C0919267 | ovarian neoplasm | 1 | LHGDN |
|
Copyright 2016-Present - The University of Texas Health Science Center at Houston (UTHealth) Web File Viewing | How to Report, Fraud, Waste and Abuse | State of Texas | Statewide Search | Texas Homeland Security | Site Policies |